High-Resolution Regional Phase Attenuation … REGIONAL PHASE ATTENUATION MODELS OF THE IRANIAN...
12
AFRL-RV-PS- AFRL-RV-PS- TP-2012-0036 TP-2012-0036 HIGH-RESOLUTION REGIONAL PHASE ATTENUATION MODELS OF THE IRANIAN PLATEAU AND ZAGROS (POSTPRINT) Annual Report 1 Eric A. Sandvol, et al. University of Missouri 316 University Hall Columbia, MO 65211-3020 2012 Technical Paper APPROVED FOR PUBLIC RELEASE; DISTRIBUTION IS UNLIMITED. AIR FORCE RESEARCH LABORATORY Space Vehicles Directorate 3550 Aberdeen Ave SE AIR FORCE MATERIEL COMMAND KIRTLAND AIR FORCE BASE, NM 87117-5776
Transcript of High-Resolution Regional Phase Attenuation … REGIONAL PHASE ATTENUATION MODELS OF THE IRANIAN...

AFRL-RV-PS- AFRL-RV-PS- TP-2012-0036 TP-2012-0036
HIGH-RESOLUTION REGIONAL PHASE
ATTENUATION MODELS OF THE IRANIAN
PLATEAU AND ZAGROS (POSTPRINT) Annual Report 1 Eric A. Sandvol, et al.
University of Missouri 316 University Hall Columbia, MO 65211-3020 12 May 2012
Technical Paper
APPROVED FOR PUBLIC RELEASE; DISTRIBUTION IS UNLIMITED.
AIR FORCE RESEARCH LABORATORY Space Vehicles Directorate 3550 Aberdeen Ave SE AIR FORCE MATERIEL COMMAND KIRTLAND AIR FORCE BASE, NM 87117-5776

REPORT DOCUMENTATION PAGE Form Approved
OMB No. 0704-0188 Public reporting burden for this collection of information is estimated to average 1 hour per response, including the time for reviewing instructions, searching existing data sources, gathering and maintaining the data needed, and completing and reviewing this collection of information. Send comments regarding this burden estimate or any other aspect of this collection of information, including suggestions for reducing this burden to Department of Defense, Washington Headquarters Services, Directorate for Information Operations and Reports (0704-0188), 1215 Jefferson Davis Highway, Suite 1204, Arlington, VA 22202-4302. Respondents should be aware that notwithstanding any other provision of law, no person shall be subject to any penalty for failing to comply with a collection of information if it does not display a currently valid OMB control number. PLEASE DO NOT RETURN YOUR FORM TO THE ABOVE ADDRESS.
1. REPORT DATE
12 May 2012
2. REPORT TYPE
Technical Paper 3. DATES COVERED (From - To)
01 Sep 2010 to 19 Mar 2012 4. TITLE AND SUBTITLE
HIGH-RESOLUTION REGIONAL PHASE ATTENUATION MODELS OF THE
5a. CONTRACT NUMBER
FA9453-11-C-0235 IRANIAN PLATEAU AND ZAGROS (POSTPRINT) Annual Report 1
5b. GRANT NUMBER
5c. PROGRAM ELEMENT NUMBER
62601F 6. AUTHOR(S)
Eric A. Sandvol, Ayoub Kaviani1, Rengin Gok2, and George Rumpker1
5d. PROJECT NUMBER
1010
5e. TASK NUMBER
PPM00009371
5f. WORK UNIT NUMBER
EF004194 7. PERFORMING ORGANIZATION NAME(S) AND ADDRESS(ES)
AND ADDRESS(ES)
8. PERFORMING ORGANIZATION REPORT NUMBER
University of Missouri 316 University Hall Columbia, MO 65211-3020
9. SPONSORING / MONITORING AGENCY NAME(S) AND ADDRESS(ES) 10. SPONSOR/MONITOR’S ACRONYM(S)
Air Force Research Laboratory
AFRL/RVBYE Space Vehicles Directorate 3550 Aberdeen Ave SE
3550 Aberdeen Ave SE 11. SPONSOR/MONITOR’S REPORT
Kirtland AFB, NM 87117-5776 NUMBER(S)
AFRL-RV-PS-TP-2012-0036 12. DISTRIBUTION / AVAILABILITY STATEMENT
Approved for public release; distribution is unlimited. (LA-UR-11-04823).
13. SUPPLEMENTARY NOTES
Published in The Proceedings of the 2011 Monitoring Research Review – Ground-Based Nuclear Explosion Monitoring Technologies, 13 – 15 September 2011, Tucson, AZ, Volume I, pp 153-160. Government Purpose Rights. Johann Wolfgang Goethe-Universität 1, and Lawrence Livermore National Laboratory2
14. ABSTRACT
Development of high-resolution seismic attenuation models of the Iranian Plateau and the Zagros Mountains is undertaken. Previous studies have suggested a complexity in crustal and uppermost mantle seismic attenuation structure as well as regional phase propagation characteristics beneath much of the Iranian Plateau and the surrounding regions. Regional seismic phases show strong lateral variability in amplitude and frequency content due to this very complex structure. Furthermore, due to a lack of two-dimensional seismic array data, much of the three-dimensional seismic structure and propagation characteristics of the crust, lithosphere and upper mantle remain unknown. Data collected by a series of deployments which consisted of approximately 140 temporary and permanent seismic stations in the Iranian Plateau and the Zagros Mountains is being used with a comprehensive set of techniques to develop and calibrate high-resolution regional phase attenuation models of the crust and upper mantle for a major portion of Arabian-Eurasian plate boundary. Validation of these results will include calibration with selected ground-truth events and comparison with existing amplitude models. A catalog of well located events that have reliable source spectra determined using coda will be created.
15. SUBJECT TERMS
Seismic attenuation, Middle East, Source spectra
16. SECURITY CLASSIFICATION OF:
17. LIMITATION OF ABSTRACT
18. NUMBER OF PAGES
19a. NAME OF RESPONSIBLE PERSON
Robert J. Raistrick a. REPORT
Unclassified b. ABSTRACT
Unclassified c. THIS PAGE
Unclassified Unlimited
19b. TELEPHONE NUMBER (include area
code)
Standard Form 298 (Rev. 8-98) Prescribed by ANSI Std. 239.18
12
HIGH-RESOLUTION REGIONAL PHASE ATTENUATION MODELS OF THE IRANIAN PLATEAU AND ZAGROS
Eric A. Sandvol1, Ayoub Kaviani2, Rengin Gok3, and Georg Rümpker2
University of Missouri1, Johann Wolfgang Goethe-Universität 2, and Lawrence Livermore National Laboratory3
Sponsored by the Air Force Research Laboratory
Award No. FA9453-11-C-0235 Proposal No. BAA11-13
ABSTRACT Development of high-resolution seismic attenuation models of the Iranian Plateau and the Zagros Mountains are critical to monitoring efforts in the Middle East due to the lack of high-quality regional waveform data. Previous studies have suggested a complexity in crustal and uppermost mantle seismic attenuation structure as well as regional phase propagation characteristics beneath much of the Iranian Plateau and the surrounding regions. Regional seismic phases show strong lateral variability in amplitude and frequency content due to this very complex structure. Furthermore, due to a lack of two-dimensional seismic array data, much of the three-dimensional seismic structure and propagation characteristics of the crust, lithosphere and upper mantle remain unknown. We are working to remedy this using data from new broadband stations in the region, which cover most of the Iranian Plateau in a semi-regularly spaced grid. Using data collected by a series of deployments which consisted of approximately 140 temporary and permanent seismic stations in the Iranian Plateau and the Zagros Mountains using a comprehensive set of techniques, we are working to develop and calibrate high-resolution regional phase attenuation models of the crust and upper mantle for a major portion of Arabian-Eurasian plate boundary. Validation of these results will include calibration with selected ground-truth events and comparison with existing amplitude models. We will also create a catalog of well located events that have reliable source spectra determined using coda. This work will increase the number of seismic events with reliable source spectral and thereby significantly improve the ground-truth database in the Middle East and help to develop transportable discriminants in a diverse tectonic environment.
2011 Monitoring Research Review: Ground-Based Nuclear Explosion Monitoring Technologies
153 Approved for public release; distribution is unlimited.
OBJECTIVES
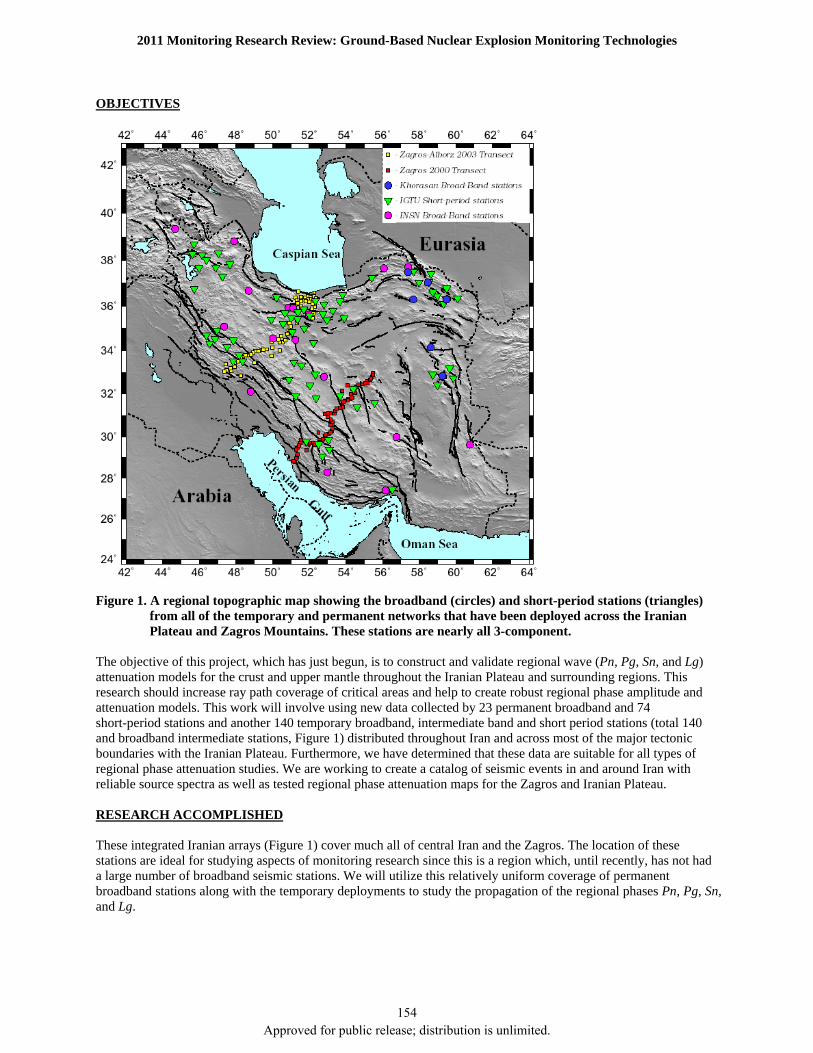
Figure 1. A regional topographic map showing the broadband (circles) and short-period stations (triangles) from all of the temporary and permanent networks that have been deployed across the Iranian Plateau and Zagros Mountains. These stations are nearly all 3-component.
The objective of this project, which has just begun, is to construct and validate regional wave (Pn, Pg, Sn, and Lg) attenuation models for the crust and upper mantle throughout the Iranian Plateau and surrounding regions. This research should increase ray path coverage of critical areas and help to create robust regional phase amplitude and attenuation models. This work will involve using new data collected by 23 permanent broadband and 74 short-period stations and another 140 temporary broadband, intermediate band and short period stations (total 140 and broadband intermediate stations, Figure 1) distributed throughout Iran and across most of the major tectonic boundaries with the Iranian Plateau. Furthermore, we have determined that these data are suitable for all types of regional phase attenuation studies. We are working to create a catalog of seismic events in and around Iran with reliable source spectra as well as tested regional phase attenuation maps for the Zagros and Iranian Plateau. RESEARCH ACCOMPLISHED These integrated Iranian arrays (Figure 1) cover much all of central Iran and the Zagros. The location of these stations are ideal for studying aspects of monitoring research since this is a region which, until recently, has not had a large number of broadband seismic stations. We will utilize this relatively uniform coverage of permanent broadband stations along with the temporary deployments to study the propagation of the regional phases Pn, Pg, Sn, and Lg.
2011 Monitoring Research Review: Ground-Based Nuclear Explosion Monitoring Technologies
154 Approved for public release; distribution is unlimited.
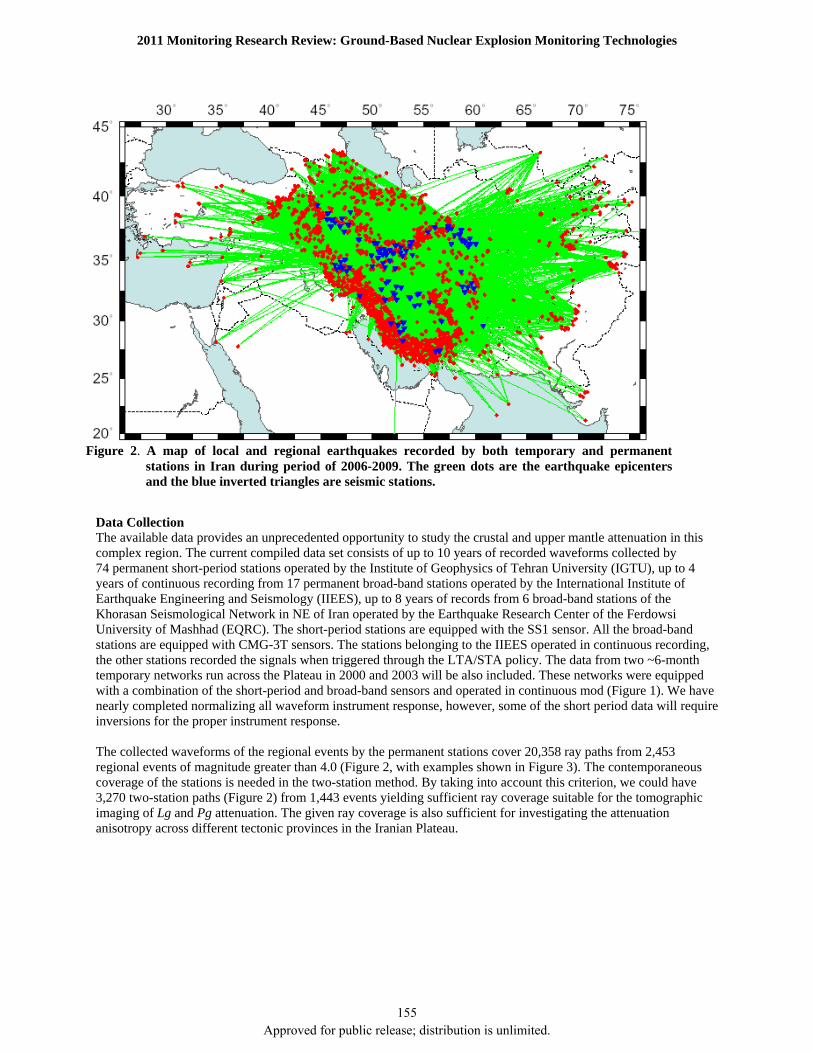
Data Collection The available data provides an unprecedented opportunity to study the crustal and upper mantle attenuation in this complex region. The current compiled data set consists of up to 10 years of recorded waveforms collected by 74 permanent short-period stations operated by the Institute of Geophysics of Tehran University (IGTU), up to 4 years of continuous recording from 17 permanent broad-band stations operated by the International Institute of Earthquake Engineering and Seismology (IIEES), up to 8 years of records from 6 broad-band stations of the Khorasan Seismological Network in NE of Iran operated by the Earthquake Research Center of the Ferdowsi University of Mashhad (EQRC). The short-period stations are equipped with the SS1 sensor. All the broad-band stations are equipped with CMG-3T sensors. The stations belonging to the IIEES operated in continuous recording, the other stations recorded the signals when triggered through the LTA/STA policy. The data from two ~6-month temporary networks run across the Plateau in 2000 and 2003 will be also included. These networks were equipped with a combination of the short-period and broad-band sensors and operated in continuous mod (Figure 1). We have nearly completed normalizing all waveform instrument response, however, some of the short period data will require inversions for the proper instrument response. The collected waveforms of the regional events by the permanent stations cover 20,358 ray paths from 2,453 regional events of magnitude greater than 4.0 (Figure 2, with examples shown in Figure 3). The contemporaneous coverage of the stations is needed in the two-station method. By taking into account this criterion, we could have 3,270 two-station paths (Figure 2) from 1,443 events yielding sufficient ray coverage suitable for the tomographic imaging of Lg and Pg attenuation. The given ray coverage is also sufficient for investigating the attenuation anisotropy across different tectonic provinces in the Iranian Plateau.
Figure 2. A map of local and regional earthquakes recorded by both temporary and permanent
stations in Iran during period of 2006-2009. The green dots are the earthquake epicentersand the blue inverted triangles are seismic stations.
2011 Monitoring Research Review: Ground-Based Nuclear Explosion Monitoring Technologies
155 Approved for public release; distribution is unlimited.
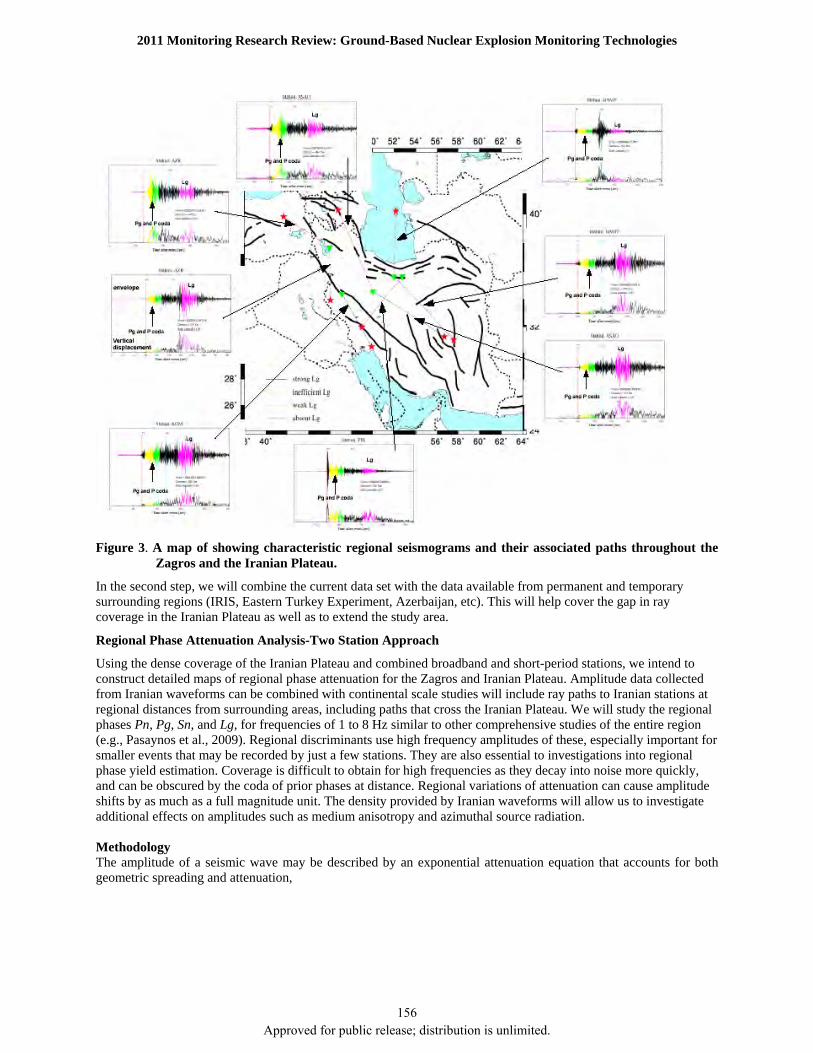
Figure 3. A map of showing characteristic regional seismograms and their associated paths throughout the Zagros and the Iranian Plateau.
In the second step, we will combine the current data set with the data available from permanent and temporary surrounding regions (IRIS, Eastern Turkey Experiment, Azerbaijan, etc). This will help cover the gap in ray coverage in the Iranian Plateau as well as to extend the study area.
Regional Phase Attenuation Analysis-Two Station Approach
Using the dense coverage of the Iranian Plateau and combined broadband and short-period stations, we intend to construct detailed maps of regional phase attenuation for the Zagros and Iranian Plateau. Amplitude data collected from Iranian waveforms can be combined with continental scale studies will include ray paths to Iranian stations at regional distances from surrounding areas, including paths that cross the Iranian Plateau. We will study the regional phases Pn, Pg, Sn, and Lg, for frequencies of 1 to 8 Hz similar to other comprehensive studies of the entire region (e.g., Pasaynos et al., 2009). Regional discriminants use high frequency amplitudes of these, especially important for smaller events that may be recorded by just a few stations. They are also essential to investigations into regional phase yield estimation. Coverage is difficult to obtain for high frequencies as they decay into noise more quickly, and can be obscured by the coda of prior phases at distance. Regional variations of attenuation can cause amplitude shifts by as much as a full magnitude unit. The density provided by Iranian waveforms will allow us to investigate additional effects on amplitudes such as medium anisotropy and azimuthal source radiation. Methodology The amplitude of a seismic wave may be described by an exponential attenuation equation that accounts for both geometric spreading and attenuation,
2011 Monitoring Research Review: Ground-Based Nuclear Explosion Monitoring Technologies
156 Approved for public release; distribution is unlimited.

)(exp)()()()()(
fvQ
fGfSfEfIfA
(1)
where A is the observed amplitude between source and receiver for a wave of frequency f recorded at distance . Here, I is the instrument response, E is the source amplitude, S is the site amplification response, v is the wave group speed, and G is the geometric spreading function that is described primarily by an exponent Attenuation (Q) Tomography Attenuation tomography uses estimates of path-averaged attenuation to delineate laterally varying Q. This includes most spectral methods (e.g., Zor et al., 2007). We have used this method to create phase blockage maps for regions of the northern Middle East (Sandvol et al., 2001). However, the lack of dense network within the Iranian Plateau have precluded us in the past from using method like Xie et al, 2006 and Zor et. al., 2007 have used for the Iranian Plateau. Our attenuation (Q) tomography relies on two-station methods for measuring inter-station Q, which cancel the source effect by using station pairs aligned with the source. These methods are relatively straightforward to apply, and are insensitive to source radiation pattern effects, but alignment requirements reduce the amount of data that can be used. We will measure attenuation with the two-station (see Xie and Mitchell, 1990; Xie, 2002; and Zor et al., 2007 for descriptions of the method, including rigorous error analysis) and reversed two station (Chun et al., 1987) methods. The reversed method eliminates site as well as source effects. Furthermore we have been able to use the reverse two-station approach to isolate the site and calculate the relative site effect. This can be seen from taking the ratio of two sets of spectral ratios:
22
21
12
11
22
12
21
11
22
21
12
11
,/2exp)()(
)()(,,
i
iRFRF
where
vQfGG
GGRR
A
AR
A
AR
(2)
where the A is the amplitude spectra and the superscripts are for stations and the subscripts are for events. is the station-event distances where once again subscripts are events and superscripts are stations. Finally, G is the geometrical spreading term which we will assume will be 1-D for each individual phase thus we will map all focusing and de-focusing into our Q maps. The site effects can be determined using a two station ratio rather than product:
2
2
1
21
12
22
11
)()()(
)()(
S
S
GG
GG
R
RR
F
,
(3)
where S() are the site amplification terms for stations 1 and 2. Thus, after correcting for geometrical spreading, we can isolate relative site terms and thereby create maps of relative site terms for the entire Iranian Plateau. We can use these relations to determine both path based Q values that are independent of the site effect as well as a relative site effect term.
2011 Monitoring Research Review: Ground-Based Nuclear Explosion Monitoring Technologies
157 Approved for public release; distribution is unlimited.
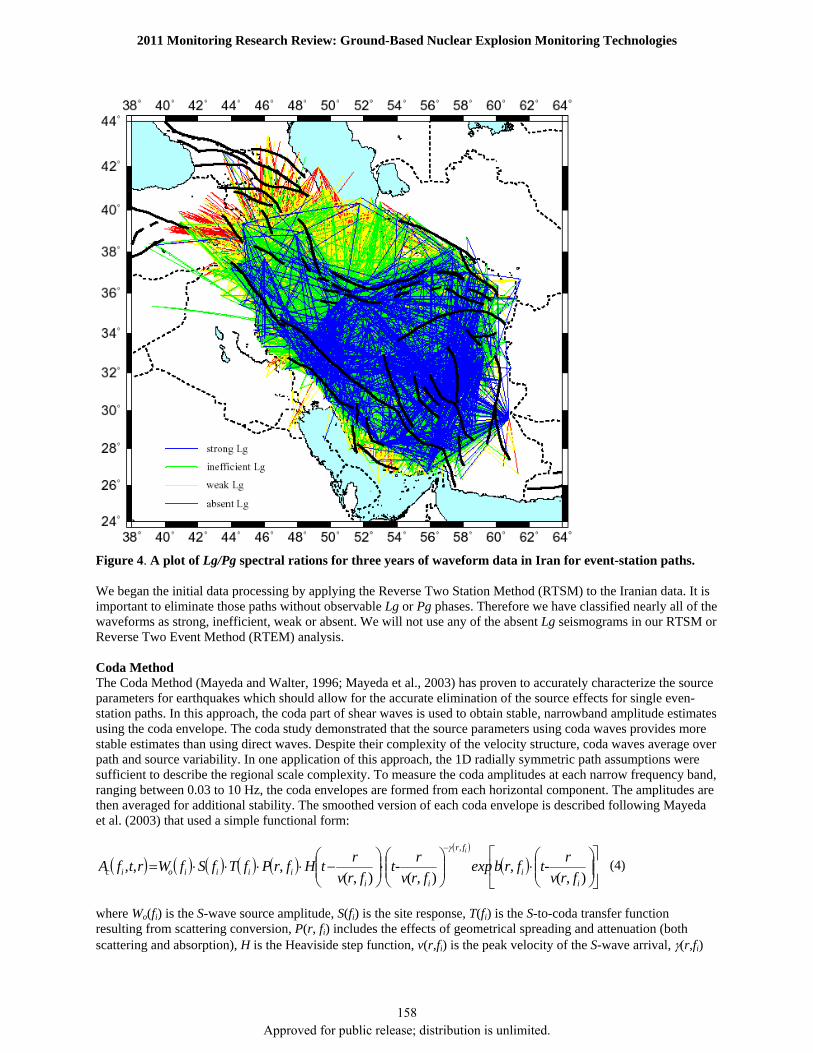
Figure 4. A plot of Lg/Pg spectral rations for three years of waveform data in Iran for event-station paths. We began the initial data processing by applying the Reverse Two Station Method (RTSM) to the Iranian data. It is important to eliminate those paths without observable Lg or Pg phases. Therefore we have classified nearly all of the waveforms as strong, inefficient, weak or absent. We will not use any of the absent Lg seismograms in our RTSM or Reverse Two Event Method (RTEM) analysis. Coda Method The Coda Method (Mayeda and Walter, 1996; Mayeda et al., 2003) has proven to accurately characterize the source parameters for earthquakes which should allow for the accurate elimination of the source effects for single even-station paths. In this approach, the coda part of shear waves is used to obtain stable, narrowband amplitude estimates using the coda envelope. The coda study demonstrated that the source parameters using coda waves provides more stable estimates than using direct waves. Despite their complexity of the velocity structure, coda waves average over path and source variability. In one application of this approach, the 1D radially symmetric path assumptions were sufficient to describe the regional scale complexity. To measure the coda amplitudes at each narrow frequency band, ranging between 0.03 to 10 Hz, the coda envelopes are formed from each horizontal component. The amplitudes are then averaged for additional stability. The smoothed version of each coda envelope is described following Mayeda et al. (2003) that used a simple functional form:
),(,
),(),(,,,
,
ii
fr
iiiiiioic frv
rt-frbexp
frv
rt-
frv
rtHfrPfTfSfWrtfA
i
(4)
where Wo(fi) is the S-wave source amplitude, S(fi) is the site response, T(fi) is the S-to-coda transfer function resulting from scattering conversion, P(r, fi) includes the effects of geometrical spreading and attenuation (both scattering and absorption), H is the Heaviside step function, v(r,fi) is the peak velocity of the S-wave arrival, (r,fi)
2011 Monitoring Research Review: Ground-Based Nuclear Explosion Monitoring Technologies
158 Approved for public release; distribution is unlimited.

and b(r,fi) control the coda envelope shape, and t is the time in seconds from the origin time. An example of this analysis from the waveforms taken from the Iranian waveform database is shown in Figure 5.
Figure 5. Example of Coda analysis for data from waveform the Iranian database. We are utilizing Lawrence Livermore National Laboratory’s (LLNL’s) 2-D path correction for coda analysis. Currently, LLNL is developing a 2-D path correction for coda for the larger Middle East. We will then be using site terms to find coda to site transfer at each station to obtain moment rate (source spectra). Those source spectra will then be used to correct the source effect at each waveform. Figure 5 shows an example of two coda envelopes at 2.0_3.0 Hz recorded at two distinct paths. One is crossing through Zagros and the other is across the Iranian Plateau. Note the difference between the coda envelope shapes. This will need further investigation of 2-D analysis of the coda shape function and 2-D path effect. We’ll try to resolve this issue at high frequencies where the smaller event coda calibration is very critical to estimate. We will also be using spectral ratio technique (empirical Green’s functions) of coda envelopes for the aftershock sequences in the region (Mayeda et al., 2007). This method takes advantage of co-located events at which would have the same path and site effect at the station. The amplitude ratio at each station in the end will reflect different source models and these models would be used to calibrate coda source. Coda method has advantageous compared to direct wave in spectral ratios such that direct waves are limited to the same focal mechanism, directivity etc. Whereas coda averages those effects allowing much more number of pairs to be used to fit the source model (Mayeda et al., 2007).
2011 Monitoring Research Review: Ground-Based Nuclear Explosion Monitoring Technologies
159 Approved for public release; distribution is unlimited.
CONCLUSIONS AND RECOMMENDATIONS In order to develop transportable seismic source discriminants it is very important that we develop method to account for source and site effect. The problem in the past has been that different methods have yielded different results and only relatively recently have we begun to see some convergence between methods (e.g., Ford et al., 2008). In order to overcome this problem in the Iranian Plateau and the surrounding regions we will employ two of the most promising methods and compare our attenuation models to determine how robust and reliable each of the methods are in the diverse tectonic terrane that is the Iranian Plateau. Furthermore, this will allow us to create a robust model that can be use to predict seismic amplitudes and thereby contribute important model base information to DOE’s MDAC amplitude corrections ACKNOWLEDGEMENTS We are grateful to all the Iranian and international scientists and engineers who helped to deploy and service both the permanent and temporary seismic networks across Iran. REFERENCES Chun, K.-Y., G. F. West, R. J. Kokoski, and C. Samson (1987). A novel technique for measuring Lg attenuation;
results from Eastern Canada between 1 to 10 Hz, Bull. Seismol. Soc. Am., 77, (2): 398–419.
Ford. S. R., D. S. Dreger, K. Mayeda, W. R. Walter, L. Malagnini, and W. S. Phillips (2008). Regional attenuation in Northern California: a comparison of five 1D Q methods, Bull. Seismol. Soc. Am., 98: 2033–2046.
Mayeda, K., L. Malagnini, and W. R. Walter (2007). A new spectral ratio method using narrow band coda envelopes: Evidence for non-self-similarity in the Hector Mine sequence, Geophys. Res. Lett., 34 (11), art. no. L11303
Mayeda, K., A. Hofstetter, J. L. O'Boyle, and W. R. Walter (2003). Stable and transportable regional magnitudes based on coda-derived moment-rate spectra, Bull. Seismol. Soc. Am, 93 (1): 224–239.
Mayeda, K., and W. R. Walter (1996). Moment, energy, stress drop, and source spectra of western United States earthquakes from regional coda envelopes J. Geophys. Res., 101 (5): 11195–11208.
Pasyanos, M. E., W. Walter, and E. Matzel, (2009). A simultaneous multiphase approach to determine P-wave and S-wave attenuation of the crust and upper mantle, Bull. Seismol. Soc. Am., 99: (6): 3314–3325.
Pasyanos, M. E. and W.R. Walter (2002). Crust and upper mantle Structure of North Africa, Europe, and the Middle East from inversion of surface waves, Geophys. J. Int., 149: 462–480.
Sandvol, E., K. Al-Damegh, A. Calvert, D. Seber, M. Barazangi, Mohamad, R, R. Gök, N. Turkelli, and C. Gurbuz (2001). Tomographic imaging of Lg and Sn propagation in the Middle East, Pure Appl. Geophys., 158: 1121–1163.
Xie, J., and B. J. Mitchell (1990). A back-projection method for imaging large-scale lateral variations of Lg coda Q with application to continental Africa, Geophys. J. Int. 100, 161–181.
Xie, J. (1998). Spectral inversion of Lg from earthquakes; a modified method with applications to the 1995, western Texas earthquake sequence, Bull. Seismol. Soc. Am, 88, (6): 1525–1537.
Xie, J. (2002). Source scaling of Pn, Lg spectra and their ratios from explosions in central Asia: Implications on identification of small seismic events at regional distances, J. Geophys. Res., (B7), 10.1029/2001JB000509.
Zor, E., E. Sandvol, J. Xie, N. Türkelli, B. Mitchell, A. Gasanov, and G. Yetirmishli. (2006). Crustal attenuation within the Turkish Plateau and surrounding regions, Bull. Seismol. Soc. Am., in review.
2011 Monitoring Research Review: Ground-Based Nuclear Explosion Monitoring Technologies
160 Approved for public release; distribution is unlimited.
DISTRIBUTION LIST
DTIC/OCP 8725 John J. Kingman Rd, Suite 0944 Ft Belvoir, VA 22060-6218 1 cy AFRL/RVIL Kirtland AFB, NM 87117-5776 2 cys Official Record Copy AFRL/RVBYE/Robert Raistrick 1 cy
Approved for public release; distribution is unlimited.

This page intentionally left blank.
Approved for public release; distribution is unlimited.