High-Resolution Line Scan Diffusion Tensor MR Imaging · PDF fileHigh-Resolution Line Scan...
9
High-Resolution Line Scan Diffusion Tensor MR Imaging of White Matter Fiber Tract Anatomy Hatsuho Mamata, Yoshiaki Mamata, Carl-Fredrik Westin, Martha E. Shenton, Ron Kikinis, Ferenc A. Jolesz, and Stephan E. Maier BACKGROUND AND PURPOSE: MR diffusion tensor imaging permits detailed visualization of white matter fiber tracts. This technique, unlike T2-weighted imaging, also provides infor- mation about fiber direction. We present findings of normal white matter fiber tract anatomy at high resolution obtained by using line scan diffusion tensor imaging. METHODS: Diffusion tensor images in axial, coronal, and sagittal sections covering the entire brain volume were obtained with line scan diffusion imaging in six healthy volunteers. Images were acquired for b factors 5 and 1000 s/mm 2 at an imaging resolution of 1.7 1.7 4 mm. For selected regions, images were obtained at a reduced field of view with a spatial resolution of 0.9 0.9 3 mm. For each pixel, the direction of maximum diffusivity was computed and used to display the course of white matter fibers. RESULTS: Fiber directions derived from diffusion tensor imaging were consistent with known white matter fiber anatomy. The principal fiber tracts were well observed in all cases. The tracts that were visualized included the following: the arcuate fasciculus; superior and inferior longitudinal fasciculus; uncinate fasciculus; cingulum; external and extreme capsule; internal capsule; corona radiata; auditory and optic radiation; anterior commissure; corpus callosum; pyramidal tract; gracile and cuneatus fasciculus; medial longitudinal fasciculus; rubrospinal, tectospinal, central tegmental, and dorsal trigeminothalamic tract; superior, inferior, and middle cerebellar peduncle; pallidonigral and strionigral fibers; and root fibers of the oculomotor and trigeminal nerve. CONCLUSION: We obtained a complete set of detailed white matter fiber anatomy maps of the normal brain by means of line scan diffusion tensor imaging at high resolution. Near large bone structures, line scan produces images with minimal susceptibility artifacts. Before the advent of advanced MR imaging tech- niques, the investigation of white matter anatomy had been limited to the evaluation of gross brain sections with myelin-specific stains or to the dissection of fi- bers of formalin-fixed brains. Conventional T2- weighted MR imaging offers excellent contrast be- tween white and gray matter, without, however, providing any information about fiber direction. A rat brain atlas has been acquired with 2D thin-section MR imaging (1) and a mouse lemur atlas with 3D microscopic MR imaging (2). Fluid-attenuated inver- sion recovery T2-weighted imaging has been intro- duced to attain improved visualization of the white matter tracts within the brain stem (3). Magnetization transfer MR imaging is another technique that has been applied to white matter imaging (4 – 6); how- ever, with any of the MR techniques mentioned above, the direction of the fibers in white matter tracts cannot be shown, and therefore, they cannot provide complete anatomic information about white matter fiber tracts. MR diffusion imaging reveals the diffusion of water molecules. The direction of highest diffusivity coin- cides with the white matter tissue’s fiber tract axis (7, 8). Variation of the diffusion along different spatial directions provides information about diffusion an- Received April 17, 2001; accepted after revision August 15. From the Department of Radiology, Brigham and Women’s Hospital (H.M., Y.M., C.-F.W., M.E.S., R.K., F.A.J., S.E.M.), the Clinical Neuroscience Division (M.E.S.), Laboratory of Neuro- science, VAMC-Brockton, Department of Psychiatry, Harvard Medical School, Boston, MA; and the Department of Radiology (H.M.), Tokai University School of Medicine, Bohseidai, Isehara, Kanagawa, Japan. Supported by the Whitaker Foundation, the National Institutes of Health (NIH 1 R01 NS39335– 01A1, NIH 5 P41 RR13218 – 01, NIMH R01 50747, and NIMH K02 01110), and the Veterans Administration Merit Award. Presented at the Radiological Society of North America Meet- ing, 2000, and presented in part at the 8th Scientific Meeting and Exhibition of the International Society for Magnetic Resonance in Medicine, 2000, Denver, CO. Address reprint requests to Hatsuho Mamata, Department of Radiology, Brigham and Women’s Hospital, 75 Francis Street, Boston, MA 02115. © American Society of Neuroradiology AJNR Am J Neuroradiol 23:67–75, January 2002 67
Transcript of High-Resolution Line Scan Diffusion Tensor MR Imaging · PDF fileHigh-Resolution Line Scan...
High-Resolution Line Scan Diffusion Tensor MRImaging of White Matter Fiber Tract Anatomy
Hatsuho Mamata, Yoshiaki Mamata, Carl-Fredrik Westin, Martha E. Shenton, Ron Kikinis,Ferenc A. Jolesz, and Stephan E. Maier
BACKGROUND AND PURPOSE: MR diffusion tensor imaging permits detailed visualizationof white matter fiber tracts. This technique, unlike T2-weighted imaging, also provides infor-mation about fiber direction. We present findings of normal white matter fiber tract anatomyat high resolution obtained by using line scan diffusion tensor imaging.
METHODS: Diffusion tensor images in axial, coronal, and sagittal sections covering theentire brain volume were obtained with line scan diffusion imaging in six healthy volunteers.Images were acquired for b factors 5 and 1000 s/mm2 at an imaging resolution of 1.7 � 1.7 �4 mm. For selected regions, images were obtained at a reduced field of view with a spatialresolution of 0.9 � 0.9 � 3 mm. For each pixel, the direction of maximum diffusivity wascomputed and used to display the course of white matter fibers.
RESULTS: Fiber directions derived from diffusion tensor imaging were consistent withknown white matter fiber anatomy. The principal fiber tracts were well observed in all cases.The tracts that were visualized included the following: the arcuate fasciculus; superior andinferior longitudinal fasciculus; uncinate fasciculus; cingulum; external and extreme capsule;internal capsule; corona radiata; auditory and optic radiation; anterior commissure; corpuscallosum; pyramidal tract; gracile and cuneatus fasciculus; medial longitudinal fasciculus;rubrospinal, tectospinal, central tegmental, and dorsal trigeminothalamic tract; superior,inferior, and middle cerebellar peduncle; pallidonigral and strionigral fibers; and root fibers ofthe oculomotor and trigeminal nerve.
CONCLUSION: We obtained a complete set of detailed white matter fiber anatomy maps ofthe normal brain by means of line scan diffusion tensor imaging at high resolution. Near largebone structures, line scan produces images with minimal susceptibility artifacts.
Before the advent of advanced MR imaging tech-niques, the investigation of white matter anatomy hadbeen limited to the evaluation of gross brain sectionswith myelin-specific stains or to the dissection of fi-
bers of formalin-fixed brains. Conventional T2-weighted MR imaging offers excellent contrast be-tween white and gray matter, without, however,providing any information about fiber direction. A ratbrain atlas has been acquired with 2D thin-sectionMR imaging (1) and a mouse lemur atlas with 3Dmicroscopic MR imaging (2). Fluid-attenuated inver-sion recovery T2-weighted imaging has been intro-duced to attain improved visualization of the whitematter tracts within the brain stem (3). Magnetizationtransfer MR imaging is another technique that hasbeen applied to white matter imaging (4–6); how-ever, with any of the MR techniques mentionedabove, the direction of the fibers in white mattertracts cannot be shown, and therefore, they cannotprovide complete anatomic information about whitematter fiber tracts.
MR diffusion imaging reveals the diffusion of watermolecules. The direction of highest diffusivity coin-cides with the white matter tissue’s fiber tract axis (7,8). Variation of the diffusion along different spatialdirections provides information about diffusion an-
Received April 17, 2001; accepted after revision August 15.From the Department of Radiology, Brigham and Women’s
Hospital (H.M., Y.M., C.-F.W., M.E.S., R.K., F.A.J., S.E.M.), theClinical Neuroscience Division (M.E.S.), Laboratory of Neuro-science, VAMC-Brockton, Department of Psychiatry, HarvardMedical School, Boston, MA; and the Department of Radiology(H.M.), Tokai University School of Medicine, Bohseidai, Isehara,Kanagawa, Japan.
Supported by the Whitaker Foundation, the National Institutesof Health (NIH 1 R01 NS39335–01A1, NIH 5 P41 RR13218–01,NIMH R01 50747, and NIMH K02 01110), and the VeteransAdministration Merit Award.
Presented at the Radiological Society of North America Meet-ing, 2000, and presented in part at the 8th Scientific Meeting andExhibition of the International Society for Magnetic Resonance inMedicine, 2000, Denver, CO.
Address reprint requests to Hatsuho Mamata, Department ofRadiology, Brigham and Women’s Hospital, 75 Francis Street,Boston, MA 02115.
© American Society of Neuroradiology
AJNR Am J Neuroradiol 23:67–75, January 2002
67

isotropy and ultimately about tissue structure (9, 10).The principal diffusion direction and diffusion anisot-ropy can be assessed with diffusion tensor imaging.
The purpose of the present study was to obtaindetailed white matter fiber tract anatomy of the wholebrain with a diffusion tensor imaging technique thatyields minimal distortion artifacts near large bonestructures and air cavities as well as unprecedentedhigh spatial resolution. To attain this goal, we usedline scan diffusion imaging (11) in conjunction withhigh-performance magnetic field gradients.
Methods
Participants and Imaging ProtocolSix healthy volunteers (four men and two women; age range,
35–45 years) were entered into the study. No participant had aneurologic disorder or any abnormality revealed by T1- orT2-weighted imaging of the brain. All studies were conductedwithin the guidelines of the research committee at our institu-tion. Written informed consent was obtained from all partici-pants.
The protocol included T1-weighted imaging for localizationand line scan diffusion tensor imaging of the entire brain inaxial, sagittal, and/or coronal sections. Thin-section, high-res-olution line scan diffusion tensor images of the brain stem werealso obtained in axial, sagittal, and/or coronal orientations.Line scan diffusion imaging uses multiple diffusion-weightedspin-echo column excitations to form a 2D image. The basicsequence is composed of a selective �/2 pulse and a selective �pulse with diffusion gradients on both sides of the refocusing �pulse, followed by a standard frequency-encoding readoutalong the selected column. The sequential collection of theseline data in independent acquisitions makes the sequencelargely insensitive to bulk motion artifacts. Spatial interleavingof the column excitation allows for uniform sampling withoverlapping column cross sections and minimal T1 weighting.Multiple sections can be obtained in sequential images and theimaging time, therefore, is proportional to the number of sec-tions acquired. Because no phase encoding is applied, chemicalshift and susceptibility artifacts are present only in the frequen-cy-encoding direction and, like chemical shift and susceptibilityartifacts in conventional spin-echo imaging, are determined bythe applied bandwidth.
All studies were performed on a 1.5-T whole-body MRsystem (LX Echospeed Cvi; General Electric Medical System,Milwaukee, WI) with version 8.2.5 software. The imager isequipped with magnetic field gradients that permit up to 40mT/m amplitude. A quadrature birdcage head coil was used forall images, with the exception of images obtained with a surfacecoil to show subcortical U-fibers.
T1-weighted imaging for localization was performed with astandard spin-echo sequence: 750/14/1 (TR/TE/NEX); field ofview, 220 mm; section thickness, 5 mm; section gap, 1 mm;matrix size, 256 � 256; bandwidth, �15.6 kHz. Axial andcoronal sections for diffusion tensor imaging were plannedorthogonal to a midline sagittal T1-weighted image. The axialsections were slightly oblique, parallel to the anterior-posteriorcommissure line, and the coronal sections were angulated,perpendicular to the anterior-posterior commissure line. Theorientation of sagittal sections was planned on axial localizingimages. Depending on participant and section orientation, 24to 34 sections were sufficient to cover the entire brain.
Line scan diffusion images were obtained with the followingparameters: 2560/80/66/1 (effective TR relevant for T1 weight-ing [11]/TR/TE/NEX); rectangular field of view, 220 � 165mm; effective section thickness, 4 mm [11]; section gap, 1 mm;
matrix size, 128 � 96 (frequency � column); bandwidth, �3.91kHz. To measure the apparent diffusion coefficient, imageswere scanned at two different diffusion weightings (b factors, 5and 1000 s/mm2; gradient pulse duration �, 21.2 ms; separation� between first and second gradient pulse, 33 ms; gradientamplitude, 40 mT/m (ie, two gradient main directions appliedsimultaneously at 70% of the maximal attainable amplitude).Diffusion weighting for the high b factor was appliedalong six non-collinear directions (8, 9) (relative amplitudes,[Gx,Gy,Gz] � [1,1,0], [0,1,1], [1,0,1], [0,1,�1], [1,�1,0],[�1,0,1]), whereas for the low b factor, diffusion weighting wasapplied along two directions only. Collection of image data forall gradient configurations at low diffusion weighting is notnecessary, because the directionally dependent, diffusion-re-lated signal attenuation is minimal. A minimal diffusion encod-ing of 5 s/mm2 is required, because with the present sequenceimplementation, the diffusion-encoding gradients also act asspin-echo crusher gradients. Two diffusion-weighted imagesinstead of only one are acquired for various reasons, such asreduction of average gradient load and optimal cancellation ofsecondary echoes. The imaging time was 61 s per section (ie,the time required for complete coverage of the brain along oneorientation was between 25 and 35 min). Shorter TEs, TRs,and imaging times would have been possible had gradientheating not been a concern. Images of the brain stem andsubcortical U-fibers were obtained with the same diffusiongradient configuration at a reduced section thickness of 3mm and a section gap of 0 mm. Other imaging parameterswere as follows: 2178/99/76; rectangular field of view, 220 �55 mm; matrix size, 256 � 64 (frequency � column); band-width, �3.91 kHz. For optimal signal-to-noise ratio, fouraverages were acquired for head coil scans and one averageonly for surface coil scans.
PostprocessingThe term “tensor” originates from the physics and engineer-
ing field, where it was introduced to describe tension forces insolid bodies with an array of 3D vectors. The particular tensorsused to describe diffusion can be further conceptualized andvisualized as ellipsoids. The longest of the three orthogonalmain axes of the diffusion ellipsoid represents the value (eig-envalue) and direction (eigenvector) of maximum diffusion,whereas the shortest axis denotes the value and direction ofminimum diffusion. If the length of the three axes is equal, thenthe diffusion is said to be isotropic and the diffusion tensor canbe visualized as a sphere. For example, in the case of CSF orgray matter, the diffusion tensor is best characterized by spher-ical, or isotropic, diffusion. If the length of the three axesdiffers, the diffusion is said to be anisotropic. The diffusiontensor data were processed off-line. For each section, a T2-weighted map (average of the two images obtained at lowdiffusion weighting), a trace diffusion-weighted map, a traceapparent diffusion coefficient map, and a relative anisotropymap were calculated. In addition, maps of the principal effec-tive diffusivities (eigenvalues �1, �2, and �3) as well as theeigenvector components x, y, and z of the largest eigenvalue �1were computed. Dedicated software was used to visualize fiberdirections with the eigenvector of the largest eigenvalue super-posed on an anatomic background image (12). To highlightgray and white matter areas, T2-weighted images were used asbackground maps. The eigenvector of the largest eigenvalue(first eigenvector) is thought to represent the fiber direction (7,13). For each pixel, a line representing the in-plane componentof the measured fiber direction is drawn. The length of the lineis proportional to the relative anisotropy. Dots on color im-ages represent pixels where the through-plane component(vertical to the plane) of the scaled first eigenvector reachesa predefined threshold. Masks, based on signal thresholds inimages with high diffusion weighting, were used to limit therepresentation of the eigenvectors to areas with brain tissue.
68 MAMATA AJNR: 23, January 2002

For some images, masks were defined manually to excludeareas with fatty tissue in the skull and skin.
Characterization of White Matter Fiber AnatomyThe eigenvector maps were compared with histologic cross
sections found in anatomy books (14, 15). The search for whitematter tracts on these eigenvector maps was focused on asso-ciation fibers (cingulum, arcuate fasciculus, superior and infe-rior longitudinal fasciculus, uncinate fasciculus, pallidonigraland strionigral fibers, U-fibers), projection fibers (corona ra-diata, internal capsule, auditory and optic radiation), and com-missural fibers (corpus callosum and anterior commissure). Thefollowing structures were also studied: root fibers of the ocu-lomotor nerve; optic tract; pyramidal (corticospinal) tract inthe cerebral peduncle; decussation of the superior cerebellarpeduncle; rubrospinal tract; medial longitudinal fasciculus;tectospinal tract; central tegmental tract; dorsal trigeminotha-lamic tract; spinothalamic tract; pyramidal tract in the pons andfrontopontine tract; superior, inferior, and middle cerebellar
peduncle; root fibers of trigeminal nerve; pyramidal decussa-tion; sensory decussation; and pontocerebellar fibers.
ResultsThe description of the findings follows the tradi-
tional anatomic separation into association fibers,projection fibers, commissural fibers, and fibers ofbrain stem and cerebellum. The images originatefrom different participants; however, the tracts de-scribed were observed in all cases.
Association FibersThe best gross view of the association fibers is
shown on sagittal images (Figs 1 and 2). The course ofthese fibers, however, cannot be followed in a singlesection. When viewed in multiple sections, the ap-
FIG 1. When viewed in multiple sections,the appearance of the association fibers onthe principal eigenvector maps is consistentwith known anatomy.
A, Sagittal 110 � 110-mm subimageclose to the midline, passing through thecingulum (pink). Note that the fibers of thecorpus callosum run at a slight anglethrough the plane (blue dots with shortlines).
B, More lateral sagittal section obtainedthrough the arcuate fasciculus (green), infe-rior longitudinal fasciculus (blue), and unci-nate fasciculus (orange).
C, Coronal section obtained at the level ofthe posterior limb of the internal capsule.Fibers of the cingulum (pink), arcuate fascic-ulus (green), and uncinate fasciculus (or-ange) pass through the section (dots). Fi-bers of the posterior limb of the internalcapsule (yellow lines) are running in-plane.
D, High-resolution 55 � 55-mm coronalsubimage of the thalamic region. The stri-onigral and pallidonigral fibers are shown inlight blue.
E, High-resolution axial surface coil imageof the calcarine area at a 120 � 60-mm fieldof view. U-fibers connecting visual corticesare well seen.
AJNR: 23, January 2002 WHITE MATTER FIBER TRACT ANATOMY 69

pearance of the association fibers on the principaleigenvector maps is consistent with known anatomy.The main bundle of the cingulum is observed in amedial sagittal section (Fig 1A). The posterolateralbranching bundle of the cingulum that connects withthe parahippocampal area is observed on more lateralsections. The middle part of the arcuate fasciculusand almost the entire course of the superior longitu-dinal fasciculus are observed on a lateral section ob-tained through the insula (Fig 1B). The inferior lon-gitudinal fasciculus connecting to the temporal lobemay be seen on the same section. Moreover, thisparticular section also shows the portion of the unci-nate fasciculus that radiates into the temporal lobe.The main bundle of the uncinate fasciculus can beseen in a section more medial to the one shown in Fig1B. In coronal images, all of these association fibersare shown running vertical to the plane (Fig 1C). Thestrionigral and pallidonigral fibers are observed incoronal image sections through the basal ganglia (Fig1D). U-fibers connecting different cortical areas canbe seen in multiple section locations. Figure 1E showsU-fibers in the occipital subcortex.
Projection FibersThe fan-shaped appearance of the corona radiata,
which connects the internal capsule with subcorticalareas, is observed on multiple lateral sagittal views(Fig 2A). An axial view of the upper portion of thecorona radiata is shown in Figure 2B. Figure 2C
shows an axial view of the internal capsule at the levelof the basal ganglia. On this axial image, the anteriorlimb of the internal capsule is shown as a bundle ofdense in-plane fibers and in the posterior limb, thefibers run predominantly through the plane. A coro-nal view of the posterior limb of the internal capsuleis shown in Figure 1C. On axial images, parts of theoptic and auditory (Fig 2C) radiation can be seen. Ona coronal image obtained through the posterior hornof the lateral ventricle (Fig 2D), the geniculocalcarinetract of the optic radiation is observed.
Commissural FibersThe commissural fibers of the corpus callosum are
observed in sections obtained near the lateral ventri-cle. In the particular section shown in Figure 2C, thegenu of the corpus callosum contains mainly the fi-bers that interconnect the medial parts of the frontallobes. The body of the corpus callosum with fibersoriginating from the posterior part of the frontal lobeand the parietal lobe can be seen in Figures 1C and3A. The splenium, shown on an axial image in Figure2C and on a coronal image in Figure 2D, contains thefibers that interconnect corresponding areas of thetemporal and occipital lobes. The fibers crossingwithin the anterior commissure are clearly shown inthe coronal section in Figure 3B. On the adjacentcoronal section (Fig 3A), the fibers of the anteriorcommissure can be seen radiating toward the tempo-ral lobes. The frontal part of the anterior commissure
FIG 2. Subimages (110 � 110-mm field of view) of the projection fibers.A, Lateral sagittal section passing through the corona radiata (yellow lines).B, Axial section obtained through the genu and splenium of the corpus callosum.
Corona radiata fibers within the posterior limb (yellow) of the internal capsule can bedistinguished by their strong through-plane component (dots), whereas fibers within theanterior limb (orange) of the corpus callosum run in-plane (lines).
C, Axial section obtained at the level of the basal ganglia. Fibers in the anterior limb ofthe internal capsule (orange) are running in-plane (lines), whereas in the posterior limb ofthe internal capsule (yellow), the fibers run through-plane (dots). Parts of the optic (pink)and auditory (green) radiation can also be seen.
D, Coronal section obtained through the trigone of the lateral ventricles. Pink dotsindicate through-plane fibers that are part of the optic radiation.
70 MAMATA AJNR: 23, January 2002

is known to be a very thin, small bundle of fibersinterconnecting the olfactory bulbs. We failed to showthis bundle of fibers in any sections obtained in thisstudy.
Fibers of Brain Stem and CerebellumSmall fiber bundles that pass through and around
the red nucleus and converge to the rootlets of theoculomotor nerve can be observed on an axial imageobtained through the midbrain (Fig 4A). The cerebralpeduncles are easily separated from surrounding fibertracts because of their craniocaudal direction compo-nent, which is represented as yellow and dark yellowdots on the axial plane maps (Fig 4A and B). In thesection shown in Figure 4A, the optic tracts are shown
coursing anterior to the cerebral peduncles. Theirconnection to the lateral geniculate bodies can befound in more cephalad sections (Fig 4C). In thecenter of a more caudal axial section of the midbrain,the decussation of the superior cerebellar peduncle isshown (Fig 4B). Ventral to the decussation of thesuperior cerebellar peduncle, the rubrospinal tractwith fibers in a craniocaudal direction (dots) is ob-served. Dots dorsal to the decussation, as seen inFigure 4B, represent the craniocaudal fibers of themedial longitudinal fasciculus as well as the tectospi-nal, central tegmental, and dorsal trigeminothalamictract. Visual separation of these tracts, however,based on either fiber direction or anisotropy, is notpossible. At the level of the pons (axial section in Fig4D), craniocaudal fibers belonging to the superior
FIG 3. Commissural fibers of the corpuscallosum are observed in sections obtainednear the lateral ventricle.
A, Coronal section obtained through theinsula (110 � 110-mm subimage). In thissection, the cingulum (pink) and fibers (blue)interconnecting the frontoparietal corticesof each hemisphere with the corpus callo-sum can be seen. The fibers of the anteriorcommissure (green) radiate into the tempo-ral lobes.
B, High resolution coronal section (55 �55-mm subimage) obtained at the level ofthe anterior commissure (green).
FIG 4. Subimages (55 � 55-mm field of view) of the brain stem.A, Axial section obtained at the level of the upper midbrain. Very fine fibers that
originate from the oculomotor nucleus run through and around the red nucleus andconverge to the roots of the oculomotor nerves (green). Note that fibers of the cerebralpeduncles are running at a slight angle through the plane (yellow dots with lines).
B, Axial section obtained at the level of the lower midbrain. The arrow indicates thedecussation of the superior cerebellar peduncle.
C, Axial section (110 � 110-mm field of view) obtained at the level of the midbrain-cerebrum junction. The fibers of the optic tract (arrows) connect to the lateral geniculatebodies. Fibers of the optic radiation (pink) pass lateral to the optic tract.
D, Axial section obtained at the level of the pons, through the roots of the trigeminalnerve (green). Fibers of the craniocaudal tracts (superior cerebellar peduncle, mediallongitudinal fasciculus, tectospinal tract, dorsal and ventral trigeminothalamic tracts,central tegmental tract, spinothalamic tract, and rubrospinal tract) can be seen in theposterior part of the pons (pink). The yellow dots indicate fibers of the pyramidal and thefrontopontine tracts.
AJNR: 23, January 2002 WHITE MATTER FIBER TRACT ANATOMY 71
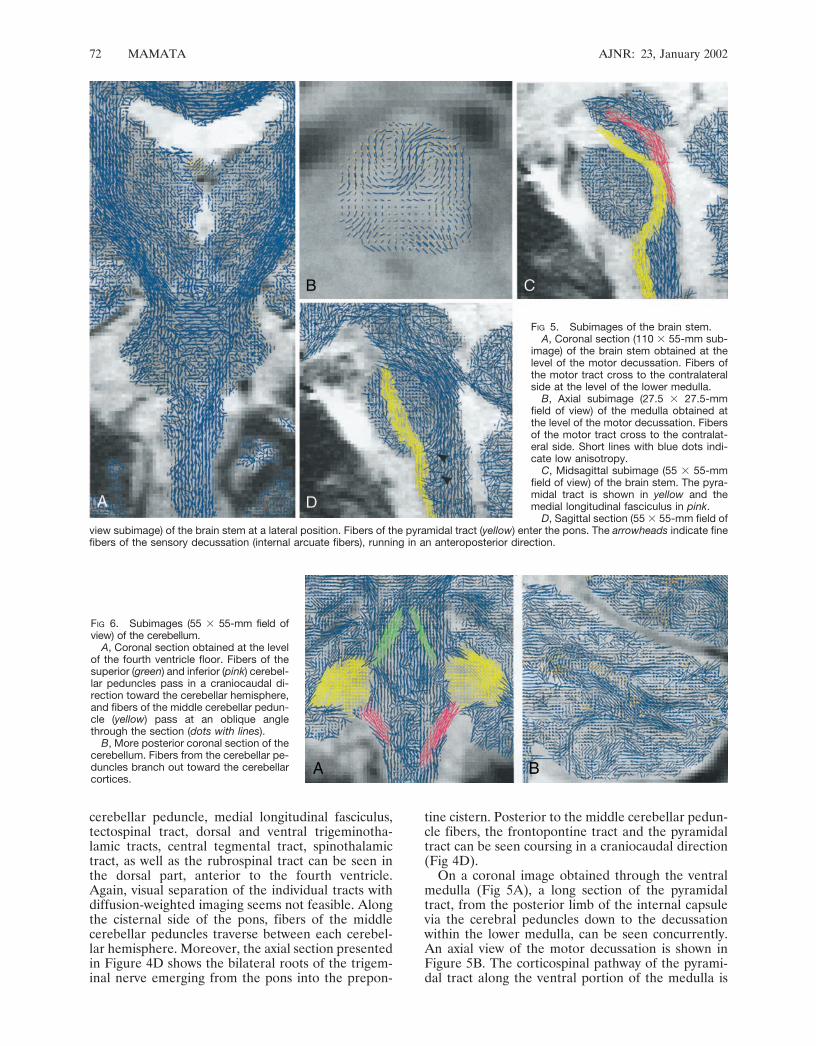
cerebellar peduncle, medial longitudinal fasciculus,tectospinal tract, dorsal and ventral trigeminotha-lamic tracts, central tegmental tract, spinothalamictract, as well as the rubrospinal tract can be seen inthe dorsal part, anterior to the fourth ventricle.Again, visual separation of the individual tracts withdiffusion-weighted imaging seems not feasible. Alongthe cisternal side of the pons, fibers of the middlecerebellar peduncles traverse between each cerebel-lar hemisphere. Moreover, the axial section presentedin Figure 4D shows the bilateral roots of the trigem-inal nerve emerging from the pons into the prepon-
tine cistern. Posterior to the middle cerebellar pedun-cle fibers, the frontopontine tract and the pyramidaltract can be seen coursing in a craniocaudal direction(Fig 4D).
On a coronal image obtained through the ventralmedulla (Fig 5A), a long section of the pyramidaltract, from the posterior limb of the internal capsulevia the cerebral peduncles down to the decussationwithin the lower medulla, can be seen concurrently.An axial view of the motor decussation is shown inFigure 5B. The corticospinal pathway of the pyrami-dal tract along the ventral portion of the medulla is
FIG 6. Subimages (55 � 55-mm field ofview) of the cerebellum.
A, Coronal section obtained at the levelof the fourth ventricle floor. Fibers of thesuperior (green) and inferior (pink) cerebel-lar peduncles pass in a craniocaudal di-rection toward the cerebellar hemisphere,and fibers of the middle cerebellar pedun-cle (yellow) pass at an oblique anglethrough the section (dots with lines).
B, More posterior coronal section of thecerebellum. Fibers from the cerebellar pe-duncles branch out toward the cerebellarcortices.
FIG 5. Subimages of the brain stem.A, Coronal section (110 � 55-mm sub-
image) of the brain stem obtained at thelevel of the motor decussation. Fibers ofthe motor tract cross to the contralateralside at the level of the lower medulla.
B, Axial subimage (27.5 � 27.5-mmfield of view) of the medulla obtained atthe level of the motor decussation. Fibersof the motor tract cross to the contralat-eral side. Short lines with blue dots indi-cate low anisotropy.
C, Midsagittal subimage (55 � 55-mmfield of view) of the brain stem. The pyra-midal tract is shown in yellow and themedial longitudinal fasciculus in pink.
D, Sagittal section (55 � 55-mm field ofview subimage) of the brain stem at a lateral position. Fibers of the pyramidal tract (yellow) enter the pons. The arrowheads indicate finefibers of the sensory decussation (internal arcuate fibers), running in an anteroposterior direction.
72 MAMATA AJNR: 23, January 2002

shown in a midsagittal section (Fig 5C) of the brainstem. Moreover, the corticobulbar pathway of thepyramidal tract can be seen passing along the poste-rior portion of the pons. On the same section follow-ing the base of the fourth ventricle toward midbrain,the medial longitudinal fasciculus can be observed.Furthermore, pontocerebellar fibers running orthog-onal to the plane are readily distinguished. On asagittal section obtained through the fornix (Fig 5D),the internal arcuate fibers of the sensory decussationcan be seen coursing in anteroposterior direction.
On an axial image of the medulla, shown in Figure5B, an area with low anisotropy (short lines with bluedots) is recognized dorsal to the motor decussation.This area corresponds to the central gray matter andthe bilateral nucleus cuneatus.
On a coronal image obtained through the fourthventricle floor in Figure 6A, fibers of the superior andinferior cerebellar peduncles can be seen passingalong the fourth ventricle wall in craniocaudal direc-tion. In the same section, the middle cerebellar pe-duncle runs in anteroposterior direction in this sec-tion. In a more posterior coronal section (Fig 6B), thefibers of the cerebellar peduncles can be seen branch-ing out toward the cerebellar cortex.
DiscussionIn the present study, line scan diffusion imaging
was applied to collect diffusion tensor data of thehuman brain. Line scan diffusion imaging was usedbecause it offers excellent image quality and spatialresolution. Moreover, line scan diffusion imaging isinsensitive to bulk motion. Chemical shift and mag-netic field susceptibility artifacts are minimal (11, 16,17). Echo-planar imaging, which also is available atour institution, is equally sensitive to bulk motion butrequires fat suppression and is limited by susceptibil-ity-related image distortions in areas close to boneand air-filled structures (18, 19). With the massiveskull base bone structure and air-filled spaces, sus-ceptibility-related image distortions become a criticalissue in imaging the brain stem. Line scan diffusionimaging is almost free of such artifacts and thereforeis particularly suited to show detailed white matterfiber anatomy in these areas. Line scan diffusion im-aging compared with echo-planar imaging requireslonger imaging times. Nevertheless, complete braincoverage at high spatial resolution is feasible in ap-proximately half an hour. Missregistration within thisimaging time is not an issue: sections are acquiredsequentially, each section in less time than with aninterleaved multisection echo-planar imaging diffu-sion tensor image. Shorter imaging time and im-proved signal-to-noise ratio result when resolutionalong the column direction is reduced. On the otherhand, at the expense of imaging time or volume cov-erage, thin-section, submillimeter spatial in-plane res-olution can be achieved. Reduction of the bandwidthdoes increase the signal-to-noise ratio; however, atvery low bandwidths, chemical shift and susceptibilityartifacts may become an important issue. Other tech-
niques that yield diffusion-weighted images with lowsusceptibility artifacts are available; for example, multi-shot navigated echo-planar imaging (20), fast spin-echo(21), magnitude back-projection imaging (22), and sin-gle-shot echo-planar imaging with sensitivity encoding(23) have been used in conjunction with diffusion-weighted imaging. However, these techniques are eithersensitive to motion and require cardiac gating or sufferfrom low signal-to-noise ratio.
To visualize the white matter fiber direction withdiffusion tensor data, several methods have been pro-posed. Display of the diffusion ellipsoid, including 3Drendering of diffusion ellipsoids (10), directionallyencoded color maps (13, 24), and mapping of the firsteigenvectors (12, 16, 25–27), has been suggested pre-viously. To visualize eigenvectors for each pixel, how-ever, 3D volume rendering and shading of the diffu-sion ellipsoids require very high resolution and fastcomputer displays. In directionally encoded colormaps, it is difficult to follow in-plane connectivity ofthe same fiber tract group. For optimal visualization,eigenvector directions should be displayed in threedimensions. For example in an axial plane, fibers inthe posterior limb of the internal capsule point out ofthe plane, whereas the anterior limb fibers run par-allel to the plane (Fig 4). However, displaying direc-tions in three dimensions with color encoding (13) isnot intuitively apparent, because without referring tothe definition of the color-encoded direction in alook-up table, the viewer has no clue about the truedirection. Our maps of the first eigenvector showfibers running out of the plane as dots. The introduc-tion of dots for eigenvectors pointing out of the planesimulates an ideal cut surface of longitudinal fiberbundles. Therefore, one can easily understand thedirectional differences not only between in-plane andthrough-plane but also among different in-plane fiberdirections. Moreover, the display of the first eigen-vectors presents pictures extremely similar to thoseshown in anatomy atlas books (14, 15). For goodvisual impression, the lines need to have a certainlength. This may result in lines that exceed the pixelboundaries, and for that reason, it may be less quan-titative than a color-encoded map. In recent studiesof diffusion tensor imaging, diffusion tracking tech-niques in humans (28–31) have been introduced.Such techniques are very useful for following whitematter fibers from a certain area to another in threedimensions. Connectivity of white matter fibers pass-ing through the entire brain can be visualized withthis technique.
Dense and compact white matter pathways, such asthe anterior commissure, corpus callosum, superiorfronto-occipital fasciculus, cingulum, fornix, mammil-lothalamic tract, uncinate fasciculus, and superior andinferior longitudinal fasciculus have been identifiedon conventional and fast spin-echo T2-weighted im-ages by their relative short T2 relaxation time (32,33). The large bundles of white matter fiber tractsincluding pyramidal tract (internal capsule to coronaradiata) (34), corpus callosum, cingulum (13, 24, 35–37), and optic tract (25) have previously been shown
AJNR: 23, January 2002 WHITE MATTER FIBER TRACT ANATOMY 73

by other authors. The course of the pyramidal tractwithin the brain stem has not previously been shownwith diffusion tensor imaging. Other small nervestructures, hitherto not observed with diffusion tensorimaging, are the strionigral and pallidonigral fibers,root fibers of the oculomotor nerve, arcuate fibers ofthe sensory decussation, and superior part of theanterior commissure.
Within the nuclei and deep gray matter, preferreddiffusion directions were observed. Diffusion aniso-tropy in these areas, however, was not as high as inwhite matter tracts. This anisotropy may be explainedby partial volume effects of fibers passing adjacent tothe section, but it may also result from smaller radi-ation fibers connecting to the nucleus (eg, strionigraland pallidonigral fibers). For example, in the coronalimage of the midthalamus, we observed well-orga-nized eigenvectors in the area of the thalamic nuclei(ie, an area where partial volume effects of whitematter in an adjacent section is unlikely) (Fig 2C).
Diffusion tensor images in this study were obtainedat high resolution. Nonetheless, it is not sufficient toresolve all known anatomic structures of the brain.For example, the internucleus fibers could not bedistinguished from radiation fibers extending to thelarger bundles. The visualization of the tracts variedamong participants. However, we attribute this vari-ation not only to individual differences among partic-ipants but also to section orientation and position.
Diffusion imaging has been used to diagnose stroke(17, 38, 39) and to investigate brain tumors (40) andmultiple sclerosis lesions (41). To better understandthe functional consequences of such lesions, detailedknowledge of the fibers surrounding the lesions isneeded. In planning of brain tumor surgery, the spa-tial relation between a lesion and major fiber struc-tures, such as the pyramidal tract, can be very impor-tant. Disruption of the normal white matter fibersadjacent to the lesions can be visualized with maps ortracking of the principal diffusion direction. More-over, there is potential to distinguish preserved whitematter fibers within edema from actually disruptedfibers.
Conclusion
We have shown high-resolution white matter fiberanatomy in the human adult brain by using maps ofthe first diffusion eigenvector. The direction of thefirst diffusion eigenvector seems to represent the fi-ber structures shown in anatomy atlases. Unlike di-rectionally encoded color maps, the directional infor-mation was displayed with lines drawn on top ofconventional images. With line scan diffusion imag-ing, high-resolution diffusion tensor images with min-imal susceptibility artifacts were collected. Particu-larly near large bone structures (eg, skull base), thelow sensitivity to susceptibility variations is importantto obtain artifact-free images.
References
1. Ting YL, Bendel P. Thin-section MR imaging of rat brain at 4.7T.J Magn Reson Imaging 1992;2:393–399
2. Ghosh P, O’Dell M, Narasimhan PT, Fraser SE, Jacobs RE. Mouselemur microscopic MRI brain atlas. Neuroimage 1994;1:345–349
3. De Coene B, Hajnal JV, Pennock JM, Bydder GM. MRI of thebrain stem using fluid attenuated inversion recovery pulse se-quences. Neuroradiology 1993;35:327–331
4. Wolff SD, Balaban RS. Magnetization transfer contrast (MTC)and tissue water proton relaxation in vivo. Magn Reson Med 1993;29:77–83
5. Balaban RS, Ceckler TL. Magnetization transfer contrast in mag-netic resonance imaging. Magn Reson Q 1992;8:116–137
6. Mehta RC, Pike GB, Enzmann DR. Magnetization transfer MR ofthe normal adult brain. AJNR Am J Neuroradiol 1995;16:2085–2091
7. Beaulieu C, Allen PS. Determinants of anisotropic water diffusionin nerves. Magn Reson Med 1994;31:394–400
8. Basser PJ, Mattiello J, LeBihan D. MR diffusion tensor spectros-copy and imaging. Biophys J 1994;66:259–267
9. Basser PJ, Mattiello J, LeBihan D. Estimation of the effectiveself-diffusion tensor from the NMR spin echo. J Magn Reson B1994;103:247–254
10. Pierpaoli C, Jezzard P, Basser PJ, Barnett A, DiChiro G. Diffusiontensor MR imaging of the human brain. Radiology 1996;201:637–648
11. Gudbjartsson H, Maier SE, Mulkern RV, Morocz IA, Patz S, JoleszFA. Line scan diffusion imaging. Magn Reson Med 1996;36:509–519
12. Peled S, Gudbjartsson H, Westin CF, Kikinis R, Jolesz FA. Mag-netic resonance imaging shows orientation and asymmetry of whitematter fiber tracts. Brain Res 1998;780:27–33
13. Pajevic S, Pierpaoli C. Color schemes to represent the orientationof anisotropic tissues from diffusion tensor data: application towhite matter fiber tract mapping in the human brain. Magn ResonMed 1999;42:526–540
14. DeArmond SJ, Fusco MM, Dewey MM. Structure of the HumanBrain: A Photographic Atlas. 3rd ed. New York: Oxford UniversityPress; 1989
15. Carpenter MB. Core Text of Neuroanatomy. 4th ed. Baltimore:William & Wilkins; 1996
16. Huppi PS, Maier SE, Peled S, et al. Microstructural develop-ment of human newborn cerebral white matter assessed in vivoby diffusion tensor magnetic resonance imaging. Pediatr Res1998;44:584 –590
17. Maier SE, Gudbjartsson H, Patz S, et al. Line scan diffusionimaging: characterization in healthy subjects and stroke patients.AJR Am J Roentgenol 1998;171:85–93
18. Turner R, Le Bihan D, Maier J, Vavrek R, Hedges LK, Pekar J.Echo-planar imaging of intravoxel incoherent motion. Radiology1990;177:407–414
19. Davis TL, Wedeen VJ, Weisskoff RM, Rosen BR. White mattertract visualization by echo-planar MRI. ISMRM Proc 1993:289
20. Bammer R, Stollberger R, Augustin M, et al. Diffusion-weightedimaging with navigated interleaved echo-planar imaging and aconventional gradient system. Radiology 1999;211:799–806
21. Alsop DC. Phase insensitive preparation of single-shot RARE:application to diffusion imaging in humans. Magn Reson Med1997;38:527–533
22. Trouard TP, Theilmann RJ, Altbach MI, Gmitro AF. High-resolu-tion diffusion imaging with DIFRAD-FSE (diffusion-weighted ra-dial acquisition of data with fast spin-echo) MRI. Magn Reson Med1999;42:11–8
23. Bammer R, Keeling SL, Augustin M, et al. Improved diffusion-weighted single-shot echo-planar imaging (EPI) in stroke usingsensitivity encoding (SENSE). Magn Reson Med 2001;46:548–554
24. Makris N, Worth AJ, Sorensen AG, et al. Morphometry of in vivohuman white matter association pathways with diffusion-weightedmagnetic resonance imaging. Ann Neurol 1997;42:951–962
25. Werring DJ, Clark CA, Parker GJ, Miller DH, Thompson AJ,Barker GJ. A direct demonstration of both structure and functionin the visual system: combining diffusion tensor imaging withfunctional magnetic resonance imaging. Neuroimage 1999;9:352–361
26. Maier SE, Jolesz FA. Line scan diffusion imaging with a highperformance gradient system. ISMRM Proc 1998:1389
27. Tuch DS, Weisskoff RM, Belliveau JW, Wedeen VJ. High resolu-tion diffusion imaging of the human brain. ISMRM Proc 1999;321:30
74 MAMATA AJNR: 23, January 2002
28. Parker GJ. Tracing fiber tracts using fast marching. ISMRM Proc2000;1:85
29. Conturo TE, Lori NF, Cull TS, et al. Tracking neuronal fiberpathways in the living human brain. Proc Natl Acad Sci U S A1999;96:10422–10427
30. Poupon C, Clark CA, Frouin V, et al. Regularization of diffusion-based direction maps for the tracking of brain white matter fasci-cles. Neuroimage 2000;12:184–195
31. Mori S, Kaufmann WE, Pearlson GD, Crain BJ, Solaiyappan M,van Zijl PC. Three-dimensional reconstruction of in-vivo humanwhite matter tracts. ISMRM Proc 2000:83
32. Curnes JT, Burger PC, Djang WT, Boyko OB. MR imaging ofcompact white matter pathways. AJNR Am J Neuroradiol 1988;9:1061–1068
33. Cellerini M, Konze A, Caracchini G, Santoni M, Dal Pozzo G.Magnetic resonance imaging of cerebral associative white matterbundles employing fast-scan techniques. Acta Anat (Basel) 1997;158:215–221
34. Virta A, Barnett A, Pierpaoli C. Visualizing and characterizingwhite matter fiber structure and architecture in the human pyra-midal tract using diffusion tensor MRI. Magn Reson Imaging 1999;17:1121–1133
35. Shimony JS, McKinstry RC, Akbudak E, et al. Quantitative diffu-sion-tensor anisotropy brain MR imaging: normative human dataand anatomic analysis. Radiology 1999;212:770–784
36. Thompson MR, Venkatesan R, Kuppusamy K, et al. Increased-contrast, high-spatial-resolution, diffusion-weighted, spin-echo,echo-planar imaging. Radiology 1999;210:253–259
37. Jones DK, Simmons A, Williams SC, Horsfield MA. Non-invasiveassessment of axonal fiber connectivity in the human brain viadiffusion tensor MRI. Magn Reson Med 1999;42:37–41
38. Warach S, Chien D, Li W, Ronthal M, Edelman RR. Fast magneticresonance diffusion-weighted imaging of acute stroke. Neurology1992;42:1717–1723
39. Sorensen AG, Wu O, Copen WA, et al. Human acute cerebralischemia: detection of changes in water diffusion anisotropy byusing MR imaging. Radiology 1999;212:785–792
40. Mamata H, Mamata Y, Jolesz FA, Maier SE. Line scan diffusionhigh-resolution tensor images in normal and pathologic brain.ISMRM Proc 2000;2:787
41. Werring DJ, Clark CA, Barker GJ, Thompson AJ, Miller DH.Diffusion tensor imaging of lesions and normal-appearing whitematter in multiple sclerosis. Neurology 1999;52:1626–1632
AJNR: 23, January 2002 WHITE MATTER FIBER TRACT ANATOMY 75