High-Resolution Greenland Ice Core Data Show Abrupt Climate
8
/ www.sciencexpress.org / 19 June 2008 / Page 1/ 10.1126/science.1157707 The last two abrupt warmings at the onset of our present warm interglacial period, interrupted by the Younger Dryas cooling event, are investigated in high temporal resolution from the Greenland NGRIP ice core. The deuterium excess, a proxy of Greenland precipitation moisture source, switches mode within 1-3 years over these transitions and initiates a more gradual change (50 years) of the Greenland air temperature as recorded by water stable isotopes. The onsets of both abrupt Greenland warmings are slightly preceded by decreasing Greenland dust deposition, reflecting wetting of Asian deserts. A northern shift of the ITCZ could be the trigger of these abrupt shifts of northern hemisphere atmospheric circulation resulting in 2-4K changes in Greenland moisture source temperature from one year to the next. Ice core records from Greenland have been instrumental in investigating past abrupt climate change. Compared to other sedimentary records the ice core records have unparalleled temporal resolution and continuity (1–3). The newest Greenland ice core, NGRIP, has been measured in very high resolution for water isotopes, dust and impurity concentrations. This allows for the first time to follow the ice core proxies of Greenland temperature, accumulation; moisture origin and aerosol deposition in subannual resolution over the very abrupt climate changes in the period from 15.5-11.0 thousand years before 2000AD (ka b2k). In the Northern Hemisphere, the last glacial period ends in a climatic oscillation comprised of two abrupt warmings interrupted by one cooling event (3–6).The rapid temperature changes from glacial to mild conditions in the Bølling and Allerød periods and the returns to glacial values in the Younger Dryas period before the onset of the present warm interglacial, the Holocene (Fig. 1, see SOM table S1 for classification of climate periods). The shape and duration of the abrupt climate change at the termination of the last glacial have previously been constrained by Greenland ice core records from DYE-3 (4, 7),GRIP (8) and GISP2 (6, 9) but sampling of these cores did not typically achieve sufficient resolution to resolve annual layers. Owing to new continuous flow analysis (CFA) systems (10–12), impurity and chemical records of the recent NGRIP ice core(1) have been obtained at sub-annual resolution allowing for the multi-proxy identification of annual layer thickness and the construction of a new Greenland time scale, the GICC05 time scale (2). Complementary highly detailed stable water isotope profiles (δ 18 O and δD) have been measured on the NGRIP ice core covering 15.5-11.0 ka b2k at 2.5-5.0 cm resolution, corresponding to 1-3 samples per year. They are compared to the concentrations of insoluble dust, soluble sodium (Na + ) and calcium (Ca 2+ ), measured using CFA in sub-annual resolution (10, 12, 13) (Fig. 2) and, when available, with the highest resolution data from GRIP, GISP2 and DYE3 ice cores on the GICC05 time scale. Across the warming transitions, the records exhibit clear shifts between two climate states. We characterize a shift to be significant if the mean values of the climate states on each High-Resolution Greenland Ice Core Data Show Abrupt Climate Change Happens in Few Years J. P. Steffensen, 1 * K. K. Andersen, 1 M. Bigler, 1,2 H. B. Clausen, 1 D. Dahl-Jensen, 1 H. Fischer, 2,3 K. Goto-Azuma, 4 M. Hansson, 5 S. J. Johnsen, 1 J. Jouzel, 6 V. Masson-Delmotte, 6 T. Popp, 7 S. O. Rasmussen, 1 R. Rothlisberger, 2,8 U. Ruth, 3 B. Stauffer, 2 M.-L. Siggaard-Andersen, 1 A. E. Sveinbjörnsdóttir, 9 A. Svensson, 1 J. W. C. White 7 1 Centre for Ice and Climate, Niels Bohr Institute, University of Copenhagen, Juliane Maries Vej 30, DK-2100 Copenhagen OE, Denmark. 2 Climate and Environmental Physics, Physics Institute, University of Bern, Sidlerstrasse 5,CH-3012, Switzerland. 3 Alfred-Wegener-Institute for Polar- and Marine Research (AWI), Postfach 120161, D-27515 Bremerhaven, Germany. 4 National Institute of Polar Research, Kaga 1-9-10, Itabashi-ku, Tokyo 173-8515 Japan. 5 Department of Physical Geography and Quaternary Geology, Stockholm University, S-106 91, Stockholm, Sweden. 6 Institut Pierre Simon Laplace/ Laboratoire des Sciences du Climat et de l’Environnement, UMR 1572 CEA-CNRS-UVSO, CEA Saclay, Bar 701 L’Orme des Merisiers 91191 Gif-Sur-Yvette, France. 7 INSTAAR,Campus Box 450, University of Colorado, Boulder, CO 80309-0450, USA. 8 British Antarctic Survey, Natural Environment Research Council, High Cross, Madingley Road, Cambridge CB3 0ET, United Kingdom. 9 Raunvísindastofnun Háskólans, Dunhagi 3, Iceland *To whom correspondence should be addressed. E-mail: [email protected]
Transcript of High-Resolution Greenland Ice Core Data Show Abrupt Climate

/ www.sciencexpress.org / 19 June 2008 / Page 1/ 10.1126/science.1157707
The last two abrupt warmings at the onset of our present warm interglacial period, interrupted by the Younger Dryas cooling event, are investigated in high temporal resolution from the Greenland NGRIP ice core. The deuterium excess, a proxy of Greenland precipitation moisture source, switches mode within 1-3 years over these transitions and initiates a more gradual change (50 years) of the Greenland air temperature as recorded by water stable isotopes. The onsets of both abrupt Greenland warmings are slightly preceded by decreasing Greenland dust deposition, reflecting wetting of Asian deserts. A northern shift of the ITCZ could be the trigger of these abrupt shifts of northern hemisphere atmospheric circulation resulting in 2-4K changes in Greenland moisture source temperature from one year to the next.
Ice core records from Greenland have been instrumental in investigating past abrupt climate change. Compared to other sedimentary records the ice core records have unparalleled temporal resolution and continuity (1–3). The newest Greenland ice core, NGRIP, has been measured in very high resolution for water isotopes, dust and impurity concentrations. This allows for the first time to follow the ice core proxies of Greenland temperature, accumulation; moisture origin and aerosol deposition in subannual resolution over the very abrupt climate changes in the period from 15.5-11.0 thousand years before 2000AD (ka b2k). In the Northern Hemisphere, the last glacial period ends in a climatic oscillation comprised of two abrupt warmings
interrupted by one cooling event (3–6).The rapid temperature changes from glacial to mild conditions in the Bølling and Allerød periods and the returns to glacial values in the Younger Dryas period before the onset of the present warm interglacial, the Holocene (Fig. 1, see SOM table S1 for classification of climate periods). The shape and duration of the abrupt climate change at the termination of the last glacial have previously been constrained by Greenland ice core records from DYE-3 (4, 7),GRIP (8) and GISP2 (6, 9) but sampling of these cores did not typically achieve sufficient resolution to resolve annual layers. Owing to new continuous flow analysis (CFA) systems (10–12), impurity and chemical records of the recent NGRIP ice core(1) have been obtained at sub-annual resolution allowing for the multi-proxy identification of annual layer thickness and the construction of a new Greenland time scale, the GICC05 time scale (2). Complementary highly detailed stable water isotope profiles (δ18O and δD) have been measured on the NGRIP ice core covering 15.5-11.0 ka b2k at 2.5-5.0 cm resolution, corresponding to 1-3 samples per year. They are compared to the concentrations of insoluble dust, soluble sodium (Na+) and calcium (Ca2+), measured using CFA in sub-annual resolution (10, 12, 13) (Fig. 2) and, when available, with the highest resolution data from GRIP, GISP2 and DYE3 ice cores on the GICC05 time scale. Across the warming transitions, the records exhibit clear shifts between two climate states. We characterize a shift to be significant if the mean values of the climate states on each
High-Resolution Greenland Ice Core Data Show Abrupt Climate Change Happens in Few Years J. P. Steffensen,1* K. K. Andersen,1 M. Bigler,1,2 H. B. Clausen,1 D. Dahl-Jensen,1 H. Fischer,2,3 K. Goto-Azuma,4 M. Hansson,5S. J. Johnsen,1 J. Jouzel,6 V. Masson-Delmotte,6 T. Popp,7 S. O. Rasmussen,1 R. Rothlisberger,2,8 U. Ruth,3 B. Stauffer,2 M.-L. Siggaard-Andersen,1 A. E. Sveinbjörnsdóttir,9 A. Svensson,1 J. W. C. White7 1Centre for Ice and Climate, Niels Bohr Institute, University of Copenhagen, Juliane Maries Vej 30, DK-2100 Copenhagen OE, Denmark. 2Climate and Environmental Physics, Physics Institute, University of Bern, Sidlerstrasse 5,CH-3012, Switzerland. 3Alfred-Wegener-Institute for Polar- and Marine Research (AWI), Postfach 120161, D-27515 Bremerhaven, Germany. 4National Institute of Polar Research, Kaga 1-9-10, Itabashi-ku, Tokyo 173-8515 Japan. 5Department of Physical Geography and Quaternary Geology, Stockholm University, S-106 91, Stockholm, Sweden. 6Institut Pierre Simon Laplace/ Laboratoire des Sciences du Climat et de l’Environnement, UMR 1572 CEA-CNRS-UVSO, CEA Saclay, Bar 701 L’Orme des Merisiers 91191 Gif-Sur-Yvette, France. 7INSTAAR,Campus Box 450, University of Colorado, Boulder, CO 80309-0450, USA. 8British Antarctic Survey, Natural Environment Research Council, High Cross, Madingley Road, Cambridge CB3 0ET, United Kingdom. 9Raunvísindastofnun Háskólans, Dunhagi 3, Iceland
*To whom correspondence should be addressed. E-mail: [email protected]

/ www.sciencexpress.org / 19 June 2008 / Page 2/ 10.1126/science.1157707
side of the shift differ by more than the statistical standard error of the noise of a 150 year period of these climate states. A simple but objective approach to find the best timing of the transition is to characterize the shift observed in each proxy as a ‘ramp’: a linear change from one stable state to another. We apply a Ramp fitting method (14) to determine the timing of the transitions. The method uses weighted least square regression to determine the ramp location and a bootstrap simulation to estimate the uncertainty of the results (Transition times are listed in Table 1, for additional information see SOM methods and SOM table S2 for more detailed information on the method and the ramp fit values and uncertainties). Data and fitted ramps are shown in Figs. 2 and 3. For annual layer thickness (λ), concentrations of dust, calcium and sodium, logarithmic scales are used because these proxies are approximately log-normally distributed. The δ18O record is a proxy for past air temperature at the ice core site (15, 16). While the magnitude of Greenland δ18O changes can be influenced by changing site and source temperature and by snowfall seasonality (15, 17, 18), the timing of δ18O changes is dominated by the changing site temperature (17). The δ18O warming transition at 14.7 ka b2k is the most rapid and occurs within a remarkable 3 years while the warming transition at 11.7 ka b2k lasts 60 years; both correspond to warming of more than 10K (6, 19). δ18O records from the GRIP (16), GISP2 (9) and DYE-3 (7, 20) ice cores across the 11.7 ka b2k transition show a similar duration. The δ18O cooling transition at 12.9 ka b2k lasts more than two centuries, much longer than the warming transitions, and does not meet the above described criteria for being described as a ramp shift. Annual layer thickness, λ (estimated independently of δ18O by annual layer counting), increases by 40% during the two warmings over 3 and 40 years respectively. During the cooling, λ decreases by 33% over a period of 152 years. When corrected for strain, λ represents the annual precipitation rate which is linked to site temperature and to synoptic weather patterns. Both Greenland site temperature and accumulation are expected to be strongly related to the extent of the Northern sea ice (21). The most abrupt transitions are those of the deuterium excess d=δD - 8δ18O, a second-order isotopic parameter that contains information on fractionation effects caused by evaporation of source water (15, 17, 22). The excess is considered to be mainly a proxy of past ocean surface temperatures at the moisture source region (15, 17, 22). Our dust record, not showing a similar abrupt transition as the excess, rules out the alternative explanation for a rapid deuterium excess shift linked with changes in cloud condensation nuclei and kinetic fractionation taking place during cloud ice crystal formation (23, 24). The excess record shows a 2-3 o/oo decrease at the warmings corresponding to a cooling of 2-4 K of the marine moisture source region (15, 17) in 1-3 years and vice versa at the cooling transition. Fig.3 presents the rapid changes of deuterium excess on a higher resolved time axis in order to clearly show the rapid change between the climate states. The moisture source evaporation conditions can change either by a shift in atmospheric circulation resulting in relocation of the moisture source or by changing sea surface temperature,
humidity or wind conditions at a stationary moisture source. The extremely rapid shifts both for warmings and cooling rules out an explanation purely in terms of sea-ice extent, as the northern sea ice extended far south during the final phase of the cold stadials and is not expected to break down in just 1-3 years (25, 26). Finally, if excess was reflecting only changes in weather patterns trajectories with respect to the NGRIP observation point, then it would be expected to detect simultaneous changes in other parameters such as dust, calcium and λ, which is not the case. Thus, we interpret the rapid shifts in excess as more likely a consequence of changed source regions of the water vapor reaching Greenland. This point to a reorganisation of atmospheric circulation from one year to the next. The concentrations of insoluble dust and calcium reflect both source strength and transport conditions from terrestrial sources which for Greenland are the low latitude Asian deserts (10, 27). At the two warming events the concentrations of dust and calcium decrease by a factor of 5-7 within four decades slightly preceding the excess shift by 10±5 years. In contrast, during the cooling event the dust and calcium concentrations increase by a factor of 5 over a period of more than a century slightly lagging the excess shift by 20±10 years. The concentration of sodium, which is mainly a marine sea salt indicator, shows only moderate changes at the transitions compared to interannual variability.. Changes in sea-ice extent are expected to influence sea-salt export to Greenland through changing the distance to open water and altering sea salt aerosol contributions from sea ice and open water sources. However, meteorological conditions play an important role in modulating the sea salt uplift, transport and deposition on the Greenland ice sheet (28). While insufficient quantitative understanding of the processes involved is available, the lack of a fast response of the marine sea salt proxy may be seen as a gradual change in sea ice or as a combination of changes in sea ice and meteorology compensating each other to some extent. This high resolution study reveals a rather challenging sequence of events, and gives insights into both the onsets and evolution of a rapid climate shift. Our records demonstrate that the last two major warming events followed the same general pattern. During Greenland cold phases, the thermohaline circulation is reduced, northern sea ice extends far south and the ITCZ is shifted southward resulting in dry conditions at the low latitude dust source regions (21, 29, 30). Meanwhile, southern high latitudes and tropical oceans accumulate heat and undergo gradual warming as reflected in the bipolar seesaw pattern (31, 32) due to a reduction in the North Atlantic overturning Circulation. We suggest that this southern hemisphere / tropical warming induce first a northward shift of the ITCZ, and, when a threshold is reached an abrupt intensification of the Pacific monsoon. The wetter conditions at the Asian dust source areas then cause a decreased uplift and increased washout of atmospheric dust, leading to the first sign of change in Greenland: decreasing dust and calcium concentrations. This reorganisation of the tropical atmospheric circulation is followed by a complete reorganisation of the mid to high latitude atmospheric

/ www.sciencexpress.org / 19 June 2008 / Page 3/ 10.1126/science.1157707
circulation almost from one year to the next, as identified by the 1-3 year transitions in deuterium excess. Sea-ice then starts retreating in the North Atlantic, associated with increased advection of atmospheric heat and moisture as indicated by Greenland changes in δ18O and λ (21, 33). It should be noted that both abrupt warming events of the last termination are characterized by this sequence of events, even though they occur at different stages of deglaciation. The 14.7 ka b2k event followed Heinrich event H1 at a time when the ice sheets in the North were still extensive whereas the North was more deglaciated at 11.7 ka b2k (34), reducing the amount of ice discharge available to change the density of North Atlantic ocean waters and thereby the THC before the warming onset (34). The NGRIP ice core has also revealed that the very first interstadial of the last glacial cycle occurred at the inception of the glacial period 110 ka b2k, before the ice sheets were fully developed and the climate system had cooled to full glacial conditions (1). The detailed sequence of events obtained here for the most recent warming events suggests that the classical bipolar seesaw concept (31) involving the ocean thermohaline circulation reorganisation must include the role of abrupt atmospheric circulation changes from the tropics to the high northern latitude in the onset of abrupt warmings seen in the North Atlantic region. The cooling at 12.9 ka b2k is characterized by relatively longer transition times for all parameters except for the deuterium excess, and the sequence of events is notably different. In this case, changes in excess and δ18O precede the calcium reaction. The centennial scale change in δ18O follows anterior gradual cooling during Allerød perod, probably including gradual build-up of sea ice. Given the generally slow nature of the coolings, the persistent rapid switch of the atmospheric circulation as recorded by the excess is even more surprising, and confirms the potential for extremely abrupt reorganizations of the Arctic atmospheric circulation whether going from cold to warm or vice-versa. The lag and longer duration of the dust and calcium responses may be due to the inertia of land surfaces drying out, and vegetation dying off in the dust source regions before large fluxes of dust can be re-established. The high resolution records from the NGRIP ice core reveals that polar atmospheric circulation can shift in 1-3 years resulting in decadal to centennial scale changes from cold stadials to warm interstadials/interglacials associated with astounding Greenland temperature changes of 10K (6, 19). Neither the magnitude of such shifts nor their abruptnesses are currently captured by state of the art climate models. Here, we propose a series of events, beginning in the lower latitudes and leading to changes in the ocean and atmosphere, that reveals for the first time the anatomy of abrupt climate change. While it should be noted that no large deuterium excess shifts can be identified over the course of the Holocene in the Greenland ice cores (35) past warming events now documented at sub-annual resolution offer important, unique benchmarks to test climate models. If we are to be confident in the ability of those models to accurately predict the impacts of future abrupt change, their ability to match what we see in the past is crucial.
References and Notes 1. North Greenland Ice Core Project members, Nature 431,
147 (2004). 2. S. O. Rasmussen et al., Journal of Geophysical Research
111, D06102, doi:10.1029/2005JD006079 (2006). 3. R. B. Alley et al., Science 299, 2005 (2003). 4. W. Dansgaard, J. W. C. White, S. J. Johnsen, Nature 339,
532 (1989). 5. J. J. Lowe, M. J.C.Walker, Reconstructing Quaternary
Environments, 2nd. edition (Pearson Higher Education, 1997).
6. J. P. Severinghaus, E. J. Brook, Science 286, 930 (1999). 7. W. Dansgaard et al., Science 218, 1273 (1982). 8. S. J. Johnsen et al., Journal of Geophysical Research 102,
26397 (1997). 9. P. M. Grootes, M. Stuiver, J. W. C. White, S. J. Johnsen, J.
Jouzel, Nature 366, 552 (1993). 10. U. Ruth et al., Geophysical Research Letters 34, L03706,
doi:10.1029/2006GL027876 (2007). 11. R. Röthlisberger et al., Environmental Science &
Technology 34, 338 (2000). 12. M. Bigler, Ph.D. dissertation, University of Bern,
Switzerland (2004). 13. U. Ruth, D. Wagenbach, J. P. Steffensen, M. Bigler,
Journal of Geophysical Research 108, 4098, doi:10.1029/2002JD002376 (2003).
14. M. Mudelsee, Computers & Geosciences 26, 293 (2000). 15. V. Masson-Delmotte et al., Science 309, 118 (2005). 16. W. Dansgaard et al., in Climatic Processes and Climate
Sensitivity J. E. Hansen, T. Takahashi, Eds. (American Geophysical Union (AGU), Washington D.C., 1984), vol. Maurice Ewing 5, pp. 288-298.
17. J. Jouzel et al., Quaternary Science Reviews 26, 1 (2007). 18. M. Werner, M. Heimann, G. Hoffmann, Tellus B 53, 53
(2001). 19. A. Landais, J. Jouzel, V. Masson-Delmotte, N. Caillon,
Comptes Rendus Geosciences 337, 947 (2005). 20. S. J. Johnsen et al., Journal of Quaternary Science 16,
299 (2001). 21. C. Li, D. S. Battisti, D. P. Schrag, E. Tziperman,
Geophysical Research Letters 32, L19702, doi:10.1029/2005GL023492 (2005).
22. S. J. Johnsen, W. Dansgaard, J. W. C. White, Tellus B 41, 452 (1989).
23. J. Jouzel et al., Journal of Geophysical Research 96, 7495 (1991).
24. D. A. Fisher, Tellus B 43, 401 (1991). 25. M. Winton, Geophysical Research Letters 33, L23504,
doi:10.1029/2006GL028017 (2006). 26. C. Hillaire-Marcel, A. d. Vernal, Earth and Planetary
Science Letters 268, 143 (2008). 27. A. Svensson, P. E. Biscaye, F. E. Grousset, Journal of
Geophysical Research 105, 4637 (2000). 28. M. A. Hutterli et al., in Clim. Dyn. (2006) pp. DOI
10.1007/s00382-006-0211-z. 29. D. W. Lea, D. K. Pak, L. C. Peterson, K. A. Hughen,
Science 301, 1361 (2003). 30. J. W. Partin, K. M. Cobb, J. F. Adkins, B. Clark, D. P.
Fernandez, Nature 449, 452 (2007).

/ www.sciencexpress.org / 19 June 2008 / Page 4/ 10.1126/science.1157707
31. T. F. Stocker, S. J. Johnsen, Paleoceanography 18, 1087, doi:10.1029/2003PA000920 (2003).
32. EPICA community members, Nature 444, 195 (2006). 33. J. C. H. Chiang, C. M. Bitz, Climate Dynamics 25, DOI:
10.1007/s00382-005-0040-5 (2005). 34. K. Lambeck, T. M. Esat, E.-K. Potter, Nature 419, 1996
(2002). 35. V. Masson-Delmotte et al., Journal of Geophysical
Research 110, D14102, doi:10.1029/2004JD005575 (2005).
36. NGRIP is directed and organized by the Ice and Climate research group, Niels Bohr Institute, University of Copenhagen. It is supported by funding agencies in Denmark (FNU), Belgium (FNRS-CFB), France (IPEV and INSU/CNRS), Germany (AWI), Iceland. (RannIs), Japan (MEXT), Sweden (SPRS), Switzerland (SNF) and the USA (NSF, Office of Polar Programs).
Supporting Online Material www.sciencemag.org/cgi/content/full/1157707/DC1 Methods Tables S1 and S2 Data
12 March 2008; accepted 12 June 2008
Published online 19 June 2008; 10.1126/science.1157707
Include this information when citing this paper.
Fig. 1. Location of drill sites on the Greenland Ice Sheet. DYE-3 (65.15N, 43.82W), GRIP (72.59N, 37.64W), GISP2 (72.58N, 38.46W) and NGRIP(75.10N, 42.32W). To the left the NGRIP stable water isotope profile (δ18O) on the GICC05 timescale (1, 2). The zone studied (11.0-15.5 ka b2k) is marked with grey shading.
Fig. 2. Multi-parameter records from the NGRIP ice core 11.0-15.5 ka b2k. (A) Deuterium excess (d, red) and stable water isotope (δ18O, blue) in 20 years resolution over the entire period and details of the transition zones: (B) from GS-1 into the Holocene at 11.7 ka b2k, (C) from GI-1a into GS-1 at 12.9 ka b2k, (D) from GS-2 into GI-1e at 14.7 ka b2k. Left part of (B-D): NGRIP records of deuterium excess (d, red), stable water isotope (δ18O, blue) and logarithmic plots of dust content (yellow), calcium concentration ([Ca2+], cyan), sodium concentration ([Na+], purple), and annual layer thickness (λ, green) in annual resolution. Bold lines show the fitted ramp functions, with the grey vertical bars representing the 95% (2σ) confidence intervals of the ramp point locations. Right part of (B-D): Bars representing the locations of the fitted ramp functions for the NGRIP records shown to the left and for the corresponding results obtained using DYE-3, GRIP, and GISP2 data, where these are available in sufficient resolution (see list of records below the figure). See Table 1 and SOM methods and table S2 for additional information on ramp fitting.
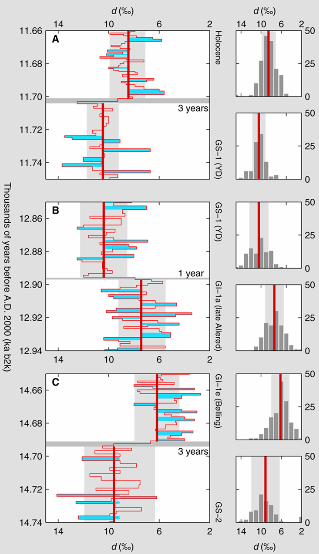
Fig. 3. Deuterium excess data (d, red) at measured resolution and the fitted ramp curves across the same transitions as shown on Figure 2 (B-D) The mean values over the 150 years of before and after the transitions are shown as bold, red lines. Left: To visualize the shifts the areas within one standard deviation from the mean values are shaded light grey. Where the data values are more than one standard deviation away from the mean, the zone is colored light blue. Right: histograms (grey) of the distribution of the deuterium excess values in the states before and after the rapid shifts. The mean values are shown as bold red lines. Due to the abruptness of the excess shifts, the ramp fitting method produces results with very small uncertainties. Therefore, we suggest that the excess record is used for defining transition points between different climatic episodes, specially for the transitions studied here (15.5 – 11.0 ka b2k), but possibly also for those found in the older part of the NGRIP record (123.0 – 15.5 ka b2k).

/ www.sciencexpress.org / 19 June 2008 / Page 5/ 10.1126/science.1157707
Table 1. Ramp fitted transitions times. Ramp fitting results (14) for stable water isotopes (δ18O), deuterium excess (d), dust content, calcium (Ca2+) and annual layer thickness (λ) over the three transitions from GS-1 into the Holocene at 11.7 ka b2k, from GI-1a into GS-1 at 12.9 ka b2k and from GS-2 into GI-1e at 14.7 ka b2k. The GICC05 time scale (2), produced by multi-proxy identification of annual layers using NGRIP impurity records, provide the ages. The timing and standard error of the ramp points are listed at the onset and termination of the transitions.
(time in years b2k) δ18O d Dust Calcium λ
Start of Holocene 11,651±13 11,701±1.5 11,661±3.0 11,672±3.0 11,691±3.0 End of GS-1 11,711±12 11,704±1.5 11,711±3.0 11,709±3.0 11,698±3.0 Start of GS-1 12,712± 74 12,896±1.5 12,735±8.9 12,737±8.9 12,787±24 End of GIS-1a 12,925±59 12,897± 3.0 12,874± 9.6 12,870±5.9 12,939±24 Start of GIS-1e 14,685±1.5 14,691± 1.5 14,657±3.0 14,659±3.0 14,661±8.9 End of GS-2 14,688± 1.5 14,694± 1.5 14,710±3.0 14,702±3.0 14,705±7.4