HIGH RESOLUTION ELECTRON MICROSCOPY - University of...
50
HIGH RESOLUTION ELECTRON MICROSCOPY BC530 Fall Quarter 2014 Wim G. J. Hol http://www.bmsc.washington.edu/WimHol/
Transcript of HIGH RESOLUTION ELECTRON MICROSCOPY - University of...

HIGH RESOLUTION ELECTRON MICROSCOPY
BC530
Fall Quarter 2014
Wim G. J. Hol
http://www.bmsc.washington.edu/WimHol/

Structure Determination by ELECTRON MICROSCOPY
STRENGTHS:- Small amounts of material usually OK- Purity often not a major issue- Maximum size of particles not any problem
WEAKNESSES:- Radiation damage- Minimum size of the particle – a few 100 kDa or more is best- Limited resolution of reconstructed image used to be low,
but is recently greatly improving, called the “resolution revolution”.

High Resolution Electron Microscopy of Biomacromolecules
PRINCIPLES

Saibil, H. R. (2000). Macromolecular structure determination by cryo-electron microscopy. Acta Cryst. D56, 1215-1222.
Figure 3
The relationship between imaging and diffraction. A simplified schematic view of imaging and diffraction shows that the waves scattered by the specimen form a Fourier transform, observed as a diffraction pattern. The objective lens in a microscope recombines the scattered waves in an inverse transformation, forming the magnified image. In the diffraction experiment, only the diffracted intensities are recorded and the lost phase information must be retrieved by other methods.

WHAT IS THE (THEORETICAL) RESOLUTION OF AN ELECTRON MICROSCOPE?
The lens aperture (expressed by its half angle, α) may limit how many diffraction orders pass ===> resolution is limited
Quantitation: If 2 image points are separated by a distance, d, then their first diffraction order will occur at an angle, q which will permit the path difference for light waves diffracted from the two points to constructively interfere; this means that the path difference, d, for the two waves must equal the wavelength, λ, of the radiation, or δ = d n sin(q) = λ where n is the index of refraction of the medium (Fig. 1b).
The resolution limit is (approximately) equal to the d which corresponds to a first order diffraction at q =α where α is the aperture half angle of the objective lens. Substituting α for q in the equation above gives:
n sin(α) is called the Numerical Aperture.
http://www.sci.sdsu.edu/Tfrey/Bio750/ElecMicroscopy.htmlElectron Microscopy

De Broglie : moving particles have a wave nature with λ = h / mv where h = Planck's const.,
m = particle mass, and v = particle velocity. Electrons have a charge and can be accelerated
in an electric potential field as well as focused by electric or magnetic fields. An electron
accelerated in a potential of V volts has kinetic energy 1/2mv2 = e.V , where e is the charge on
the electron. Solving for v and substituting into de Broglie's equation (and expanding in V to
account for the fact that the electron mass is different when moving then when at rest):
Thus, for V = 100,000 V (a typical value) λ = 0.037 Å
And for V = 1,000,000 V (High Voltage EM) λ = 0.0087 Å
What resolution can be expected?
Unfortunately, electron lenses are poor and are therefore designed with very
small apertures, of say 0.02 radians. But the small wavelength λ comes to the rescue:
With a = 0.02 radians and λ = 0.04 to 0.01 Å, and n=1, the formulad = λ/(nsin α)
Still gives a resolution d = 2 to 1 Å !I.e. the theoretical resolution is quite high and is indeed achieved with electron microscopes.
http://www.sci.sdsu.edu/Tfrey/Bio750/ElecMicroscopy.htmlElectron Microscopy

http://www.sci.sdsu.edu/Tfrey/Bio750/ElecMicroscopy.html
II. Electron Microscope Design - All optics at less than 10-5 torr !A. Source--Electron Gun
Field Emission Gun (cold cathode)
A very fine tip which is usually not heated. Instead, electrons are drawn from the tip by a sharp potential drop (electrons "tunnel" out). This type of source is very difficult to construct and maintain partially because it requires ultra-high vacuum technology, but it is 104 x brighter than a conventional filament and produces a beam of electrons with a very small spread of energies (very monochromatic and very coherent).
Electron Microscopy

http://www.snaggledworks.com/em_for_dummies/background.htmlElectron Microscopy

http://www.sci.sdsu.edu/Tfrey/Bio750/ElecMicroscopy.html
Radiation DamageA. Signal-to-Noise (S/N) for High Resolution Imaging
1. In the ideal case, the S/N is determined by the statistics of electron counting; the signal is the number of electrons scattered from a particular resolution element (pixel) while the noise is the square root of the number of incident electrons for each resolution element (the statistical variation in number of incident electrons for each pixel). Thus, in principle any resolution (up to the instrumental limitation of 1-4 Å) can be achieved for any specimen if it is imaged with enough electrons.
2. Contrast is low for biological specimens because they are composed of relative light elements which scatter electrons weakly. Thus, to produce a 10 Å resolution of a typical biological specimen, one must image it with 250 electrons/Å2 if total contrast is 2%.
B. How Sensitive Are Biological Specimens to radiation damage?
1. Specimens lose 10-30% of their mass during one exposure (10-100 el/Å2).2. Protein crystals become disordered after an exposure of 1-5 el/Å2 at 0°C.3. Enzyme activity is lost after an exposure of 0.05 el/Å2. 4. Thus, it would appear that one cannot image biological specimens at high resolution because images produced with a low enough exposure to prevent severe radiation damage would have a S/N << 1.0. The situation is much worse in the case of analytical imaging since many more electrons are required to form an image (mean free path for high energy loss event is large). But there are some limited solutions to this dilemma described below.
Electron Microscopy

High Resolution Electron Microscopy of Biomacromolecules
SPECIMEN PREPARATION
http://www.sci.sdsu.edu/Tfrey/Bio750/ElecMicroscopy.html
Specimen Preparation
Goals -- most techniques achieve only some of these goals.
1. Make thin specimens which can exist in vacuum. This usually means remove all H2O. Thin specimens are required in order to:
a. prevent absorption of electron beam
b. reduce multiple scattering
c. decrease chromatic aberration from inelastic electron scattering.
2. Increase contrast--heavy atom stain
3. Decrease radiation damage
a. heavy atom stain distribution less sensitive to radiation
b. less damage at low temperatures
Electron Microscopy

http://www.sci.sdsu.edu/Tfrey/Bio750/ElecMicroscopy.html
NEGATIVE STAIN - particles (enzymes, viruses), membrane fragments.
1. Adsorb specimen to support film--thin carbon film over electron microscope grid.2. Rinse with heavy atom solution--e.g. 1-2% uranyl acetate, uranyl formate, or
phosphotungstate--draw off excess and dry.3. As it dries, the stain forms a glassy electron dense replica of specimen. Stain-excluding areas
(volumes) appear light in the image.
UNSTAINED SPECIMENS1. Environmental stage--maintain H2O vapor around specimen by differential pumping; isolate
specimen area with small apertures above and below so higher concentration of H2O can be maintained around it. Seldom used.
2. Freeze-dry or critical point dry--to remove H2O without totally disrupting the structure.3. Embed in glucose (sugar) syrup by drying in thin layer of 1% glucose.
a. -OH's of sugar mimic polar H2Ob. supports specimen from collapse during dryingc. reduces contrast however; glucose has density similar to protein.
4. FROZEN-HYDRATED SPECIMENS -- best methoda. freeze specimen rapidly in thin layer of vitreous (non crystalline) iceb. "natural" aqueous environmentc. ice shows protein in positive contrastd. can irradiate with 5-10x more electrons at low tempe. requires special stages
Electron Microscopy

High Resolution Electron Microscopy of Biomacromolecules
IMAGE PROCESSING

Adapted from: http://www.sci.sdsu.edu/Tfrey/Bio750/ElecMicroscopy.html
Image Processing--How can it help?
A. IMAGE RESTORATION -- correct aberrations of the “phase contrast transfer function”(sometimes called the "point spread function" of the imaging system). Most easily accomplished byoperation on the Fourier transform.
B. CORRECT FOR PARTICLE SHIFTS DURING ELECTRON BOMBARDMENT
C. SIGNAL AVERAGING -- improve low signal-to-noise ratio by adding images of identicalstructures together.
Remember: Low exposures required to prevent radiation damage in unstained specimens result in poor S/N in the Image
1. Average unit cells in a crystal -- Electron Crystallography a. Digitize and calculate the Fourier transform of the image which is non-zero only at points of a
Reciprocal Lattice for perfect crystals. Spacings of the reciprocal lattice are the inverse of those of the crystal lattice.
b. Reconstruct average image of all unit cells by inverse Fourier transformation (Fourier synthesis)using only information at Reciprocal Lattice points.
2. Average individual particles by Correlation Methods and Correspondence Analysis. Correspondence Analysis sorts images of individual particles into groups which are similar to one another. Images of individual particles which are similar in structure can be averaged together using Correlation methods to bring them all into a common alignment.

Saibil, H. R. (2000). Macromolecular structure determination by cryo-electron microscopy. Acta Cryst. D56, 1215-1222.
Figure 1 EM sample geometry. A variety of macromolecular assemblies, both ordered and as individual complexes, can be analysed by cryo-EM. Of the ordered assemblies, the 2D crystalsare the ones which have yielded atomic resolution structures. However, they must be tilted to high angles to provide 3D data. The helical assemblies are only crystalline in one dimension and the varying orientation of the subunit around the helical axis is useful in providing a set of different views. No crystallization or naturally occurring order is necessary in the case of single particles (isolated complexes in solution), provided they are large enough to be detected and analysed. Single particles can range from highly symmetric, such as the icosahedral viruses, to asymmetric structures, such as the ribosome.

High Resolution Electron Microscopy of Biomacromolecules
IMAGE RECONSTRUCTIONfrom
TWO-DIMENSIONAL CRYSTALS

Data-collection geometry for 2D crystals. Each lattice line will have a continuously varying amplitude and phase along its Z coordinate. The tilted views sample the lattice lines at different heights in Fourier space. Most of the 3D FT can be determined by combining these sections derived from different tilt views in projection. However, in EM of 2D crystals there is a missing cone of information because the maximum tilt angle of the crystal is limited to about 60 degrees.
Saibil, H. R. (2000). Macromolecular structure determination by cryo-electron microscopy. Acta Cryst. D56, 1215-1222.
Data-collection geometry for 2D crystals.

Figure 5. 2D crystals of the Arabidopsis thaliana plasma membrane H+-ATPase, grown on a layer of lipids 2 and 3 after removal of the detergent, dodecyl-β-D-maltoside, by adsorption to Bio-Beads1.
Crystals were stained with 2% (w/w) uranyl acetate as a contrasting agent.
(a) Overview of a large crystalline area.
(b) The rectangular crystal lattice is visible at higher magnification.
2D crystals
LeBeau, L., Lach, F., Vénien-Bryan, C., Renault, A., Dietrich, J., Jahn, T., Palmgren, M. G., Kühlbrandt, W. & Mioskowski, C. (2001). Two-dimensional crystallization of a membrane protein on a detergent-resistant lipid monolayer.
J. Mol. Biol. 308, 639-647.

LeBeauet al. (2001). Two-dimensional crystallization of a membrane protein on a detergent-resistant lipid monolayer. J. Mol. Biol. 308, 639-647.
Figure 6. (a) Structure factors in one reciprocal lattice plane of a 2D crystal of the Arabidopsis plasma membrane H+-ATPase.
The image was obtained by electron cryo-microscopy and image processing of unstained 2D crystals.
The size of the square and the number reflect the signal-to-noise ratio of the computed Fourier component.
The resolution at the edge of the plot is 9 Å .
b) Projection map of the plasma membrane H+-ATPase at 9 Å resolution calculated from merged amplitudes and phases from five independent crystals.
Solid lines indicate density above the mean. Negative contours are indicated by dotted lines.
The monomer boundary cannot be defined with certainty in the projection map but comparison with the projected structure of the Neurosporaenzyme suggests the outlined shape of the monomer.
From 2D crystals to diffraction to map

Aquaporin 0 main chain surrounded by lipids
Gonen et al & Waltz Nature 438: 633 (2005)
Electron cryo-crystallography at atomic resolution
Phases from molecular replacement model. Individual waters and well defined phenyl
ring at 1.9 Å resolution
2D crystals
Electron diffraction pattern

High Resolution Electron Microscopy of
Biomacromolecules
IMAGE RECONSTRUCTIONfrom
HELICAL OBJECTSPRESENTLY:
Helical reconstructions are following the same strategy as used for “single particle averaging” discussed later.
In this case, the “particles” are short stretches of well-defined helices.

Lepault, Structural polymorphism of the major capsid protein of rotavirus. EMBO J. 20, 1498-1507. (2001)
Fig. 2. Electron microscopy by negative staining of Rotavirus capsid VP6 assemblies. (a) 45-nm-diameter tubes; (b) 75 nm-diameter tubes.
Surprisingly the same protein gave two different types of hollow helices.
The next step is to determine the helical parameters.I.e. the helical twist and the translation parallel to the helix axis.
Reconstruction of Helical Particles

ROTAVIRUS CAPSID PROTEIN HELICES
Fig. 6. Sections and three-dimensional representation of the reconstruction of the small (A and C) and large tubes (B and D).
Reconstruction of Helical Particles (ctd.)
Lepault, Structural polymorphism of the major capsid protein of rotavirus. EMBO J. 20, 1498-1507. (2001)

High Resolution Electron Microscopy of Biomacromolecules
IMAGE RECONSTRUCTIONfrom
ICOSAHEDRAL OR OTHER
HIGH-SYMMETRY OBJECTS

Icosahedral Symmetry – 60 subunits (or multiples thereof)
Approximate shape of an icosahedron.
But the shape is irrelevant. The fact that all symmetry axes are known without any error, as well as that these intersect in exactly one point, the particle center, is the power of
averaging this type of particles.
(In addition, these spherical particles are often quite sturdy)Arnthor Aevarsson
Icosahedral Symmetry

Figure 2
(a) The capsid of hepatitis B virus as determined by
3D reconstruction to 9 Å resolution;
(b) a molecular model of the dimer of 149-residue subunits that serves as its building block.
The sites of the three Reference points marked – the N terminus, the C Terminus, and an internal peptide (residues 78–83) – were determined by high-resolution cryo-electron microscopy (cryo-EM) labeling techniques.
.
Reconstruction from High-Symmetry Particles
Baumeister, W. & Steven, A. C. (2000). Macromolecular electron microscopy in the era of structural genomics. Trends Biochem. Sci. 25, 624-631.

Baumeister, W. & Steven, A. C. (2000). Macromolecular electron microscopy in the era of structural genomics. Trends Biochem. Sci. 25, 624-631.
BINDING OF POLIOVIRUS TO ITS RECEPTOR (PVR).
Cryo-electron microscopic (cryo-EM) reconstruction of poliovirus (red) with the water-soluble ectodomain of Pvr (green) stoichiometrically bound.
The reconstruction clearly shows two carbohydrate moieties (arrows) attached to domain 2.
Reconstruction from High-Symmetry Particles

High Resolution Electron Microscopy of
Biomacromolecules
IMAGE RECONSTRUCTIONfrom
“SINGLE-PARTICLE ANALYSIS”
(SPA)

Left: A virus particle on a carbon support film is shown in schematic side view. The particle is outlined with good contrast by heavy-metal stain, but is somewhat flattened by the accompanying dehydration.
Right: It is preserved in the native hydrated state in the cryosample but the protein-ice contrast is very low. In order to maximize the contrast, the cryo-specimen is imaged over holes in the carbon support film.
Fig 4 from : Saibil, H. R. (2000). Macromolecular structure determination by cryo-electron microscopy. Acta Cryst. D56, 1215-1222.
Negative-stain vs. cryo-EM.

For high (cryo) electron microscopy resolution studies, holey grids are used.
Similar to normal carbon coated grids, holey grids are covered with a fine layer of carbon. However, as part of the preparation process, the carbon film is deposited in such a way that there are holes of a desired size in the carbon.
One of the purposes of these holes is to eliminate any absorption and scattering of the electron beam by the carbon film, which will generate noise and obstruct the signal. The holes also allow for "pockets" of solvent to form. Within these pockets, the specimen remains fully hydrated, even when the sample has been frozen.
http://www.snaggledworks.com/em_for_dummies/grids.html
Holey grids
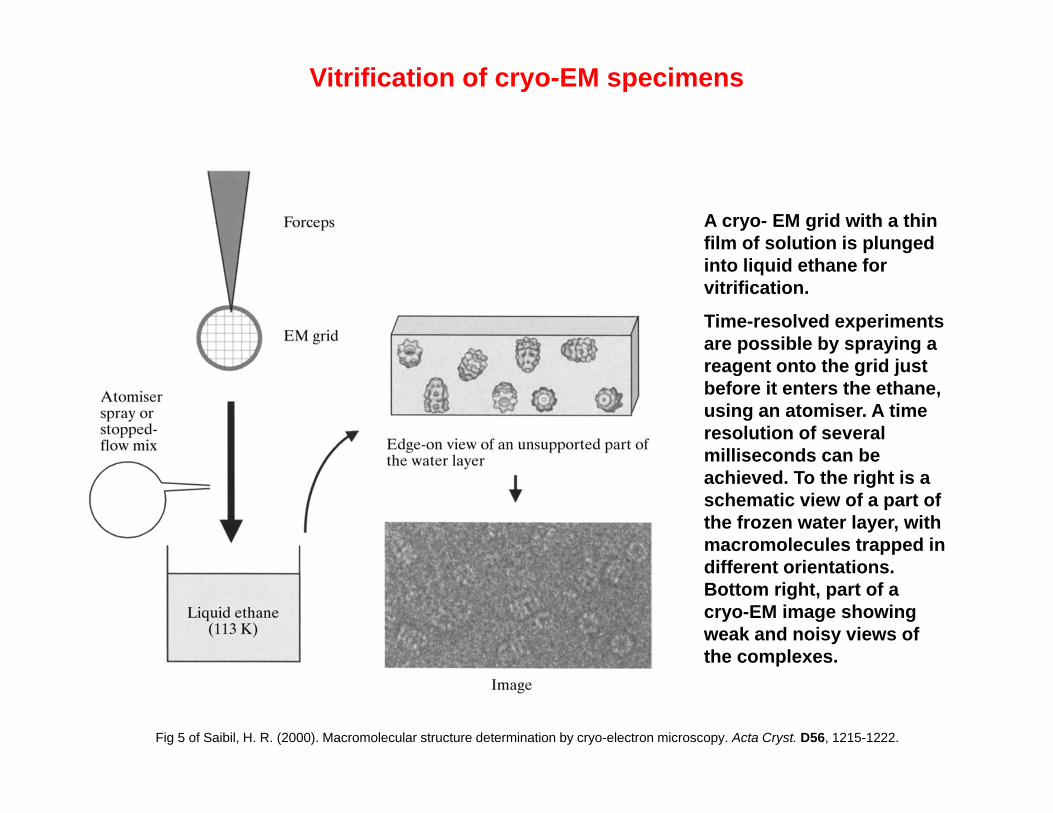
A cryo- EM grid with a thin film of solution is plunged into liquid ethane for vitrification.
Time-resolved experiments are possible by spraying a reagent onto the grid just before it enters the ethane, using an atomiser. A time resolution of several milliseconds can be achieved. To the right is a schematic view of a part of the frozen water layer, with macromolecules trapped in different orientations. Bottom right, part of a cryo-EM image showing weak and noisy views of the complexes.
Fig 5 of Saibil, H. R. (2000). Macromolecular structure determination by cryo-electron microscopy. Acta Cryst. D56, 1215-1222.
Vitrification of cryo-EM specimens

The Vitrobot™, produced by Maastricht Instruments, is computer controlled to simplify and automate the vitrification of liquid samples.
http://www.snaggledworks.com/em_for_dummies/freeze.html
The freezing chamber of Vitrobot™ with a grid suspended before freezing, and after dunking into liquid ethane (bottom)
Ethane
Grid
Liq N2

CCD Direct Detector
scatter within the scintillator = noise
in image
Direct detect cameras
Courtesy Justin Kollman

Advantages of next generation direct detectors
• Greatly reduced noise from the detection device
• Direct counting of electrons essentially eliminates noise
• Subpixel resolution detection of electron events
• Fast frame rate = movies = correction of beam-induced motion possible!
Courtesy Justin Kollman

Courtesy Justin Kollman
Resolution improvement with subframe alignment

Previous reconstructions at ~4.5 Å resolution needed ~1 million particles!In some recent cases still many particles are used, and including symmetry, then up to 1.7 million so-called “asymmetric units” are sometimes
averaged. But there is also a report that 10,000 particles can yield 3.6 A resoltuion.
Effect of particle number on resolution
Courtesy Justin Kollman; with additional information from David Veesler

An example of the effectiveness of edge detection.
(a) A micrograph showing ice-embedded ribosome particles.
(b) An edge image obtained by applying the Shen–Castan edge detector (Shen and Castan, 1992) to the image in (a). The edge image was computed using the Shen program. Source code for the Shen program together with other image processing software is available from Parker (1997).
Fig 3 of Nicholson, W. V. & Glaeser, R. M. (2001). Review: Automatic particle detection in electron microscopy. J. Struct. Biol. 133, 90-101.
Automatic particle detection

0˚ 3˚ 6˚ 9˚ 12˚ 15˚ 18˚
Reference Projections
Initial Model:Cylinder
Generate all side-view projections
input overlapping helical segment images
Multi-reference alignment
assign anglesreject particles with poor
helical alignment
Back Projection
Provides constraints onparticle orientations
Determine optimal helical symmetry, impose on
new volume
helix segments
Treat helical segments as individual particlesbut use helical symmetry constraints
Iterative Helical Real Space Reconstruction
Courtesy Justin Kollman
Allows unique helical symmetryto be determined

0˚ 3˚ 6˚ 9˚ 12˚ 15˚ 18˚
Reference Projections
Generate all side-view projections
input overlapping helical segment images
Multi-reference alignment
assign anglesreject particles with poor
helical alignment
Back Projection
Current Model
Iterative Helical Real Space Reconstruction
Determine helical symmetry,
impose on new volume
helix segments
Provides constraints onparticle orientations
Courtesy Justin Kollman
Allows unique helical symmetryto be determined
Treat helical segments as individual particlesbut use helical symmetry constraints

initial model
round 2 3 4 5 10 15
unsymmetrized
symmetrized
TuSC filament reconstruction
51.2500
52.5000
53.7500
55.0000
56.2500
57.5000
0 5 10 15 20
Rot
atio
n pe
r sub
unit
Reconstruction round
helical symmetry
refinement
repeat iterative reconstruction with multiple initial symmetry estimates - should converge on same values each time. If not, indicative of heterogeneity in the helical symmetry
Iterative Helical Real Space Reconstruction
Courtesy Justin Kollman

Fig 1 from Ruprecht, J. & Nield, J. (2001).
Determining the structure of biological macromolecules by transmission electron
microscopy, single particle analysis and 3Dreconstruction.
Prog. Biophys. Mol. Biol.75, 121-164.
Single particle analysis, image processing and 3D reconstruction: a flow chart summarizing the key steps.
The process is highly iterative.
And can be very
computer power
demanding
.

Fig 2 from Saibil, H. R. (2000). Macromolecular structure determination by cryo-electron microscopy.
Acta Cryst. D56, 1215-1222.
A set of four different molecular orientations, displayed as rendered iso-surfaces, are shown above their corresponding 2D projections. Real cryo-EMimages are very noisy versions of these projections. The Fourier transform of each projection, shown below the projections, is a section through the 3D Fourier transform of the structure (DeRosier & Klug, 1968). The 3D transform is represented by two intersecting transform sections, derived from the side and end views of the structure. Once enough sections are available, the full 3D transform can be interpolated and inverse transformed into a 3D density map. The map is shown with the backbone of the structure to emphasize the fact that the full 3D density is obtained, including internal features. Surface rendering is generally used to represent such maps when the resolution is insufficient to provide an atomic model of the structure.
The principle of 3D reconstruction from 2D projections

Refinement by projection matching.A 3D map is projected into a set of different orientations to create reference images. Each raw image in the data set is translationally and rotationally aligned to each reference image in turn and is assigned the orientation of the one giving the highest correlation coefficient. The aligned images are grouped and averaged and these averages are used to create an improved 3D map. The procedure is iterated until the maps converge. Reprojections of the maps are compared to the preceding set of class averages to check for consistency.
Fig 11 of Saibil, H. R. (2000). Macromolecular structure determination by cryo-electron microscopy. Acta Cryst. D56, 1215-1222.

Cryo-EM data and processing. (A) Sucrose gradient purification of Pf80S ribosomes. (B) Representative electron micrograph showing Pf80S particles. (C) Fourier Shell Correlation (FSC) curves indicating the overall resolutions of unmasked (red), Pf40S masked (green) and Pf60S masked (blue) reconstructions of the Pf80S–emetine complex. (D) Representative density with built models of a β-strand with well-resolved side chains (left), an RNA segment with separated bases (middle), and a magnesium ion (green sphere) that is coordinated by RNA backbonephosphates. (E) Density maps colored according to local resolution for the unmasked Pf80S(left) and masked Pf40S and Pf60Ssubunits (right).
Wong, Cryo-EM structure of the Plasmodium falciparum 80S ribosome bound to the anti-protozoan drug emetine. eLife 2014;3:e03080.
The Malaria ribosome at 3.2 Angstroms resolution

Wong, Cryo-EM structure of the Plasmodium falciparum 80S ribosome bound to the anti-protozoan drug emetine. eLife 2014;3:e03080.
The Malaria ribosome at 3.2 Angstroms resolution
Cryo-EM data and processing.
• isolated from the 3D7 strain of P. falciparum parasites maintained in human erythrocytes (Figure 1A,B). Limitations in parasite culture volume, yielding ∼1010 parasitized red blood cells and low yield of sample material (1 g of parasites yielded 0.35 mg Pf80S)
• Aliquots of 3 μl of purified Pf80S at a concentration of ∼160 nM (∼0.5 mg/ml) were incubated for 30 s on glow-discharged holey carbon grids (Quantifoil R1.2/1.3), on which a home-made continuous carbon film (estimated to be ∼30 Å thick) had previously been deposited.
• Grids were blotted for 2.5 s and flash frozen in liquid ethane using an FEI Vitrobot.
• For the empty Pf80S sample, grids were transferred to an FEI Titan Krios electron microscope that was operated at 300 kV. Images were recorded manually during two non-consecutive days on a back-thinned FEI Falcon II detector at a calibrated magnification of 135,922 (yielding a pixel size of 1.03 Å). Defocus values in the final data set ranged from 0.7 to 3.9 μm.
• To prepare the Pf80S–emetine sample, purified Pf80S at 160 nM was incubated with a 1 mMsolution of emetine in 20 mM Hepes pH7.4, 40 mM KCH3COO, 10 mM NH4CH3COO, 10 mMMg(CH3COO)2,and 5 mM 2-mercaptoethanol for 15 min at 25°C prior to blotting and freezing as described above.
• Pf80S–emetine grids were transferred to an FEI Tecnai Polara electron microscope that was operated at 300 kV.
• Images were recorded manually during two non-consecutive days on a back-thinned FEIFalcon II detector at a calibrated magnification of 104,478 (yielding a pixel size of 1.34 Å).

ELECTRON TOMOGRAPHY
Key paper:
“Electron Tomography: towards visualizing the molecular organization of the cytoplasm”.
Wolfgang Baumeister
Current Opinion in Structural Biology 12, 679-684 (2002)

(Radiation Damage the main enemy: high resolution requires many projections!)
a. Collect 2D-images of projections in different
directions through 3D-object
b. Reconstruct 3D-object from 2D-projections
Electron Tomography (ET)The Principle
Koster et al, J. Structural Biology, 120: 276-308 (1997)

Fig. 2. Segmented surface rendering of a single virion tomogram after denoising. (A) Outer surface showing the distribution of glycoprotein spikes (yellow) protruding from the membrane (blue). (B) Cutaway view of the virion interior, showing the capsid (light blue) and the tegument "cap" (orange) inside the envelope (blue and yellow). pp, proximal pole; dp, distal pole. Scale bar, 100 nm.
Three-Dimensional Structure of Herpes Simplex Virus from Cryo-Electron Tomography
Gruenewald et al & Baumeister & Steven, Science 2003.

(A) A 32-nm tomographic slice through the nuclear envelope of a human fibroblast shows a central slice through an Nuclear Pore Complex (NPC), which fuses the inner and outer nuclear membranes (INM and ONM, respectively). Scale bar: 100 nm.
(B)�Stereo-view representation of an averagedreconstructed volume of the human NPC. The central spoke ring is flanked by the cytoplasmic ring (arrowheads) and the nuclear ring.
(C) Schematic representation of the nuclear envelope on the basis of cryo-ET of intact nuclei.The ONM is decorated with ribosomes (red), and the ONM and INM (yellow) are fused at the NPC (blue). Nuclear lamins (purple) are seen underlying theINM and interacting with the NPC via the nuclear basket (green).
The structure of the lamin filaments was adapted from an in vitro cryo-ET study of the Caenorhabditiselegans lamin filaments (Ben-Harush et al., 2009).
Cryo-Electron Tomography of the Nuclear Envelope
Ben-Harusch J Cell Science 2010 [doi:10.1242/jcs.060111]

CONCLUDING REMARKS
Biomolecular Electron Microscopy is at present undergoing a tremendous development with a
continuous improvement of instrumentation and computational techniques.
It will be fascinating to see where BiomolecularElectron Microscopy will be in, say, 2020.