High-purity separation of cancer cells by optically ...
10
High-purity separation of cancer cells by optically induced dielectrophoresis Hsiu-Hsiang Chen Mai-Wei Lin Wan-Ting Tien Chin-Pen Lai Kuo-Yao Weng Ching-Huai Ko Chun-Chuan Lin Jyh-Chern Chen Kuo-Tung Tiao Tse-Ching Chen Shin-Cheh Chen Ta-Sen Yeh Chieh-Fang Cheng Downloaded From: https://www.spiedigitallibrary.org/journals/Journal-of-Biomedical-Optics on 21 Mar 2022 Terms of Use: https://www.spiedigitallibrary.org/terms-of-use
Transcript of High-purity separation of cancer cells by optically ...
High-purity separation of cancer cellsby optically induced dielectrophoresis
Hsiu-Hsiang ChenMai-Wei LinWan-Ting TienChin-Pen LaiKuo-Yao WengChing-Huai KoChun-Chuan LinJyh-Chern ChenKuo-Tung TiaoTse-Ching ChenShin-Cheh ChenTa-Sen YehChieh-Fang Cheng
Downloaded From: https://www.spiedigitallibrary.org/journals/Journal-of-Biomedical-Optics on 21 Mar 2022Terms of Use: https://www.spiedigitallibrary.org/terms-of-use

High-purity separation of cancer cells by opticallyinduced dielectrophoresis
Hsiu-Hsiang Chen,a,* Mai-Wei Lin,a Wan-Ting Tien,a Chin-Pen Lai,a Kuo-Yao Weng,a Ching-Huai Ko,aChun-Chuan Lin,a Jyh-Chern Chen,a Kuo-Tung Tiao,a Tse-Ching Chen,b Shin-Cheh Chen,bTa-Sen Yeh,b,* and Chieh-Fang Chenga,*aIndustrial Technology Research Institute, P.O. Box 31054, Room 308, Building 78, 195, Section 4, Chung Hsing Road, Chutung, Hsinchu, TaiwanbChang Gung University, Chang Gung Memorial Hospital, P.O. Box 33305, 259 Wen-Hwa 1st Road, Kwei-Shan Tao-Yuan, Taiwan
Abstract. Detecting and concentrating cancer cells in peripheral blood is of great importance for cancer diag-nosis and prognosis. Optically induced dielectrophoresis (ODEP) can achieve high resolution and low opticalintensities, and the electrode pattern can be dynamically changed by varied light patterns. By changing theprojected light pattern, it is demonstrated to separate high-purity gastric cancer cell lines. Traditionally, the purityof cancer cell isolation by negative selection is 0.9% to 10%; by positive selection it is 50% to 62%. An ODEPtechnology is proposed to enhance the purity of cancer cell isolation to about 77%. © 2014 Society of Photo-Optical
Instrumentation Engineers (SPIE) [DOI: 10.1117/1.JBO.19.4.045002]
Keywords: optically induced dielectrophoresis; projector; light; cancer cells; polystyrene beads; isolate.
Paper 130908R received Dec. 26, 2013; revisedmanuscript receivedMar. 12, 2014; accepted for publication Mar. 14, 2014; publishedonline Apr. 10, 2014.
1 IntroductionThe early detection of circulating tumor cells (CTCs) in patientblood is a significant indicator for cancer prognosis andtherapy. Because of very few numbers of CTCs, these cellsare not easily detected. The ability to detect and concentrateCTCs1–6 in peripheral blood is of great importance for cancerresearch and treatment. Therefore, there are a growing numberof studies in improving the way CTCs are captured, isolated,enumerated, and characterized. Traditionally, the purity ofcancer cell isolation by negative selection is 0.97% to 10%;7
by positive selection it is 50% to 62%.8 By using microfluidicsorting methods, the purity can be much improved; they can beclassified into biochemical and biophysical methods. Thebiochemical methods include fluorescence sorting,9 immuno-magnetic separation,10 and adhesion based methods.11 The bio-physical methods include filters,12 hydrodynamic sorting,13
deterministic lateral displacement,14 inertial separation,15 acous-tophoresis,16 optical tweezers,17 electrophoresis,18,19 and dielec-trophoresis (DEP).20 Among them, the DEP force can achievehigh throughput and manipulation of cells. The opticallyinduced dielectrophoresis (ODEP) operating principle is byusing light to induce a nonuniform electrostatic field andmanipulate micron particles (beads, carbon nanotubes, orcells). ODEP21,22 can achieve high resolution and low opticalintensities (∼102 W∕cm2), and the electrode pattern can bedynamically changed by varied light pattern. Huang et al.23
developed an ODEP system to isolate CTCs; however,ODEP-based methods currently lag in performance in bothselectivity (cancer cells enrichment over leukocytes typically100) and throughput (typically, 1 ml∕h). We propose thatapplying antibody-conjugated beads to cells can enhanceODEP force and improve selectivity and throughput of thesystem.
2 Materials and Methods
2.1 Detection Principle
2.1.1 ODEP chip structure and system
The ODEP force applied to the micron (sized) spherical particlescan be described by the following DEP force equation:
FDEP ¼ 2πr3εmRe½KðωÞ�∇E2;
where r, εm, Re½KðωÞ�, and E represent the micron particlesradius, the permittivity of medium, the real part of theClausius–Mossotti factor, and the root-mean-square electricfield strength, respectively. For a single-shell model, theKðωÞ can be described by the following DEP force equation:22
KðωÞ ¼ ε�p − ε�mε�p þ 2ε�m
ε�p ¼ εp − jσpω
ε�m ¼ εm − jσmω
;
where ε�p, ε�m, σp, σm, and ω represent the permittivity of micronparticles, the permittivity of medium, the conductivity of micronparticles, the conductivity of medium, and the angular frequencyof the electric field, respectively.
A dielectric particle within a nonuniform electrostatic fieldcan experience a positive or negative force. In negative valuesof Re½KðωÞ�, the particles can be repelled from minimumelectrostatic field, i.e., particles are pushed away from the pro-jected light pattern. For positive values of Re½KðωÞ�, the par-ticles can be attracted to minimum electrostatic field, i.e.,particles are dragged by the projected light pattern. TheODEP chip structure and system are shown separately inFigs. 1 and 2. The system is divided into three parts: virtual elec-trodes generation system, ODEP chip, and image acquisitionsystem. The optical patterns of the virtual electrode are
*Address all correspondence to: Hsiu-Hsiang Chen, E-mail: [email protected]; Ta-Sen Yeh, E-mail: [email protected]; Chieh-FangCheng, E-mail:[email protected] 0091-3286/2014/$25.00 © 2014 SPIE
Journal of Biomedical Optics 045002-1 April 2014 • Vol. 19(4)
Journal of Biomedical Optics 19(4), 045002 (April 2014)
Downloaded From: https://www.spiedigitallibrary.org/journals/Journal-of-Biomedical-Optics on 21 Mar 2022Terms of Use: https://www.spiedigitallibrary.org/terms-of-use
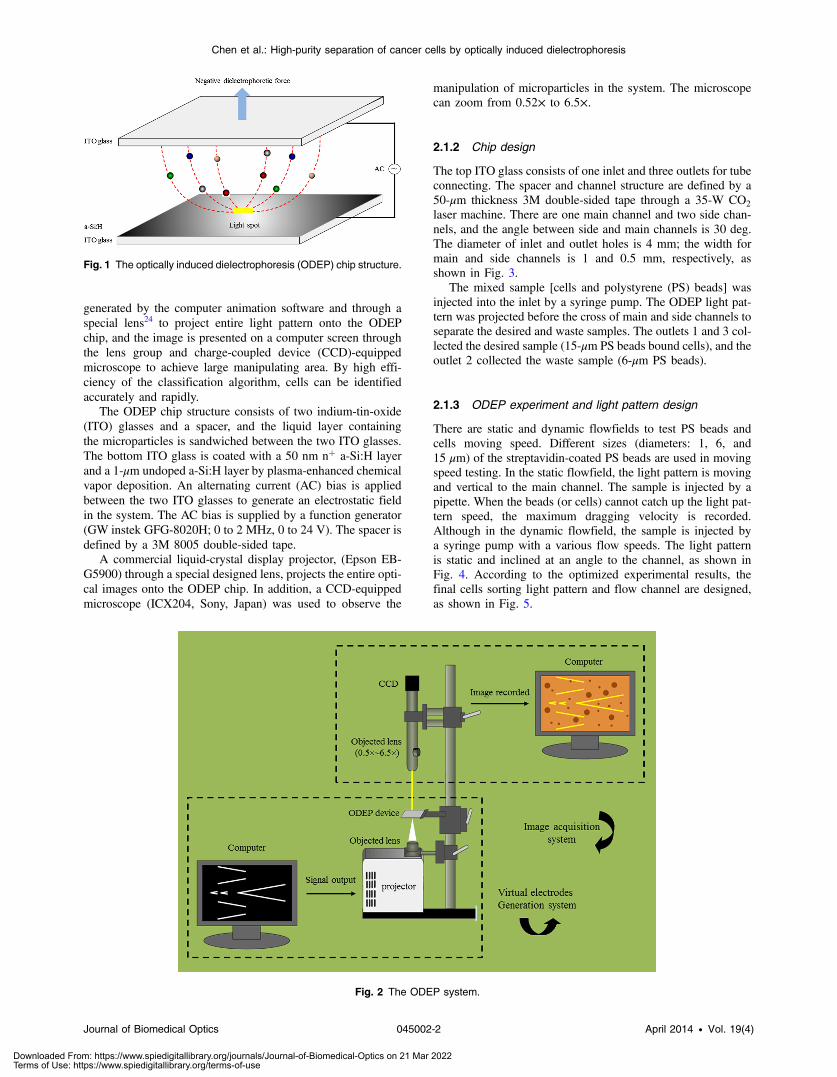
generated by the computer animation software and through aspecial lens24 to project entire light pattern onto the ODEPchip, and the image is presented on a computer screen throughthe lens group and charge-coupled device (CCD)-equippedmicroscope to achieve large manipulating area. By high effi-ciency of the classification algorithm, cells can be identifiedaccurately and rapidly.
The ODEP chip structure consists of two indium-tin-oxide(ITO) glasses and a spacer, and the liquid layer containingthe microparticles is sandwiched between the two ITO glasses.The bottom ITO glass is coated with a 50 nm nþ a-Si:H layerand a 1-μm undoped a-Si:H layer by plasma-enhanced chemicalvapor deposition. An alternating current (AC) bias is appliedbetween the two ITO glasses to generate an electrostatic fieldin the system. The AC bias is supplied by a function generator(GW instek GFG-8020H; 0 to 2 MHz, 0 to 24 V). The spacer isdefined by a 3M 8005 double-sided tape.
A commercial liquid-crystal display projector, (Epson EB-G5900) through a special designed lens, projects the entire opti-cal images onto the ODEP chip. In addition, a CCD-equippedmicroscope (ICX204, Sony, Japan) was used to observe the
manipulation of microparticles in the system. The microscopecan zoom from 0.52× to 6.5×.
2.1.2 Chip design
The top ITO glass consists of one inlet and three outlets for tubeconnecting. The spacer and channel structure are defined by a50-μm thickness 3M double-sided tape through a 35-W CO2
laser machine. There are one main channel and two side chan-nels, and the angle between side and main channels is 30 deg.The diameter of inlet and outlet holes is 4 mm; the width formain and side channels is 1 and 0.5 mm, respectively, asshown in Fig. 3.
The mixed sample [cells and polystyrene (PS) beads] wasinjected into the inlet by a syringe pump. The ODEP light pat-tern was projected before the cross of main and side channels toseparate the desired and waste samples. The outlets 1 and 3 col-lected the desired sample (15-μm PS beads bound cells), and theoutlet 2 collected the waste sample (6-μm PS beads).
2.1.3 ODEP experiment and light pattern design
There are static and dynamic flowfields to test PS beads andcells moving speed. Different sizes (diameters: 1, 6, and15 μm) of the streptavidin-coated PS beads are used in movingspeed testing. In the static flowfield, the light pattern is movingand vertical to the main channel. The sample is injected by apipette. When the beads (or cells) cannot catch up the light pat-tern speed, the maximum dragging velocity is recorded.Although in the dynamic flowfield, the sample is injected bya syringe pump with a various flow speeds. The light patternis static and inclined at an angle to the channel, as shown inFig. 4. According to the optimized experimental results, thefinal cells sorting light pattern and flow channel are designed,as shown in Fig. 5.
Fig. 1 The optically induced dielectrophoresis (ODEP) chip structure.
Fig. 2 The ODEP system.
Journal of Biomedical Optics 045002-2 April 2014 • Vol. 19(4)
Chen et al.: High-purity separation of cancer cells by optically induced dielectrophoresis
Downloaded From: https://www.spiedigitallibrary.org/journals/Journal-of-Biomedical-Optics on 21 Mar 2022Terms of Use: https://www.spiedigitallibrary.org/terms-of-use

2.2 Sample Preparation
Two kinds of cancer cells are prepared for the ODEP experi-ment: AGS (gastric cancer cells) and MCF-7 (human breastcancer cells). The prepared PS microbeads (diameters: 1, 6,and 15 μm) were suspended in a 0.1% bovine serum albumin(BSA, Sigma, Taiwan). The human monocytic leukemia cellline (THP-1) is prepared in an 8.5% sucrose solution (Sigma,cat. No.S0389, Taiwan).
2.2.1 Cell culture
Breast and gastric cancer cell lines were purchased fromAmerican Type Culture Collection (ATCC, Virginia) andBioresource Collection and Research Center (BCRC,Taiwan). Cells were cultured in DMEM (Gibco, Carlsbad,California) with 10% FBS and 100-mM nonessential aminoacids (Gibco, Carlsbad, California).
2.2.2 Beads conjugation
Biotin-labeled antihuman EpCAM antibody (VU-1D9) was pur-chased from GeneTex (Irvine, California). Different sizes ofstreptavidin-coated PS beads (1, 6, 15 μm) were purchased(Polysciences, Warrington, Pennsylvania). Detailed procedureswere described in user’s manual from the vendor. In brief,
proper amount of antibody and beads were mixed thoroughlyon ice for 30 min. The mixture was washed twice with washbuffer. Unbound antibodies were collected and quantified todetermine the conjugation efficiency.
2.2.3 Viability assay
Cells were incubated in different isotonic sugar solutions for 1,2, 4, and 6 h. Total cell number and cell viability were detectedby ADAM auto cell counter (Bulldog Bio Inc., Portsmouth,New Hampshire).
2.2.4 Fluorescence activated cell sorting analysis
Cells were incubated with dye-labeled monoclonal antibodiesagainst target molecules for 30 min on ice. Stained cellswere then washed twice and resuspended in cold buffer and ana-lyzed with a fluorescence activated cell sorting (FACS) can flowcytometry (BD Biosciences, San Jose, California). More than1 × 105 cells were analyzed for each sample, and the resultswere processed by using WinMDI 2.8 software (ScrippsResearch Institute, La Jolla, California).
3 Results and Discussions
3.1 Expression of EpCAM in Breast and GastricCancer Cell Lines
The major challenge in identifying CTCs is to distinguish CTCswith other cells in circulation, such as red blood cells (RBCs)and white blood cells. It is widely accepted that EpCAM ishighly expressed in cells from epithelial origin but not inblood cells. Therefore, EpCAM is used as a marker for enrichingCTCs.25
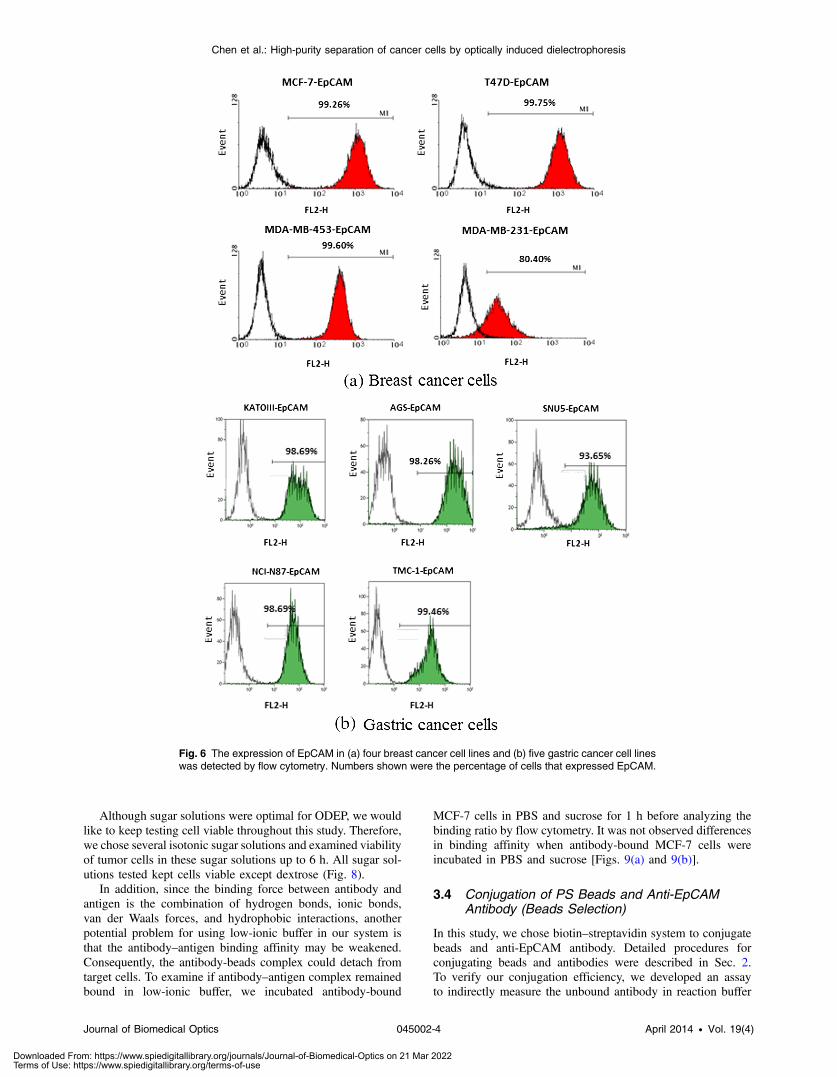
To choose the optimal cell model for this study, we tested theexpression of EpCAM in four different breast cancer cell linesand five different gastric cancer cell lines. Among the testedbreast cancer cell lines, MCF-7, T47D, and MDA-MB 453showed complete expression of EpCAM (>99%), andMDA-MB-231 showed partial expression of EpCAM (80%)[Fig. 6(a)]. Among the tested gastric cancer cell lines, KATOIII, NCI-N87, AGS, and TMC-1 showed complete expressionof EpCAM (>98%), and SNU5 also showed high percentageof EpCAM expression (94%) [Fig. 6(b)].
3.2 Processes of Enriching CTCs by ODEP (AssayFlow Chart)
To enrich CTCs by ODEP system, we designed a series of pro-cedures to maximize the efficiency of CTCs enrichment. TheRBCs were lysed before labeling target cells with beads-conju-gated anti-EpCAM antibody. Afterward, cells were sorted byODEP system and the enrichment efficiency was veri-fied (Fig. 7).
3.3 Buffer Selection for ODEP (Cell Survival inDifferent Low-Ionic Buffer)
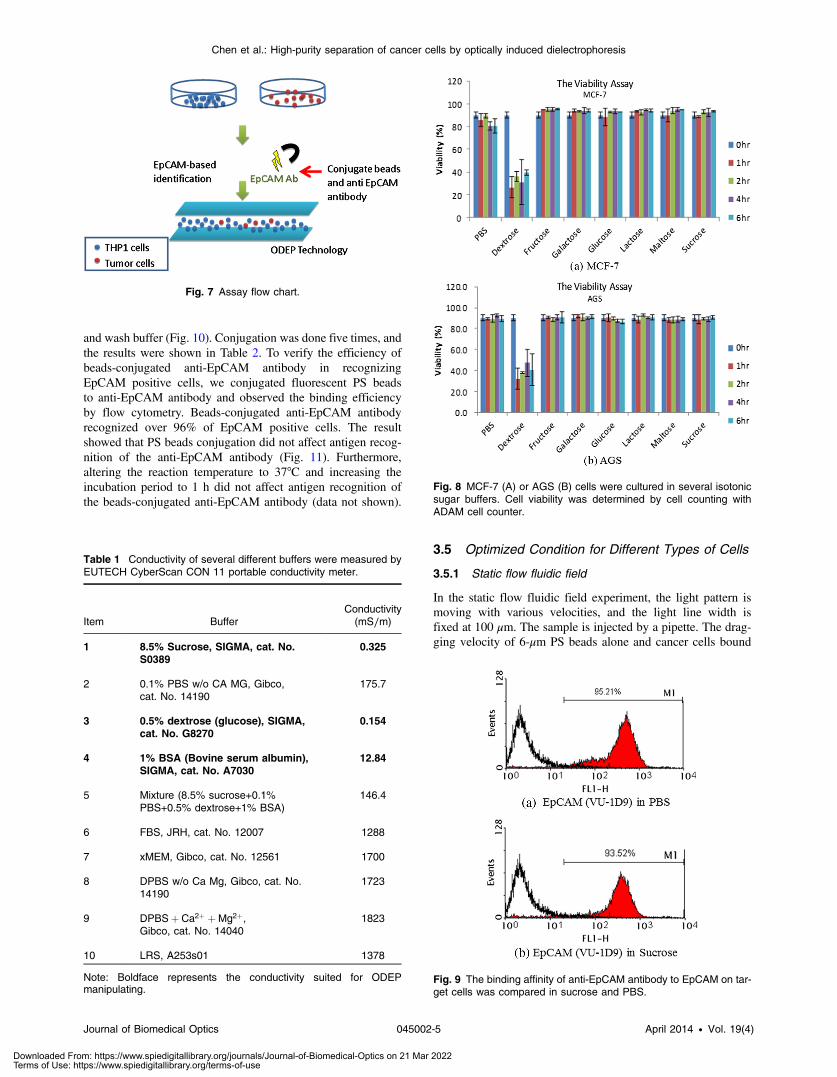
Since conductivities of buffer and particles are crucial for theefficiency of ODEP isolation, the conductivities of several dif-ferent buffers were tested, including phosphate buffered saline(PBS), cell culture medium, BSA, and sugar solutions. Amongthe tested buffers, sugar solutions showed the lowest conductiv-ities and were optimal for ODEP (Table 1).
Fig. 3 The chip design.
Fig. 4 The inclined light pattern.
Fig. 5 The cells sorting light pattern.
Journal of Biomedical Optics 045002-3 April 2014 • Vol. 19(4)
Chen et al.: High-purity separation of cancer cells by optically induced dielectrophoresis
Downloaded From: https://www.spiedigitallibrary.org/journals/Journal-of-Biomedical-Optics on 21 Mar 2022Terms of Use: https://www.spiedigitallibrary.org/terms-of-use
Although sugar solutions were optimal for ODEP, we wouldlike to keep testing cell viable throughout this study. Therefore,we chose several isotonic sugar solutions and examined viabilityof tumor cells in these sugar solutions up to 6 h. All sugar sol-utions tested kept cells viable except dextrose (Fig. 8).
In addition, since the binding force between antibody andantigen is the combination of hydrogen bonds, ionic bonds,van der Waals forces, and hydrophobic interactions, anotherpotential problem for using low-ionic buffer in our system isthat the antibody–antigen binding affinity may be weakened.Consequently, the antibody-beads complex could detach fromtarget cells. To examine if antibody–antigen complex remainedbound in low-ionic buffer, we incubated antibody-bound
MCF-7 cells in PBS and sucrose for 1 h before analyzing thebinding ratio by flow cytometry. It was not observed differencesin binding affinity when antibody-bound MCF-7 cells wereincubated in PBS and sucrose [Figs. 9(a) and 9(b)].
3.4 Conjugation of PS Beads and Anti-EpCAMAntibody (Beads Selection)
In this study, we chose biotin–streptavidin system to conjugatebeads and anti-EpCAM antibody. Detailed procedures forconjugating beads and antibodies were described in Sec. 2.To verify our conjugation efficiency, we developed an assayto indirectly measure the unbound antibody in reaction buffer
Fig. 6 The expression of EpCAM in (a) four breast cancer cell lines and (b) five gastric cancer cell lineswas detected by flow cytometry. Numbers shown were the percentage of cells that expressed EpCAM.
Journal of Biomedical Optics 045002-4 April 2014 • Vol. 19(4)
Chen et al.: High-purity separation of cancer cells by optically induced dielectrophoresis
Downloaded From: https://www.spiedigitallibrary.org/journals/Journal-of-Biomedical-Optics on 21 Mar 2022Terms of Use: https://www.spiedigitallibrary.org/terms-of-use
and wash buffer (Fig. 10). Conjugation was done five times, andthe results were shown in Table 2. To verify the efficiency ofbeads-conjugated anti-EpCAM antibody in recognizingEpCAM positive cells, we conjugated fluorescent PS beadsto anti-EpCAM antibody and observed the binding efficiencyby flow cytometry. Beads-conjugated anti-EpCAM antibodyrecognized over 96% of EpCAM positive cells. The resultshowed that PS beads conjugation did not affect antigen recog-nition of the anti-EpCAM antibody (Fig. 11). Furthermore,altering the reaction temperature to 37°C and increasing theincubation period to 1 h did not affect antigen recognition ofthe beads-conjugated anti-EpCAM antibody (data not shown).
3.5 Optimized Condition for Different Types of Cells
3.5.1 Static flow fluidic field
In the static flow fluidic field experiment, the light pattern ismoving with various velocities, and the light line width isfixed at 100 μm. The sample is injected by a pipette. The drag-ging velocity of 6-μm PS beads alone and cancer cells bound
Table 1 Conductivity of several different buffers were measured byEUTECH CyberScan CON 11 portable conductivity meter.
Item BufferConductivity(mS∕m)
1 8.5% Sucrose, SIGMA, cat. No.S0389
0.325
2 0.1% PBS w/o CA MG, Gibco,cat. No. 14190
175.7
3 0.5% dextrose (glucose), SIGMA,cat. No. G8270
0.154
4 1% BSA (Bovine serum albumin),SIGMA, cat. No. A7030
12.84
5 Mixture (8.5% sucrose+0.1%PBS+0.5% dextrose+1% BSA)
146.4
6 FBS, JRH, cat. No. 12007 1288
7 xMEM, Gibco, cat. No. 12561 1700
8 DPBS w/o Ca Mg, Gibco, cat. No.14190
1723
9 DPBSþ Ca2þ þMg2þ,Gibco, cat. No. 14040
1823
10 LRS, A253s01 1378
Note: Boldface represents the conductivity suited for ODEPmanipulating.
Fig. 8 MCF-7 (A) or AGS (B) cells were cultured in several isotonicsugar buffers. Cell viability was determined by cell counting withADAM cell counter.
Fig. 9 The binding affinity of anti-EpCAM antibody to EpCAM on tar-get cells was compared in sucrose and PBS.
Fig. 7 Assay flow chart.
Journal of Biomedical Optics 045002-5 April 2014 • Vol. 19(4)
Chen et al.: High-purity separation of cancer cells by optically induced dielectrophoresis
Downloaded From: https://www.spiedigitallibrary.org/journals/Journal-of-Biomedical-Optics on 21 Mar 2022Terms of Use: https://www.spiedigitallibrary.org/terms-of-use

Fig. 10 An assay to indirectly measure the unbound antibody inreaction buffer and wash buffer.
Table 2 Conjugation was done five times.
Experiment
Percentage ofantibody
in flow through
Percentage ofantibody
in wash bufferConjugationefficiency (%)
1 9.1 0 90.9
2 3.7 0 96.3
3 16.0 0 84.0
4 15.1 0 84.9
5 14.8 0 85.2
Average 88.2
Fig. 11 Polystyrene (PS) beads conjugation did not affect antigenrecognition of the anti-EpCAM antibody.
Fig. 12 The dragging velocity of 6-μm PS beads and cancer cells at22 V and different frequencies.
Fig. 13 The dragging velocity of 6-μm PS beads and cancer cells at30 kHz and various voltages.
Fig. 14 The dragging velocity of 15-μmPS beads at different frequen-cies and voltages.
Fig. 15 AGS cells were recognized and captured by 15-μm PS beadslabeled anti-EpCAM antibody.
Journal of Biomedical Optics 045002-6 April 2014 • Vol. 19(4)
Chen et al.: High-purity separation of cancer cells by optically induced dielectrophoresis
Downloaded From: https://www.spiedigitallibrary.org/journals/Journal-of-Biomedical-Optics on 21 Mar 2022Terms of Use: https://www.spiedigitallibrary.org/terms-of-use

6-μm PS beads at fixed 22 Vand various frequencies is tested, asshown in Fig. 12. The maximum dragging velocity is at 30 kHzand decreases with increasing frequency. In Fig. 13, the fre-quency is fixed at 30 kHz and various voltages. As the theoreti-cal prediction, the dragging velocity is increasing as voltageincreasing. The maximum dragging velocity does notexceed 250 μm∕s.
To improve the dragging velocity, the 15-μm PS beads aretested at various frequencies and voltages, as shown inFig. 14. As expected, the maximum dragging velocity is at30 kHz and 24 V and improved to 950 μm∕s.
3.5.2 Conjugation of 15-μm PS beads and anti-EpCAMantibody
Since 15-μm PS beads were required to generate enoughdragging force in ODEP system, we conjugated anti-EpCAMantibody with 15-μm PS for EpCAMþ cell recognition.When tested in vitro, we observed ∼77% EpCAMþ cellswere recognized and captured by 15-μm PS beads labeledanti-EpCAM antibody (Fig. 15).
3.5.3 Dynamic flow fluidic field
In the dynamic flow fluidic field experiment, the light pattern isstatic and with various inclined angles to the main channel, andthe light line width is fixed at 40 μm. The sample is injected by asyringe pump with a various flow speeds. The dragging velocityis decreasing as the inclined angle is increasing. The maximumdragging velocity can be up to 2667 μm∕s at 10 deg inclinedangle (Fig. 16). The dragging velocity 2667 μm∕s is equivalentto 8-μl∕min fluidic flow rate. The optimized 10 deg inclinedangle is designed to separate different cells, and the flow rateis 80 times faster than the literature.23
3.5.4 Dynamic flow fluidic field with mixed sample
As the dragging velocity is almost the same for the THP-1 and 6-μm PS beads. The 6-μm PS beads are used to simulate the wastesample THP-1. The mixed sample (6-μm PS beads and 15-μmPS beads bound AGS) is injected by a syringe pump with3-μl∕min flow rate, and the 40-μm static light pattern is inclined10-deg angle to the main channel, as mentioned before in Fig. 5.In Fig. 17, the mixed sample is random flowing into side andmain channels at 1 s. Then, the projected light is turn on 4 s, andthe mixed sample is pushed by the virtual light channel. At 10
Fig. 16 The dragging velocity of 15-μm PS beads at different lightpattern inclined angles.
Fig. 17 Mixed different sizes of PS beads, and PS beads bound AGS; and observe separation efficiencyby ODEP (Video, 2.41 MB) [URL: http://dx.doi.org/10.1117/1.JBO.19.4.045002.1].
Journal of Biomedical Optics 045002-7 April 2014 • Vol. 19(4)
Chen et al.: High-purity separation of cancer cells by optically induced dielectrophoresis
Downloaded From: https://www.spiedigitallibrary.org/journals/Journal-of-Biomedical-Optics on 21 Mar 2022Terms of Use: https://www.spiedigitallibrary.org/terms-of-use
and 13 s, all the 15-μm PS beads are pushed to flow into sidechannels, while the 5-μm PS beads are random flowing intomain and side channels.
4 ConclusionBy changing projected light pattern, it is demonstrated to sep-arate high-purity gastric cancer cells mixed in 6 and 15-μm PSbeads. A novel ODEP technology is proposed to enhance thepurity of cancer cells isolation about 77%, and promotes 80times throughput than the literature.23 Ongoing studies in ourlaboratory are to improve the conjugated anti-EpCAM antibodywith 15-μm PS beads for EpCAMþ cell recognition.
AcknowledgmentsWe would like to thank all members of the Micro-Opto-Mechanical-Electronics Division and Business and InnovationDivision. All the valuable discussions contribute to our researchactivities so far. The corresponding author contributes the samework as the first author.
References1. J. Chen, J. Lib, and Y. Sun, “Microfluidic approaches for cancer cell
detection, characterization, and separation,” Lab Chip 12(10), 1753–1767 (2012).
2. M. Yu et al., “Circulating tumor cells: approaches to isolation and char-acterization,” J. Cell Biol. 192(3), 373–382 (2011).
3. Z. Liu et al., “Negative enrichment by immunomagnetic nanobeads forunbiased characterization of circulating tumor cells from peripheralblood of cancer patients,” J. Transl. Med. 9(70), 1–8 (2011).
4. S. J. Tan et al., “Versatile label free biochip for the detection of circu-lating tumor cells from peripheral blood in cancer patients,” Biosens.Bioelectron. 26(4), 1701–1705 (2010).
5. S. Nagrath et al., “Isolation of rare circulating tumour cells in cancerpatients by microchip technology,” Nature 450, 1235–1239 (2007).
6. S. H. Seal, “A sieve for the isolation of cancer cells and other large cellsfrom the blood,” Cancer 17(5), 637–642 (1964).
7. P. Balasubramanian et al., “Confocal images of circulating tumor cellsobtained using a methodology and technology that removes normalcells,” Mol. Pharmaceutics 6(5), 1402–1408 (2009).
8. S. Nagrath et al., “Microchip-based isolation of rare circulating epi-thelial cells in patients with metastatic cancer,” Nature 450, 1235–1239 (2007).
9. T. H. Wu et al., “Pulsed laser triggered high speed microfluidic fluores-cence activated cell sorter,” Lab Chip 12(7), 1378–1383 (2012).
10. J. J. Chalmers et al., “Flow through immunomagnetic cell separation,”Biotechnol. Prog. 14(1), 141–148 (1998).
11. S. Nagrath et al., “Isolation of rare circulating tumour cells in cancerpatients by microchip technology,” Nature 450, 1235–1239 (2007).
12. H. M. Ji et al., “Silicon-based microfilters for whole blood cell separa-tion,” Biomed. Microdevices 10(2), 251–257 (2008).
13. S. Yang, A. Undar, and J. D. Zahn, “A microfluidic device for continu-ous, real time blood plasma separation,” Lab Chip 6(7), 871–880(2006).
14. L. R. Huang et al., “Continuous particle separation through determin-istic lateral displacement,” Science 304(5673), 987–990 (2004).
15. D. D. Carlo et al., “Continuous inertial focusing, ordering, and separa-tion of particles in microchannels,” Proc. Natl. Acad. Sci. U. S. A.104(48), 18892–18897 (2007).
16. M. Kumar, D. L. Feke, and J. M. Belovich, “Fractionation of cell mix-tures using acoustic and laminar flow fields,” Biotechnol. Bioeng. 89(2),129–137 (2005).
17. D. G. Grier, “A revolution in optical manipulation,” Nature 424, 810–816 (2003).
18. L. Kremser, D. Blaas, and E. Kenndler, “Capillary electrophoresis ofbiological particles: viruses, bacteria, and eukaryotic cells,”Electrophoresis 25(14), 2282–2291 (2004).
19. C. R. Cabrera and P. Yager, “Continuous concentration of bacteria in amicrofluidic flow cell using electrokinetic techniques,” Electrophoresis22(2), 355–362 (2001).
20. M. P. Hughes, “Strategies for dielectrophoretic separation in laboratory-on-a-chip systems,” Electrophoresis 23(16), 2569–2582 (2002).
21. P. Y. Chiou, A. T. Ohta, and M. C. Wu, “Massively parallel manipula-tion of single cells and microparticles using optical images,” Nature436, 370–372 (2005).
22. A. T. Ohta et al., “Dynamic cell and microparticle control via optoelec-tronic tweezers,” J. Micromech S. 16(3), 491–499 (2007).
23. S. B. Huang et al., “An optically-induced dielectrophoretic (ODEP)microfluidic platform for isolation of circulating tumor cells (CTCS)after conventional CTC isolation process,” Lab Chip 13, 1371–1383(2013).
24. H. H. Chen et al., “Optically-induced dielectrophoretic technology forcancer cells identification and concentration,” in 35th Ann. Int. Conf.IEEE Engineering in Medicine and Biology Society (EMBC), Osaka,Japan, pp. 2415–2418 (2013).
25. A. Andrew and L. E. Stephen, “A new therapeutic target for an oldcancer antigen,” Cancer Biol. Ther. 2(4), 320–326 (2003).
Hsiu-Hsiang Chen is a researcher at the Industrial TechnologyResearch Institute, Taiwan. She obtained her PhD degree from theInstitute of Nano Engineering and Microsystems at National TsingHua University of Taiwan in 2011. Her research interests includesolid-state physics, NMEMS (nano micro-electro-mechanical sys-tems), optical MEMS, bioMEMS, and optofluidic integration.
Mei-Wei Lin is a researcher at the Industrial Technology ResearchInstitute, Taiwan. She obtained her MS degree in microbiology andimmunology from National Cheng Kung University of Taiwan in2002. Her research interest is oncology, cancer biology, and immu-nology. Her current focus is on studying cancer therapy and isolatingcirculating tumor cells.
Wan-Ting Tien is a researcher at Industrial Technology ResearchInstitute, Taiwan. He obtained his MS degree in physics fromTamkang University of Taiwan in 1990. His research interests arelaser engraving, holographic optics, breast microcalcifications photo-acoustic imaging, and optical dielectrophoresis experiments.
Chin-Pen Lai is an associate researcher at the Industrial TechnologyResearch Institute, Taiwan. She received her MS degree from theNational Taiwan University of Zoology of Taiwan in 2004. Herresearch interests include oncology and cancer biology. Her currentfocus is on studying physically cancer treatments, isolating circulatingtumor cells, and adipose-derived stem cells.
Kuo-YaoWeng is an engineer at the Industrial Technology ResearchInstitute, Taiwan. He received his PhD degree in biotechnology fromNational Tsing Hua University of Taiwan in 2008. His research inter-ests are on optoelectronical devices in biomedical detection andanalysis, microfluidic tools in biomicroparticle manipulation and sep-aration, and in vitro diagnostic and point-of-care testing devices. Hiscurrent focus is on studying an isolating device of circulating tumorcells and wearable image devices.
Ching-Huai Ko is a senior researcher at Industrial TechnologyResearch Institute, Taiwan. He obtained his PhD degree in pharmacyfrom Taipei Medical University of Taiwan in 2005. His researchinterest is oncology, cancer biology, and skin regeneration. Hiscurrent focus is on studying cancer target therapy and cancer stemcell.
Chun-Chuan Lin is a manager at the Industrial Technology ResearchInstitute, Taiwan. He obtained his MS degree in photoelectric engi-neering from National Changhua University of Education, Taiwan,in 1995. His research interest is optical system design and laser scan-ning microscope. His current focus is on studying a cell capture andsorting system and an isolating circulating tumor cells.
Jyh-Chern Chen is currently a principal researcher at the IndustrialTechnology Research Institute, Taiwan. He obtained his PhD degreein chemical engineering from National Taiwan University in 1988. He
Journal of Biomedical Optics 045002-8 April 2014 • Vol. 19(4)
Chen et al.: High-purity separation of cancer cells by optically induced dielectrophoresis
Downloaded From: https://www.spiedigitallibrary.org/journals/Journal-of-Biomedical-Optics on 21 Mar 2022Terms of Use: https://www.spiedigitallibrary.org/terms-of-use
is also a serial entrepreneur in creating five medical diagnostic devi-ces companies. His research interest includes bio-sensing, biochemi-cal processing, and in-vitro diagnostics. His current focus is on theisolation and detection of circulating tumor cells.
Kuo-Tung Tiao is currently a deputy general director at the IndustrialTechnology Research Institute, Taiwan. He obtained his MS degree inelectrical engineering and MBA from National Tsing Hua University(Taiwan) and University of Illinois at Urbana-Champaign (USA),respectively. His research interest includes optical electronics systemof image capturing and display, optical storage technology, opticalprinting technology, optical component and system research develop-ment and manufacturing, CMOS image sensor-based camera mod-ule, and bio-photonics.
Tse-Ching Chen is a professor of anatomical pathology, working atLin-Kou Chang Gung Memorial Hospital, Taiwan. He was appointedas departmental head in 2005. His subspecialties include hepatogas-trointestinal pathology, cellular immunology, and molecular pathol-ogy. Now, he devotes his time to exploring novel biomarkers forcancer target therapy and automatic device/system for pathologiclaboratory.
Shin-Cheh Chen is specialized in breast cancer treatment andresearch. His clinical work focuses on breast cancer managementincluding surgery and chemotherapy. His team focuses on treatmentof breast cancer and special effort in breast cancer patients care. Hehas pioneered the development of breast ultrasound, not only in clinicalexamination but also in breast cancer screening. His research in basicscience includes vitamin D metabolism, cancer biology, and miRNA.
Ta-Sen Yeh is in charge of the Surgical Lab, Tissue Bank, Board ofChang Gung medical research review and research, and Division ofGeneral Surgery, CGMH. He obtained his PhD training from ChangGung University of Taiwan in 2001. Currently, his academic interestsare hepato-biliary surgery and relevant translation research, includingliver regeneration, carcinogenesis of hepatobioliary cancer, andmolecular imaging of animal cancer models.
Chieh-Fang Cheng is a researcher at Industrial TechnologyResearch Institute, Taiwan. He obtained his PhD degree in pathologyfrom University of Southern California in 2008. His research interest isoncology, cancer biology, and skin regeneration. His current focus ison studying physically cancer treatments and isolating circulatingtumor cells.
Journal of Biomedical Optics 045002-9 April 2014 • Vol. 19(4)
Chen et al.: High-purity separation of cancer cells by optically induced dielectrophoresis
Downloaded From: https://www.spiedigitallibrary.org/journals/Journal-of-Biomedical-Optics on 21 Mar 2022Terms of Use: https://www.spiedigitallibrary.org/terms-of-use


![Synthesis and Application of New, Optically Active ... · Separation of the optical isomers was accomplished due to our experience in the field of optical resolution [21] using optically](https://static.fdocuments.in/doc/165x107/5e3573ac8ead0f0dbf6c3458/synthesis-and-application-of-new-optically-active-separation-of-the-optical.jpg)