High pressure processing of Australian navel orange juices ...
16
High pressure processing of Australian navel orange juices: Sensory analysis and volatile flavor profiling Irene A. Baxter, Kerry Easton * , Katherine Schneebeli, Frank B. Whitfield Food Science Australia, P.O. Box 52, North Ryde, NSW 1670, Australia Received 2 March 2005; accepted 30 May 2005 Abstract Navel orange juices subjected to high pressure processing (HPP) and temperature treatment (TT) were stored at 4 and 10 -C for up to 12 weeks to establish the shelf-life of such products. The processed juices and a control juice, stored at 20 -C, were assessed by a trained sensory panel and a consumer acceptance panel at 0, 1, 2, 4, 8 and 12 weeks or until such time that the juices were considered unfit for consumption. Untreated juice stored at 4 -C was similarly assessed for up to 2 weeks and untreated juice stored at 10 -C was assessed for up to 1 week. The volatile components of corresponding juices were isolated by SPME and the extracts were analyzed by GC–MS. Twenty key aroma compounds were selected for quantification and these data were used to monitor the change in volatile content of the juices during storage. The study showed that the odor and flavor of the HPP juice was acceptable to consumers after storage for 12 weeks at temperatures up to 10 -C. However, only the TT juice stored at 4 -C was acceptable after the same length of storage. Crown Copyright D 2005 Published by Elsevier Ltd. All rights reserved. Keywords: Orange juice; Sensory analysis; Consumer acceptance; Shelf-life; Odor; Flavor; GC – MS; SPME Industrial relevance: Orange juice is a sensitive product subject to a high microbial load that can tolerate only moderate heat treatment without the destruction of the product_s delicate aroma and flavor characteristics. High pressure processing at moderate pressures and storage at refrigeration temperatures have been evaluated as means of maximizing microbial inactivation while maintaining consumer acceptability of the product. The sensory and analytical data presented demonstrate that high pressure processing with refrigeration can extend the shelf-life of orange juice while maintaining consumer acceptability. 1. Introduction Previous studies have identified many volatile com- pounds that are important for good orange juice aroma and flavor (Bettini, Shaw & Lancas, 1998; Petersen, Tønder & Poll, 1998; Shaw, 1991; Du ¨rr & Schobinger, 1981) and odors and off-flavors associated with ageing of the juice. Typically the results obtained by gas chromatography (GC) were correlated to those from trained sensory panels for the purposes of evaluating changes due to storage and/or temperature conditions (Bettini et al., 1998; Petersen et al., 1998; Tønder, Poll & Petersen, 1996; Ve ´lez et al., 1993; Naim, Striem, Kanner & Peleg, 1988; Guadagni, Bomben & Mannheim, 1970). None of the aforementioned studies have included consumer panels, so often trained or semi-trained sensory panelists have made judgments on the Ffreshness_ and acceptability of the samples. However, by merit of their training, sensory panelists are not representative of the average consumer and, as panelists are not necessarily regular consumers of the product, they may not be part of the target population to which the hedonic results would be generalized. A search of the literature did not yield any studies combining the results of GC–MS analysis of orange juice volatiles with both sensory and true consumer accept- ance panels. Thus the study reported here provides a unique understanding of the sensory and chemical factors influenc- ing the shelf-life of orange juice processed and stored under different conditions. 1466-8564/$ - see front matter. Crown Copyright D 2005 Published by Elsevier Ltd. All rights reserved. doi:10.1016/j.ifset.2005.05.005 * Corresponding author. Tel.: +61 2 9490 8424; fax: +61 2 9490 8499. E-mail address: [email protected] (K. Easton). Innovative Food Science and Emerging Technologies 6 (2005) 372 – 387 www.elsevier.com/locate/ifset
Transcript of High pressure processing of Australian navel orange juices ...

www.elsevier.com/locate/ifset
Innovative Food Science and Emergin
High pressure processing of Australian navel orange juices:
Sensory analysis and volatile flavor profiling
Irene A. Baxter, Kerry Easton *, Katherine Schneebeli, Frank B. Whitfield
Food Science Australia, P.O. Box 52, North Ryde, NSW 1670, Australia
Received 2 March 2005; accepted 30 May 2005
Abstract
Navel orange juices subjected to high pressure processing (HPP) and temperature treatment (TT) were stored at 4 and 10 -C for up to 12
weeks to establish the shelf-life of such products. The processed juices and a control juice, stored at �20 -C, were assessed by a trained
sensory panel and a consumer acceptance panel at 0, 1, 2, 4, 8 and 12 weeks or until such time that the juices were considered unfit for
consumption. Untreated juice stored at 4 -C was similarly assessed for up to 2 weeks and untreated juice stored at 10 -C was assessed for up
to 1 week. The volatile components of corresponding juices were isolated by SPME and the extracts were analyzed by GC–MS. Twenty key
aroma compounds were selected for quantification and these data were used to monitor the change in volatile content of the juices during
storage. The study showed that the odor and flavor of the HPP juice was acceptable to consumers after storage for 12 weeks at temperatures
up to 10 -C. However, only the TT juice stored at 4 -C was acceptable after the same length of storage.
Crown Copyright D 2005 Published by Elsevier Ltd. All rights reserved.
Keywords: Orange juice; Sensory analysis; Consumer acceptance; Shelf-life; Odor; Flavor; GC–MS; SPME
Industrial relevance: Orange juice is a sensitive product subject to a high microbial load that can tolerate only moderate heat treatment without the destruction
of the product_s delicate aroma and flavor characteristics. High pressure processing at moderate pressures and storage at refrigeration temperatures have been
evaluated as means of maximizing microbial inactivation while maintaining consumer acceptability of the product. The sensory and analytical data presented
demonstrate that high pressure processing with refrigeration can extend the shelf-life of orange juice while maintaining consumer acceptability.
1. Introduction
Previous studies have identified many volatile com-
pounds that are important for good orange juice aroma and
flavor (Bettini, Shaw & Lancas, 1998; Petersen, Tønder &
Poll, 1998; Shaw, 1991; Durr & Schobinger, 1981) and
odors and off-flavors associated with ageing of the juice.
Typically the results obtained by gas chromatography (GC)
were correlated to those from trained sensory panels for the
purposes of evaluating changes due to storage and/or
temperature conditions (Bettini et al., 1998; Petersen et
al., 1998; Tønder, Poll & Petersen, 1996; Velez et al., 1993;
1466-8564/$ - see front matter. Crown Copyright D 2005 Published by Elsevier
doi:10.1016/j.ifset.2005.05.005
* Corresponding author. Tel.: +61 2 9490 8424; fax: +61 2 9490 8499.
E-mail address: [email protected] (K. Easton).
Naim, Striem, Kanner & Peleg, 1988; Guadagni, Bomben &
Mannheim, 1970). None of the aforementioned studies have
included consumer panels, so often trained or semi-trained
sensory panelists have made judgments on the Ffreshness_and acceptability of the samples. However, by merit of their
training, sensory panelists are not representative of the
average consumer and, as panelists are not necessarily
regular consumers of the product, they may not be part of
the target population to which the hedonic results would be
generalized. A search of the literature did not yield any
studies combining the results of GC–MS analysis of orange
juice volatiles with both sensory and true consumer accept-
ance panels. Thus the study reported here provides a unique
understanding of the sensory and chemical factors influenc-
ing the shelf-life of orange juice processed and stored under
different conditions.
g Technologies 6 (2005) 372 – 387
Ltd. All rights reserved.

I.A. Baxter et al. / Innovative Food Science and Emerging Technologies 6 (2005) 372–387 373
High pressure processing (HPP) has been reported to
reduce bitterness in orange juice, while having no adverse
effect on color or texture, with HPP orange juice reportedly
preferred over a commercial brand of freshly squeezed
orange juice and demonstrating a 16-week shelf-life at 4–8
-C (Anonymous, 1996). The potential de-bittering effect of
HPP is of interest as Navel orange juice is known to
develop bitter notes (Chandler, 1971). Another study found
no difference between HPP orange juice and a reference
sample in terms of sensory quality when kept chilled for up
to 20 weeks (Takahashi, Pehrsson, Rovere, & Squarcina,
1998).
The aim of this study was to determine the shelf-life of
Australian Navel orange juice processed by HPP and by
conventional thermal treatment (TT) when stored under
refrigerated (4 -C) and temperature-abuse (10 -C)conditions. Additionally, the authors wanted to understand
the effects of processing and storage on the volatile
flavor/aroma composition and sensory character of the
juices.
Table 1
Australian Navel orange juice samples included in sensory testing during
weeks 0–12
Sample Week 0 Week 1 Week 2 Week 4 Week 8 Week 12
U �20 -Ca ( ( ( ( ( (U 4 -C ( ( (U 10 -C ( (TT 4 -Cb ( ( ( ( ( (TT 10 -C ( ( ( (HPP 4 -Cc ( ( ( ( ( (HPP 10 -C ( ( ( ( ( (aU=untreated juice; bTT=temperature treated juice; and cHPP=high pressure
processed juice.
2. Materials and methods
2.1. Chemicals and solvents
All reagents used in the preparation of the simulated
orange juice solution were purchased from Sigma Chem-
ical Co., (St. Louis, MO). Reference samples of orange
juice odor-active compounds were purchased from three
suppliers, Fluke Chemie GmbH (Buch, Switzerland),
Sigma Chemical Co. (St. Louis, MO) and Aldrich
Chemical Co., Inc. (Milwaukee, WI). All compounds had
a purity >98%. Distilled water was further purified by
filtration through a Milli-Q filtration system (Millipore
Corp., Bedford, MA).
2.2. Product
The Navel oranges were purchased from a local fruit
market in Sydney, New South Wales. The oranges were
harvested in Mildura, 1027 km south–west of Sydney and
were of a ‘‘good’’-grade quality. The Navel trial oranges
were stored without refrigeration for 2 days prior to
processing: the ambient temperature at that time of the year
was approximately 15 -C.
2.3. Preparation and processing of oranges
All equipment used in the project was sanitized prior
to use by washing with a 100 mg/l sodium hypochlorite/
water solution followed by a water rinse. Any damaged
fruit was removed. The oranges were soaked in a 100 mg/
l sodium hypochlorite/water solution for 2 min and rinsed
in water. Oranges were hydraulically pressed with an
industrial juice extractor (FMC-Corporation, USA) and the
peel, rind and excess pulp were automatically discarded.
The juice was strained through a 1 mm mesh and collected
into large stainless steel containers. The untreated juice and
juice to be pressure-treated were immediately distributed
into 200 ml polyethylene terephthalate (PET) bottles with
screw cap closures (ACI Petalite, Australia) using an auto-
mated foot-controlled bottler (Micro-Packaging Engineers
Ltd, Australia).
A 2 l processing unit (Flow International Corporation,
USA) was used to pressurize the orange juice samples at 600
MPa for 60 s. The pressure fluid was water, come up time to
the designated pressure was less than 10 s, and depressuriza-
tion was less than 5 s. Pressurization was carried out at
ambient temperature (18–20 -C), however, chilling the
samples to 4 -C before pressure treatment minimized the
effects of adiabatic heating during pressurization.
An in-house, custom-built 2 l thermal pasteurizer with a
holding tube and cooler was used to indirectly steam heat
the samples. The Navel juice was pasteurized at 85 -C for
25 s and distributed into bottles directly from the pasteurizer
outlet.
2.4. Storage and sampling of orange juice
After processing, the juice was stored in two separate
controlled-temperature rooms at approximately 4 and 10 -C,with temperature measurements taken at 30-min intervals
using calibrated Tinytagi temperature data loggers (Gem-
ini Dataloggers, UK).
The samples evaluated by sensory analysis and flavor
profiling were: an untreated orange juice stored at �20 -C(U �20 -C; the control), untreated samples stored at 4
and 10 -C (U 4 and U 10 -C, respectively), thermally
treated samples stored at 4 and 10 -C (TT 4 and TT 10 -C,respectively), and high pressure processed samples stored
at 4 and 10 -C (HPP 4 and HPP 10 -C, respectively). Dueto increased microbial activity or unpalatability (as
judged by the sensory scientist) not all samples were
evaluated throughout the 12-week trial. Table 1 shows
the Navel juice samples that were tested and found to be
acceptable for inclusion in the sensory evaluation at each
time point.

Table 2
Vocabulary developed to describe Australian Navel orange juice
Attribute Definition
Appearance
Color Depth of color. Judged by looking from the top of
the cup.
Aroma
Sweetness The typical odor of sugary drinks.
Aged The odor associated with ageing oranges (bruising).
Artificial Odor of orange essence, as associated with orange
cake.
Fermented Yeasty, fruity, fermented odor; wine-like.
Overall strength
of orange aroma
Overall intensity of the orange aroma.
Flavor
Sourness Typical Ftangy_ sourness, perceived at the side of
the tongue.
Sweetness Immediate perception of sweetness.
Processed Artificial taste associated with heat treatment
(Fcooked_ taste).
Bitterness A bitter sensation associated with the oils extracted
from the peel. Perceived towards the back of the
throat.
Overall strength
of orange flavor
Typical flavor associated with fresh orange juice.
Aftertaste
Acidity A tangy acidity at the back of the mouth. Gives the
sample Fbite_.
Sourness A lingering sensation of sourness, perceived at the
side of the tongue. Has a mouth-puckering effect.
Bitterness Bitter sensation perceived at the back of the throat
after swallowing.
Duration The length of time that the overall aftertaste remains
up to 1 min after swallowing.
I.A. Baxter et al. / Innovative Food Science and Emerging Technologies 6 (2005) 372–387374
Samples were sensory tested (trained panel and consumer
evaluation) only after microbiological safety clearance (Bull
et al., 2004). Sensory evaluations were conducted at
baseline (2 days after processing) and then at weeks 1, 2,
4, 8 and 12 of shelf-life. Isolation and analysis of volatile
compounds using GC–MS commenced at the same time as
the sensory analysis.
The total volume of sample required for each day of
sensory testing was removed from the appropriate storage
rooms 2 h prior to the first session. The frozen control
samples were defrosted under running cold water. The total
volume of each sample was decanted into 2 l lidded plastic
jugs labeled with blind codes and stored in the refrigerator
until required. Prior to commencing sensory sessions, the
samples were removed from the refrigerator and stored on ice
to keep them cool. As soon as the session had finished, the
samples were placed back in the refrigerator.
2.5. Panel training
The sensory panel, comprising 10 sensory panelists
experienced in the technique of Quantitative Descriptive
AnalysisR (QDA; Stone, Sidel, Oliver, Woolsey & Singel-
ton, 1974; Stone & Sidel, 1992), completed 18 h of training
as per the QDA technique. Eight hours were spent
developing the orange juice descriptors (product vocabu-
lary) to be used for evaluation of the Navel orange juice and
agreeing upon a standard sample assessment procedure.
Further 6 h were then spent scoring the orange juices on 100
mm line scales, presented using CompusenseR (sensory
software; CompusenseR, Guelph, Canada), and redefining
the vocabulary as required. Finally, two 2-h sessions were
held to evaluate the panel’s performance prior to the Navel
shelf-life study beginning. Table 2 shows the descriptors
used by the trained panel for the Navel orange juice study.
The panelists were trained using four orange juice
samples: U �20 -C (defrosted 3 h prior to the session), a
HPP 4 -C sample held at this temperature for between 4 and
10 days, a TT 4 -C sample held at this temperature for 4–10
days, and an untreated juice sample stored at 30 -C (U 30
-C) for 2–5 days. All juices, except the U 30 -C sample,
were microbiologically cleared prior to assessment. The U
30 -C sample was assessed for appearance and aroma only
(i.e. panelists were instructed not to drink this sample) to
familiarize the panel with sensory characteristics that might
be expected as the juices aged in the shelf-life trial.
The training samples were evaluated in duplicate over
two consecutive days in the sensory laboratory to assess
panel performance. The evaluation was conducted using a
balanced sample presentation order to minimize bias due to
first-order and carry-over effects (MacFie, Bratchell,
Greenhoff & Vallis, 1989). Repeated measures analysis of
variance (ANOVA) was used to analyze the data to show
any panelists/sample/session effects and also to ensure that
the product descriptors to be used discriminated between the
samples.
2.6. Descriptive sensory analysis of the samples
The trained panelists evaluated the test samples in
duplicate in the morning over two consecutive days. All
evaluations took place under controlled sensory conditions
(e.g. individual booths, 3-digit sample blinding codes) using
CompusenseR for sample presentation and data capture. A
complete block design was used and samples were
presented in a balanced order.
Samples were evaluated for the 15 product descriptors
(Table 2) using 100 mm line scales anchored at 0 mm with
‘‘weak’’ and at 100 mm with ‘‘strong’’. Palate cleansing
breaks between every sample (using plain white bread and
water over a 60 s interval) were enforced. Panelists were
given a 10-min break after every fourth sample to minimize
sensory fatigue.
2.7. Consumer acceptability
Between 30 and 40 regular consumers of freshly
squeezed orange juice participated in each consumer
evaluation session, held in the sensory laboratory immedi-
ately after the trained panel evaluations. All consumers were
I.A. Baxter et al. / Innovative Food Science and Emerging Technologies 6 (2005) 372–387 375
aged between 18 and 65 years of age and an approximately
equal split of males to females was recruited for each
session. Samples were labeled with 3-digit blinding codes
and presented in a balanced order, with all data collected
using CompusenseR. All samples were tasted in one
session.
The consumers scored the acceptability of the samples
using a 9-point hedonic category scale (where 1=dislike
extremely and 9=like extremely), rating appearance, aroma,
flavor, texture, aftertaste and overall acceptability (Meil-
gaard, Civille, & Carr, 1991). Consumers were also asked to
provide comments on each sample to explain why they liked
or disliked the sample.
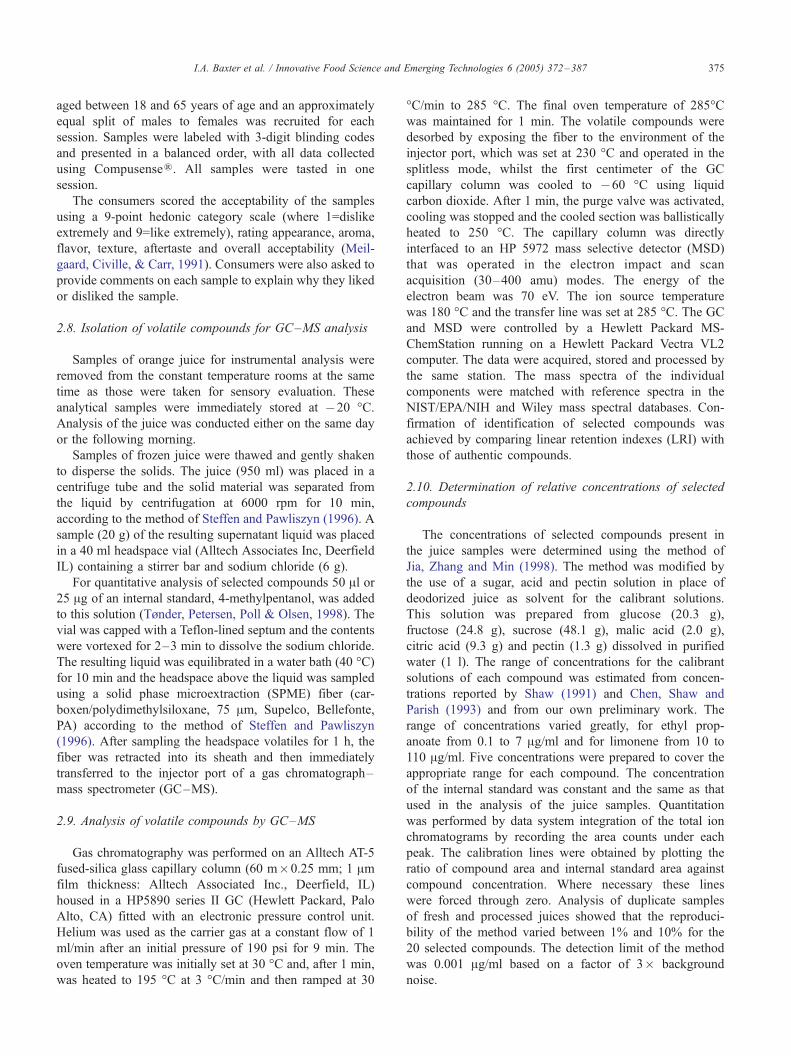
2.8. Isolation of volatile compounds for GC–MS analysis
Samples of orange juice for instrumental analysis were
removed from the constant temperature rooms at the same
time as those were taken for sensory evaluation. These
analytical samples were immediately stored at �20 -C.Analysis of the juice was conducted either on the same day
or the following morning.
Samples of frozen juice were thawed and gently shaken
to disperse the solids. The juice (950 ml) was placed in a
centrifuge tube and the solid material was separated from
the liquid by centrifugation at 6000 rpm for 10 min,
according to the method of Steffen and Pawliszyn (1996). A
sample (20 g) of the resulting supernatant liquid was placed
in a 40 ml headspace vial (Alltech Associates Inc, Deerfield
IL) containing a stirrer bar and sodium chloride (6 g).
For quantitative analysis of selected compounds 50 Al or25 Ag of an internal standard, 4-methylpentanol, was added
to this solution (Tønder, Petersen, Poll & Olsen, 1998). The
vial was capped with a Teflon-lined septum and the contents
were vortexed for 2–3 min to dissolve the sodium chloride.
The resulting liquid was equilibrated in a water bath (40 -C)for 10 min and the headspace above the liquid was sampled
using a solid phase microextraction (SPME) fiber (car-
boxen/polydimethylsiloxane, 75 Am, Supelco, Bellefonte,
PA) according to the method of Steffen and Pawliszyn
(1996). After sampling the headspace volatiles for 1 h, the
fiber was retracted into its sheath and then immediately
transferred to the injector port of a gas chromatograph–
mass spectrometer (GC–MS).
2.9. Analysis of volatile compounds by GC–MS
Gas chromatography was performed on an Alltech AT-5
fused-silica glass capillary column (60 m�0.25 mm; 1 Amfilm thickness: Alltech Associated Inc., Deerfield, IL)
housed in a HP5890 series II GC (Hewlett Packard, Palo
Alto, CA) fitted with an electronic pressure control unit.
Helium was used as the carrier gas at a constant flow of 1
ml/min after an initial pressure of 190 psi for 9 min. The
oven temperature was initially set at 30 -C and, after 1 min,
was heated to 195 -C at 3 -C/min and then ramped at 30
-C/min to 285 -C. The final oven temperature of 285-Cwas maintained for 1 min. The volatile compounds were
desorbed by exposing the fiber to the environment of the
injector port, which was set at 230 -C and operated in the
splitless mode, whilst the first centimeter of the GC
capillary column was cooled to �60 -C using liquid
carbon dioxide. After 1 min, the purge valve was activated,
cooling was stopped and the cooled section was ballistically
heated to 250 -C. The capillary column was directly
interfaced to an HP 5972 mass selective detector (MSD)
that was operated in the electron impact and scan
acquisition (30–400 amu) modes. The energy of the
electron beam was 70 eV. The ion source temperature
was 180 -C and the transfer line was set at 285 -C. The GCand MSD were controlled by a Hewlett Packard MS-
ChemStation running on a Hewlett Packard Vectra VL2
computer. The data were acquired, stored and processed by
the same station. The mass spectra of the individual
components were matched with reference spectra in the
NIST/EPA/NIH and Wiley mass spectral databases. Con-
firmation of identification of selected compounds was
achieved by comparing linear retention indexes (LRI) with
those of authentic compounds.
2.10. Determination of relative concentrations of selected
compounds
The concentrations of selected compounds present in
the juice samples were determined using the method of
Jia, Zhang and Min (1998). The method was modified by
the use of a sugar, acid and pectin solution in place of
deodorized juice as solvent for the calibrant solutions.
This solution was prepared from glucose (20.3 g),
fructose (24.8 g), sucrose (48.1 g), malic acid (2.0 g),
citric acid (9.3 g) and pectin (1.3 g) dissolved in purified
water (1 l). The range of concentrations for the calibrant
solutions of each compound was estimated from concen-
trations reported by Shaw (1991) and Chen, Shaw and
Parish (1993) and from our own preliminary work. The
range of concentrations varied greatly, for ethyl prop-
anoate from 0.1 to 7 Ag/ml and for limonene from 10 to
110 Ag/ml. Five concentrations were prepared to cover the
appropriate range for each compound. The concentration
of the internal standard was constant and the same as that
used in the analysis of the juice samples. Quantitation
was performed by data system integration of the total ion
chromatograms by recording the area counts under each
peak. The calibration lines were obtained by plotting the
ratio of compound area and internal standard area against
compound concentration. Where necessary these lines
were forced through zero. Analysis of duplicate samples
of fresh and processed juices showed that the reproduci-
bility of the method varied between 1% and 10% for the
20 selected compounds. The detection limit of the method
was 0.001 Ag/ml based on a factor of 3� background
noise.

I.A. Baxter et al. / Innovative Food Science and Emerging Technologies 6 (2005) 372–387376
2.11. Analysis of volatile compounds absorbed by PET
bottles
Three PET bottles used for the storage of control juice
samples for 12 weeks were emptied of their contents,
washed with purified water and allowed to drain for 2 h. The
dry bottles were cut into strips (2�1 cm) and the strips (2 g)
were placed in 40 ml headspace vials. The vials were
capped and the vials and contents were heated at 50 -C in a
water bath. The headspace volatiles were sampled by SPME
for 1 h and the absorbed compounds were transferred to the
GC–MS. These compounds were then analyzed using the
same conditions as previously described for the analysis of
the orange juice extracts (Section 2.9).
2.12. Data analysis
Analysis of variance (ANOVA; Minitab v13.31) was
conducted on the data from the trained panel evaluations
to determine samples that differed significantly ( p <0.05)
at each time point for particular sensory attributes. The
data from the consumer acceptability evaluations were
also analyzed using ANOVA. Tukey’s test (at the 5%
significance level) was used once ANOVA showed
significant differences to determine how the samples
differed.
To illustrate the relationship between the sensory
characteristics of the juice samples and consumers’
overall acceptability, an external preference map of the
U-200C U40C U100C TT40C TT100C HPP40C HPP100C
U-200C U40C U100C TT40C TT100C HPP40C HPP100C
U-200C U40C U100C TT40C TT100C HPP40C HPP100C
(a)
0102030405060
Initial Week 1 Week 2 Week 4 Week 8 Week 12
(b)
0102030405060
Initial Week 1 Week 2 Week 4 Week 8 Week 12
(c)
05
101520253035
Initial Week 1 Week 2 Week 4 Week 8 Week 12
(d)
05
101520253035
(e)
0
5
10
15
20
25
30
(f)
010203040506070
Fig. 1. Sensory panel scores for Navel orange juice appearance (color) and odor a
artificial odor, (e) fermented odor, and (f) strength of orange odor.
samples at weeks 1 and 12 of the storage trial was
constructed. This correlation between the consumers’
mean overall liking score and the panel’s sensory
profiling data was determined by partial least squares
type 1 regression (PLSR1; Unscrambler v 8.0, Camo A/S,
Oslo, Norway). All data were standardized (1/standard
deviation) prior to the PLSR1 analysis to prevent differ-
ences in scale usage affecting the loading given to each
attribute.
PLSR1 was also used to model the relationship between
the individual sensory attributes and GC–MS volatile
compounds. The chemical data set were the X-variables
(independent variables) and the individual sensory attributes
formed the Y-variables (dependent compounds). Full cross
validation was selected as the validation model, using the
optimal number of principal components. The Martens
uncertainty test (http://www.camo.com/pdf/Martens.pdf)
was used to identify significant X-variables.
3. Results and discussion
3.1. Trained panel
Fig. 1 and Tables 3 and 4 show the mean trained panel
scores by attribute for each of the samples examined at each
time point. An overall trend was observed in the samples
whereby, at week 4, the odor, flavor and aftertaste attributes
significantly increased for most samples then decreased
U-200C U40C U100C TT40C TT100C HPP40C HPP100C
U-200C U40C U100C TT40C TT100C HPP40C HPP100C
U-200C U40C U100C TT40C TT100C HPP40C HPP100C
Initial Week 1 Week 2 Week 4 Week 8 Week 12
Initial Week 1 Week 2 Week 4 Week 8 Week 12
Initial Week 1 Week 2 Week 4 Week 8 Week 12
ttributes over 12 weeks storage: (a) color, (b) sweet odor, (c) aged odor, (d)

Table 3
Sensory panel scores for Navel orange juice flavor attributes over 12 weeks storage
Attribute Time Juice samples
(Week) U �20 -Ca U 4 -C U 10 -C TT 4 -Cb TT 10 -C HPP 4 -Cc HPP 10 -C
Sour taste 0 39.5 40.1 50.4 37.0 38.9 31.9 31.3
1 33.5 27.5 40.3 39.6 34.9 41.3 42.2
2 23.8 23.2 24.6 25.4 28.3 27.8
4 45.9 28.6 33.5 30.2 39.9
8 23.2 10.8 16.3 23.0
12 19.2 15.9 15.7 17.2
Sweet flavor 0 53.6 47.3 41.8 52.4 56.2 47.2 48.8
1 42.6 33.7 27.6 37.7 34.5 34.8 37.6
2 28.1 30.9 33.8 33.4 29.4 28.4
4 28.0 45.6 46.4 35.5 27.9
8 30.6 36.2 42.1 30.0
12 34.9 38.4 38.3 38.1
Processed flavor 0 8.8 20.4 2.1 7.5 29.2 10.8 7.1
1 11.4 29.4 51.6 24.1 26.9 24.9 25.8
2 12.7 21.9 13.8 15.7 11.4 13.8
4 29.5 30.7 40.4 26.0 29.1
8 22.9 15.3 24.7 21.1
12 23.1 17.6 16.6 18.3
Bitterness 0 15.3 17.3 13.8 19.1 19.2 16.9 19.6
1 15.1 28.3 51.7 29.6 29.3 23.9 24.4
2 19.9 24.1 19.2 22.9 25.9 23.0
4 48.8 38.9 31.1 35.5 46.1
8 26.5 12.6 16.5 22.5
12 23.2 18.2 16.8 18.1
Strength of flavor 0 66.3 41.3 45.4 60.8 59.6 49.9 53.8
1 56.4 39.6 28.8 48.3 41.3 47.5 42.8
2 46.4 38.2 42.5 41.8 45.8 40.6
4 48.1 54.6 48.1 53.5 49.9
8 31.8 32.1 34.6 32.9
12 41.6 38.9 38.2 38.7
aU=untreated juice; bTT=temperature treated juice; and cHPP=high pressure processed juice.
I.A. Baxter et al. / Innovative Food Science and Emerging Technologies 6 (2005) 372–387 377
significantly at week 8. This trend was also observed in the
data on volatile composition (Section 3.4). The TT 10 -Csample was found to be unacceptable for consumption by
the trained panel at week 8 so there are no further sensory
data available on this sample.
3.1.1. Appearance and odor attributes
Mean panel scores for appearance and aroma are shown
in Fig. 1. There were no significant differences between
samples with regard to the juice color at any given time
point (i.e. comparing mean scores for all samples at one
time point using ANOVA). There were no significant
changes in the color of any sample over the course of the
12-week shelf-life.
By week 1, the U 10 -C sample had a less intense sweet
odor and weaker overall strength of orange odor than the U
�20 -C (control) and processed samples. The U 10 -C juice
was however the sample with the strongest aged odor,
artificial odor and fermented odor. The TT and HPP
samples were overall similar to each other with regard to
odor characteristics.
Generally, increased storage time lead to a decrease in
sweet odor and strength of the orange odor and an increase
in intensity of aged odor, artificial odor and fermented odor
across all the test samples. However, because the presence
of a strong fermented odor would indicate microbial
spoilage, samples displaying this characteristic were not
tasted by either the panel or consumers.
3.1.2. Flavor attributes
Mean panel scores for Navel orange juice flavor
attributes are shown in Table 3. By week 1, the U 10 -Csample had a stronger sour, bitter and processed flavor as
compared to the other samples and was the least sweet
sample and lowest in overall strength of orange flavor. The
TT and HPP samples were similar to each other with regard
to flavor characteristics over the course of the shelf-life.
There was a general trend for the samples to be perceived
as less sour and less sweet over time and for strength of
flavor to diminish in response to increasing storage time. In
contrast the processed flavor and bitterness of the samples
became more pronounced as the shelf-life increased.
3.1.3. Aftertaste attributes
Mean panel scores for Navel orange juice aftertaste
attributes are shown in Table 4. By week 1, the U 10 -Csample had the most intense sour and bitter aftertaste of all
samples, but there was no significant difference between
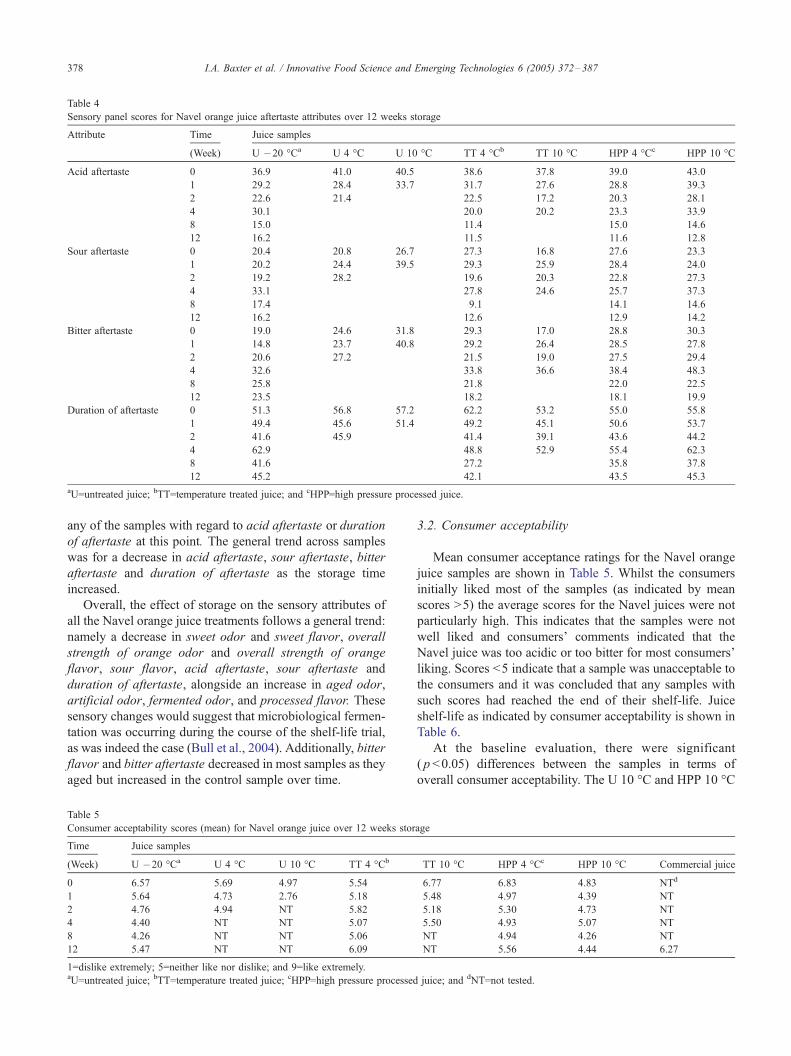
Table 4
Sensory panel scores for Navel orange juice aftertaste attributes over 12 weeks storage
Attribute Time Juice samples
(Week) U �20 -Ca U 4 -C U 10 -C TT 4 -Cb TT 10 -C HPP 4 -Cc HPP 10 -C
Acid aftertaste 0 36.9 41.0 40.5 38.6 37.8 39.0 43.0
1 29.2 28.4 33.7 31.7 27.6 28.8 39.3
2 22.6 21.4 22.5 17.2 20.3 28.1
4 30.1 20.0 20.2 23.3 33.9
8 15.0 11.4 15.0 14.6
12 16.2 11.5 11.6 12.8
Sour aftertaste 0 20.4 20.8 26.7 27.3 16.8 27.6 23.3
1 20.2 24.4 39.5 29.3 25.9 28.4 24.0
2 19.2 28.2 19.6 20.3 22.8 27.3
4 33.1 27.8 24.6 25.7 37.3
8 17.4 9.1 14.1 14.6
12 16.2 12.6 12.9 14.2
Bitter aftertaste 0 19.0 24.6 31.8 29.3 17.0 28.8 30.3
1 14.8 23.7 40.8 29.2 26.4 28.5 27.8
2 20.6 27.2 21.5 19.0 27.5 29.4
4 32.6 33.8 36.6 38.4 48.3
8 25.8 21.8 22.0 22.5
12 23.5 18.2 18.1 19.9
Duration of aftertaste 0 51.3 56.8 57.2 62.2 53.2 55.0 55.8
1 49.4 45.6 51.4 49.2 45.1 50.6 53.7
2 41.6 45.9 41.4 39.1 43.6 44.2
4 62.9 48.8 52.9 55.4 62.3
8 41.6 27.2 35.8 37.8
12 45.2 42.1 43.5 45.3
aU=untreated juice; bTT=temperature treated juice; and cHPP=high pressure processed juice.
I.A. Baxter et al. / Innovative Food Science and Emerging Technologies 6 (2005) 372–387378
any of the samples with regard to acid aftertaste or duration
of aftertaste at this point. The general trend across samples
was for a decrease in acid aftertaste, sour aftertaste, bitter
aftertaste and duration of aftertaste as the storage time
increased.
Overall, the effect of storage on the sensory attributes of
all the Navel orange juice treatments follows a general trend:
namely a decrease in sweet odor and sweet flavor, overall
strength of orange odor and overall strength of orange
flavor, sour flavor, acid aftertaste, sour aftertaste and
duration of aftertaste, alongside an increase in aged odor,
artificial odor, fermented odor, and processed flavor. These
sensory changes would suggest that microbiological fermen-
tation was occurring during the course of the shelf-life trial,
as was indeed the case (Bull et al., 2004). Additionally, bitter
flavor and bitter aftertaste decreased in most samples as they
aged but increased in the control sample over time.
Table 5
Consumer acceptability scores (mean) for Navel orange juice over 12 weeks stor
Time Juice samples
(Week) U �20 -Ca U 4 -C U 10 -C TT 4 -Cb
0 6.57 5.69 4.97 5.54
1 5.64 4.73 2.76 5.18
2 4.76 4.94 NT 5.82
4 4.40 NT NT 5.07
8 4.26 NT NT 5.06
12 5.47 NT NT 6.09
1=dislike extremely; 5=neither like nor dislike; and 9=like extremely.aU=untreated juice; bTT=temperature treated juice; cHPP=high pressure processed
3.2. Consumer acceptability
Mean consumer acceptance ratings for the Navel orange
juice samples are shown in Table 5. Whilst the consumers
initially liked most of the samples (as indicated by mean
scores >5) the average scores for the Navel juices were not
particularly high. This indicates that the samples were not
well liked and consumers’ comments indicated that the
Navel juice was too acidic or too bitter for most consumers’
liking. Scores <5 indicate that a sample was unacceptable to
the consumers and it was concluded that any samples with
such scores had reached the end of their shelf-life. Juice
shelf-life as indicated by consumer acceptability is shown in
Table 6.
At the baseline evaluation, there were significant
( p <0.05) differences between the samples in terms of
overall consumer acceptability. The U 10 -C and HPP 10 -C
age
TT 10 -C HPP 4 -Cc HPP 10 -C Commercial juice
6.77 6.83 4.83 NTd
5.48 4.97 4.39 NT
5.18 5.30 4.73 NT
5.50 4.93 5.07 NT
NT 4.94 4.26 NT
NT 5.56 4.44 6.27
juice; and dNT=not tested.

Table 6
Shelf life of Australian Navel orange juice samples as indicated by
consumer acceptability scores
Sample treatment Shelf life (weeks)
U �20 -Ca �12
TT 4 -Cb �12
HPP 4 -Cc �12
HPP 10 -C 4–12
TT 10 -C 4
U 4 -C <1
U 10 -C <1
aU=untreated juice; bTT=temperature treated juice; and cHPP=high pressure
processed juice.
I.A. Baxter et al. / Innovative Food Science and Emerging Technologies 6 (2005) 372–387 379
samples were liked significantly less than the U �20 -C(control), U 4 -C, TT 4 -C, TT 10 -C and HPP 4 -Csamples. By week 1 of shelf-life, all samples were liked
significantly less than at baseline. In particular, the untreated
Fig. 2. External preference map of consumer acceptability for Navel orange juice s
data from week 4 was not included in the external preference map analysis due to t
juice samples stored at 4 and 10 -C were unacceptable to
consumers and the HPP 10 -C sample was also disliked
slightly. The U �20 -C, HPP 4 -C and both TT samples
were still acceptable to consumers, with the U �20 -Csample being liked significantly more than the HPP 4 -Cand TT 10 -C samples.
After 2 weeks storage there were no significant differences
between the samples for overall acceptability with all samples
receiving a median score of 5.0 (equivalent to Fneither likenor dislike_). The results for week 4 showed that, surprisingly,the U�20 -C sample was disliked by the consumers and was
the least liked sample at that time. The other samples (HPP
and TT samples at both 4 and 10 -C) were still Fneither likenor disliked_ by the consumers. By week 8, the mean scores
for overall acceptability suggested that the U�20 -C and the
HPP 10 -C samples were not liked, whilst the TT 4 -C and
HPP 4 -C samples were Fneither liked nor disliked_.
amples over 12 weeks of storage: (a) attribute plot and (b) sample plot. The
he deviation from the general trend over time for samples at this time point.

Table 7
Volatile compounds important in the flavor of orange juicea
Compound LRIb FTV
(water)c
(Ag/ml)
Concentration
fresh
(Ag/ml)
Concentration
processed
(Ag/ml)
Alcohols
Ethanol <600 53 380 260
(E)-2-hexenol 895 – <0.01 –
(Z)-3-hexenol 887 0.07 <0.01–0.5 0.02
Linalool 1139 0.0038 0.15–2.34 0.6
a-terpineol 1257 0.3 0.09–1.1 0.1–0.8
Aldehydes
Acetaldehyde <600 0.022 3.0–7.0 1.2–3.3
(E)-2-pentenal 790 0.15 <0.01 0.0075
Octanal 1042 0.0005 <0.01–0.3 0.88
Nonanal 1146 0.0043 <0.01–0.04 0.09
Decanal 1251 0.0032 0.01–0.15 0.84
Citral 1322 0.041 0.05–0.3 0.48
Sinensal NDd 0.038 – 0.11
Esters
Ethyl acetate <600 3.0 0.4 0.2
Ethyl propanoate 737 0.005 0.1 –
Methyl butanoate 749 0.059 0.1 0.16
Ethyl butanoate 828 0.00013 0.08–1.4 0.4
Ethyl 2-methylbutanoate 881 0.0001 <0.01–0.1 –
Ethyl 3-hydroxy hexanoate 1169 – 0.5–1.0 0.13
Terpene hydrocarbons
a-limonene 1076 0.21 1.0–80 135–180
Myrcene 1023 0.042 0.05–2.0 2.6
a-pinene 976 1.0 0.02–0.09 0.38
Valencene 1591 – 0.04–0.2 1.05
aAll data taken from Shaw (1991); bLRI=linear retention index, determined
in the current study; cFTV=flavor threshold value, as reported by Shaw
(1991); and dND=not determined.
I.A. Baxter et al. / Innovative Food Science and Emerging Technologies 6 (2005) 372–387380
However, ANOVA of the acceptability data did not find any
significant differences between the four samples, showing
that consumers did not distinguish between these samples in
terms of overall acceptability.
By the final week of testing (week 12 of shelf-life) the
TT 10 -C sample was judged by the sensory scientist to be
unacceptable for consumption. The results (median scores)
from consumer analysis of the remaining samples showed
that the HPP 4 -C, TT 4 -C and U �20 -C samples were
all Fliked slightly_ by the consumers whereas the HPP 10
-C was Fdisliked slightly_. It was clear from the ANOVA
that the consumers did not differentiate between the U
�20 -C, HPP 4 -C and TT 4 -C samples, but these three
samples were liked significantly more than the HPP 10 -Csample.
3.3. Effect of the sensory attributes of the Navel juice
samples on consumer acceptability
Examining the contribution of each sensory attribute to the
model on consumer preference (using the jack-knifing
method) showed that attributes color, acid aftertaste and
sour aftertaste did not have much influence on the PLSR1
model, so the analysis was re-run minus these attributes,
improving the correlation between sensory attributes and
consumer preference and also improving the predictive
ability of the model.
The external preference map is shown in Fig. 2. It was
found that 79% of the variation between the sensory
characteristics of the orange juices could explain 82% of
the variation in consumer preferences. The model had a
correlation coefficient of 0.96 and a validation value
(predictive ability) of 0.84.
In the external preference map (Fig. 2), the further an
attribute is from the origin, the more that attribute contributes
to consumer preference for the orange juice samples. The
attribute plot (top plot in Fig. 2) shows that all the sensory
attributes (once color, acid aftertaste and sour aftertaste were
removed) were important determinants of consumer prefer-
ence. The flavor attribute sweetness (FF_Sweetness_), overallstrength of orange odor (FOD_Overall_) and overall strength
of orange flavor (FF_Overall_) were aligned with overall
liking, demonstrating that these attributes were important for
consumer acceptability, as was sweet odor (FOD_Sweet_).Attributes negatively associated with consumer preference
were those on the left-hand side of the attribute plot,
associated with the negative pole of Principal Component 1
(the X-axis). These included aged odor (FOD_Aged_), fer-mented odor (FOD_Fermented_) and artificial odor (FOD_
Artificial_), processed flavor (FF_Processed_) and bitter flavor(FF_Bitterness_) and bitter aftertaste (FAF_Bitterness_).
The sample plot (bottom plot of Fig. 2) shows that the
preferred samples were the U�20 -C at week 1 and the TT 4
-C, HPP 4 -C, HPP 10 -C and U�20 -C samples, all at week
12. The only sample that was disliked was the U 10 -C sample
at week 1, but it must be noted that samples were pulled from
the trained panel and consumer analysis if microbiological
tests deemed them to be unfit for consumption and samples
were not included in the consumer sensory analysis if the
sensory staff judged them to be too unpleasant.
3.4. Chemical analysis
Twenty-two volatile compounds have been identified as
important in the flavor of orange juice (Shaw, 1991). These
compounds are recorded in Table 7 together with their linear
retention indexes (LRI), flavor threshold values (FTV) in
water and concentration ranges in fresh and processed juice
(all data taken from Shaw, 1991). Of these compounds
sinensal and ethyl 2-methylbutanoate were not detected in
any of our juice samples. As a consequence, our studies
have concentrated on the remaining 20 compounds. The
relative concentrations (RC) of these compounds in juice
samples stored over a period of 12 weeks are reported in
Tables 8–10. With the exception of the U �20 -C (control
juice), the other six juices were stored at both 4 and 10 -C.At week zero, the RC of the selected compounds was
relatively consistent for all seven juices (Table 8). However,

Table 8
Relative concentrations (Ag/ml) of volatile flavor compounds in Navel orange juice samples at week zero and stored for 1 week
Compound Juice samples
Week zero Week 1
U �20 -Ca U
4 -C
U 10 -C TT
4 -Cb
TT
10 -C
HPP
4 - Cc
HPP
10 -C
U �20 -C
U
4 -C
U
10 -C
TT
4 -C
TT
10 -C
HPP
4 -C
HPP
10 -C
Alcohols
Ethanol 10 8.7 8.7 7.6 7.6 11 11 10 3.2 2.9 7.5 8.7 10 8.7
(E)-2-hexenol 0.01 0.02 0.02 NDd ND ND ND ND 0.01 0.01 ND ND ND ND
(Z)-3-hexenol 0.02 0.04 0.04 ND ND 0.03 0.03 0.02 0.02 0.02 ND ND 0.02 ND
Linalool 1.3 1.3 1.3 1.5 1.5 1.5 1.5 1.3 0.5 0.5 1.5 1.6 1.9 1.6
a-terpineol 0.3 0.2 0.2 0.2 0.2 0.2 0.2 0.1 0.3 0.09 0.2 0.2 0.2 0.2
Aldehydes
Acetaldehyde 0.8 0.1 0.1 ND ND 1.1 1.1 0.2 0.05 1.5 0.01 0.2 0.2 0.2
(E)-2-pentenal 0.01 0.01 0.01 <0.01 <0.01 <0.01 <0.01 <0.01 ND ND ND ND ND ND
Octanal 0.9 0.8 0.7 1.3 1.3 1.0 1.0 0.9 0.03 ND 0.9 1.0 1.1 1.0
Nonanal 0.01 0.01 0.01 0.01 0.01 0.01 0.01 0.01 ND ND 0.01 0.01 0.01 0.01
Decanal 0.07 0.05 0.05 0.1 0.1 0.06 0.06 0.05 0.01 <0.01 0.06 0.06 0.08 0.06
Citral 0.7 0.6 0.6 0.9 0.9 0.6 0.6 0.5 0.04 0.01 0.4 0.4 0.7 0.4
Esters
Ethyl acetate 0.5 0.5 0.5 0.5 0.5 0.5 0.5 0.4 0.2 0.3 0.5 0.5 0.6 0.5
Ethyl propanoate 0.02 0.02 0.02 0.02 0.02 0.02 0.02 0.02 <0.01 ND 0.02 0.02 0.02 0.02
Methyl butanoate 0.05 0.05 0.05 0.07 0.07 0.05 0.05 0.04 0.01 0.01 0.05 0.08 0.07 0.08
Ethyl butanoate 3.4 3.8 3.8 4.9 4.9 3.9 3.9 2.5 0.5 0.2 3.7 5.2 5.0 5.2
Ethyl 3-hydroxy hexanoate 0.2 0.2 0.2 0.2 0.2 0.2 0.2 0.1 0.1 0.2 0.2 0.3 0.2 0.3
Terpene hydrocarbons
a-limonene 73 47 47 68 68 65 65 75 12 13 62 60 75 60
Myrcene 0.4 0.3 0.3 0.4 0.4 0.4 0.4 0.3 0.02 0.03 0.3 0.3 0.4 0.3
a-pinene 0.02 0.01 0.1 0.01 0.01 0.01 0.01 0.01 ND <0.01 0.01 0.01 0.01 0.01
Valencene 0.3 0.3 0.3 0.2 0.2 0.2 0.2 0.08 0.04 0.1 0.1 0.1 0.2 0.1
aU=untreated juice; bTT=temperature treated juice; cHPP=high temperature processed juice; and dND=not detected.
I.A. Baxter et al. / Innovative Food Science and Emerging Technologies 6 (2005) 372–387 381
some differences were apparent, (E)-2-hexenol, (Z)-3-
hexenol and acetaldehyde were not detected in the two TT
juices and acetaldehyde and limonene were present in much
lower concentrations in the U 4 -C and U 10 -C juices. (E)-
2-hexenol was also not detected in the two HPP juices. Even
so, for the majority of compounds the concentrations found
in the unprocessed and processed juices lie within the ranges
reported by Shaw (1991) for fresh and processed juice. A
major exception was ethanol. The concentrations of this
compound were all about 3% of reported values.
To establish the possible role that individual compounds
could have in the flavor of the juices, the RC of each
compound has been compared with the corresponding FTV
reported in Table 7. We have assumed that these values,
determined in water, will be about the same as those in
orange juice. In the U �20 -C (control) sample at week
zero, 11 compounds, linalool, a-terpineol, acetaldehyde,
octanal, nonanal, decanal, citral, ethyl propanoate, ethyl
butanoate, limonene and myrcene (Table 8), had RC equal
to or greater than their reported FTV (Table 7). As four of
these compounds, ethyl butanoate, octanal, limonene and
linalool, greatly exceeded their FTV in all juices, they could
be expected to have an impact on the perceived flavors of
these products.
After storage for 1 week, the RC of the selected
compounds remained comparable with the control, TT and
HPP juices. However, in the untreated juices (U 4 -C and U
10 -C) notable decreases in concentrations were observed
for linalool, octanal, citral, ethyl butanoate, limonene and
myrcene (Table 8). In the U �20 -C, TT and HPP juices,
between 10 and 11 compounds exceeded their FTV but in
the U 10 -C juice only four compounds, linalool,
acetaldehyde, ethyl butanoate and limonene, exceeded these
values.
By week 2 the concentrations for most compounds were
comparable across U �20 -C, TT and HPP 4 -C juices
(Table 9). The FTV of between 10 and 11 compounds were
exceeded in these juices and these were the same
compounds as those identified in juices at week zero
(Table 8). As for the HPP 10 -C juice, the RC of most
compounds were appreciably less than those observed in
the U �20 -C and only seven compounds in this juice
exceeded their FTV. The RC of most compounds in the U
4 -C juice at week 2 were similar to those observed at
week 1 (Table 8). By comparison the U 10 -C juice had
elevated levels of ethanol, acetaldehyde, ethyl acetate and
limonene. The first three of these compounds were typical
products of fermentation but the large increase in limonene
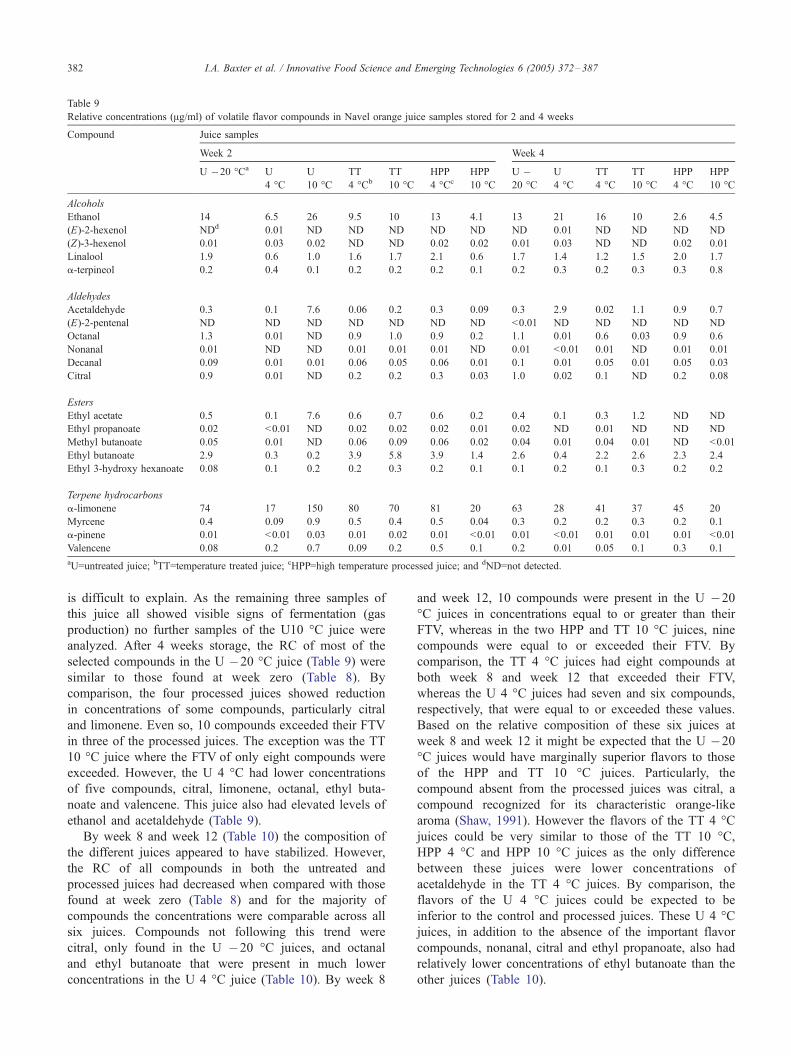
Table 9
Relative concentrations (Ag/ml) of volatile flavor compounds in Navel orange juice samples stored for 2 and 4 weeks
Compound Juice samples
Week 2 Week 4
U �20 -Ca U
4 -C
U
10 -C
TT
4 -Cb
TT
10 -C
HPP
4 -Cc
HPP
10 -C
U �20 -C
U
4 -C
TT
4 -C
TT
10 -C
HPP
4 -C
HPP
10 -C
Alcohols
Ethanol 14 6.5 26 9.5 10 13 4.1 13 21 16 10 2.6 4.5
(E)-2-hexenol NDd 0.01 ND ND ND ND ND ND 0.01 ND ND ND ND
(Z)-3-hexenol 0.01 0.03 0.02 ND ND 0.02 0.02 0.01 0.03 ND ND 0.02 0.01
Linalool 1.9 0.6 1.0 1.6 1.7 2.1 0.6 1.7 1.4 1.2 1.5 2.0 1.7
a-terpineol 0.2 0.4 0.1 0.2 0.2 0.2 0.1 0.2 0.3 0.2 0.3 0.3 0.8
Aldehydes
Acetaldehyde 0.3 0.1 7.6 0.06 0.2 0.3 0.09 0.3 2.9 0.02 1.1 0.9 0.7
(E)-2-pentenal ND ND ND ND ND ND ND <0.01 ND ND ND ND ND
Octanal 1.3 0.01 ND 0.9 1.0 0.9 0.2 1.1 0.01 0.6 0.03 0.9 0.6
Nonanal 0.01 ND ND 0.01 0.01 0.01 ND 0.01 <0.01 0.01 ND 0.01 0.01
Decanal 0.09 0.01 0.01 0.06 0.05 0.06 0.01 0.1 0.01 0.05 0.01 0.05 0.03
Citral 0.9 0.01 ND 0.2 0.2 0.3 0.03 1.0 0.02 0.1 ND 0.2 0.08
Esters
Ethyl acetate 0.5 0.1 7.6 0.6 0.7 0.6 0.2 0.4 0.1 0.3 1.2 ND ND
Ethyl propanoate 0.02 <0.01 ND 0.02 0.02 0.02 0.01 0.02 ND 0.01 ND ND ND
Methyl butanoate 0.05 0.01 ND 0.06 0.09 0.06 0.02 0.04 0.01 0.04 0.01 ND <0.01
Ethyl butanoate 2.9 0.3 0.2 3.9 5.8 3.9 1.4 2.6 0.4 2.2 2.6 2.3 2.4
Ethyl 3-hydroxy hexanoate 0.08 0.1 0.2 0.2 0.3 0.2 0.1 0.1 0.2 0.1 0.3 0.2 0.2
Terpene hydrocarbons
a-limonene 74 17 150 80 70 81 20 63 28 41 37 45 20
Myrcene 0.4 0.09 0.9 0.5 0.4 0.5 0.04 0.3 0.2 0.2 0.3 0.2 0.1
a-pinene 0.01 <0.01 0.03 0.01 0.02 0.01 <0.01 0.01 <0.01 0.01 0.01 0.01 <0.01
Valencene 0.08 0.2 0.7 0.09 0.2 0.5 0.1 0.2 0.01 0.05 0.1 0.3 0.1
aU=untreated juice; bTT=temperature treated juice; cHPP=high temperature processed juice; and dND=not detected.
I.A. Baxter et al. / Innovative Food Science and Emerging Technologies 6 (2005) 372–387382
is difficult to explain. As the remaining three samples of
this juice all showed visible signs of fermentation (gas
production) no further samples of the U10 -C juice were
analyzed. After 4 weeks storage, the RC of most of the
selected compounds in the U �20 -C juice (Table 9) were
similar to those found at week zero (Table 8). By
comparison, the four processed juices showed reduction
in concentrations of some compounds, particularly citral
and limonene. Even so, 10 compounds exceeded their FTV
in three of the processed juices. The exception was the TT
10 -C juice where the FTV of only eight compounds were
exceeded. However, the U 4 -C had lower concentrations
of five compounds, citral, limonene, octanal, ethyl buta-
noate and valencene. This juice also had elevated levels of
ethanol and acetaldehyde (Table 9).
By week 8 and week 12 (Table 10) the composition of
the different juices appeared to have stabilized. However,
the RC of all compounds in both the untreated and
processed juices had decreased when compared with those
found at week zero (Table 8) and for the majority of
compounds the concentrations were comparable across all
six juices. Compounds not following this trend were
citral, only found in the U �20 -C juices, and octanal
and ethyl butanoate that were present in much lower
concentrations in the U 4 -C juice (Table 10). By week 8
and week 12, 10 compounds were present in the U �20
-C juices in concentrations equal to or greater than their
FTV, whereas in the two HPP and TT 10 -C juices, nine
compounds were equal to or exceeded their FTV. By
comparison, the TT 4 -C juices had eight compounds at
both week 8 and week 12 that exceeded their FTV,
whereas the U 4 -C juices had seven and six compounds,
respectively, that were equal to or exceeded these values.
Based on the relative composition of these six juices at
week 8 and week 12 it might be expected that the U �20
-C juices would have marginally superior flavors to those
of the HPP and TT 10 -C juices. Particularly, the
compound absent from the processed juices was citral, a
compound recognized for its characteristic orange-like
aroma (Shaw, 1991). However the flavors of the TT 4 -Cjuices could be very similar to those of the TT 10 -C,HPP 4 -C and HPP 10 -C juices as the only difference
between these juices were lower concentrations of
acetaldehyde in the TT 4 -C juices. By comparison, the
flavors of the U 4 -C juices could be expected to be
inferior to the control and processed juices. These U 4 -Cjuices, in addition to the absence of the important flavor
compounds, nonanal, citral and ethyl propanoate, also had
relatively lower concentrations of ethyl butanoate than the
other juices (Table 10).

Table 10
Relative concentrations (Ag/ml) of volatile flavor compounds in Navel orange juice samples stored for 8 and 12 weeks
Compound Juice samples
Week 8 Week 12
U �20 -Ca U
4 -C
TT
4 -Cb
TT
10 -C
HPP
4 -Cc
HPP
10 -C
U
�20 -C
U
4 -C
TT
4 -C
TT
10 -C
HPP
4 -C
HPP
10 -C
Alcohols
Ethanol 0.8 1.1 1.1 1.4 0.4 1.1 1.1 2.0 2.7 0.2 0.9 1.0
(E)-2-hexenol NDd <0.01 ND ND ND ND ND ND ND ND ND ND
(Z)-3-hexenol 0.01 0.04 ND ND 0.01 0.01 0.01 0.04 ND ND 0.01 0.01
Linalool 0.5 0.6 0.6 0.7 0.6 0.7 0.8 0.6 0.7 0.7 0.7 0.7
a-terpineol 0.1 0.1 0.1 0.2 0.09 0.1 0.1 0.2 0.1 0.2 0.1 0.2
Aldehydes
Acetaldehyde 0.1 0.6 0.01 0.2 0.1 0.1 0.2 ND <0.01 0.02 0.03 0.02
(E)-2-pentenal <0.01 ND ND ND ND ND <0.01 ND ND ND ND ND
Octanal 0.3 0.02 0.3 0.2 0.3 0.3 0.3 0.02 0.2 0.1 0.3 0.2
Nonanal <0.01 ND <0.01 <0.01 <0.01 <0.01 <0.01 ND <0.01 <0.01 <0.01 <0.01
Decanal 0.01 <0.01 0.01 0.01 <0.01 <0.01 0.01 <0.01 <0.01 <0.01 <0.01 <0.01
Citral 0.04 ND ND ND ND ND 0.04 ND ND ND ND ND
Esters
Ethyl acetate 0.1 0.1 0.1 0.1 ND 0.06 0.1 0.1 0.2 0.1 0.1 0.06
Ethyl propanoate <0.01 ND <0.01 0.01 <0.01 <0.01 0.01 ND 0.01 <0.01 0.01 <0.01
Methyl butanoate 0.01 <0.01 0.01 0.02 0.02 0.02 0.02 <0.01 0.04 0.02 0.02 0.01
Ethyl butanoate 1.3 0.2 1.6 1.9 2.0 2.0 1.6 0.1 3.1 1.5 1.7 1.4
Ethyl 3-hydroxy hexanoate 0.05 <0.01 ND 0.2 0.1 0.2 0.05 0.1 0.09 0.1 0.1 0.1
Terpene hydrocarbons
a-limonene 19 24 19 24 21 23 28 17 18 15 20 16
Myrcene 0.1 0.2 0.1 0.2 0.1 0.2 0.2 0.1 0.2 0.1 0.2 0.1
a-pinene <0.01 <0.01 <0.01 <0.01 <0.01 <0.01 0.01 <0.01 <0.01 <0.01 <0.01 <0.01
Valencene 0.01 0.07 0.02 0.04 0.03 0.04 0.04 0.02 0.02 0.01 0.03 0.02
aU=untreated juice; bTT=temperature treated juice; cHPP=high tempearature processed juice; and dND=not detected.
I.A. Baxter et al. / Innovative Food Science and Emerging Technologies 6 (2005) 372–387 383
Considerable reductions in the RC of most compounds
were observed in all juices held for 4 weeks at 4 and 10 -C(Table 9) compared with those of the corresponding juices at
week zero (Table 8). Those compounds showing the greatest
reductions in concentrations were octanal, citral, ethyl
butanoate and limonene. However, by week 8, all juices,
including U �20 -C, showed comparable reductions in
concentrations for most compounds (Table 10) compared
with those at week zero (Table 8). In the U �20 -C juice, the
concentration of limonene had decreased from 73 to 19 Ag/ml, ethyl butanoate from 3.4 to 1.3 Ag/ml, linalool from 1.3 to
0.5 Ag/ml, octanal 0.9 to 0.3 Ag/ml and citral from 0.7 to 0.04
Ag/ml (Tables 8 and 10). Similar reductions in concentrations
have been reported by Moshonas and Shaw (2000) for ethyl
butanoate, octanal and citral (geranial) in orange juices stored
in laminated cartons for 7 weeks at 2 -C. The concentrationsof water-soluble compounds were found to be reduced to
30% of their original value and those of oil-soluble
compounds to 70%, after storage for 5 weeks. These authors
also found that for some compounds reduction in concen-
trations of up to 50% occurred when the juice was stored at
�18 -C. Further reductions were not observed over the next 4weeks, when the study was terminated. The major cause of
these losses was absorption by the polymeric liner of the
packaging material (Moshonas & Shaw, 2000). In our studies
we found the concentrations of most compounds stabilized at
week 8 (Table 10).
The final concentrations of these compounds at week
12 varied between 6% and 38% of the original levels. In
the current study, polyethylene terephthalate (PET) bottles
were selected for their suitability for high pressure
processing and reported low absorption of most volatile
orange juice components (Nielsen, 1994). In studies of the
interaction between PET and aroma compounds it has
been shown that only 1–2% of the total content of
myrcene and limonene were absorbed in refillable PET
bottles and that the absorption rate was temperature
dependent (Nielsen, 1994). More recently, Sheung, Min
and Sastry (2004) showed that PET packaging reduced
the absorption of d-limonene and a-pinene from orange
juice as compared to other packaging materials studied.
However, analyses of PET bottles used for the storage of
control samples at �20 -C for more than 12 weeks
showed considerable absorption of the majority of
compounds covered by our survey. Furthermore, although
no attempt was made to quantify the levels of compounds
absorbed by the PET, the total counts recorded by the
GC–MS indicated that the quantities of limonene and

Table 11
Partial least squares regression of individual sensory attributes ( Y variables) as a function of volatile compounds (alcohols and aldehydes; X variables) found in Navel orange juice
Attribute Correlationa Volatile compound h-coefficient (alcohols and aldehydes)
Calibration Validation Factors RMSEP Ethanol (E)-2-hexenol (Z)-3-hexenol Linalool a-terpineol Acetaldehyde (E)-2-pentenal Octanal Nonanal Decanal Citral
Odor
Sweet 0.88 0.84 2 10.27 – 0.14* 0.10 – 0.06 – 0.23* 0.11* – 0.11* 0.16*
Aged 0.50 0.05 2 9.07 – 0.03 �0.05 – 0.15 �0.06 �0.21 – �0.06 – �0.09
Artificial 0.59 0.37 2 6.45 – – �1.09 0.55 0.60 – �2.09* – – – �0.85
Fermented 0.35 0.00 2 5.89 0.11 0.32 0.14 0.22* 0.41 �0.08 0.05 0.18 �0.03 0.21* 0.16
Strength 0.78 0.66 2 12.96 – – – 1.47* 0.98* �0.51 1.18* 1.64* 1.23* 1.52* 1.50*
Flavor
Sour 0.85 0.75 2 9.65 – 0.21* 0.08 0.05* 0.07 – 0.13* 0.09* – 0.09* 0.12*
Sweet 0.76 0.70 2 12.47 – 0.11 – �0.01 0.06 �0.09 0.25* 0.07* 0.15 0.04 0.07
Processed 0.36 0.35 2 12.39 �0.03 0.03 �0.04 0.03 0.04 �0.05 – 0.04 0.03 0.03 –
Bitterness 0.39 0.11 2 11.22 0.01 0.02 – 0.05* 0.03 �0.03 – 0.04* 0.03 0.04 0.03
Strength 0.81 0.73 2 13.28 – 0.04 – 0.06* 0.09 �0.08 0.14* 0.10* 0.08* 0.09* 0.10
Aftertaste
Acid 0.86 0.79 2 8.62 – 0.18* 0.13* – 0.09 – 0.18* 0.10* – 0.10* 0.15*
Sour 0.59 0.43 1 9.52 0.03 0.03 – 0.06* 0.05* �0.02 0.03* 0.06* 0.03 0.03* 0.06*
Bitter 0.53 0.36 1 10.43 – 0.03 – 0.06* 0.04 �0.03 0.04* 0.06* 0.05 0.06* 0.05*
Duration 0.75 0.60 2 15.96 – 0.10 0.05 0.05* 0.07 �0.08 0.13* 0.08* 0.08 0.07* 0.08*
aFactors=number of PLS factors in the correlation model; RMSEP=root mean square error of prediction; and *=significant variable ( p <0.05) as per the method of Martens uncertainty test.
I.A.Baxter
etal./Innovative
FoodScien
ceandEmerg
ingTech
nologies
6(2005)372–387
384

I.A. Baxter et al. / Innovative Food Science and Emerging Technologies 6 (2005) 372–387 385
myrcene present greatly exceeded the 1–2% reported by
Nielsen (1994). Even so, it is unlikely that absorption
alone can account for all of the losses observed in our
investigation. Chemical reactions such as oxidation,
hydrolysis and acid-catalyzed reactions must be consid-
ered as alternative causes for the reduction in aroma
compounds in our untreated and processed juices (Kutty,
Braddock & Sadler, 1994).
3.5. Correlation of flavor attributes with volatile compounds
PLS regression was used to compare combinations of
volatile compounds that correlated with variation in the
sensory response (individual flavor attributes) to the orange
juice consumption. The fit (calibration), predictive ability
(validation) and predictive error (RMSEP) of each PLS-type
1 model are shown in Tables 11 and 12. The number of PLS
factors taken into consideration and the contribution of each
volatile (h-coefficient) to the PLS regression models are
also shown in these tables.
Significant relationships were found between combina-
tions of volatiles and individual sensory attributes of the
Navel orange juices (Tables 11 and 12). For example, sweet
odor (RMSEP=10.27) was correlated with an increase in
(E)-2-hexenol, (E)-2-pentenal, octanal, decanal, citral, ethyl
propanoate, methyl butanoate and ethyl butanoate. Tables 11
and 12 also show the important contribution to Navel
orange juice odor, flavor and aftertaste made by the volatile
compounds (E)-2-pentenal, octanal, decanal, citral, ethyl
propanoate, methyl butanoate and ethyl butanoate, with an
Table 12
Partial least squares regression of individual sensory attributes ( Y variables) as a fu
found in Navel orange juice
Attribute Correlationa Volatile compound h-coeffic
Calibration Validation Factors RMSEP Ethyl
acetate
Ethyl
propanoate
Methyl
butanoa
Odor
Sweet 0.88 0.84 2 10.27 �0.05 0.14* 0.07*
Aged 0.50 0.05 2 9.07 �0.07 0.02 –
Artificial 0.59 0.41 2 6.93 – 0.51 0.67
Fermented 0.35 0.02 2 5.89 �0.18 0.25 0.24
Strength 0.75 0.69 2 12.41 �0.42 1.85* 1.49*
Flavor
Sour 0.85 0.74 2 10.59 – 0.15* 0.10*
Sweet 0.78 0.70 2 12.48 �0.11 0.16* 0.03
Processed 0.36 0.36 2 12.39 �0.06 0.05 0.05*
Bitterness 0.39 0.11 2 11.22 �0.03 0.05 0.05*
Strength 0.81 0.73 2 13.33 �0.09 0.16* 0.07*
Aftertaste
Acid 0.86 0.79 2 9.26 �0.08 0.14* 0.07*
Sour 0.59 0.45 1 10.59 �0.02 0.07* 0.07*
Bitter 0.53 0.36 1 11.43 �0.03 0.08* 0.06*
Duration 0.75 0.60 2 16.26 �0.10 0.14* 0.07
aFactors=number of PLS factors in the correlation model; RMSEP=root mean squa
Martens uncertainty test.
increase in these volatile compounds being significantly
correlated with the majority of sensory attributes.
3.6. Acceptability of stored orange juice
The shelf-life of the seven samples of untreated and
processed orange juices is recorded in Table 6. Of these
juices only three, U �20 -C, HPP 4 -C and TT 4 -C, werestill acceptable to consumers after 12 weeks storage. Tasting
of the other juices, with the exception of HPP 10 -C, hadceased by week 8 for microbiological safety reasons. By
comparison, analysis of the volatile compounds was
continued for the full 12 weeks for six of the juices. The
exception was U 10 -C juice that was discarded after 2
weeks storage.
At the commencement of this study it was assumed that
the volatile content of the U �20 -C juices would remain
reasonably constant and that any variation in the concen-
trations of the selected compounds would only be observed
in the processed juices stored at 4 and 10 -C. The analyticaldata initially appeared to justify these assumptions when at
week 4 the concentrations of several compounds had
decreased appreciably in the juices stored at 4 and 10 -Ccompared with those of the U �20 -C juice (Table 9).
However, these decreases were not reflected in the sensory
data as the strength of orange odor and strength of orange
flavor for the control and processed juices all received
similar scores (Fig. 1 and Table 3). The sensory data can be
explained by the fact that although the concentrations of
several compounds in the processed juices were less than in
nction of volatile compounds (esters and terpene hydrocarbons; X variables)
ient (esters and terpene hydrocarbons)
te
Ethyl
butanoate
Ethyl-3-hydroxy
hexanoate
a-limonene Myrcene a-pinene Valencene
0.09* – – – 0.05 –
– 0.07 �0.06 �0.10 �0.09 �0.07
– 1.77 – �1.01 �0.76 �1.00
0.19 0.40 – �0.07 �0.15 0.04
1.53* 1.01* – – – –
0.10* 0.12 �0.06 �0.11 0.09 –
0.08* – – – – –
0.05 0.08 �0.03 �0.05 �0.06 �0.04
0.05* 0.06* – – �0.01 –
0.08* – – �0.03 – –
0.08* 0.10 – �0.06 – –
0.06* 0.06* 0.03 – – 0.02
0.06* 0.06* – – 0.02 –
0.08* 0.06 �0.03 �0.05 – –
re error of prediction; and *=significant variable ( p <0.05) as per method of

I.A. Baxter et al. / Innovative Food Science and Emerging Technologies 6 (2005) 372–387386
the U �20 -C juices (Table 9) their concentrations still
exceeded the FTV for these compounds (Table 7). By
comparison, the sensory data (Fig. 1 and Table 3) indicated
that the TT 10 -C juice had a stronger aged odor (not
significantly correlated by PLSR with any volatile com-
pounds; Tables 11 and 12), artificial odor (significantly
correlated with (E)-2-pentenal) and fermented odor (sig-
nificantly correlated with linalool and decanal) than the
other juices and that it also had a stronger processed flavor
(significantly correlated with ethyl propanoate). However,
the appearance of these off-odors and off-flavors does not
appear to have any relationship with the presence or absence
of the 20 compounds chosen for analysis.
The assumption that the volatile content of the U �20 -Cjuice would remain constant over 12 weeks storage was
shown to be incorrect by the analysis of samples stored for 8
and 12 weeks (Table 10). In the U �20 -C juices the
concentrations of most compounds had decreased so that
they were now comparable with those juices stored at 4 and
10 -C. The only difference between the three processed
juices still suitable for sensory analysis (TT 4 -C, HPP 4 -Cand HPP 10 -C) and the U �20 -C juices was the absence
of citral from all but the U �20 -C juices (Table 10). PLSR
found the presence of citral to be significantly correlated
with sweet odor, overall strength of orange odor, sour
flavor, overall strength of orange flavor, and all aftertaste
attributes (Table 11). These would all seem to be important
attributes for the characteristic sensory qualities of orange
juice, suggesting that the processed juices were lacking in
these fresh juice characteristics by weeks 8–12. However,
in agreement with the analytical data, the results from the
sensory analyses (Fig. 1 and Table 3) showed no significant
differences in scores for the odor and flavor attributes of the
four juices. Accordingly, the odor and flavor of the three
processed juices TT 4 -C, HPP 4 -C and HPP 10 -C would
appear to be comparable with those of the control juices
stored at �20 -C.With regard to the consumer overall acceptability of the
juices (Table 5) at week 8, the TT 4 -C and HPP 4 -C juices
received a higher rating than the U �20 -C and HPP 10 -Cjuices, whereas at week 12, the TT 4 -C juice received a
higher rating than the U �20 -C and HPP 4 -C juices with
the HPP 10 -C juice receiving the lowest rating. These
results would suggest that the consumer panel used
sensations other than odor and flavor to rate these juices.
4. Conclusion
In the present study, Navel orange juice processed by
HPP was shown to be stable for up to 12 weeks when
stored at either 4 or 10 -C; by sensory analysis these juices
were shown to have odor and flavor profiles comparable
with those of a control juice stored at �20 -C and a TT
juice stored at 4 -C. In addition, the three processed juices
had marginally superior aftertaste attributes than the U
�20 -C juice. However, according to consumer overall
acceptability the HPP 10 -C juice was inferior to the U
�20 -C, TT 4 -C and HPP 4 -C juices. Analysis by GC–
MS of the four juices after 8 and 12 weeks storage showed
that the volatile contents of these juices, as assessed by the
presence or absence of 20 key aroma compounds, were
very comparable. These findings would suggest that HPP
of orange juice could produce a product acceptable to most
consumers even after storage for 12 weeks at temperatures
up to 10 -C.
Acknowledgements
The authors are grateful for the support given by
members of the laboratory’s high pressure processing team,
the trained sensory panel and the consumers who partici-
pated in the study. Thanks also to Patrick O_Riordan for
assistance with the use of Unscrambler.
References
Anonymous. (1996, January). High pressure juice. Soft Drinks Management
International, 11.
Bettini, M. F. M., Shaw, P. E., & Lancas, F. M. (1998). Sensory and
analytical evaluations of Brazilian orange juices and aromas. Fruit
Processing, 8(7), 283–287.
Bull, M. K., Zerdin, K., Howe, E., Goicoechea, D., Paramanandhan, P.,
Stockman, R., et al. (2004). The effect of high pressure processing on
the microbial, physical and chemical properties of Valencia and Navel
orange juice. Innovative Food Science and Emerging Technologies,
5(2), 135–149.
Chandler, B. V. (1971). Some solubility relationships of limonin. Their
importance in orange juice bitterness. Food Research Quarterly, 31(3),
36–40.
Chen, C. S., Shaw, P. E., & Parish, M. E. (1993). Orange and tangerine
juices. In S. Nagy, C. S. Chen, & P. E. Shaw (Eds.), Fruit juice
processing technology (pp. 110–165). Auburndale’ Agscience Inc..
Durr, P., & Schobinger, U. (1981). The contribution of some volatiles to the
sensory quality of apple and orange juice odour. In P. Schreier (Ed.),
Flavor ’81 (pp. 179–193). Berlin’ Walter de Gruyter & Co.
Guadagni, D. G., Bomben, J. L., & Mannheim, H. C. (1970). Effect of
temperature on stability of orange aroma solution. Journal of Food
Science, 35, 279–281.
Jia, M., Zhang, H., & Min, D. B. (1998). Optimization of solid-phase
microextraction analysis for headspace flavor compounds of orange
juice. Journal of Agricultural and Food Chemistry, 46, 2744–2747.
Kutty, V., Braddock, R. J., & Sadler, G. D. (1994). Oxidation of a-limonene
in presence of low density polyethylene. Journal of Food Science, 59,
402–405.
MacFie, H. J., Bratchell, N., Greenhoff, K., & Vallis, L. V. (1989). Designs
to balance the effect of order of presentation and first-order carry-over
effects in hall tests. Journal of Sensory Studies, 4(2), 129–148.
Meilgaard, M., Civille, G. V., & Carr, B. T. (1991). Sensory Evaluation
Techniques (3rd edition). New York’ CRC Press.
Moshonas, M. G., & Shaw, P. E. (2000). Changes in volatile flavor
constituents in pasteurized orange juice during storage. Journal of Food
Quality, 23, 61–71.
Naim, M., Striem, B. J., Kanner, J., & Peleg, H. (1988). Potential of ferulic
acid as a precursor to off-flavors in stored orange juice. Journal of Food
Science, 53(2), 500–503.

I.A. Baxter et al. / Innovative Food Science and Emerging Technologies 6 (2005) 372–387 387
Nielsen, T. J. (1994). Limonene and myrcene sorption into refillable
polyethylene terephthalate bottles, and washing effects on removal of
sorbed compounds. Journal of Food Science, 59, 227–230.
Petersen, M. A., Tønder, D., & Poll, L. (1998). Comparison of normal and
accelerated storage of commercial orange juice—Changes in flavour
and content of volatile compounds. Food Quality and Preference,
9(1/2), 43–51.
Shaw, P. E. (1991). Fruits II. In H. Maarse (Ed.), Volatile compounds in
foods and beverages (pp. 305–327). New York’ Marcel Dekker.
Sheung, K. S. M., Min, S., & Sastry, S. K. (2004). Dynamic head
space analyses of orange juice flavour compounds and their
absorption into packaging materials. Journal of Food Science, 69(7),
C549–C556.
Steffen, A., & Pawliszyn, J. (1996). Analysis of flavor volatiles using
headspace solid-phase microextraction. Journal of Agricultural and
Food Chemistry, 44, 2187–2193.
Stone, H., & Sidel, J. L. (1992). Sensory evaluation practices, 2nd edition
(pp. 206–240). Orlando, USA’ Academic Press.
Stone, H., Sidel, J., Oliver, S., Woolsey, A., & Singleton, R. C. (1974).
Sensory evaluation by quantitative descriptive analysis. Food Technol-
ogy, 28(11), 24–34.
Takahashi, F., Pehrsson, P. E., Rovere, P., & Squarcina, N. (1998). High-
pressure processing of fresh orange juice. Industria Conserve, 73(4),
363–368.
Tønder, D., Poll, L., & Petersen, M. A. (1996). Odour analysis of stored
orange juice by GC-odour profiling. In A. J. Taylor, & D. S. Mottram
(Eds.), Flavor science: Recent developments (pp. 350–353). Cam-
bridge, UK’ The Royal Society of Chemistry.
Tønder, D., Petersen, M. A., Poll, L., & Olsen, C. E. (1998).
Discrimination between freshly made and stored reconstituted orange
juice using GC odour profiling and aroma values. Food Chemistry,
61(1/2), 223–229.
Velez, C., Costell, E., Orlando, L., Nadal, M. I., Sendra, J. M., & Izquierdo,
L. (1993). Multidimensional scaling as a method to correlate sensory
and instrumental data of orange juice aromas. Journal of the Science of
Food and Agriculture, 61, 41–46.