High-precision U–Pb ages in the early Tithonian to …...2019/10/01 · Grains were mainly...
16
Supplement of Solid Earth, 10, 1–14, 2019 https://doi.org/10.5194/se-10-1-2019-supplement © Author(s) 2019. This work is distributed under the Creative Commons Attribution 4.0 License. Supplement of High-precision U–Pb ages in the early Tithonian to early Berriasian and implications for the numerical age of the Jurassic–Cretaceous boundary Luis Lena et al. Correspondence to: Luis Lena ([email protected], [email protected]) The copyright of individual parts of the supplement might differ from the CC BY 4.0 License.
Transcript of High-precision U–Pb ages in the early Tithonian to …...2019/10/01 · Grains were mainly...

Supplement of Solid Earth, 10, 1–14, 2019https://doi.org/10.5194/se-10-1-2019-supplement© Author(s) 2019. This work is distributed underthe Creative Commons Attribution 4.0 License.
Supplement of
High-precision U–Pb ages in the early Tithonian to early Berriasian andimplications for the numerical age of the Jurassic–Cretaceous boundaryLuis Lena et al.
Correspondence to: Luis Lena ([email protected], [email protected])
The copyright of individual parts of the supplement might differ from the CC BY 4.0 License.
1
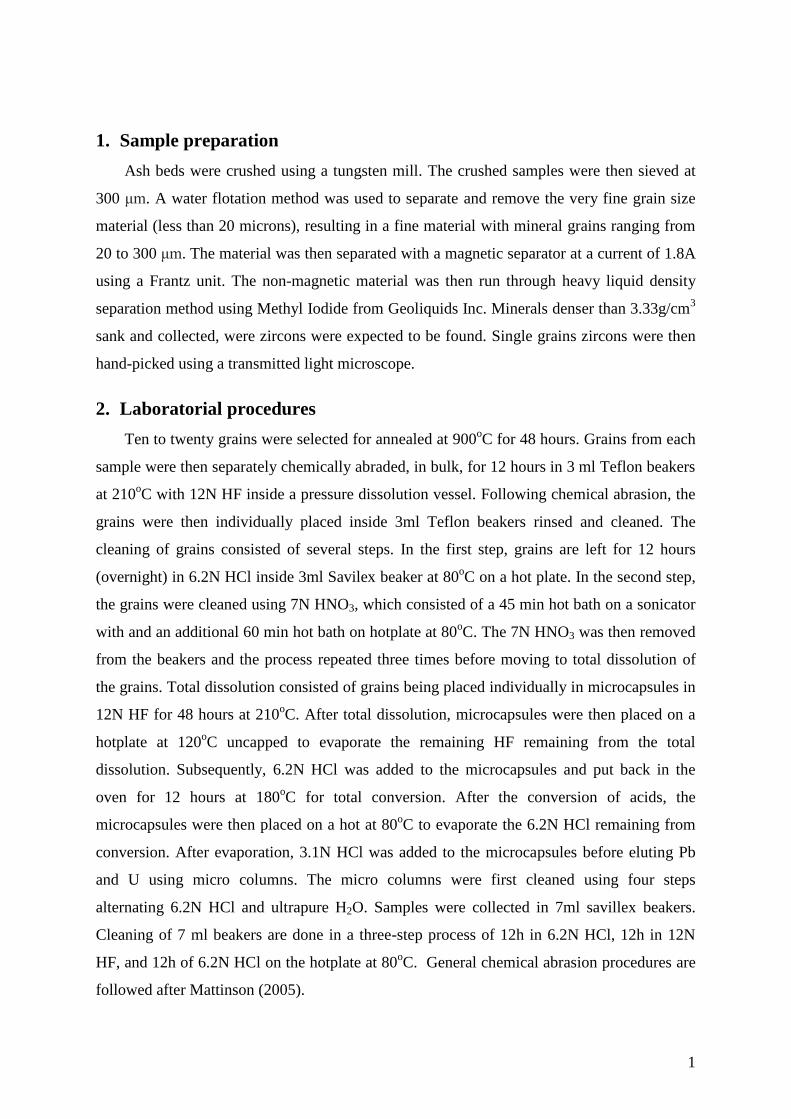
1. Sample preparation
Ash beds were crushed using a tungsten mill. The crushed samples were then sieved at
300 μm. A water flotation method was used to separate and remove the very fine grain size
material (less than 20 microns), resulting in a fine material with mineral grains ranging from
20 to 300 μm. The material was then separated with a magnetic separator at a current of 1.8A
using a Frantz unit. The non-magnetic material was then run through heavy liquid density
separation method using Methyl Iodide from Geoliquids Inc. Minerals denser than 3.33g/cm3
sank and collected, were zircons were expected to be found. Single grains zircons were then
hand-picked using a transmitted light microscope.
2. Laboratorial procedures
Ten to twenty grains were selected for annealed at 900oC for 48 hours. Grains from each
sample were then separately chemically abraded, in bulk, for 12 hours in 3 ml Teflon beakers
at 210oC with 12N HF inside a pressure dissolution vessel. Following chemical abrasion, the
grains were then individually placed inside 3ml Teflon beakers rinsed and cleaned. The
cleaning of grains consisted of several steps. In the first step, grains are left for 12 hours
(overnight) in 6.2N HCl inside 3ml Savilex beaker at 80oC on a hot plate. In the second step,
the grains were cleaned using 7N HNO3, which consisted of a 45 min hot bath on a sonicator
with and an additional 60 min hot bath on hotplate at 80oC. The 7N HNO3 was then removed
from the beakers and the process repeated three times before moving to total dissolution of
the grains. Total dissolution consisted of grains being placed individually in microcapsules in
12N HF for 48 hours at 210oC. After total dissolution, microcapsules were then placed on a
hotplate at 120oC uncapped to evaporate the remaining HF remaining from the total
dissolution. Subsequently, 6.2N HCl was added to the microcapsules and put back in the
oven for 12 hours at 180oC for total conversion. After the conversion of acids, the
microcapsules were then placed on a hot at 80oC to evaporate the 6.2N HCl remaining from
conversion. After evaporation, 3.1N HCl was added to the microcapsules before eluting Pb
and U using micro columns. The micro columns were first cleaned using four steps
alternating 6.2N HCl and ultrapure H2O. Samples were collected in 7ml savillex beakers.
Cleaning of 7 ml beakers are done in a three-step process of 12h in 6.2N HCl, 12h in 12N
HF, and 12h of 6.2N HCl on the hotplate at 80oC. General chemical abrasion procedures are
followed after Mattinson (2005).

2
3. Data acquisition
After the full laboratorial procedures, the samples were dissolved into a silica gel and
gently placed on outgassed Re filaments. Isotopic ratios were acquired using Thermal
Ionization Mass Spectrometry. Samples were run using a either the Thermo Finnigan
TRITON or Isotopx Phoenix in the Department of Earth Sciences, University of Geneva,
Switzerland. Lead (Pb) measurements were acquired in dynamic mode on the SEM (Triton)
or the Daly (Pheonix). Auto focusing and Peak centering were performed at the beginning of
each block, which consisted of 20 cycles each. Lead baseline was monitored by mass 203.5.
Interferences on mass 202
Pb and 205
Pb were monitored by masses 201 and 203, respectively.
EARTHTIME 202
Pb-205
Pb-235
U-233
U and EARTHTIME 205
Pb-235
U-233
U were used as spikes
(Parrish et al., 2006; Parrish and Krogh, 1987). Each measured ratio was corrected for
fractionation using a 202
Pb/205
Pb of 0.99989 when the 202
Pb-205
Pb-235
U-233
U and
EARTHTIME was used. When EARTHTIME 205
Pb-235
U-233
U was used Pb fractionation was
assumed to be 0.13±0.5 % a.m.u (2 S.D). All common Pb measured was assumed to be from
laboratorial blanks. Any sample that contained over 1pg of common Pb was considered to be
contaminated and discarded.
Uranium measurements were made in static mode on Faraday cups 1012
Ω resistors as
UO2+. Auto focusing and peak centering was performed at the beginning of every block, with
each block consisting of 20 cycles each. Baselines were monitored on ±0.5 mass units.
238U/
235U of the sample and blank was assumed to be 137.88 (Chen and Wasserburg, 1980).
The oxide correction in U measurements was assumed 16
OU/18
OU = 0.002. Uranium decay
constant values were used from Jaffey et al. (1971).
Raw U-Pb data was reduced using U-Pb Redux (Bowring et al., 2012) and the data
reported in TS.1. Uncertainty and error propagation algorithm used in Redux software is
described in McLean et al. (2011). For the initial Th disequilibrium deviation was calculated
using 208
Pb and a Th/U of the magma was assumed to be 3.5 (Blackburn et al., 2013).
4. Ash bed age interpretation
All zircons considered in the age distribution of the ash are interpreted as ash-fall deposits
from near-by volcanic eruptions, even though the exact source cannot be known. Individual
zircon grains from each sample were analyzed and subsequently the youngest subset of grains
from the age distribution of each sample were selected for the final weighted mean age. Ages
reported in Fig. 2 and throughout the text are 206
Pb/238
U weighted mean Th-corrected ages.
3
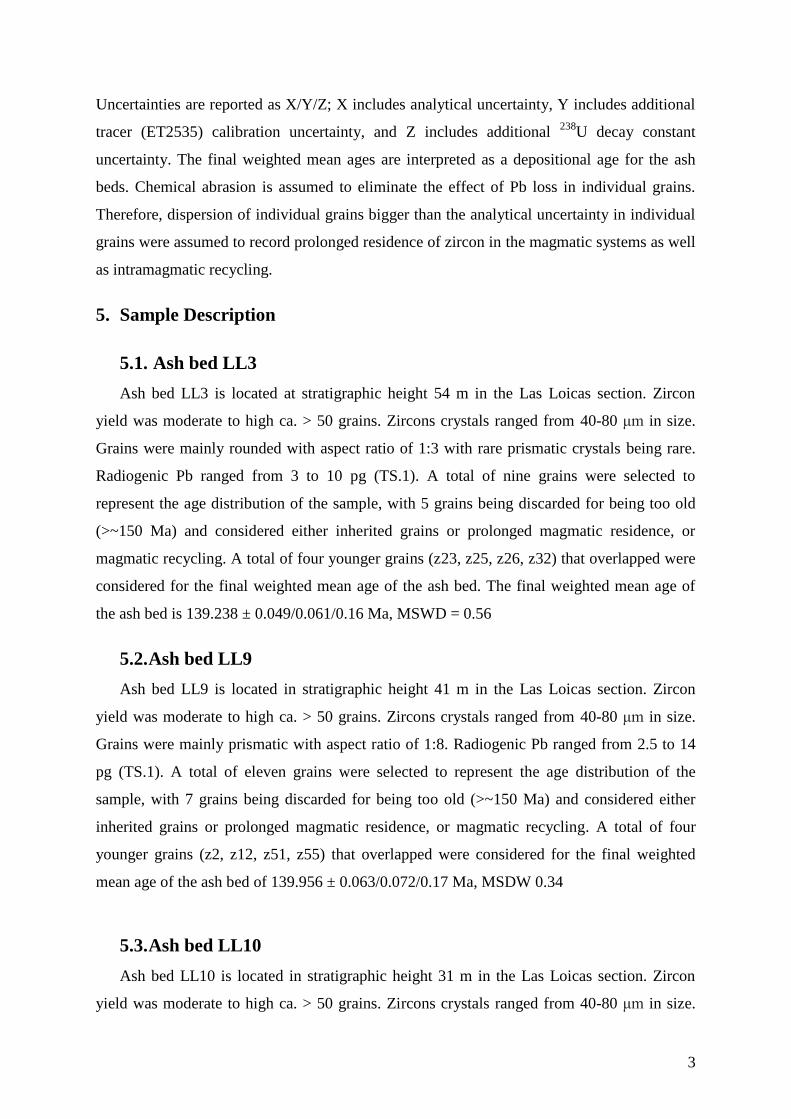
Uncertainties are reported as X/Y/Z; X includes analytical uncertainty, Y includes additional
tracer (ET2535) calibration uncertainty, and Z includes additional 238
U decay constant
uncertainty. The final weighted mean ages are interpreted as a depositional age for the ash
beds. Chemical abrasion is assumed to eliminate the effect of Pb loss in individual grains.
Therefore, dispersion of individual grains bigger than the analytical uncertainty in individual
grains were assumed to record prolonged residence of zircon in the magmatic systems as well
as intramagmatic recycling.
5. Sample Description
5.1. Ash bed LL3
Ash bed LL3 is located at stratigraphic height 54 m in the Las Loicas section. Zircon
yield was moderate to high ca. > 50 grains. Zircons crystals ranged from 40-80 μm in size.
Grains were mainly rounded with aspect ratio of 1:3 with rare prismatic crystals being rare.
Radiogenic Pb ranged from 3 to 10 pg (TS.1). A total of nine grains were selected to
represent the age distribution of the sample, with 5 grains being discarded for being too old
(>~150 Ma) and considered either inherited grains or prolonged magmatic residence, or
magmatic recycling. A total of four younger grains (z23, z25, z26, z32) that overlapped were
considered for the final weighted mean age of the ash bed. The final weighted mean age of
the ash bed is 139.238 ± 0.049/0.061/0.16 Ma, MSWD = 0.56
5.2. Ash bed LL9
Ash bed LL9 is located in stratigraphic height 41 m in the Las Loicas section. Zircon
yield was moderate to high ca. > 50 grains. Zircons crystals ranged from 40-80 μm in size.
Grains were mainly prismatic with aspect ratio of 1:8. Radiogenic Pb ranged from 2.5 to 14
pg (TS.1). A total of eleven grains were selected to represent the age distribution of the
sample, with 7 grains being discarded for being too old (>~150 Ma) and considered either
inherited grains or prolonged magmatic residence, or magmatic recycling. A total of four
younger grains (z2, z12, z51, z55) that overlapped were considered for the final weighted
mean age of the ash bed of 139.956 ± 0.063/0.072/0.17 Ma, MSDW 0.34
5.3. Ash bed LL10
Ash bed LL10 is located in stratigraphic height 31 m in the Las Loicas section. Zircon
yield was moderate to high ca. > 50 grains. Zircons crystals ranged from 40-80 μm in size.
4
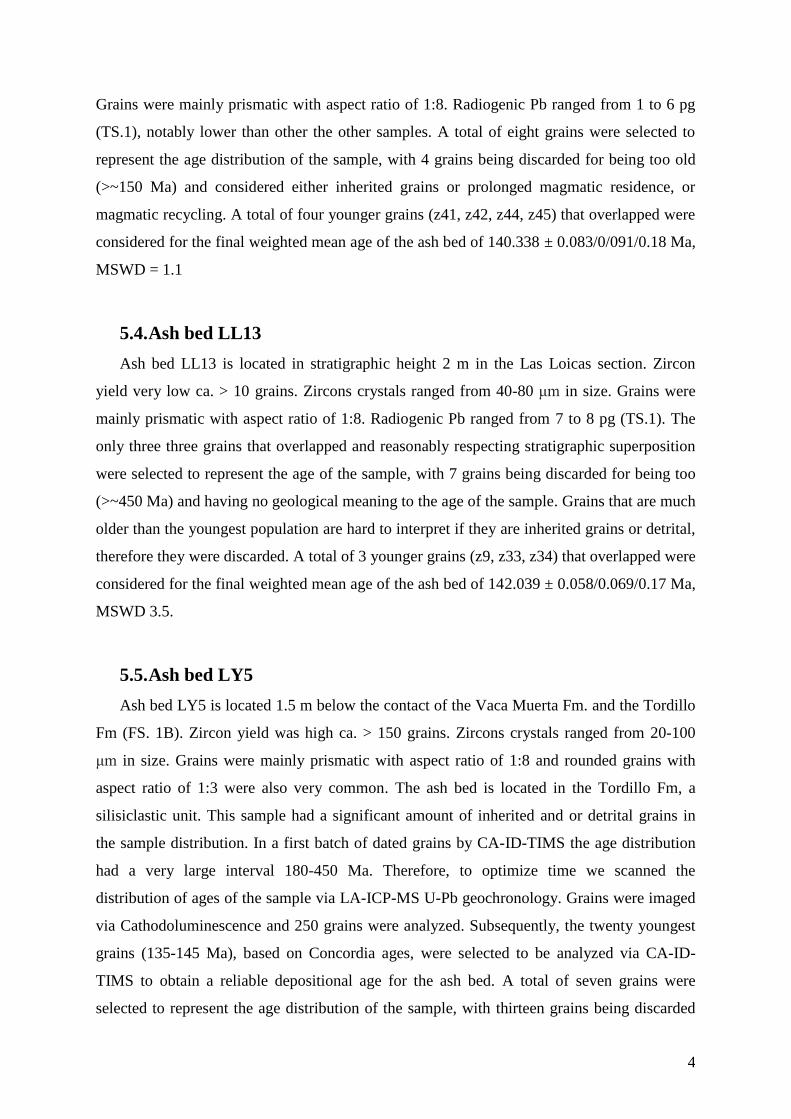
Grains were mainly prismatic with aspect ratio of 1:8. Radiogenic Pb ranged from 1 to 6 pg
(TS.1), notably lower than other the other samples. A total of eight grains were selected to
represent the age distribution of the sample, with 4 grains being discarded for being too old
(>~150 Ma) and considered either inherited grains or prolonged magmatic residence, or
magmatic recycling. A total of four younger grains (z41, z42, z44, z45) that overlapped were
considered for the final weighted mean age of the ash bed of 140.338 ± 0.083/0/091/0.18 Ma,
MSWD = 1.1
5.4. Ash bed LL13
Ash bed LL13 is located in stratigraphic height 2 m in the Las Loicas section. Zircon
yield very low ca. > 10 grains. Zircons crystals ranged from 40-80 μm in size. Grains were
mainly prismatic with aspect ratio of 1:8. Radiogenic Pb ranged from 7 to 8 pg (TS.1). The
only three three grains that overlapped and reasonably respecting stratigraphic superposition
were selected to represent the age of the sample, with 7 grains being discarded for being too
(>~450 Ma) and having no geological meaning to the age of the sample. Grains that are much
older than the youngest population are hard to interpret if they are inherited grains or detrital,
therefore they were discarded. A total of 3 younger grains (z9, z33, z34) that overlapped were
considered for the final weighted mean age of the ash bed of 142.039 ± 0.058/0.069/0.17 Ma,
MSWD 3.5.
5.5. Ash bed LY5
Ash bed LY5 is located 1.5 m below the contact of the Vaca Muerta Fm. and the Tordillo
Fm (FS. 1B). Zircon yield was high ca. > 150 grains. Zircons crystals ranged from 20-100
μm in size. Grains were mainly prismatic with aspect ratio of 1:8 and rounded grains with
aspect ratio of 1:3 were also very common. The ash bed is located in the Tordillo Fm, a
silisiclastic unit. This sample had a significant amount of inherited and or detrital grains in
the sample distribution. In a first batch of dated grains by CA-ID-TIMS the age distribution
had a very large interval 180-450 Ma. Therefore, to optimize time we scanned the
distribution of ages of the sample via LA-ICP-MS U-Pb geochronology. Grains were imaged
via Cathodoluminescence and 250 grains were analyzed. Subsequently, the twenty youngest
grains (135-145 Ma), based on Concordia ages, were selected to be analyzed via CA-ID-
TIMS to obtain a reliable depositional age for the ash bed. A total of seven grains were
selected to represent the age distribution of the sample, with thirteen grains being discarded

5
for being too old (>~150 Ma) and considered either inherited grains or prolonged magmatic
residence or magmatic recycling. A total of four younger grains (z10, z20, z38, z44) that
overlapped were considered for the final weighted mean age of the ash bed of 147.112 ±
0.078/0/088/0.18 Ma, MSWD = 0.81. Radiogenic Pb ranged from 1 to 6 pg (TS.1).
5.6. Ash bed MZT-81
Ash bed MZT-81 is located in stratigraphic height ca. 22.5 m in the Mazatepec section.
Zircon yield high ca. > 100 grains. Zircons crystals ranged from 40-80 μm in size. Grains
were mainly prismatic with aspect ratio of 1:8. Radiogenic Pb ranged from 1 to 6 pg (TS.1),
notably lower than other the other samples. A total of eight grains were selected to represent
the age distribution of the sample, with 4 grains being discarded for being too old (>~150
Ma) and considered either inherited grains or prolonged magmatic residence, or magmatic
recycling. A total of four younger grains (z4, z6, z8, z10) that overlapped were considered for
the final weighted mean age of the ash bed of 140.512 ± 0.031/0/048/0.16 Ma, MSWD = 0.56
6. Age-depth modelling - Bchron Code
library(Bchron)
mydata2 = read.table(file='\\Users\\fortesd0\\Documents\\R\\win-
library\\3.4\\Bchron\\OregonPliens.txt', header=TRUE)
GlenOut = Bchronology(ages=mydata2$ages,
ageSds=mydata2$ageSds,
calCurves=mydata2$calCurves,
positions=mydata2$position,
positionThicknesses=mydata2$thickness,
ids=mydata2$id
predictPositions=seq(0,8400,by=10),iterations = 10000)
plot(GlenOut,main="NeuquenBchron",xlab='Age (Ma)',ylab='Depth (cm)',las=1)
summary(GlenOut)
summary(GlenOut, type='convergence')
summary(GlenOut, type='outliers')
Output <- cbind(apply(GlenOut$thetaPredict, 2, quantile, probs = c(.0025)),
apply(GlenOut$thetaPredict, 2, quantile, probs = c(.5)),
apply(GlenOut$thetaPredict, 2, quantile, probs = c(.975)))
write.csv(Output, file = 'whatever.csv', quote=FALSE, row.names = FALSE)
acc_rate = summary(GlenOut, type = 'acc_rate')

6
plot(acc_rate[,'age_grid'], acc_rate[,'50%'], type='l', ylab = 'cm per year', xlab = 'Age (k cal
years BP)', ylim = range(acc_rate[,-1]))
lines(acc_rate[,'age_grid'], acc_rate[,'2.5%'], lty='dotted')
lines(acc_rate[,'age_grid'], acc_rate[,'97.5%'], lty='dotted')
sed_rate = summary(GlenOut, type = 'sed_rate', useExisting = FALSE)
plot(sed_rate[,'position_grid'], sed_rate[,'50%'], type='l', ylab = 'Years per cm', xlab = 'Depth
(cm)', ylim = range(sed_rate[,-1]))
lines(sed_rate[,'position_grid'], sed_rate[,'2.5%'], lty='dotted')
lines(sed_rate[,'position_grid'], sed_rate[,'97.5%'], lty='dotted')
write.csv(sed_rate, file = 'NeuquenBchron_sed_rates.csv', quote=FALSE, row.names =
FALSE)
write.csv(GlenOut, file = 'NeuquenBchron_sed_rates.csv', quote=FALSE, row.names =
FALSE)

7
7. Supplementary Figure 1 – Fig. S1
Supplementary Figure 1. Stratigraphic distribution of calcareous nannofossils of Mazatepec
section, Mexico.
Co
nu
sph
aer
a m
exic
an
a
Wa
tzn
au
eria
ba
rnes
iae
Wa
tzn
au
eria
fo
ssa
cin
cta
Cyc
lag
elo
sph
aer
a m
arg
erel
ii
Wa
tzn
au
eria
bri
tan
nic
a
Cyc
lag
elo
sph
aer
a d
efla
nd
rei
Wa
tzn
au
eria
co
mm
un
is
Hex
alit
hu
s n
oel
iae
Zeu
grh
ab
do
tus
emb
erg
eri
Po
lyco
stel
la s
ena
ria
Co
cosf
era
Hel
enea
ch
iast
ia
Wa
tzn
au
eria
ma
niv
itia
e
Na
nn
oco
nu
s ka
mp
tner
i min
or
Na
no
con
us
sp.
Ret
eca
psa
oct
ofe
nes
tra
ta
Ret
eca
psa
su
rire
lla
Na
nn
oco
nu
s st
ein
ma
nn
ii
Na
nn
oco
nu
s g
lob
ulu
s
Zeu
grh
ab
do
tus
erec
tus
MZT-92 X X X
MZT-87 X X X X X X X X X X X
MZT-84 X X
MZT-69 X X X
MZT-68 X X X X X
MZT-65 X X X X X X X
MZT-58 X X X X X
MZT-55 X X X
MZT-51 X X
MZT-47 X X X X
MZT-45 X X X X
MZT-30 X X X X X X X
MZT-25 X
MZT-16 X X
MZT-15 X X X X
MZT-12 X X X X
MZT-6 X X X X X
8
8. Supplementary Figure 2 – Fig. S2 - Field Figures

9
10
Supplementary Figure 2 – Field photos. A) Field figure from the Las Loicas section. Location of ash bed LL10 and the location of the JKB in the section. B)
Field figure of the lower part of the La Yesera section where the contact between the Vaca Muerta and the Tordillo formations, and the location of ash bed LY5.
C) location of the JKB in the Mazatepec section in Mexico, see bed MTZ-46 and MTY-45 (see Lopey-Matinez et al. 2013) D) Outcrop view of the Mazatepec
section.
11
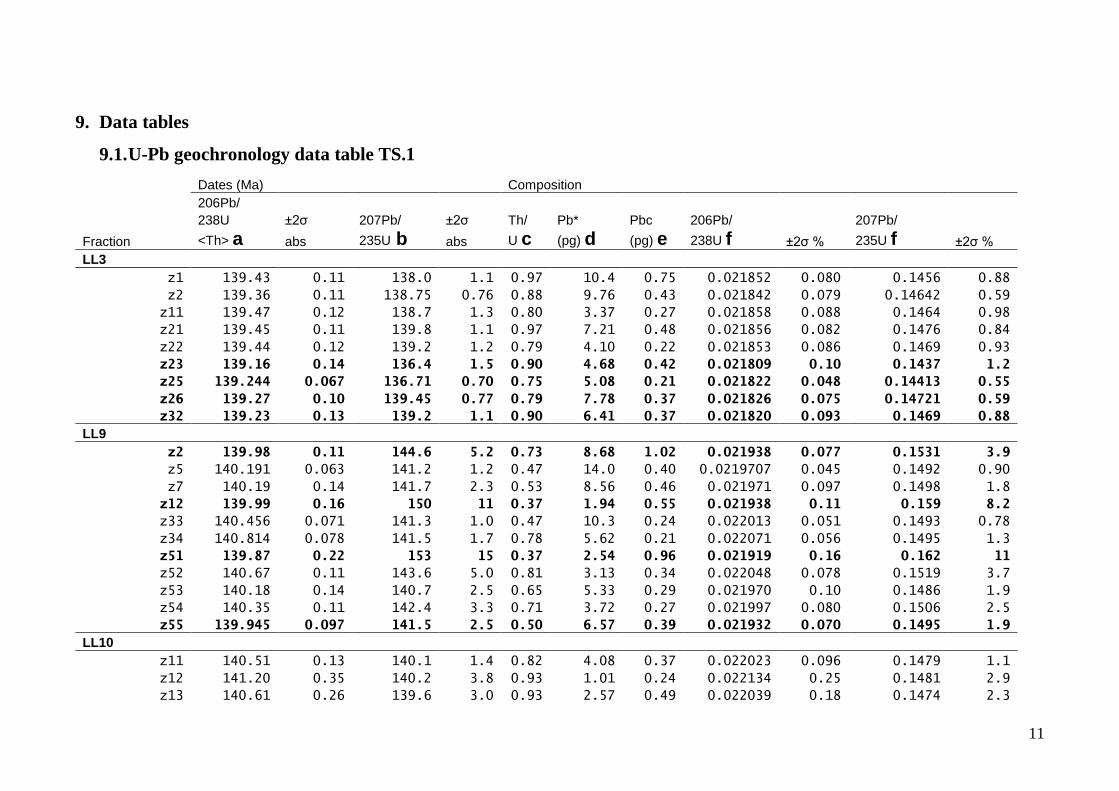
9. Data tables
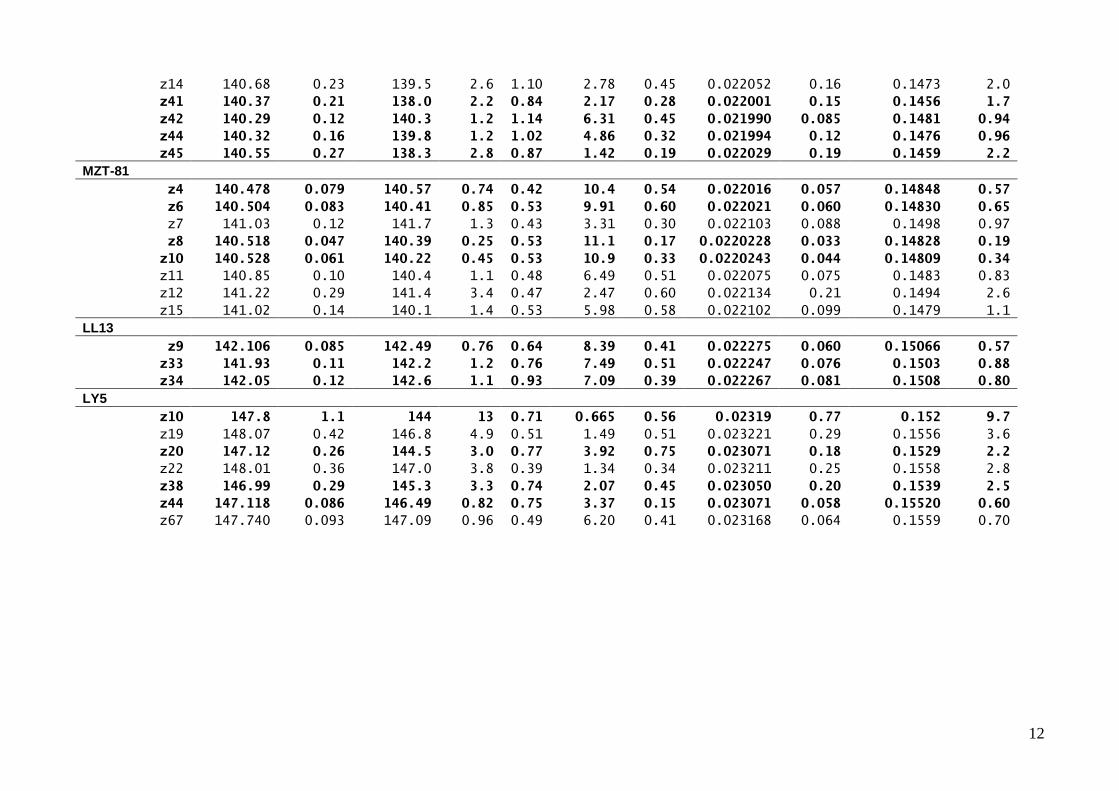
9.1. U-Pb geochronology data table TS.1
Dates (Ma) Composition
206Pb/
238U ±2σ 207Pb/ ±2σ Th/ Pb* Pbc 206Pb/
207Pb/
Fraction <Th> a abs 235U b abs U c (pg) d (pg) e 238U f ±2σ % 235U f ±2σ %
LL3
z1 139.43 0.11 138.0 1.1 0.97 10.4 0.75 0.021852 0.080 0.1456 0.88
z2 139.36 0.11 138.75 0.76 0.88 9.76 0.43 0.021842 0.079 0.14642 0.59
z11 139.47 0.12 138.7 1.3 0.80 3.37 0.27 0.021858 0.088 0.1464 0.98
z21 139.45 0.11 139.8 1.1 0.97 7.21 0.48 0.021856 0.082 0.1476 0.84
z22 139.44 0.12 139.2 1.2 0.79 4.10 0.22 0.021853 0.086 0.1469 0.93
z23 139.16 0.14 136.4 1.5 0.90 4.68 0.42 0.021809 0.10 0.1437 1.2
z25 139.244 0.067 136.71 0.70 0.75 5.08 0.21 0.021822 0.048 0.14413 0.55
z26 139.27 0.10 139.45 0.77 0.79 7.78 0.37 0.021826 0.075 0.14721 0.59
z32 139.23 0.13 139.2 1.1 0.90 6.41 0.37 0.021820 0.093 0.1469 0.88
LL9
z2 139.98 0.11 144.6 5.2 0.73 8.68 1.02 0.021938 0.077 0.1531 3.9
z5 140.191 0.063 141.2 1.2 0.47 14.0 0.40 0.0219707 0.045 0.1492 0.90
z7 140.19 0.14 141.7 2.3 0.53 8.56 0.46 0.021971 0.097 0.1498 1.8
z12 139.99 0.16 150 11 0.37 1.94 0.55 0.021938 0.11 0.159 8.2
z33 140.456 0.071 141.3 1.0 0.47 10.3 0.24 0.022013 0.051 0.1493 0.78
z34 140.814 0.078 141.5 1.7 0.78 5.62 0.21 0.022071 0.056 0.1495 1.3
z51 139.87 0.22 153 15 0.37 2.54 0.96 0.021919 0.16 0.162 11
z52 140.67 0.11 143.6 5.0 0.81 3.13 0.34 0.022048 0.078 0.1519 3.7
z53 140.18 0.14 140.7 2.5 0.65 5.33 0.29 0.021970 0.10 0.1486 1.9
z54 140.35 0.11 142.4 3.3 0.71 3.72 0.27 0.021997 0.080 0.1506 2.5
z55 139.945 0.097 141.5 2.5 0.50 6.57 0.39 0.021932 0.070 0.1495 1.9
LL10
z11 140.51 0.13 140.1 1.4 0.82 4.08 0.37 0.022023 0.096 0.1479 1.1
z12 141.20 0.35 140.2 3.8 0.93 1.01 0.24 0.022134 0.25 0.1481 2.9
z13 140.61 0.26 139.6 3.0 0.93 2.57 0.49 0.022039 0.18 0.1474 2.3
12
z14 140.68 0.23 139.5 2.6 1.10 2.78 0.45 0.022052 0.16 0.1473 2.0
z41 140.37 0.21 138.0 2.2 0.84 2.17 0.28 0.022001 0.15 0.1456 1.7
z42 140.29 0.12 140.3 1.2 1.14 6.31 0.45 0.021990 0.085 0.1481 0.94
z44 140.32 0.16 139.8 1.2 1.02 4.86 0.32 0.021994 0.12 0.1476 0.96
z45 140.55 0.27 138.3 2.8 0.87 1.42 0.19 0.022029 0.19 0.1459 2.2
MZT-81
z4 140.478 0.079 140.57 0.74 0.42 10.4 0.54 0.022016 0.057 0.14848 0.57
z6 140.504 0.083 140.41 0.85 0.53 9.91 0.60 0.022021 0.060 0.14830 0.65
z7 141.03 0.12 141.7 1.3 0.43 3.31 0.30 0.022103 0.088 0.1498 0.97
z8 140.518 0.047 140.39 0.25 0.53 11.1 0.17 0.0220228 0.033 0.14828 0.19
z10 140.528 0.061 140.22 0.45 0.53 10.9 0.33 0.0220243 0.044 0.14809 0.34
z11 140.85 0.10 140.4 1.1 0.48 6.49 0.51 0.022075 0.075 0.1483 0.83
z12 141.22 0.29 141.4 3.4 0.47 2.47 0.60 0.022134 0.21 0.1494 2.6
z15 141.02 0.14 140.1 1.4 0.53 5.98 0.58 0.022102 0.099 0.1479 1.1
LL13
z9 142.106 0.085 142.49 0.76 0.64 8.39 0.41 0.022275 0.060 0.15066 0.57
z33 141.93 0.11 142.2 1.2 0.76 7.49 0.51 0.022247 0.076 0.1503 0.88
z34 142.05 0.12 142.6 1.1 0.93 7.09 0.39 0.022267 0.081 0.1508 0.80
LY5
z10 147.8 1.1 144 13 0.71 0.665 0.56 0.02319 0.77 0.152 9.7
z19 148.07 0.42 146.8 4.9 0.51 1.49 0.51 0.023221 0.29 0.1556 3.6
z20 147.12 0.26 144.5 3.0 0.77 3.92 0.75 0.023071 0.18 0.1529 2.2
z22 148.01 0.36 147.0 3.8 0.39 1.34 0.34 0.023211 0.25 0.1558 2.8
z38 146.99 0.29 145.3 3.3 0.74 2.07 0.45 0.023050 0.20 0.1539 2.5
z44 147.118 0.086 146.49 0.82 0.75 3.37 0.15 0.023071 0.058 0.15520 0.60
z67 147.740 0.093 147.09 0.96 0.49 6.20 0.41 0.023168 0.064 0.1559 0.70
13
a) Corrected for initial Th/U disequilibrium using the radiogenic 208Pb and Th/U (magma)= 3.5
b) Isotopic dates calculated using 238= 1.55125 E-10 (Jaffey et al. 1971) and 235=9.8485E-10 (Jaffey
et al. 1971)
c) Th contents calculated from radiogenic 208Pb and 239Th
-corrected 206Pb/207Pb date of the sample,
assuming concordance between U-Pb and Th-Pb systems
d) Total mass of radiogenic Pb
e) Total mass of common Pb
f) Measured ratios correct for fractionation, tracer and blank.
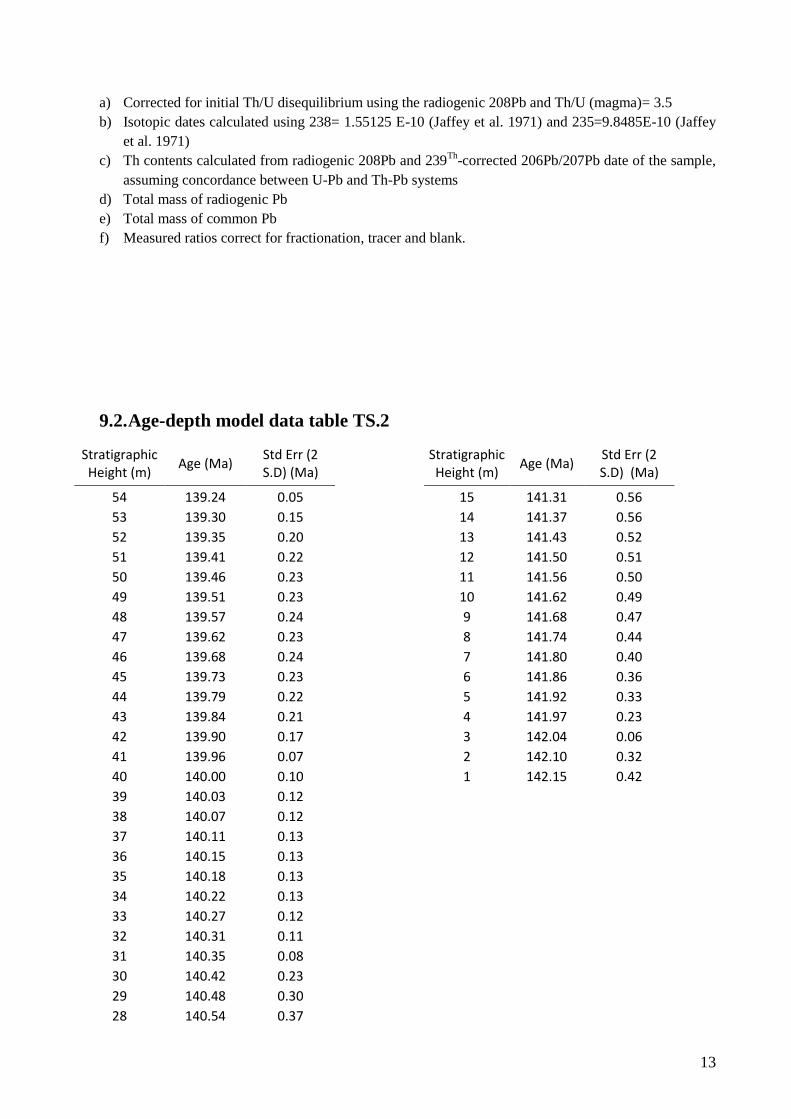
9.2. Age-depth model data table TS.2
Stratigraphic Height (m)
Age (Ma) Std Err (2 S.D) (Ma)
Stratigraphic Height (m)
Age (Ma) Std Err (2 S.D) (Ma)
54 139.24 0.05
15 141.31 0.56
53 139.30 0.15
14 141.37 0.56
52 139.35 0.20
13 141.43 0.52
51 139.41 0.22
12 141.50 0.51
50 139.46 0.23
11 141.56 0.50
49 139.51 0.23
10 141.62 0.49
48 139.57 0.24
9 141.68 0.47
47 139.62 0.23
8 141.74 0.44
46 139.68 0.24
7 141.80 0.40
45 139.73 0.23
6 141.86 0.36
44 139.79 0.22
5 141.92 0.33
43 139.84 0.21
4 141.97 0.23
42 139.90 0.17
3 142.04 0.06
41 139.96 0.07
2 142.10 0.32
40 140.00 0.10
1 142.15 0.42
39 140.03 0.12 38 140.07 0.12 37 140.11 0.13 36 140.15 0.13 35 140.18 0.13 34 140.22 0.13 33 140.27 0.12 32 140.31 0.11 31 140.35 0.08 30 140.42 0.23 29 140.48 0.30 28 140.54 0.37
14
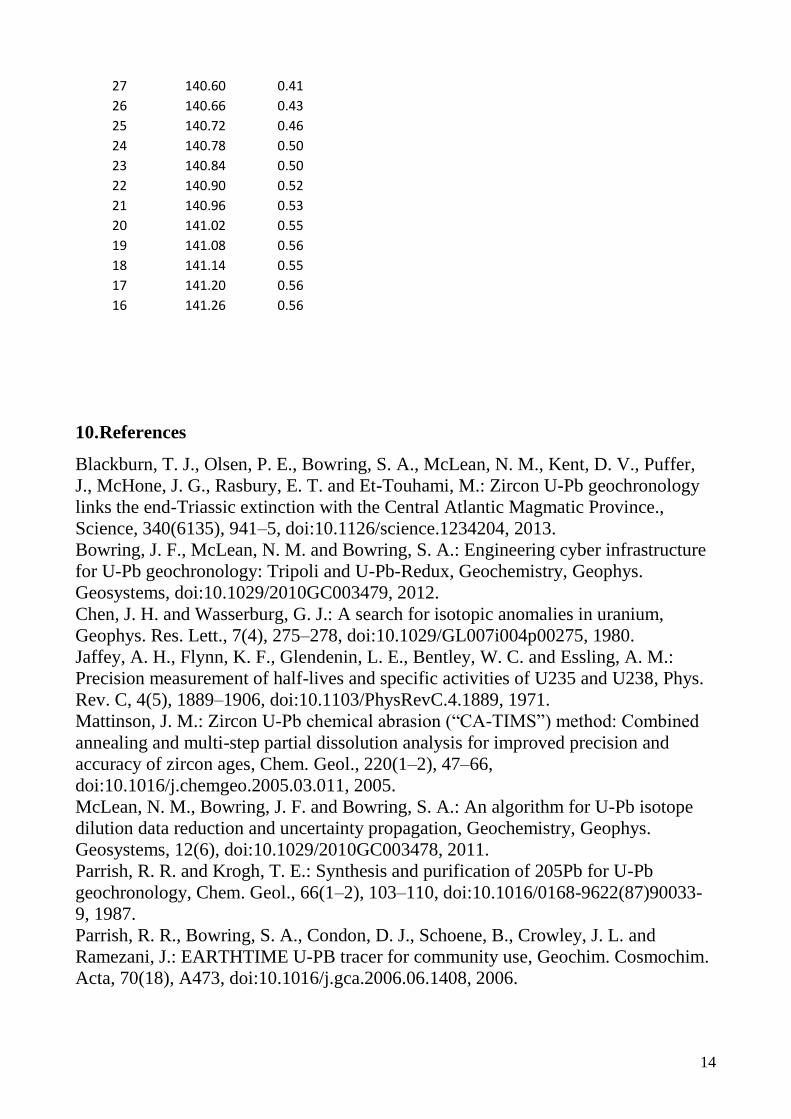
27 140.60 0.41 26 140.66 0.43 25 140.72 0.46 24 140.78 0.50 23 140.84 0.50 22 140.90 0.52 21 140.96 0.53 20 141.02 0.55 19 141.08 0.56 18 141.14 0.55 17 141.20 0.56 16 141.26 0.56
10. References
Blackburn, T. J., Olsen, P. E., Bowring, S. A., McLean, N. M., Kent, D. V., Puffer,
J., McHone, J. G., Rasbury, E. T. and Et-Touhami, M.: Zircon U-Pb geochronology
links the end-Triassic extinction with the Central Atlantic Magmatic Province.,
Science, 340(6135), 941–5, doi:10.1126/science.1234204, 2013.
Bowring, J. F., McLean, N. M. and Bowring, S. A.: Engineering cyber infrastructure
for U-Pb geochronology: Tripoli and U-Pb-Redux, Geochemistry, Geophys.
Geosystems, doi:10.1029/2010GC003479, 2012.
Chen, J. H. and Wasserburg, G. J.: A search for isotopic anomalies in uranium,
Geophys. Res. Lett., 7(4), 275–278, doi:10.1029/GL007i004p00275, 1980.
Jaffey, A. H., Flynn, K. F., Glendenin, L. E., Bentley, W. C. and Essling, A. M.:
Precision measurement of half-lives and specific activities of U235 and U238, Phys.
Rev. C, 4(5), 1889–1906, doi:10.1103/PhysRevC.4.1889, 1971.
Mattinson, J. M.: Zircon U-Pb chemical abrasion (“CA-TIMS”) method: Combined
annealing and multi-step partial dissolution analysis for improved precision and
accuracy of zircon ages, Chem. Geol., 220(1–2), 47–66,
doi:10.1016/j.chemgeo.2005.03.011, 2005.
McLean, N. M., Bowring, J. F. and Bowring, S. A.: An algorithm for U-Pb isotope
dilution data reduction and uncertainty propagation, Geochemistry, Geophys.
Geosystems, 12(6), doi:10.1029/2010GC003478, 2011.
Parrish, R. R. and Krogh, T. E.: Synthesis and purification of 205Pb for U-Pb
geochronology, Chem. Geol., 66(1–2), 103–110, doi:10.1016/0168-9622(87)90033-
9, 1987.
Parrish, R. R., Bowring, S. A., Condon, D. J., Schoene, B., Crowley, J. L. and
Ramezani, J.: EARTHTIME U-PB tracer for community use, Geochim. Cosmochim.
Acta, 70(18), A473, doi:10.1016/j.gca.2006.06.1408, 2006.

15