
High Performance Odoo · echo graph_category openerp echo graph_title openerp rpc request count...
44
High Performance Odoo Olivier Dony @odony
Transcript of High Performance Odoo · echo graph_category openerp echo graph_title openerp rpc request count...

High Performance Odoo
Olivier Dony
@odony

Odoo can handle large data and transaction volumes out
of the box!
On Odoo Online, a typical server hosts more than
3000 instances
100/200 new ones/day
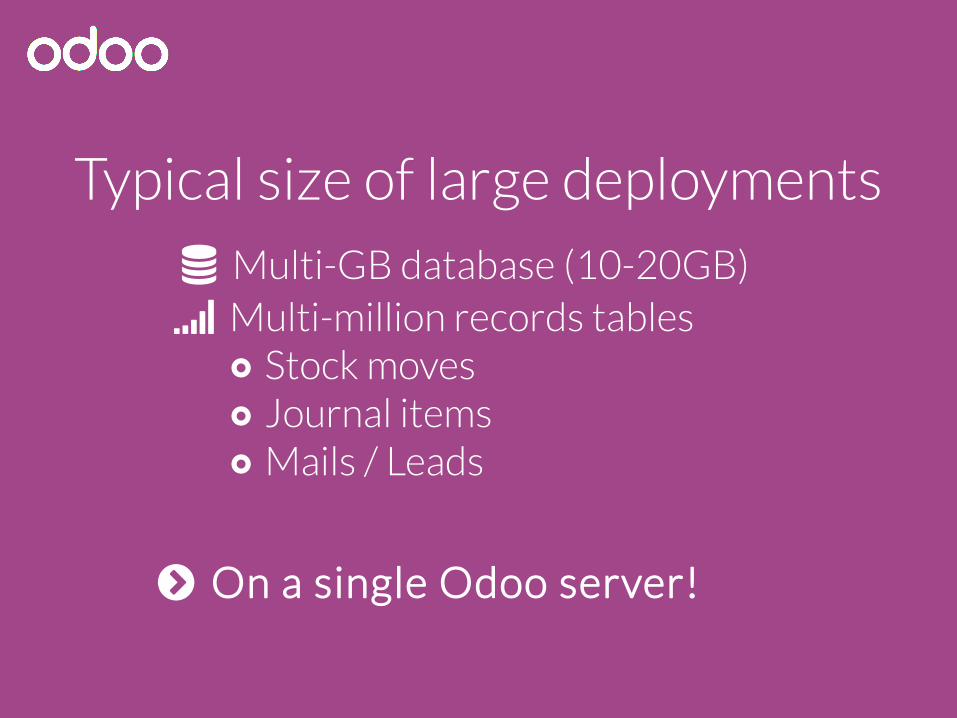
Typical size of large deployments
Multi-GB database (10-20GB) Multi-million records tables
o Stock moveso Journal itemso Mails / Leads
On a single Odoo server!

Performance issues
can be (easily) solved
With the right tools And the right facts

Odoo Performance
o Some Facts
Deployment Architecture
o Monitor & Measure
o Analyze
o Top 5 Problems in Custom Apps
1
2
3
4
5

Some Facts

PostgreSQL
o Is the real workhorse of your Odoo server
o Powers large cloud services
o Can handle terabytes of data efficiently
o Should be fine-tuned to use your hardware
o Cannot magically fix algorithmic/complexity issues in [y]our code!

Hardware Sizing
o 2014 recommandation for single user server for up to ~100 active users
o Intel Xeon E5 2.5Ghz 6c/12t (e.g. E5-1650v2)
o 32GB RAM
o SATA/SAS RAID-1
o On Odoo online, this spec handles 3000 dbs with a load average ≤ 3

Transaction Sizing
o Typical read transaction takes ~100ms
o A single process can handle ~6 t/s
o 8 worker processes = ~50 t/s
o 1 interactive user = ~50 t/m peak = ~1 t/s
o Peak use with 100 users = 100 t/s
o On average, 5-10% of peak = 5-10 t/s

SQL numbers
o Most complex SQL queries should be under 100ms, and the simplest ones < 5ms
o RPC read transactions: <40 queries
o RPC write transactions: 200+ queries
o One DB transaction = 100-300 heavy locks

Sizing
For anything else, appropriate load testingis a must before going live!
Then size accordingly...

Deployment

Odoo Architecture
Front-end pages Back-end JS client
PostgreSQL Store
HTTP Routing
Business Logic (Apps)
Controllers (Front-end, Back-end)
Messaging, Notifications (mail)
ORM
User Interface
Controllers
Models
Persistence

Deployment Architecture
Single server, multi-process
PostgreSQL
Store
HTTP worker
HTTP worker
HTTP worker
Cron worker
gevent worker
Requests
Rule of thumb: --workers=$[1+$CORES*2]

Deployment Architecture
Multi-server, multi-process
PostgreSQL
Store
HTTP workerHTTP workerHTTP worker
Cron workergevent workerRequests
HTTP workerHTTP workerHTTP worker
Cron workergevent worker
Loadbalancer

PostgreSQL Deployment
o Use PostgreSQL 9.2/9.3 for performance
o Tune it: http://wiki.postgresql.org/wiki/Tuning_Your_PostgreSQL_Server
o Avoid deploying PostgreSQL on a VM
o If you must, optimize the VM for IOPS
o Check out vFabric vPostgres 9.2
o Use separate disks for SYSTEM/DATA/WAL
o shared_buffers: more than 55% VM RAM
o Enable guest memory ballooning driver

Monitor & Measure

You cannot improve what you cannot measure!

Monitor & Measure
o Get the pulse of your deployments
o System load
o Disk I/O
o Transactions per second
o Database size
o Recommended tool: munin
o --log-level=debug_rpc in Production!2014-05-03 12:22:32,846 9663 DEBUG test openerp.netsvc.rpc.request: object.execute_kw time:0.031s mem: 763716k -> 763716k (diff: 0k)('test', 1, '*', 'sale.order', 'read', (...), {...})
Monitor & Measure
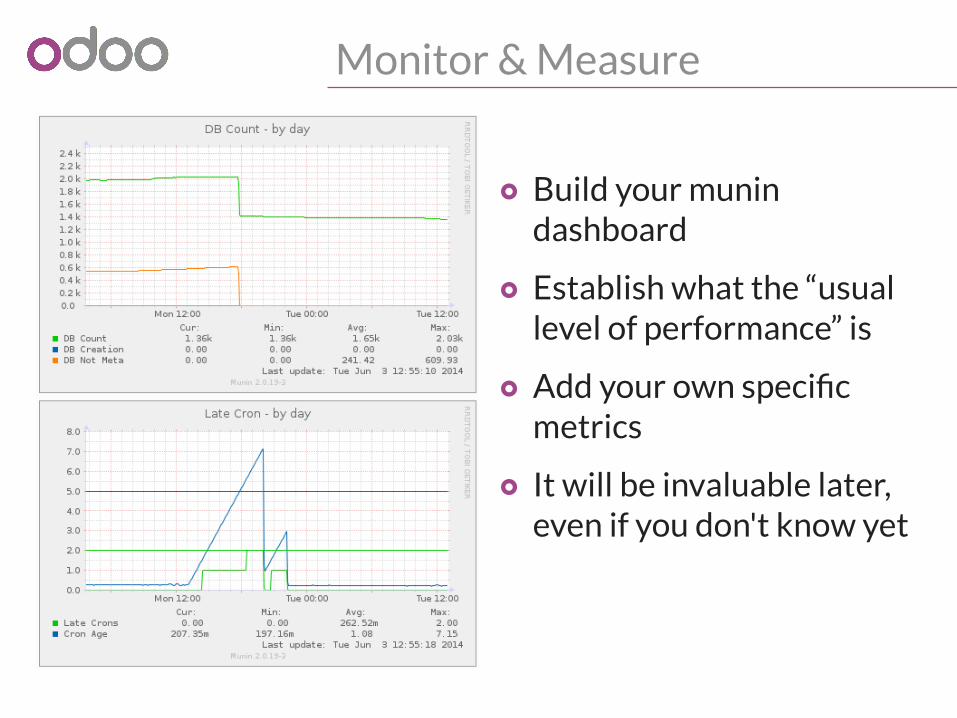
o Build your munin dashboard
o Establish what the “usual level of performance” is
o Add your own specific metrics
o It will be invaluable later, even if you don't know yet
Monitor & Measure
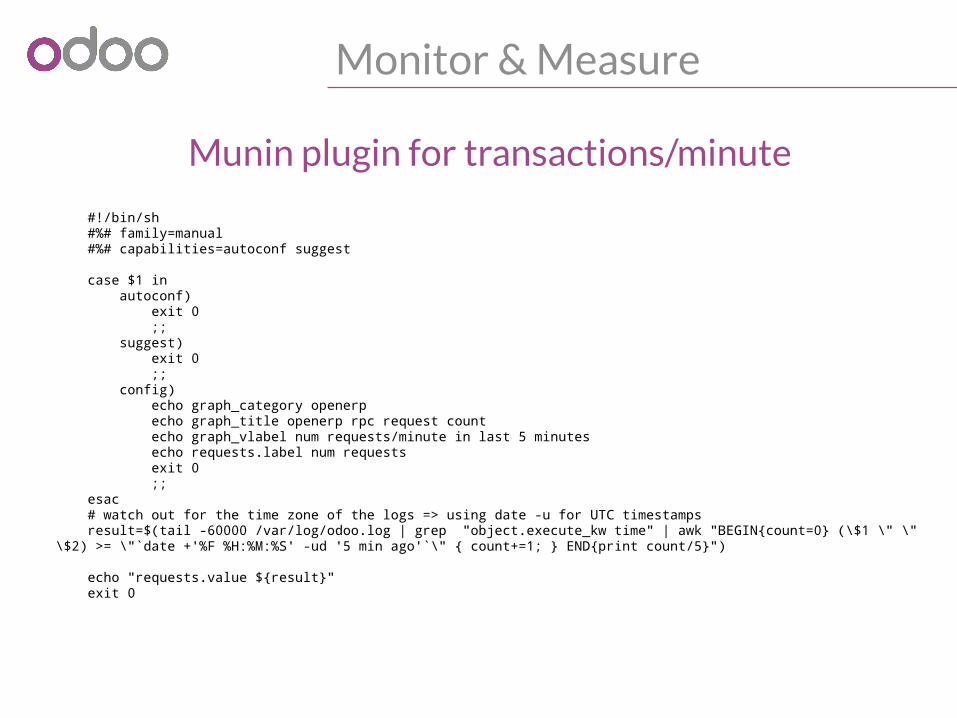
#!/bin/sh #%# family=manual #%# capabilities=autoconf suggest case $1 in autoconf) exit 0 ;; suggest) exit 0 ;; config) echo graph_category openerp echo graph_title openerp rpc request count echo graph_vlabel num requests/minute in last 5 minutes echo requests.label num requests exit 0 ;; esac # watch out for the time zone of the logs => using date -u for UTC timestamps result=$(tail -60000 /var/log/odoo.log | grep "object.execute_kw time" | awk "BEGIN{count=0} (\$1 \" \" \$2) >= \"`date +'%F %H:%M:%S' -ud '5 min ago'`\" { count+=1; } END{print count/5}") echo "requests.value ${result}" exit 0
Munin plugin for transactions/minute

Monitor & Measure
#!/bin/sh #%# family=manual #%# capabilities=autoconf suggest case $1 in config) echo graph_category openerp echo graph_title openerp rpc requests min/average response time echo graph_vlabel seconds echo graph_args --units-exponent -3 echo min.label min echo min.warning 1 echo min.critical 5 echo avg.label average echo avg.warning 1 echo avg.critical 5 exit 0 ;; esac # watch out for the time zone of the logs => using date -u for UTC timestamps result=$(tail -60000 /var/log/openerp.log | grep "object.execute_kw time" | awk "BEGIN{sum=0;count=0} (\$1 \" \" \$2) >= \"`date +'%F %H:%M:%S' -ud '5 min ago'`\" {split(\$8,t,\":\");time=0+t[2];if (min==\"\") { min=time}; sum += time; count+=1; min=(time>min)?min:time } END{print min, sum/count}") echo -n "min.value " echo ${result} | cut -d" " -f1 echo -n "avg.value " echo ${result} | cut -d" " -f2 exit 0
Munin plugin for response time

Monitor PostgreSQL
o Munin has many builtin plugins (enabled with symlinks)
o Enable extra logging in postgresql.conf
o log_min_duration_statement = 50● Set to 0 to log all queries● Instagram gist to capture sample + analyze
o lc_messages = 'C'● For automated log analysis

Analyze

Analysis – Where to start?
o Many factors can impact performance
o Hardware bottlenecks (check munin graphs!)
o Business logic burning CPU● use `kill -3 ${odoo_pid}` for live traces
o Transaction locking in the database
o SQL query performance
Analysis – SQL Logs
o Thanks to extra PostgreSQL logging you can use pg_badger to analyze the query log
o Produces a very insightful statistical report
o Use EXPLAIN ANALYZE to check the behavior of suspicious queries
o Keep in mind that PostgreSQL uses the fastest way, not necessarily the one you expect (e.g. indexes not always used if sequential scan is faster)

PostgreSQL Analysis
o Important statistics tables
o pg_stat_activity: real-time queries/transactions
o pg_locks: real-time transaction heavy locks
o pg_stat_user_tables: generic use stats for tables
o pg_statio_user_tables: I/O stats for tables
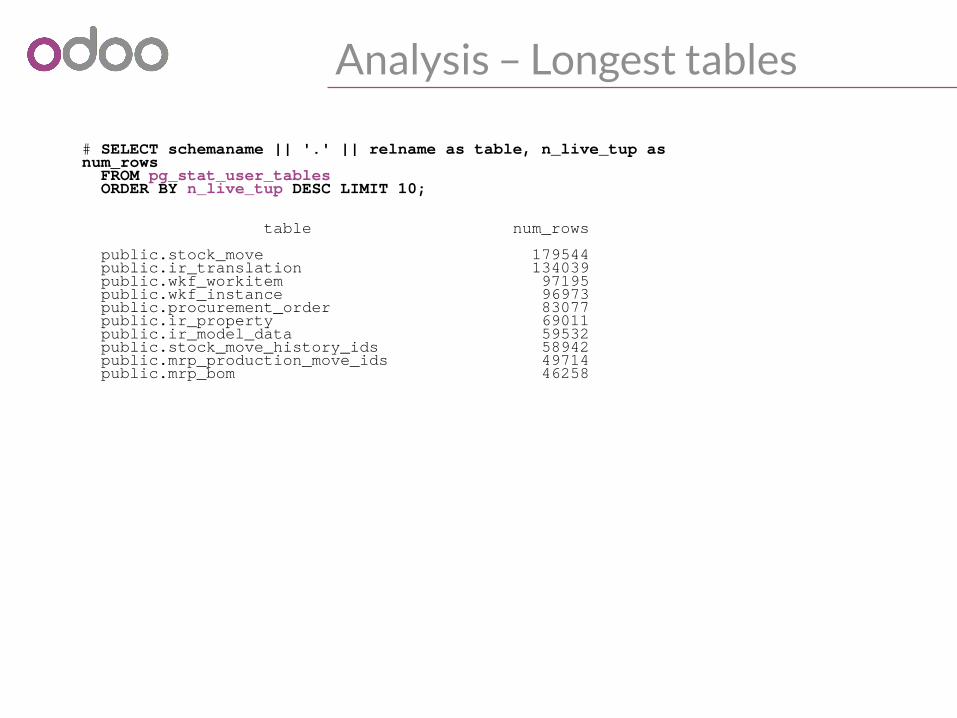
Analysis – Longest tables
# SELECT schemaname || '.' || relname as table, n_live_tup as num_rows FROM pg_stat_user_tables ORDER BY n_live_tup DESC LIMIT 10;
� � � � � � � � � � � � � � � � � � � � � � � � � � � � � � � � � � � � � � � � � � � � � � � � � � � � � � �� table � num_rows �� � � � � � � � � � � � � � � � � � � � � � � � � � � � � � � � � � � � � � � � � � � � � � � � � � � � � � �� public.stock_move � 179544 �� public.ir_translation � 134039 �� public.wkf_workitem � 97195 �� public.wkf_instance � 96973 �� public.procurement_order � 83077 �� public.ir_property � 69011 �� public.ir_model_data � 59532 �� public.stock_move_history_ids � 58942 �� public.mrp_production_move_ids � 49714 �� public.mrp_bom � 46258 �� � � � � � � � � � � � � � � � � � � � � � � � � � � � � � � � � � � � � � � � � � � � � � � � � � � � � � �

Analysis – Biggest tables
# SELECT nspname || '.' || relname AS "table", pg_size_pretty(pg_total_relation_size(C.oid)) AS "total_size" FROM pg_class C LEFT JOIN pg_namespace N ON (N.oid = C.relnamespace) WHERE nspname NOT IN ('pg_catalog', 'information_schema') AND C.relkind <> 'i' AND nspname !~ '^pg_toast' ORDER BY pg_total_relation_size(C.oid) DESC LIMIT 10;┌──────────────────────────────────────────┬────────────┐│ table │ total_size │├──────────────────────────────────────────┼────────────┤│ public.stock_move │ 525 MB ││ public.wkf_workitem │ 111 MB ││ public.procurement_order │ 80 MB ││ public.stock_location │ 63 MB ││ public.ir_translation │ 42 MB ││ public.wkf_instance │ 37 MB ││ public.ir_model_data │ 36 MB ││ public.ir_property │ 26 MB ││ public.ir_attachment │ 14 MB ││ public.mrp_bom │ 13 MB │└──────────────────────────────────────────┴────────────┘

Reduce database size
o Enable filestore for attachments (see FAQ)
o No files in binary fields, use the filestore
Faster dumps and backups
Filestore easy to rsync for backups too

Analysis – Most read tables
# SELECT schemaname || '.' || relname as table, heap_blks_read as disk_reads, heap_blks_hit as cache_reads, heap_blks_read + heap_blks_hit as total_reads FROM pg_statio_user_tables ORDER BY heap_blks_read + heap_blks_hit DESC LIMIT 15;┌───────────────────────────────┬────────────┬─────────────┬─────────────┐│ table │ disk_reads │ cache_reads │ total_reads │├───────────────────────────────┼────────────┼─────────────┼─────────────┤│ public.stock_location │ 53796 │ 60926676388 │ 60926730184 ││ public.stock_move │ 208763 │ 9880525282 │ 9880734045 ││ public.stock_picking │ 15772 │ 4659569791 │ 4659585563 ││ public.procurement_order │ 156139 │ 1430660775 │ 1430816914 ││ public.stock_tracking │ 2621 │ 525023173 │ 525025794 ││ public.product_product │ 11178 │ 225774346 │ 225785524 ││ public.mrp_bom │ 27198 │ 225329643 │ 225356841 ││ public.ir_model_fields │ 1632 │ 203361139 │ 203362771 ││ public.stock_production_lot │ 5918 │ 127915614 │ 127921532 ││ public.res_users │ 416 │ 115506586 │ 115507002 ││ public.ir_model_access │ 6382 │ 104686364 │ 104692746 ││ public.mrp_production │ 20829 │ 101523983 │ 101544812 ││ public.product_template │ 4566 │ 76074699 │ 76079265 ││ public.product_uom │ 18 │ 70521126 │ 70521144 ││ public.wkf_workitem │ 129166 │ 67782919 │ 67912085 │└───────────────────────────────┴────────────┴─────────────┴─────────────┘

Analysis – Most written tables
# SELECT schemaname || '.' || relname as table, seq_scan,idx_scan,idx_tup_fetch+seq_tup_read lines_read_total, n_tup_ins as num_insert,n_tup_upd as num_update, n_tup_del as num_delete FROM pg_stat_user_tables ORDER BY n_tup_upd DESC LIMIT 10;
� � � � � � � � � � � � � � � � � � � � � � � � � � � � � � � � � � � � � � � � � � � � � � � � � � � � � � � � � � � � � � � � � � � � � � � � � � � � � � � � � � � � � � � � � � � � � � � � � � � � � � � � � � � � � � � � � � � � � � � �� table � seq_scan � idx_scan � lines_read_total � num_insert � num_update � num_delete �� � � � � � � � � � � � � � � � � � � � � � � � � � � � � � � � � � � � � � � � � � � � � � � � � � � � � � � � � � � � � � � � � � � � � � � � � � � � � � � � � � � � � � � � � � � � � � � � � � � � � � � � � � � � � � � � � � � � � � � �� public.stock_move � 1188095 � 1104711719 � 132030135782 � 208507 � 9556574 � 67298 �� public.procurement_order � 226774 � 22134417 � 11794090805 � 92064 � 6882666 � 27543 �� public.wkf_workitem � 373 � 17340039 � 29910699 � 1958392 � 3280141 � 1883794 �� public.stock_location � 41402098 � 166316501 � 516216409246 � 97 � 2215107 � 205 �� public.stock_picking � 297984 � 71732467 � 5671488265 � 9008 � 1000966 � 1954 �� public.stock_production_lot � 190934 � 28038527 � 1124560295 � 4318 � 722053 � 0 �� public.mrp_production � 270568 � 13550371 � 476534514 � 3816 � 495776 � 1883 �� public.sale_order_line � 30161 � 4757426 � 60019207 � 2077 � 479752 � 320 �� public.stock_tracking � 656404 � 97874788 � 5054452666 � 5914 � 404469 � 0 �� public.ir_cron � 246636 � 818 � 2467441 � 0 � 169904 � 0 �� � � � � � � � � � � � � � � � � � � � � � � � � � � � � � � � � � � � � � � � � � � � � � � � � � � � � � � � � � � � � � � � � � � � � � � � � � � � � � � � � � � � � � � � � � � � � � � � � � � � � � � � � � � � � � � � � � � � � � � �

Analysis – Locking (9.1)
-- For PostgreSQL 9.1create view pg_waiter_holder as select wait_act.datname, pg_class.relname, wait_act.usename, waiter.pid as waiterpid, waiter.locktype, waiter.transactionid as xid, waiter.virtualtransaction as wvxid, waiter.mode as wmode, wait_act.waiting as wwait, substr(wait_act.current_query,1,30) as wquery, age(now(),wait_act.query_start) as wdur, holder.pid as holderpid, holder.mode as hmode, holder.virtualtransaction as hvxid, hold_act.waiting as hwait, substr(hold_act.current_query,1,30) as hquery, age(now(),hold_act.query_start) as hdur from pg_locks holder join pg_locks waiter on ( holder.locktype = waiter.locktype and ( holder.database, holder.relation, holder.page, holder.tuple, holder.virtualxid, holder.transactionid, holder.classid, holder.objid, holder.objsubid ) is not distinct from ( waiter.database, waiter.relation, waiter.page, waiter.tuple, waiter.virtualxid, waiter.transactionid, waiter.classid, waiter.objid, waiter.objsubid )) join pg_stat_activity hold_act on (holder.pid=hold_act.procpid) join pg_stat_activity wait_act on (waiter.pid=wait_act.procpid) left join pg_class on (holder.relation = pg_class.oid) where holder.granted and not waiter.granted order by wdur desc;

Analysis – Locking (9.2)
-- For PostgreSQL 9.2create view pg_waiter_holder as select wait_act.datname, wait_act.usename, waiter.pid as wpid, holder.pid as hpid, waiter.locktype as type, waiter.transactionid as xid, waiter.virtualtransaction as wvxid, holder.virtualtransaction as hvxid, waiter.mode as wmode, holder.mode as hmode, wait_act.state as wstate, hold_act.state as hstate, pg_class.relname, substr(wait_act.query,1,30) as wquery, substr(hold_act.query,1,30) as hquery, age(now(),wait_act.query_start) as wdur, age(now(),hold_act.query_start) as hdur from pg_locks holder join pg_locks waiter on ( holder.locktype = waiter.locktype and ( holder.database, holder.relation, holder.page, holder.tuple, holder.virtualxid, holder.transactionid, holder.classid, holder.objid, holder.objsubid ) is not distinct from ( waiter.database, waiter.relation, waiter.page, waiter.tuple, waiter.virtualxid, waiter.transactionid, waiter.classid, waiter.objid, waiter.objsubid )) join pg_stat_activity hold_act on (holder.pid=hold_act.pid) join pg_stat_activity wait_act on (waiter.pid=wait_act.pid) left join pg_class on (holder.relation = pg_class.oid) where holder.granted and not waiter.granted order by wdur desc;
Analysis – Locking
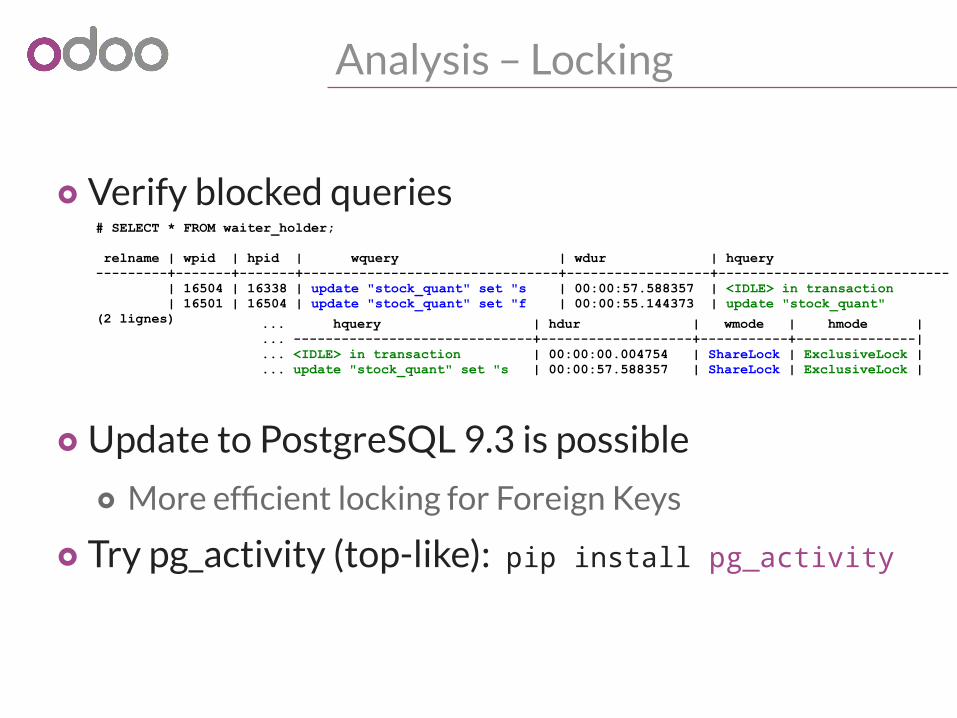
o Verify blocked queries
o Update to PostgreSQL 9.3 is possible
o More efficient locking for Foreign Keys
o Try pg_activity (top-like): pip install pg_activity
# SELECT * FROM waiter_holder;
relname | wpid | hpid | wquery | wdur | hquery ---------+-------+-------+--------------------------------+------------------+----------------------------- | 16504 | 16338 | update "stock_quant" set "s | 00:00:57.588357 | <IDLE> in transaction | 16501 | 16504 | update "stock_quant" set "f | 00:00:55.144373 | update "stock_quant"(2 lignes) ... hquery | hdur | wmode | hmode |
... ------------------------------+-------------------+-----------+---------------|
... <IDLE> in transaction | 00:00:00.004754 | ShareLock | ExclusiveLock |
... update "stock_quant" set "s | 00:00:57.588357 | ShareLock | ExclusiveLock |

Top 5Problems
in Custom Apps

Top 5 Problems in Custom Apps
o 1. Wrong use of stored computed fields
o 2. Domain evaluation strategy
o 3. Business logic triggered too often
o 4. Misuse of the batch API
o 5. Custom locking

1. Stored computed fields
o Be vary careful when you add stored computed fields (using the old API)
o Manually set the right trigger fields + funcstore = {'trigger_model': (mapping_function,
[fields...],
priority) }
store = True is a shortcut for: {self._name: (lambda s,c,u,ids,c: ids,
None,10)}
o Do not add this on master data (products, locations, users, companies, etc.)

2. Domain evaluation strategy
o Odoo cross-object domain expressions do not use JOINs by default, to respect modularity and ACLs
o e.g. search([('picking_id.move_ids.partner_id', '!=', False)])
o Searches all moves without partner!
o Then uses “ id IN <found_move_ids>”!
o Imagine this in record rules (global security filter)
o Have a look at auto_join (v7.0+)'move_ids': fields.one2many('stock.move', 'picking_id', string='Moves', auto_join=True)

3. Busic logic triggered too often
o Think about it twice when you override create() or write() to add your stuff
o How often will this be called? Should it be?
o Think again if you do it on a high-volume object, such as o2m line records (sale.order.line, stock.move, …)
o Again, make sure you don't alter master data

4. Misuse of batch API
o The API works with batches
o Computed fields work in batches
o Model.browse() pre-fetches in batches
o See @one in the new API
5. Custom Locking
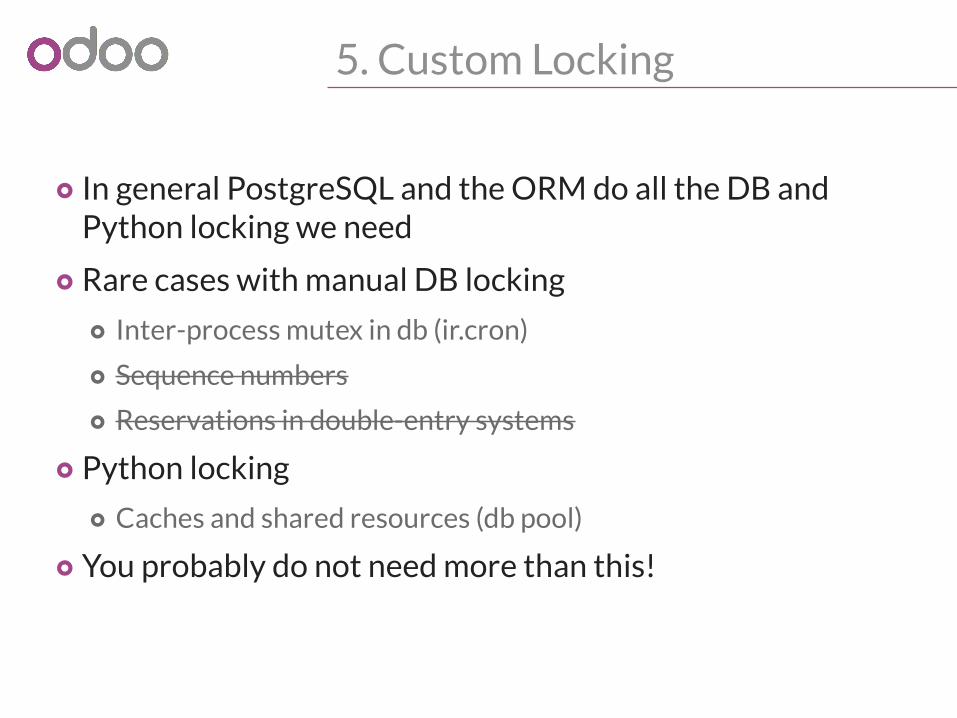
o In general PostgreSQL and the ORM do all the DB and Python locking we need
o Rare cases with manual DB locking
o Inter-process mutex in db (ir.cron)
o Sequence numbers
o Reservations in double-entry systems
o Python locking
o Caches and shared resources (db pool)
o You probably do not need more than this!