HIGH PERFORMANCE LIQUID CHROMATOGRAPHY...
57
HIGH PERFORMANCE LIQUID CHROMATOGRAPHY (HPLC) Dr. Steven R. Myers Professor Department of Pharmacology and Toxicology University of Louisville School of Medicine Louisville, KY USA
Transcript of HIGH PERFORMANCE LIQUID CHROMATOGRAPHY...

HIGH PERFORMANCE LIQUID CHROMATOGRAPHY (HPLC)
Dr. Steven R. Myers
Professor
Department of Pharmacology and Toxicology
University of Louisville School of Medicine
Louisville, KY USA

HIGH PERFORMANCE LIQUID CHROMATOGRAPHY
• High Performance Liquid Chromatography (HPLC) is one of the most
widely used techniques for identification, quantification and purification
of mixtures of organic compounds.
• In HPLC, as in all chromatographic methods, components of a mixture
are partitioned between an adsorbent (the stationary phase) and a
solvent (the mobile phase).
• The stationary phase is made up of very small particles contained in a
steel column. Due to the small particle size (3-5 um), pressure is
required to force the mobile phase through the stationary phase.
• There are a wide variety of stationary phases available for HPLC. In
this lab we will use a normal phase (Silica gel), although reverse phase
(silica gel in which a 18 carbon hydrocarbon is covalently bound to the
surface of the silica) columns are currently one of the most commonly
used HPLC stationary phases.

http://www.chemistry.nmsu.edu/Instrumentation/Waters_HPLC_MS_TitlePg.html
HIGH PERFORMANCE LIQUID CHROMATOGRAPHY
HIGH PERFORMANCE LIQUID CHROMATOGRAPHY

http://www.labhut.com/education/flash/introduction07.php
TLC vs High Performance Liquid Chromatography (HPLC) HPLC Optimization

HPLC – Optimizing Separation
Skoog and Leary: Principals of Instrumental Analysis, 5th ed. Suanders, 1998

Schematic Presentation of a Chromatogram

HPLC - Resolution
• Resolution (RS) of a column provides a quantitative measure of its
ability to separate two analytes
Rs = DZ /1/2(WA+WB)
Rs =

HPLC - Resolution
Rs
Skoog and Leary: Principals of Instrumental Analysis, 4th ed. Suanders, 1992

HPLC - Resolution
Capacity Factor (k’): Also called
retention factor. Is a measure for the
position of a sample peak in the
chromatogram.
k’ = (tR1-to)/to
• specific for a given compound and constant
under constant conditions
• A function of column and mobile phase chemistry
• Primarily applicable under isocratic conditions
• In general, a change in the k’ of one peak will
move all peaks in the same direction.
Selectivity Factor (a): Also called
separation or selectivity coefficient is
defined as
a = k2’/k1’ = (tR2-to) / (tR1-to)
• A function of column and mobile phase chemistry
• Primarily applicable under isocratic conditions
• Changes in selectivity will affect different
compounds in different ways. Skoog and Leary: Principals of Instrumental Analysis, 4th ed. Suanders, 1992
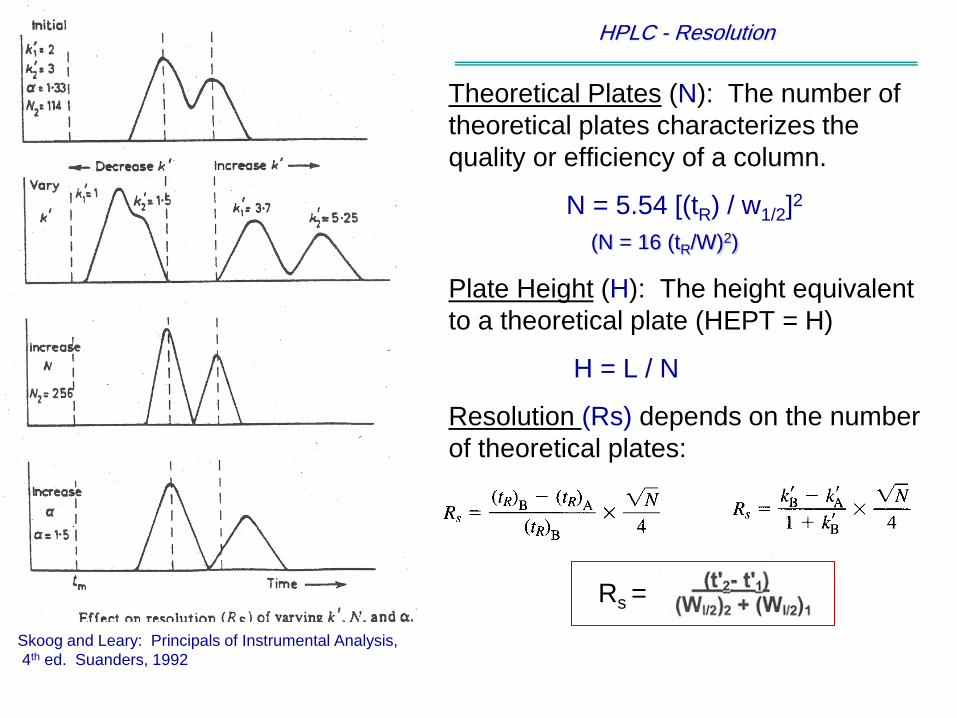
HPLC - Resolution
Theoretical Plates (N): The number of
theoretical plates characterizes the
quality or efficiency of a column.
N = 5.54 [(tR) / w1/2]2
(N = 16 (tR/W)2)
Plate Height (H): The height equivalent
to a theoretical plate (HEPT = H)
H = L / N
Resolution (Rs) depends on the number
of theoretical plates:
Rs =
Skoog and Leary: Principals of Instrumental Analysis,
4th ed. Suanders, 1992

Skoog and Leary: Principals of Instrumental Analysis, 4th ed. Suanders, 1992

HPLC - General Elution Problem
Skoog and Leary: Principals of Instrumental Analysis, 5th ed. Suanders, 1998

x
a
b
c
a b c
c b a
0
0
Time
Time
Normal Phase (SiO2)
Reverse Phase (C18)
Normal Phase (SiO2) TLC
HIGH PERFORMANCE LIQUID CHROMATOGRAPHY (TLC vs Normal Phase and Reverse Phase HPLC)

Skoog and Leary: Principals of Instrumental Analysis,
5th ed. Suanders, 1998
Reverse Phase HPLC

Normal Phase vs. Reverse Phase HPLC
Skoog and Leary: Principals of Instrumental Analysis, 5th ed. Suanders, 1998

RP-HPLC – Stationary Phase
Skoog and Leary: Principals of Instrumental Analysis, 5th ed. Suanders, 1998

RP-HPLC – Mobile Phase (a)
Skoog and Leary: Principals of Instrumental Analysis, 5th ed. Suanders, 1998

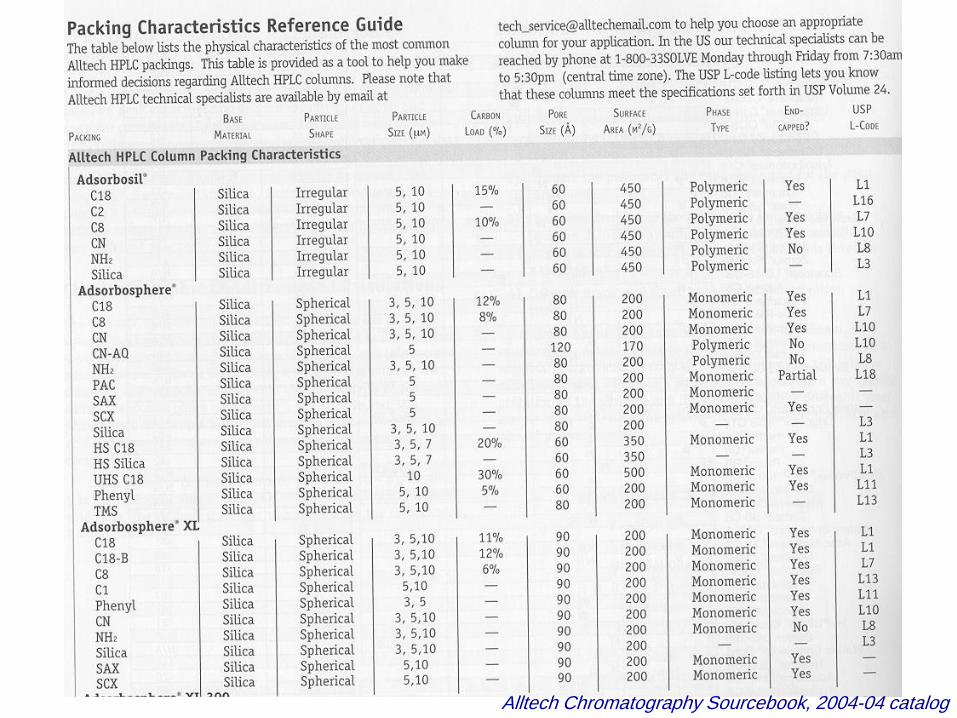
RP-HPLC - Optimization
Alltech Chromatography Sourcebook, 2004-04 catalog

RP-HPLC – Gradient Elution
Alltech Chromatography Sourcebook, 2004-04 catalog
Alltech Chromatography Sourcebook, 2004-04 catalog

RP-HPLC – Variables
Alltech Chromatography Sourcebook, 2004-04 catalog

1.35 min.
Ibuprofen
7.11 min.
Caffeine
1.48 min.
Aspirin
2.82 min
Acetaminophen
Analgesic Retention
Time
Acetaminophen 2.82
Aspirin 1.48
Caffeine 7.11
Ibuprofen 1.35
Gradient =
0 min: 100% EtOAC (+ 0.2% HOAc)
3 min: 100% EtOAC (+ 0.2% HOAc)
5 min: 15% MeOH, 85% % EtOAc
(+ 0.2% HOAc)
8 min: 15% MeOH, 85% % EtOAc
(+ 0.2% HOAc)
10 min: 100% EtOAC (+ 0.2% HOAc)
SiO2
Flow Rate = 1 mL/min
UV detector set at 240 nm
HPLC OF ANALGESICS - UV Detection
Standard Analgesics

Question
The peak areas of aspirin and acetaminophen are very different, even
though they are present in equal amounts (250mg/tablet) in Excedrin
ES.
Caffeine is present at ~ ¼ the concentration of aspirin (65 mg/tablet vs.
250 mg/tablet), but it’s peak area is greater than the peak area of
aspirin.
WHY? UV Absorbance of analgesics vs UV setting of detector
Area %
Aspirin 19.5%
Acetaminophen 50.0%
Caffeine 20.5%
Excedrin ES
250 mg aspirin
250 mg acetaminophen
65 mg caffeine
HPLC OF ANALGESICS - UV Detection

Detector set at 240 nm
Detector set at 254 nm
Detector set
at 280 nm
UV Max
Aspirin 225, 296 nm
Acetaminophen 248 nm
Caffeine 272 nm
Area %
Aspirin 19.5%
Acetaminophen 50.0%
Caffeine 20.5%
Area %
Aspirin 7.3%
Acetaminophen 81.9%
Caffeine 10.8%
Area %
Aspirin 24.8%
Acetaminophen 39.3%
Caffeine 35.9%
HPLC: Peak Area vs Detector setting

Figure 2. HPLC (SiO2) of crude tumeric
extract.
Gradient 0-2 min, 4% EtOAc/Hexane;
2-9 min 4 to 80% EtOAc;
9-11 min , 80% EtOAc/hexane;
11-13 min, 80 to 4% EtOAc/hex,
13-15 min, 4% EtOAc /hexane.
(A) Detector set at 420 nm.
(B) Detector set at 254 nm.
(C) Detector set at 254 nm (0-3.5 min), 420
nm 3.5-15 min.
(A)
(B)
(C)
HPLC – UV Detection

Method Development for Biomonitoring of
Polycyclic Aromatic Hydrocarbons
Steven R. Myers, Ph.D. Professor
Department of Pharmacology and Toxicology University of Louisville School of Medicine
Louisville, KY USA

PAH Exposure
Urinary/biliary Excretion Carcinogenic / Genotoxic PAH Adducts
PAH Metabolites
Met
ab
oli
sm
T1/2 = hours

Biotransformation of PAHs Phase 1 Transformation
CYP P4501A1
• increased 3,4-oxidation in smokers due to induced cytochrome
P4501A2 enzymes
• multiple metabolites for each parent PAH
•comprehensive methodology will measure all known metabolites
Epoxide
Hydroxylase
1-PHEN
2-PHEN
3-PHEN
4- PHEN

Biotransformation of PAHs Phase 2 Transformation - Conjugation
Urinary
Excretion
• most hydroxylated metabolites are further conjugated to aid urinary
excretion

Biotransformation of nitro-PAHs
Cytosolic / P450
reductase
CYP P450
Phase II
Metabolism
• leads to formation of reactive esters
• potential DNA adduct formation
N,O-acetyltransferases (NATs)
Sulfotransferases (SULTs)
Urinary
Excretion
Cytosolic / P450
reductase
• nitro-PAHs undergo reductive biotransformation to detoxify and aid
excretion
• can form reactive intermediates through biotransformation
3- amino-benzanthrone 3- nitro-benzanthrone

3- Aminobenzanthrone – Urinary Biomarker for Diesel
Exhaust
• 3- Nitrobenzanthrone has been isolated from diesel exhaust extracts and has been shown to be a direct mutagen
• 3- Aminobenzanthrone has been used as the diesel-specific urinary biomarker of exposure to 3-nitrobenzanthrone
• Instability problem has been observed on 3-aminobenzanthrone standards; it is necessary to re-make standards frequently
3- Amino-benzanthrone

Amino-PAHs
7 9 11 13 15
Time (min)
1
2
5 8
6
3 4
7
10
9 11
12
1. 1- amino-naphthalene
2- amino-biphenyl
2. 2- amino-naphthalene
3. 4- amino-biphenyl
4. 1- amino-fluorene
5. 2- amino-fluorene
6. 9- amino-phenanthrene
7. 1- amino-anthracene
8. 2- amino-anthracene
9. 3- amino-fluoranthene
10. 1- amino-pyrene
11. 6- amino-chrysene
12. 3- amino-benzanthrone
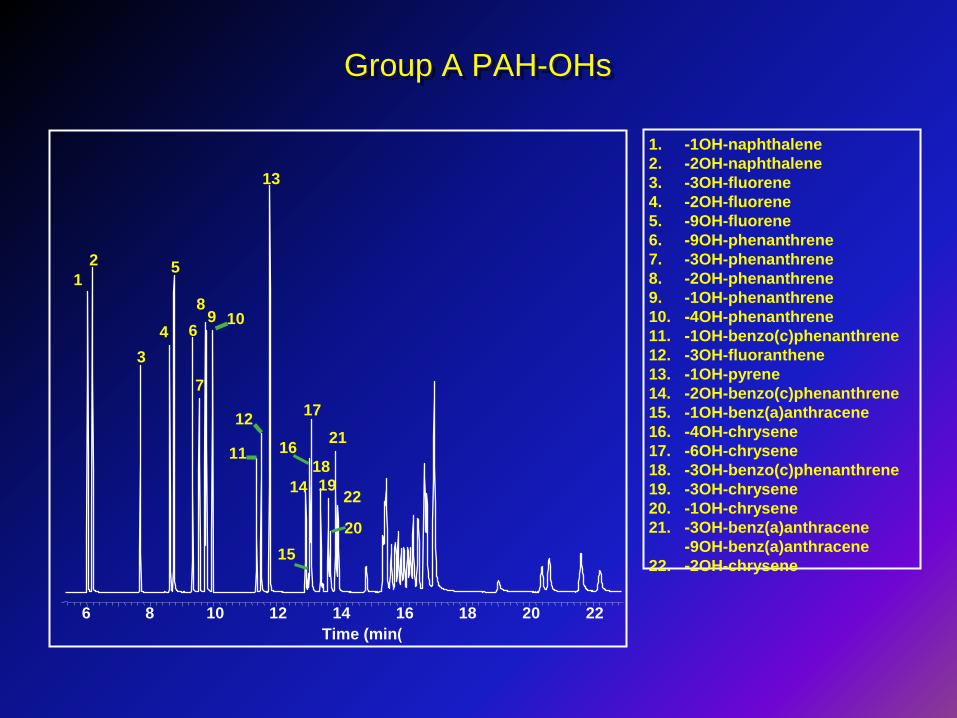
Group A PAH-OHs
6 8 10 12 14 16 18 20 22
Time (min)
13
2 5 1
7
9 6 4
3
17 12
21 16 11
14 22
8 10
15
18 19
20
1. 1- OH-naphthalene
2. 2- OH-naphthalene
3. 3- OH-fluorene
4. 2- OH-fluorene
5. 9- OH-fluorene
6. 9- OH-phenanthrene
7. 3- OH-phenanthrene
8. 2- OH-phenanthrene
9. 1- OH-phenanthrene
10. 4- OH-phenanthrene
11. 1- OH-benzo(c)phenanthrene
12. 3- OH-fluoranthene
13. 1- OH-pyrene
14. 2- OH-benzo(c)phenanthrene
15. 1- OH-benz(a)anthracene
16. 4- OH-chrysene
17. 6- OH-chrysene
18. 3- OH-benzo(c)phenanthrene
19. 3- OH-chrysene
20. 1- OH-chrysene
21. 3- OH-benz(a)anthracene
9- OH-benz(a)anthracene
22. 2- OH-chrysene

Group B PAH-OHs
6 8 10 12 14 16 18 20 22
Time (min)
4
3
2 1
13
16
7 12
8 5 6 11
14
10
15
9
17 18
19 20 21
1. 8- OH-benzo(b)fluoranthene
2. 7- OH-benzo(b)fluoranthene
3. 1- OH-benzo(b)fluoranthene
9- OH-benzo(b)fluoranthene
4. 2- OH-benzo(b)fluoranthene
12- OH-benzo(b)fluoranthene
8- OH-benzo(b)fluoranthene
5. 9- OH-benzo(e)pyrene
6. 3- OH-benzo(b)fluoranthene
7. 12- OH-benzo(a)pyrene
8. 5- OH-benzo(a)pyrene
9. 11- OH-benzo(b)fluoranthene
10. 6- OH-benzo(b)fluoranthene
11. 3- OH-benzo(k)fluoranthene
12. 4- OH-benzo(e)pyrene
10- OH-benzo(b)fluoranthene
13. 9- OH-benzo(k)fluoranthene
7- OH-benzo(a)pyrene
14. 10- OH-benzo(e)pyrene
15. 3- OH-benzo(e)pyrene
16. 3- OH-benzo(a)pyrene
2- OH-benzo(e)pyrene
17. 1- OH-indeno-[1,2,3-c,d]-pyrene
18. 2- OH-indeno-[1,2,3-c,d]-pyrene
19. 6- OH-indeno-[1,2,3-c,d]-pyrene
20. 8- OH-indeno-[1,2,3-c,d]-pyrene
21. 3- OH-dibenzo[a,h]anthracene

Current PAH-OH Methodology
De-conjugation of PAHm by enzymatic hydrolysis
Solid Phase Extraction (SPE)
Derivatization
GC/HRMS analysis
Sample Preparation • aliquot 3 mL of urine
• spike with 9 labeled (13C6)
internal quantification standards
(10 µL, 100 pg/µL): 1-naphthalene
2-fluorene
3-phenanthrene
1-pyrene
3-fluoranthene
3-chrysene
6-chrysene
1-benzo[a]anthracene
3-benzo[c]phenanthrene
• dilute with sodium acetate
buffer (0.1 M, 5 mL, pH=5.5)

Future PAH-OH Methodology
De-conjugation of PAHm by enzymatic hydrolysis
Solid Phase Extraction (SPE)
Derivatization
GC/HRMS analysis
Sample Preparation • adding additional group A PAH-
OHs
• increasing number of labeled
(13C6) internal quantification
standards
• add Group B PAH-OHs to
methodology
• automated sample preparation

Current PAH-OH Methodology
De-conjugation of PAHm by enzymatic hydrolysis
Solid Phase Extraction (SPE)
Derivatization
GC/HRMS analysis
Sample Preparation
• add β-glucuronidase /
arylsulfatase (5 µL)
• incubate 3 hours @ 37ºC

Current PAH-OH Methodology
De-conjugation of PAHm by enzymatic hydrolysis
Solid Phase Extraction (SPE)
Derivatization
GC/HRMS analysis
Sample Preparation • EnvirElut-PAH cartridges (6 mL, 1
gram)
• 12 port vacuum manifold
• condition with methanol (5 mL),
then water (5 mL)
• add samples
• wash with water (5 mL), then
water/methanol (1:1, 5 mL)
• dry
• elute with acetonitrile:methanol
(1:1, 5 mL)
• dry extract over anhydrous
sodium sulfate (2.5 g), additional
rinse acetonitrile:methanol (1:1,
2 mL)
• evaporate to dryness with
nitrogen (55ºC)

Future PAH-OH Methodology
De-conjugation of PAHm by enzymatic hydrolysis
Solid Phase Extraction (SPE)
Derivatization
GC/HRMS analysis
Sample Preparation
• convert to automated SPE system for high
throughput
• increased sample potential (100 per day
versus 24 in current method)
• unattended operation
• can collect fractions
• high efficiency polymeric sorbent for better
extraction and cleaner extracts
• tested 5 polymeric sorbents
• samples evaporated using vacuum instead
of nitrogen blowdown

Solid Phase Extraction Method Development
• Five difference sorbents tested for both NH2- and PAH-OHs
– OASIS, FOCUS, STRATA-X, STRATA-XC, C-18
• FOCUS and STRATA-XC gave better recoveries for PAH-
OHs
• OASIS and STRATA-X gave better results for NH2-PAHs
• C-18 was used in existing method for PAH-OH; however, it
gave very bad results on NH2-PAHs
• Further method development using OASIS, FOCUS, and
STRATA-X underway

Solid Phase Extraction Method Development Sorbents Comparison for PAH-OH
0
25
50
75
100
125
Strata-X Strata-XC OASIS FOCUS C 18
Further experiments underway to optimize extraction and purification

Evaporation
• PAH metabolites have both volatility and thermal stability issues
• Evaporation must remove solvent quickly (stability) and gently (volatility(
• SPE eluant changed to mostly DCM
• Rapidvap uses vacuum instead of nitrogen

Evaporation
• Extracts were evaporated to dryness; re-constituted in
toluene and derivatized with MSTFA
• During evaporation, analyte loss can reach 80%
• Adding keeper (5 µL dodecane) improved recoveries

Current PAH-OH Methodology
De-conjugation of PAHm by enzymatic hydrolysis
Solid Phase Extraction (SPE)
Derivatization
GC/HRMS analysis
Sample Preparation
• reconstitute with toluene (20 µL)
• transfer to injection vial
• add MSTFA (5 µL)
• add argon and crimp seal vial
• incubate 1 hour @ 60ºC

Future PAH-OH Methodology
De-conjugation of PAHm by enzymatic hydrolysis
Solid Phase Extraction (SPE)
Derivatization
GC/HRMS analysis
Sample Preparation • testing different derivatization
techniques
• MSTFA, PFBC, PFPA, HFBA
• work underway optimizing each
reaction
• adding electron capture
functionality
• increased AMU for cleaner
mass spectra
• potential ECNI detection for
more sensitive analysis
• potential MSD analysis using
ECNI detection

Derivatization Reactions
2- hydroxy-naphthalene
Exact Mass: 144.05752
MSTFA
PFPA PFBC
HFBA
Mass: 290.03662
Mass: 216.09704 Mass: 340.03343
Mass: 338.03662
MSTFA = N-Methyl-N-(trimethylsilyl)trifluoroacetamide ; PFPA = Pentafluoropropionic anhydride
PCBC = pentachlorobenzoylchloride ; HFBA = Heptafluorobutyric anhydride

Optimizing Derivatization MSTFA for Amino-PAHs
Derivatization needed to cap functionalities and
improve peak detection
Ideally – need quantitative conversion for maximum
sensitivity
• Amount of derivatizing reagent
• Catalyst for reaction
• Temperature of reaction
• Time for reaction

Amino-PAHs Derivatized by MSTFA
)Amount of MSTFA(
60
70
80
90
100
5ul MSTFA 10ul MSTFA 15ul MSTFA 20ul MSTFA
Co
nv
ers
ion
Rate
(%
)
MSTFA 1-a-naph 2-a-naph 2-a-biph 4-a-biph 1-a-fluo 2-a-fluo 9-a-phen 1-a-anth 2-a-anth 3-a-flran 1-a-pyr 6-a-chry 3-a-bzth 2-a-fluoC1
Default condition: 20 µL standard solution, 5 µL MSTFA, 5 µL pyridine, 60 C, 1 hour
• Amino-PAHs require 15 µL of MSTFA

Amino-PAHs Derivatized by MSTFA
(Catalyst)
Default condition: 20 µL standard solution, 5 µL MSTFA, 5 µL pyridine, 60 C, 1 hour
• Amino-PAHs require 5 µL of pyridine for maximum recovery
Pyridine
0
25
50
75
100
Co
nve
rsio
n r
ate
)%
(
no pyr.
5ul pyr.
10ul pyr.
15ul pyr.

Amino-PAHs Derivatized by MSTFA
)Reaction Temperature(
Default condition: 20 µL standard solution, 5 µL MSTFA, 5 µL pyridine, 60 C, 1 hour
• Amino-PAHs require 60 minute reaction time
0
25
50
75
100
Co
nve
rsio
n r
ate
(%
)
Temperature
20 C
60 C
110 C

Amino-PAHs Derivatized by MSTFA
)Reaction Time(
Default condition: 20 µL standard solution, 5 µL MSTFA, 5 µL pyridine, 60 C, 1 hour
• Amino-PAHs require a 30 minute reaction time
60
70
80
90
100
0min 15min 30min 45min 60min 90min 120min
Co
nv
ers
ion
Rate
(%
)
Time 1-a-naph 2-a-naph 2-a-biph 4-a-biph 1-a-fluo 2-a-fluo 9-a-phen 1-a-anth 2-a-anth 3-a-flran 1-a-pyr 6-a-chry 3-a-bzth

Current PAH-OH Methodology
De-conjugation of PAHm by enzymatic hydrolysis
Solid Phase Extraction (SPE)
Derivatization
GC/HRMS analysis
Sample Preparation • Finnigan MAT95XP HRMS
• 1 µL injection
• DB-5MS GC column
• Injection Temperature: 290ºC
• 1 mL/min He flow / 2 min. purge
• Transfer line: 290ºC
• Source Temperature: 260ºC
• Temperature Program:
100ºC – hold 2 min
15ºC/min to 160ºC
10ºC/min to 295ºC
hold 3 min
Total run time: 23 minutes
Calibration – 6 points – 10 –
10,000 ppt
• Processed standards in water

Future PAH-OH Methodology
De-conjugation of PAHm by enzymatic hydrolysis
Solid Phase Extraction (SPE)
Derivatization
GC/HRMS analysis
Sample Preparation
• Decreased GC run time to 15 min.
• Now using external calibration
standards
• Improved linearity and stability of
calibration curve
• lower instrument quantification
limits (IQLs) set at 5x S/N
• Increase analytes to 23 Group A and
potentially 27 Group B

Instrument Quantification Limites for PAH-
OHs (Group A Metabolites(
ppt – parts per trillion
ppq – parts per quadrillion
n.a. – not available at this time


![HIGH PERFORMANCE LIQUID CHROMATOGRAPHY [HPLC]€¦ · Get All Pharmaceutical Guidelines on Email- info@pharmaguideline.com High Performance Liquid Chromatography (HPLC): Introduction:](https://static.fdocuments.in/doc/165x107/5ea7ad7bb7d7fd4ff1263c8a/high-performance-liquid-chromatography-hplc-get-all-pharmaceutical-guidelines.jpg)