Big data visualization frameworks and applications at Kitware

Minerva High Performance Geospatial and Climate Data
Management, Analysis and Visualization
Aashish Chaudhary Technical Leader, Kitware Inc.
with Petr Votava (NASA)
Dr. Rama Nemani (NASA) Dr. Jonathan Beezley (Kitware)
David Manthey (Kitware) Michael Grauer (Kitware)
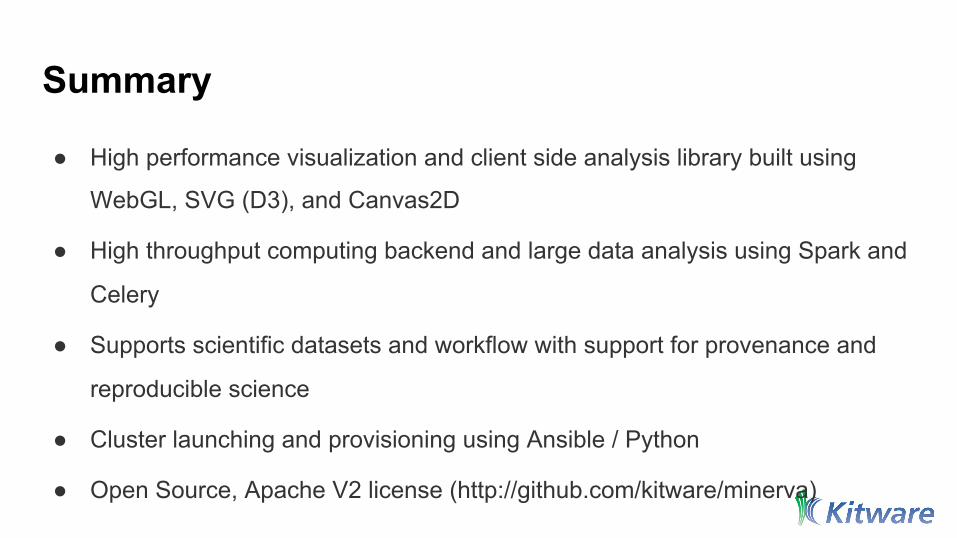
Summary
● High performance visualization and client side analysis library built using
WebGL, SVG (D3), and Canvas2D
● High throughput computing backend and large data analysis using Spark and
Celery
● Supports scientific datasets and workflow with support for provenance and
reproducible science
● Cluster launching and provisioning using Ansible / Python
● Open Source, Apache V2 license (http://github.com/kitware/minerva)

Need for Minerva ● A open source web-enabled library and application platform that can bring
GIS, Infovis, and Scientific Visualization together at scale
● An application that handles large dataset, provides high quality for rendering and high throughput computing for analysis
● An application that can bring data, analysis, and visualization with support for collaboration
● Can leverage Kitware’s strength in scientific computing
Geovisualization GIS / GeoInformatics Scientific Visualization Infovis
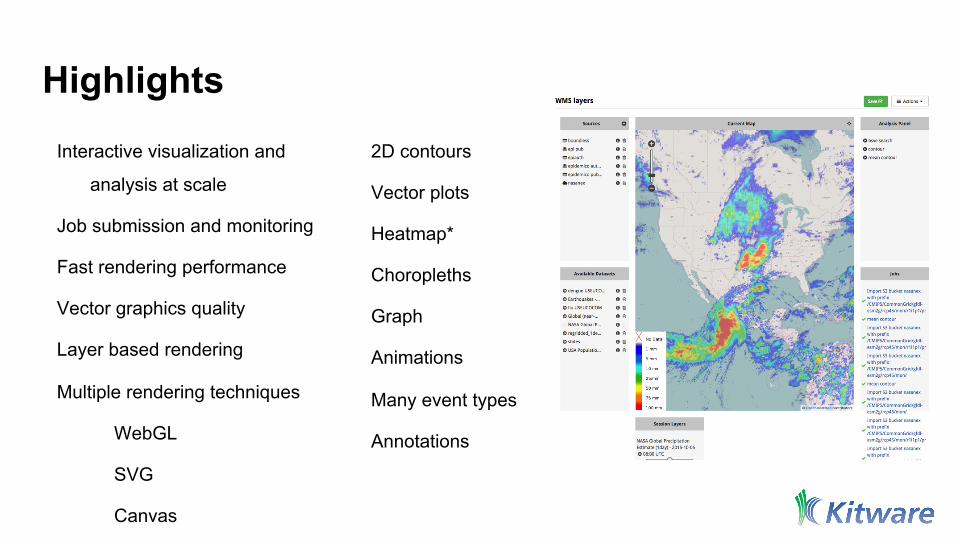
Highlights Interactive visualization and
analysis at scale
Job submission and monitoring
Fast rendering performance
Vector graphics quality
Layer based rendering
Multiple rendering techniques
WebGL
SVG
Canvas
2D contours
Vector plots
Heatmap*
Choropleths
Graph
Animations
Many event types
Annotations
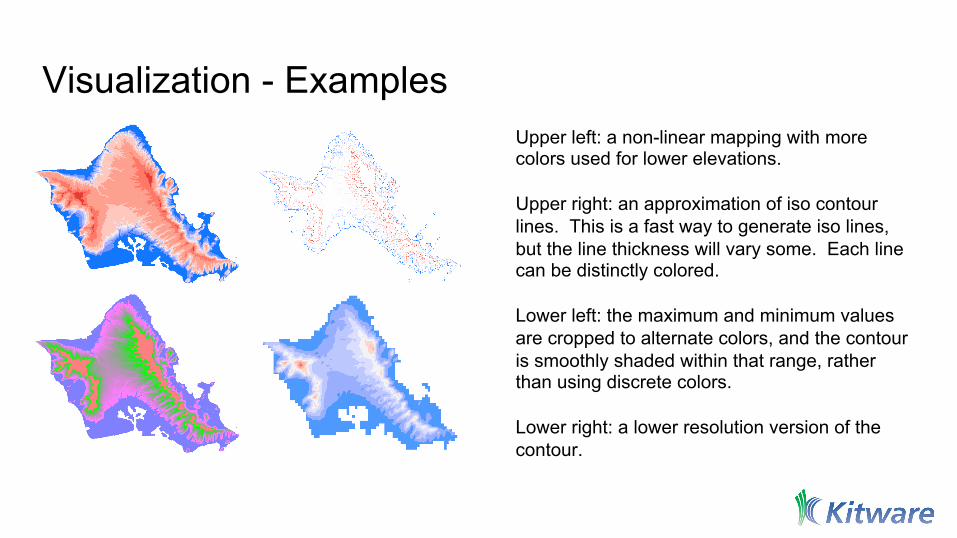
Visualization - Examples Upper left: a non-linear mapping with more colors used for lower elevations. Upper right: an approximation of iso contour lines. This is a fast way to generate iso lines, but the line thickness will vary some. Each line can be distinctly colored. Lower left: the maximum and minimum values are cropped to alternate colors, and the contour is smoothly shaded within that range, rather than using discrete colors. Lower right: a lower resolution version of the contour.
Use Case – Climate Data Aggregation and Contouring

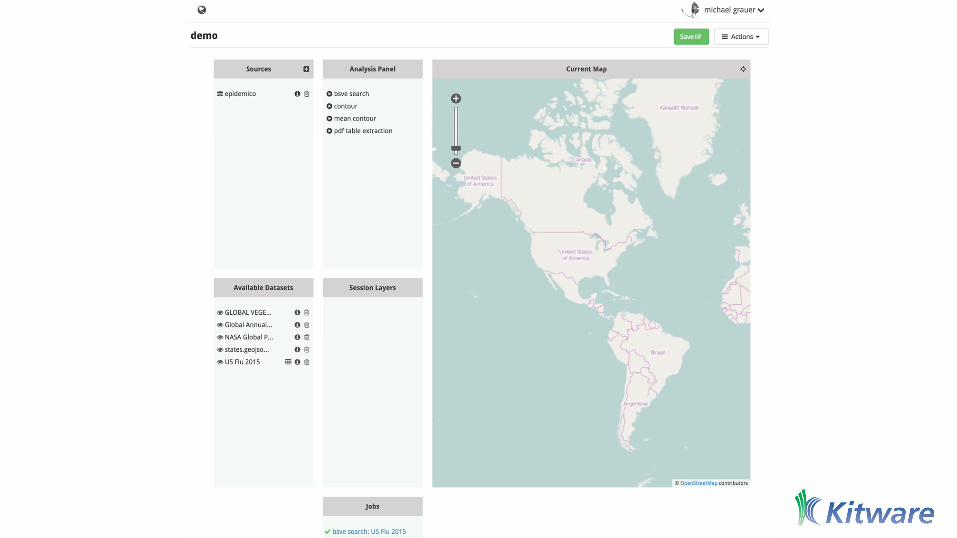
Minerva Components ● Data Panel
● Presents list of available datasets
● Meta data is stored in database
● Additional metadata can be added
● Uses Girder data management system that provides user authentication, unified API to access data from multiple sources, and security.
● Analysis Panel
● Presents list of available analysis on server side
● New analysis could be added and deployed (work in progress)
● Remote job submission and monitoring API
● Can use Celery, Spark or both. New backend could be added easily.
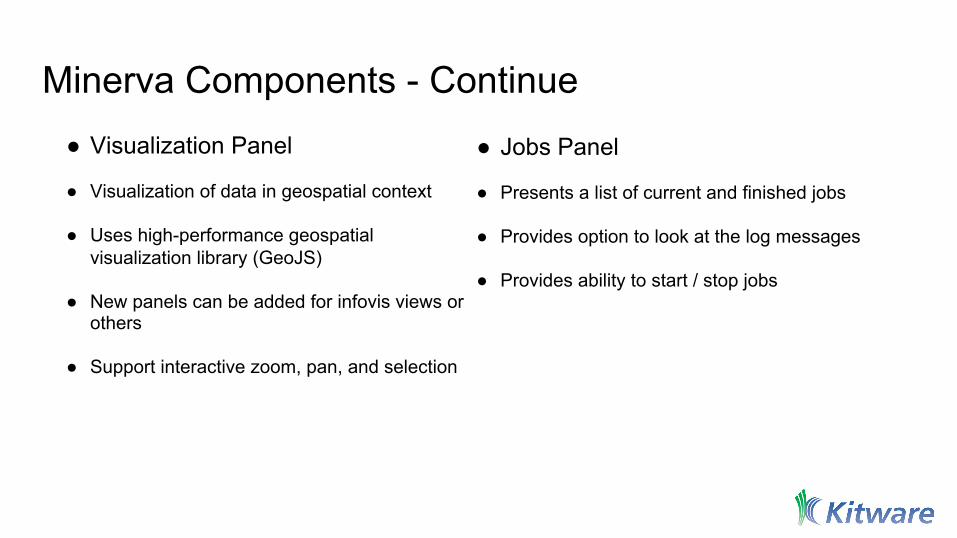
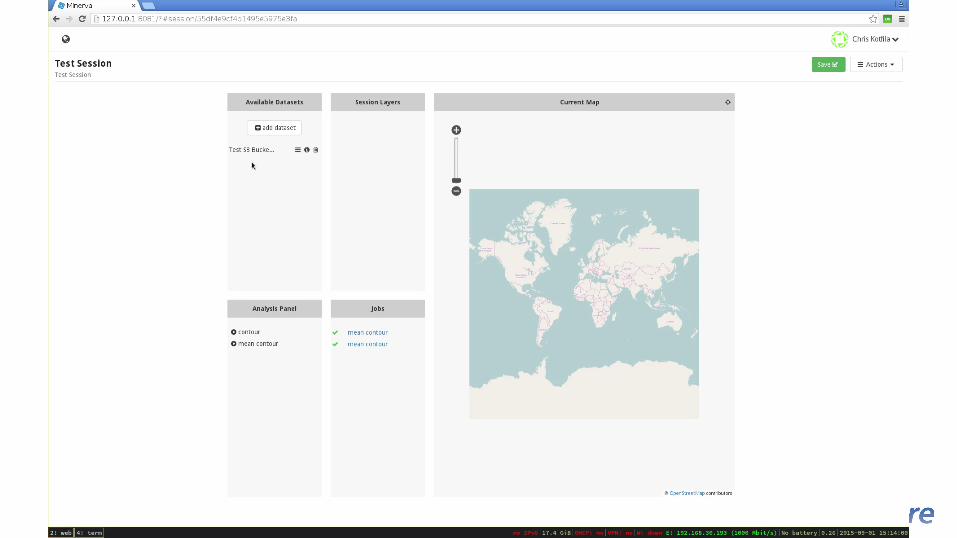
Minerva Components - Continue ● Visualization Panel
● Visualization of data in geospatial context
● Uses high-performance geospatial visualization library (GeoJS)
● New panels can be added for infovis views or others
● Support interactive zoom, pan, and selection
● Jobs Panel
● Presents a list of current and finished jobs
● Provides option to look at the log messages
● Provides ability to start / stop jobs
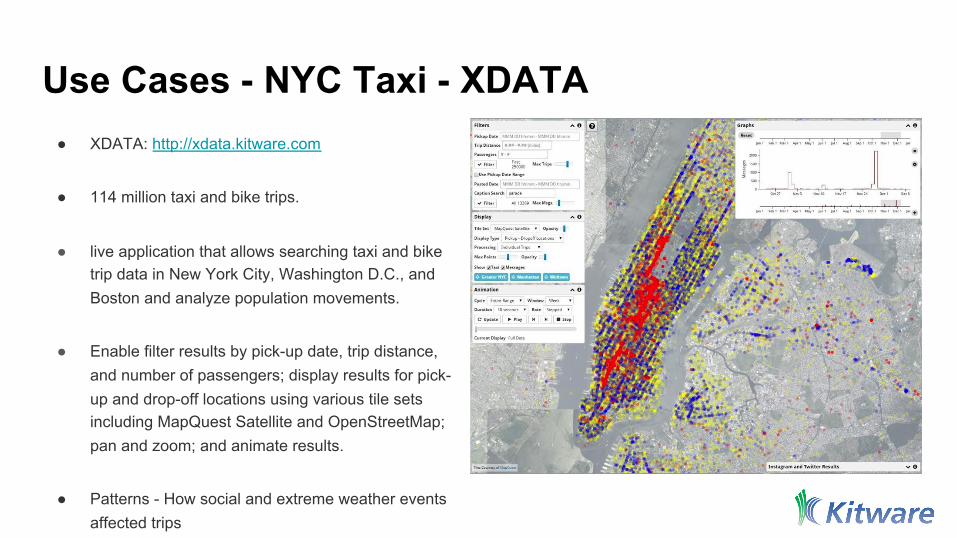
Use Cases - NYC Taxi - XDATA ● XDATA: http://xdata.kitware.com
● 114 million taxi and bike trips.
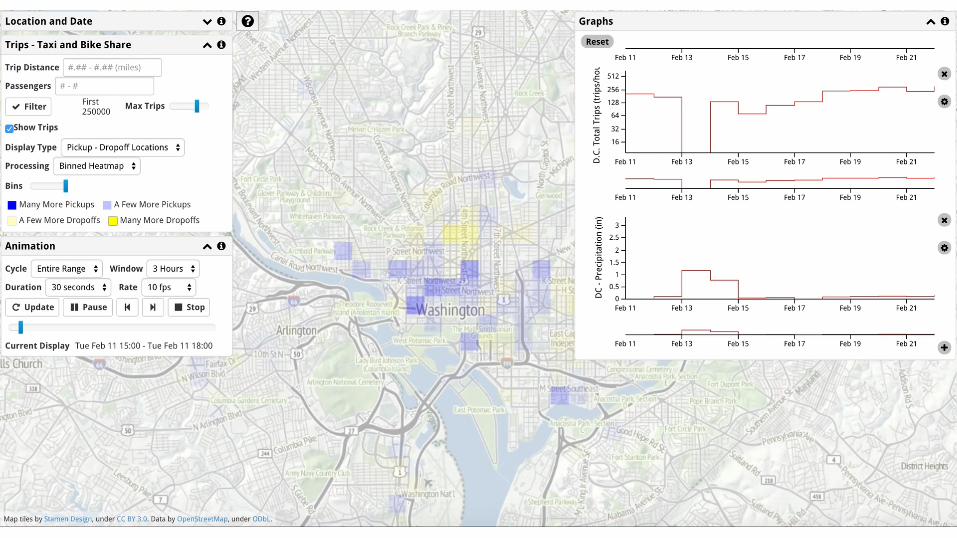
● live application that allows searching taxi and bike trip data in New York City, Washington D.C., and Boston and analyze population movements.
● Enable filter results by pick-up date, trip distance, and number of passengers; display results for pick-up and drop-off locations using various tile sets including MapQuest Satellite and OpenStreetMap; pan and zoom; and animate results.
● Patterns - How social and extreme weather events affected trips
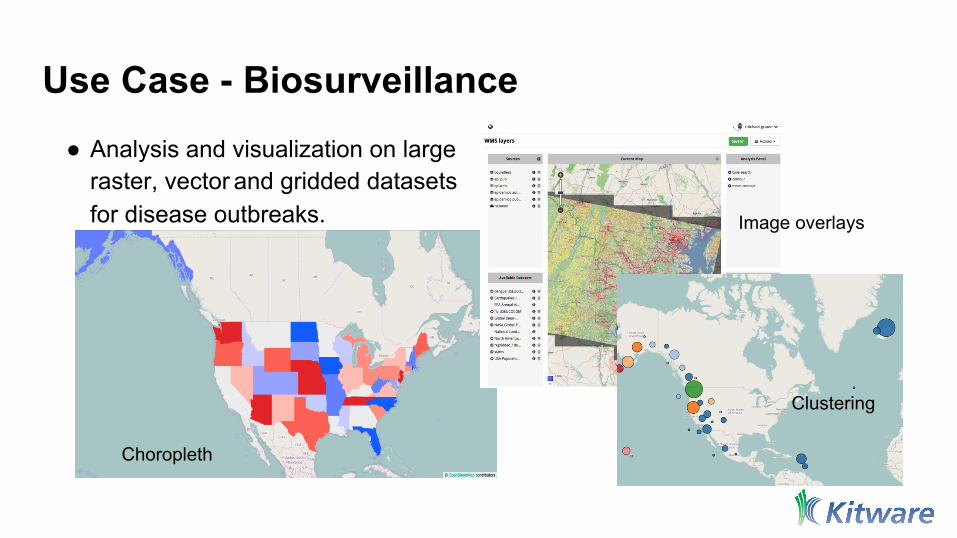
Use Case - Biosurveillance ● Analysis and visualization on large
raster, vector and gridded datasets for disease outbreaks.
Choropleth
Clustering
Image overlays


Use Case - Biomedical ● SlideAtlas - An open-source,
web-based microscopy image platform ○ Automated upload and
pre-processing, directly from slide scanners
○ Interactive high-performance viewing on desktop and mobile devices
○ Archiving, access control, and voice search features
○ Annotation tools ○ 3D stack creation and
viewing
Use Case – NASA NEX • AIST funded Prototyping agile production, analytics and visualization pipelines
for big-data on the NASA Earth Exchange (NEX)
• Big Data Visualization and Data Analytics on the NASA cloud and HPC
• Develop and integrate a set of Prototype, Test and Integration Tools
• Develop an integrated Parallel Workflow and Provenance Management system
• Shark/Spark/Hadoop-MapReduce/MPI (for comparison)


Future Directions
● Improvements to cluster provisioning
● Data streaming support
● Documentation
● Large data visualization on client-side
● IPython-notebook
● Performance tests

Final Remarks
● Many thanks to following for their contributions
○ Jeff Baumes - Kitware
○ Patrick Reynolds - Kitware
○ Matt Bernard - Epidemico
○ Nico Preston - Epidemico
○ Derek Johnson – Epidemico
○ And all other open source supporters