High Performance Computing, Computational Grid, and ...
23
1 1 High Performance Computing, High Performance Computing, Computational Grid, and Numerical Libraries Computational Grid, and Numerical Libraries Jack Dongarra Innovative Computing Lab University of Tennessee http:// http:// www.cs.utk.edu/~dongarra www.cs.utk.edu/~dongarra/ The 14th Symposium on Computer Architecture and High Performance Computing Vitoria/ES - Brazil - October 28-30, 2002 2 Technology Trends: Technology Trends: Microprocessor Capacity Microprocessor Capacity 2X transistors/Chip Every 1.5 years Called “Moore’s Law ” Moore’s Law Microprocessors have become smaller, denser, and more powerful. Not just processors, bandwidth, storage, etc Gordon Moore (co-founder of Intel) predicted in 1965 that the transistor density of semiconductor chips would double roughly every 18 months.
Transcript of High Performance Computing, Computational Grid, and ...

1
1
High Performance Computing, High Performance Computing, Computational Grid, and Numerical LibrariesComputational Grid, and Numerical Libraries
Jack DongarraInnovative Computing LabUniversity of Tennessee
http://http://www.cs.utk.edu/~dongarrawww.cs.utk.edu/~dongarra//
The 14th Symposium on Computer Architecture and High Performance Computing
Vitoria/ES - Brazil - October 28-30, 2002
2
Technology Trends: Technology Trends: Microprocessor CapacityMicroprocessor Capacity
2X transistors/Chip Every 1.5 yearsCalled “Moore’s Law”
Moore’s Law
Microprocessors have become smaller, denser, and more powerful.Not just processors, bandwidth, storage, etc
Gordon Moore (co-founder of Intel) predicted in 1965 that the transistor density of semiconductor chips would double roughly every 18 months.

2
3
2005
2010
ASCI WhitePacific
EDSAC 1UNIVAC 1
IBM 7090
CDC 6600
IBM 360/195CDC 7600
Cray 1
Cray X-MPCray 2
TMC CM-2
TMC CM-5 Cray T3D
ASCI Red
1950 1960 1970 1980 1990 2000 2010
1 KFlop/s
1 MFlop/s
1 GFlop/s
1 TFlop/s
1 PFlop/s
Scalar
Super Scalar
Vector
Parallel
Super Scalar/Vector/ParallelMoore’s LawMoore’s Law
4
H. Meuer, H. Simon, E. Strohmaier, & JDH. Meuer, H. Simon, E. Strohmaier, & JD
- Listing of the 500 most powerfulComputers in the World
- Yardstick: Rmax from LINPACK MPPAx=b, dense problem
- Updated twice a yearSC‘xy in the States in NovemberMeeting in Mannheim, Germany in June
- All data available from www.top500.org
Size
Rat
e
TPP performance

3
5
Fastest Computer Over Time
0
10
20
30
40
50
60
70
1990 1992 1994 1996 1998 2000
Year
GF
lop/
s
X Y ( S c a t t e r ) 1
Cray Y-MP (8)
TMCCM-2(2048)
Fujitsu VP-2600
In 1980 a computation that took 1 full year to complete can now be done in ~ 10 hours!
6
Fastest Computer Over Time
TMCCM-2(2048)
Fujitsu VP-2600
Cray Y-MP (8)
0
100
200
300
400
500
600
700
1990 1992 1994 1996 1998 2000
Year
GF
lop/
s
X Y ( S c a t t e r ) 1
HitachiCP-PACS(2040)
IntelParagon(6788)
FujitsuVPP-500(140)
TMC CM-5(1024)NEC
SX-3(4)
In 1980 a computation that took 1 full year to completecan now be done in ~ 16 minutes!

4
7
Fastest Computer Over Time
HitachiCP-PACS
(2040)
IntelParagon(6788)
FujitsuVPP-500
(140)
TMC CM-5(1024)
NEC SX-3(4)
TMCCM-2(2048)
Fujitsu VP-2600
Cray Y-MP (8)
0
1000
2000
3000
4000
5000
6000
7000
1990 1992 1994 1996 1998 2000
Year
GF
lop/
s
X Y ( S c a t t e r ) 1
ASCI White Pacific(7424)
Intel ASCI Red Xeon(9632)
SGI ASCIBlue Mountain(5040)
Intel ASCI Red(9152)
ASCI BluePacific SST(5808)
In 1980 a computation that took 1 full year to completecan today be done in ~ 27 seconds!
8
Fastest Computer Over Time
HitachiCP-PACS
(2040)
IntelParagon(6788)
FujitsuVPP-500
(140)
TMC CM-5(1024)
NEC SX-3(4)
TMCCM-2(2048)
Fujitsu VP-2600
Cray Y-MP (8)
0
10
20
30
40
50
60
70
1990 1992 1994 1996 1998 2000
Year
TF
lop/
s
XY (Scatter) 1
2002
Intel ASCIRed(9152)
ASCI WhitePacific(7424)
Intel ASCIRed Xeon
(9632)ASCI BlueMountain
(5040)
JapaneseEarth SimulatorNEC 5104
In 1980 a computation that took 1 full year to completecan today be done in ~ 5.4 seconds!

5
9
Machines at the Top of the List Machines at the Top of the List
53%140236124.5Fujitsu NWT1993
83%67681.43382.3281.1Intel Paragon XP/S MP1994
83%67681.03381281.1Intel Paragon XP/S MP1995
60%20481.86141.3368.2Hitachi CP-PACS1996
73%91523.018303.61338Intel ASCI Option Red (200 MHz Pentium Pro)
1997
55%58082.138681.62144ASCI Blue-Pacific SST, IBM SP 604E
1998
74%96320.832071.12379ASCI Red Intel Pentium II Xeon core
1999
44%74243.5111362.14938ASCI White -Pacific, IBM SP Power 3
2000
65%74241.0111361.57226ASCI White -Pacific, IBM SP Power 3
2001
88%51203.7409605.035860Earth Simulator Computer, NEC
2002
EfficiencyNumber ofProcessors
Factor ?from Pervious Year
TheoreticalPeak Gflop/s
Factor ?from Pervious Year
MeasuredGflop/s
ComputerYear
10
A Tour A Tour dd’’ForceForce in Engineeringin Engineering♦ Homogeneous, Centralized,
Proprietary, Expensive! ♦ Target Application: CFD-Weather,
Climate, Earthquakes♦ 640 NEC SX/6 Nodes (mod)
Ø 5120 CPUs which have vector ops♦ 40TeraFlops (peak)♦ $250-$500 million for things in
building♦ Footprint of 4 tennis courts♦ 7 MWatts
Ø Say 10 cent/KWhr - $16.8K/day = $6M/year!
♦ Expect to be on top of Top500 until 60-100 TFlop ASCI machine arrives
♦ For the Top500 (June 2002)Ø Equivalent ~ 1/6 S Top 500 Ø Performance of ESC
> S Next Top 12 ComputersØ S of all the DOE computers
= 27.5 TFlop/sØ Performance of ESC
> All the DOE + DOD machines (37.2 TFlop/s)

6
11
Top10 of the Top500Top10 of the Top500Rank Manufacturer Computer
Rmax
[TF/s] Installation Site Country Year Area of
Installation # Proc
1 NEC Earth-Simulator 35.86 Earth Simulator Center Japan 2002 Research 5120
2 IBM ASCI White
SP Power3 7.23 Lawrence Livermore
National Laboratory USA 2000 Research 8192
3 HP AlphaServer SC ES45 1 GHz 4.46 Pittsburgh
Supercomputing Center USA 2001 Academic 3016
4 HP
AlphaServer SC ES45 1 GHz 3.98
Commissariat a l’Energie Atomique (CEA) France 2001 Research 2560
5 IBM SP Power3 375 MHz 3.05 NERSC/LBNL USA 2001 Research 3328
6 HP AlphaServer SC ES45 1 GHz
2.92 Los Alamos National Laboratory
USA 2002 Research 2048
7 Intel ASCI Red 2.38 Sandia National Laboratory USA 1999 Research 9632
8 IBM pSeries 690 1.3 GHz
2.31 Oak Ridge National Laboratory
USA 2002 Research 864
9 IBM ASCI Blue Pacific SST, IBM SP 604e
2.14 Lawrence Livermore National Laboratory
USA 1999 Research 5808
10 IBM pSeries 690 1.3 Ghz 2.00 IBM/US Army Reseach Lab
(ARL) USA 2002 Vendor 768
12
TOP500 TOP500 -- PerformancePerformance
1.17 TF/s
220 TF/s
35.8 TF/s
59.7 GF/s
134 GF/s
0.4 GF/s
Jun-93
Nov-93
Jun-94
Nov-94
Jun-9
5Nov
-95Jun
-96Nov-
96Jun
-97Nov
-97Jun
-98Nov-
98Jun
-99Nov
-99Ju
n-00Nov
-00Jun
-01Nov-
01Jun
-02
Fujitsu'NWT' NAL
NECEarth Simulator
Intel ASCI RedSandia
IBM ASCI WhiteLLNL
N=1
N=500
SUM
1 Gflop/s
1 Tflop/s
100 Mflop/s
100 Gflop/s
100 Tflop/s
10 Gflop/s
10 Tflop/s
1 Pflop/s
My Laptop

7
13
Performance ExtrapolationPerformance Extrapolation
ASCI Purple
Earth Simulator
Jun-9
3Ju
n-94Jun
-95Ju
n-96Ju
n-97Ju
n-98Ju
n-99Jun
-00Ju
n-01Ju
n-02Ju
n-03Jun
-04Ju
n-05Ju
n-06Jun
-07Ju
n-08Jun
-09Ju
n-10
N=1
N=500
Sum
1 GFlop/s
1 TFlop/s
1 PFlop/s
100 MFlop/s
100 GFlop/s
100 TFlop/s
10 GFlop/s
10 TFlop/s
10 PFlop/s
My Laptop
14
ManufacturersManufacturers
HP 168 (12 < 100), IBM 164 (47 < 100)
Cray
SGI
IBM
Sun
HP
TMC
Intel
FujitsuNEC
Hitachiothers
0
100
200
300
400
500
Jun-9
3Nov
-93Ju
n-94Nov
-94Ju
n-95Nov
-95Ju
n-96Nov
-96Ju
n-97Nov
-97Ju
n-98Nov
-98Ju
n-99Nov
-99Ju
n-00Nov
-00Ju
n-01Nov
-01Ju
n-02

8
15
ArchitecturesArchitectures
Single Processor
SMP
MPP
SIMD
Constellation
Cluster - NOW
0
100
200
300
400
500
Jun-93Nov-
93Jun
-94Nov-9
4Jun-95
Nov-95
Jun-96
Nov-96Jun-97
Nov-97
Jun-98
Nov-98
Jun-99Nov-9
9Jun-00
Nov-00
Jun-01Nov-0
1Jun-02
Y-MP C90
Sun HPC
Paragon
CM5T3D
T3E
SP2
Cluster ofSun HPC
ASCI Red
CM2
VP500
SX3
Constellation: # of p/n � n
16
KflopsKflops per Inhabitantper Inhabitant
450
358
245207 203
158141
67
643
0
100
200
300
400
500
600
700
Japan USA
German
y
Scandinav
ia UK
Franc
e
Switzerla
nd Italy
Luxembourg
283
76
White is ES contribution and Blue is ASCI contribution

9
17
80 Clusters on the Top50080 Clusters on the Top500
♦ A total of 42 Intel based and 8 AMD based PC clusters are in the TOP500. Ø31 of these Intel based cluster are IBM
Netfinity systems delivered by IBM. ♦ A substantial part of these are installed
at industrial customers especially in the oil-industry. ØIncluding 5 Sun and 5 Alpha based clusters
and 21 HP AlphaServer. ♦ 14 of these clusters are labeled as
'Self-Made'.
18
Cluster on the Top500Cluster on the Top500
0
10
20
30
40
50
60
70
80
Jun-9
7Nov
-97
Jun-9
8Nov
-98
Jun-9
9Nov
-99Ju
n-00
Nov-00
Jun-0
1Nov
-01Ju
n-02
AMD
Intel
IBM Netfinity
Alpha
HP Alpha Server
Sparc
Processor Breakdown
Pentium III, 37, 46%
Itanium, 2, 3%
Sparc, 5, 6% AMD, 8, 10%
Alpha, 25, 31% Pentium 4, 3,
4%

10
19
Distributed and Parallel SystemsDistributed and Parallel Systems
Distributedsystemshetero-geneous
Massivelyparallelsystemshomo-geneous
Grid
bas
ed
Com
putin
gG
oogle
Netw
ork o
f ws
Clus
ters
w/
spec
ial in
terc
onne
ct
Entro
pia/U
D
Earth
Sim
ulato
r
♦ Gather (unused) resources♦ Steal cycles♦ System SW manages resources♦ System SW adds value♦ 10% - 20% overhead is OK♦ Resources drive applications♦ Time to completion is not critical♦ Time-shared♦ SETI@home
Ø ~ 400,000 machinesØ Averaging 40 Tflop/s
♦ Bounded set of resources ♦ Apps grow to consume all cycles♦ Application manages resources♦ System SW gets in the way♦ 5% overhead is maximum♦ Apps drive purchase of equipment♦ Real-time constraints♦ Space-shared♦ Earth Simulator
Ø 5000 processorsØ Averaging 35 Tflop/s
SETI
@ho
me
Para
llel D
ist
mem
ASCI
Tflo
p/s
20
SETI@homeSETI@home: Global Distributed Computing: Global Distributed Computing♦ Running on 500,000 PCs, ~1000 CPU
Years per DayØ 485,821 CPU Years so far
♦ Sophisticated Data & Signal Processing Analysis
♦ Distributes Datasets from AreciboRadio Telescope

11
21
SETI@homeSETI@home♦ Use thousands of Internet-
connected PCs to help in the search for extraterrestrial intelligence.
♦ When their computer is idle or being wasted this software will download a 300 kilobyte chunk of data for analysis. Performs about 3 Tflops for each client in 15 hours.
♦ The results of this analysis are sent back to the SETI team, combined with thousands of other participants.
♦ Largest distributed computation project in existenceØ2500 machines todayØAveraging 40 Tflop/s
♦ Today a number of companies trying this for profit.
22
Grid Computing Grid Computing --from ET from ET toAnthraxtoAnthrax

12
23
♦ Google query attributesØ150M queries/day (2000/second)Ø3B documents in the index
♦ Data centersØ15,000 Linux systems in 6 data centers
Ø15 TFlop/s and 1000 TB total capabilityØ40-80 1U/2U servers/cabinet Ø100 MB Ethernet switches/cabinet with gigabit
Ethernet uplinkØgrowth from 4,000 systems (June 2000)
Ø18M queries then♦ Performance and operationØ simple reissue of failed commands to new serversØ no performance debugging
Ø problems are not reproducibleSource: Monika Henzinger, Google
24
♦ Today there is a complex interplay and increasing interdependence among the sciences.
♦ Many science and engineering problems require widely dispersed resources be operated as systems.
♦ What we do as collaborative infrastructure developers will have profound influence on the future of science.
♦ Networking, distributed computing, and parallel computation research have matured to make it possible for distributed systems to support high-performance applications, but...Ø Resources are dispersedØ Connectivity is variableØ Dedicated access may not be possible
In the past: IsolationMotivation for Grid ComputingMotivation for Grid Computing
Today: Collaboration

13
25
The Grid
26
IPG NASA http://nas.nasa.gov/~wej/home/IPGGlobus http://www.globus.org/Legion http://www.cs.virgina.edu/~grimshaw/AppLeS http://www-cse.ucsd.edu/groups/hpcl/NetSolve http://www.cs.utk.edu/netsolve/NINF http://phase.etl.go.jp/ninf/Condor http://www.cs.wisc.edu/condor/CUMULVS http://www.epm.ornl.gov/cs/WebFlow http://www.npac.syr.edu/users/gcf/NGC http://www.nordicgrid.net
Grids are HotGrids are Hot

14
27
University of Tennessee Deployment: University of Tennessee Deployment: SScalable calable InIntracampustracampus RResearch esearch GGrid: rid: SInRGSInRG
♦ Federated Ownership: CS, ChemEng., Medical School, Computational Ecology, El. Eng.
♦ Real applications, middleware development, logistical networking
The Knoxville Campus has two DS-3 commodity Internet connections and one DS-3 Internet2/Abilene connection. An OC-3 ATM link routes IP traffic between the Knoxville campus, National Transportation Research Center, andOak Ridge National Laboratory. UT participates in several national networking initiatives including Internet2 (I2),Abilene, the federal Next Generation Internet (NGI) initiative, Southern Universities Research Association (SURA)Regional Information Infrastructure (RII), and Southern Crossroads (SoX).
The UT campus consists of a meshed ATM OC-12 being migrated over to switched Gigabit by early 2002.
28
Grids vs. Capability ComputingGrids vs. Capability Computing♦ Not an “either/or” questionØeach addresses different needsØboth are part of an integrated solution
♦ Grid strengthsØ coupling necessarily distributed resources
Ø instruments, archives, and peopleØeliminating time and space barriers
Øremote resource access and capacity computingØGrids are not a cheap substitute for capability
HPC♦ Capability computing strengthsØ supporting foundational computations
Øterascale and petascale “nation scale” problemsØengaging tightly coupled teams and computations

15
29
Software Technology & PerformanceSoftware Technology & Performance
♦ Tendency to focus on hardware♦ Software required to bridge an ever widening gap♦ Gaps between usable and deliverable performance
is very steepØ Performance only if the data and controls are setup just
rightØOtherwise, dramatic performance degradations, very
unstable situationØWill become more unstable
♦ Challenge of Libraries, PSEs and Tools is formidable with Tflop/s level, even greater with Pflops, some might say insurmountable.
30
Where Does the Performance Go? orWhere Does the Performance Go? orWhy Should I Care About the Memory Hierarchy?Why Should I Care About the Memory Hierarchy?
µProc60%/yr.(2X/1.5yr)
DRAM9%/yr.(2X/10 yrs)1
10
100
1000
1980
1981
1983
1984
1985
1986
1987
1988
1989
1990
1991
1992
1993
1994
1995
1996
1997
1998
1999
2000
DRAM
CPU
1982
Per
form
ance
Time
“Moore’s Law”
Processor-DRAM Memory Gap (latency)
Processor-MemoryPerformance Gap:(grows 50% / year)

16
31
Optimizing Computation and Optimizing Computation and Memory UseMemory Use
♦ Computational optimizationsØTheoretical peak:(# fpus)*(flops/cycle) * Mhz
Ø Pentium 4: (1 fpu)*(2 flops/cycle)*(2.53 Ghz) = 5060 MFLOP/s
♦ Operations like:Ø α = xTy : 2 operands (16 Bytes) needed for 2 flops;
at 5060 Mflop/s will requires 5060 MW/s bandwidthØ y = α x + y : 3 operands (24 Bytes) needed for 2 flops;
at 5060 Mflop/s will requires 7590 MW/s bandwidth
♦ Memory optimizationØTheoretical peak: (bus width) * (bus speed)Ø Pentium 4: (32 bits)*(533 Mhz) = 2132 MB/s = 266 MW/s
32
Memory HierarchyMemory Hierarchy♦ By taking advantage of the principle of locality:Ø Present the user with as much memory as is available in
the cheapest technology.Ø Provide access at the speed offered by the fastest
technology.
Control
Datapath
SecondaryStorage(Disk)
Processor
Registers
MainMemory(DRAM)
Level2 and 3Cache
(SRAM)
On-C
hipC
ache
1s 10,000,000s (10s ms)
100,000 s(.1s ms)
Speed (ns): 10s 100s
100s
Gs
Size (bytes):Ks Ms
TertiaryStorage
(Disk/Tape)
10,000,000,000s (10s sec)
10,000,000 s(10s ms)
Ts
DistributedMemory
Remote ClusterMemory

17
33
Self Adapting SoftwareSelf Adapting Software♦ Software system that …ØObtains information on the underlying system
where they will run.ØAdapts application to the presented data and the
available resources perhaps provide automatic algorithm selectionØDuring execution perform optimization and perhaps
reconfigure based on newly available resources.ØAllow the user to provide for faults and recover
without additional users involvement♦ The moral of the storyØWe know the concepts of how to improve things.ØCapture insights/experience – do what humans do
wellØAutomate the dull stuff
34
Software Generation Software Generation Strategy Strategy -- ATLAS BLASATLAS BLAS
♦ Takes ~ 20 minutes to run, generates Level 1,2, & 3 BLAS
♦ “New” model of high performance programming where critical code is machine generated using parameter optimization.
♦ Designed for modern architecturesØ Need reasonable C compiler
♦ Today ATLAS in used within various ASCI and SciDACactivities and by Matlab, Mathematica, Octave, Maple, Debian, Scyld Beowulf, SuSE,…
♦ Parameter study of the hw ♦ Generate multiple versions
of code, w/difference values of key performance parameters
♦ Run and measure the performance for various versions
♦ Pick best and generate library
♦ Level 1 cache multiply optimizes for:Ø TLB accessØ L1 cache reuseØ FP unit usageØ Memory fetchØ Register reuseØ Loop overhead minimization

18
35
ATLAS ATLAS (DGEMM n = 500)(DGEMM n = 500)
♦ ATLAS is faster than all other portable BLAS implementations and it is comparable with machine-specific libraries provided by the vendor.
♦ Looking at sparse operations
0.0
500.0
1000.0
1500.0
2000.0
2500.0
3000.0
3500.0
AMD Athlon
-600
DEC ev
56-533
DEC ev
6-500
HP9000
/735/1
35
IBM PPC604
-112
IBM Power2
-160
IBM Power3
-200
Intel P-
III 933
MHz
Intel P-
4 2.53
GHz w/SS
E2
SGI R
10000i
p28-20
0
SGI R
12000i
p30-2
70
Sun Ultra
Sparc2
-200
Architectures
MF
LO
P/S
Vendor BLASATLAS BLASF77 BLAS
36
GrADS GrADS -- Grid Application Development Grid Application Development SystemSystem
♦ Problem: Grid has distributed, heterogeneous, dynamic resources; how do we use them?
♦ Goal: reliable performance on dynamically changing resources
♦ Minimize work of preparing an application for Grid executionØ Provide generic versions of key components (currently
built in to applications or manually done)Ø E.g., scheduling, application launch, performance
monitoring
♦ Provide high-level programming tools to help automate application preparationØ Performance modeler, mapper, binder

19
37
NSF/NGS NSF/NGS GrADS GrADS -- GrADSoftGrADSoft ArchitectureArchitecture
♦ Goal: reliable performance on dynamically changing resources
Whole-ProgramCompiler
LibrariesBinder
Real-timePerformance
Monitor
PerformanceProblem
ResourceNegotiator
Scheduler
GridRuntimeSystem
SourceAppli-cation
Config-urableObject
Program
SoftwareComponents
Performance Feedback
Negotiation
PIs: Ken Kennedy, Fran Berman, Andrew Chein, Keith Cooper, JD, Ian Foster, Lennart Johnsson, Dan Reed, Carl Kesselman, John Mellor-Crummey, Linda Torczon & Rich Wolski
38
NSF/NGS NSF/NGS GrADS GrADS -- GrADSoftGrADSoft ArchitectureArchitecture
♦ Goal: reliable performance on dynamically changing resources
Whole-ProgramCompiler
LibrariesBinder
Real-timePerformance
Monitor
PerformanceProblem
ResourceNegotiator
Scheduler
GridRuntimeSystem
SourceAppli-cation
Config-urableObject
Program
SoftwareComponents
Performance Feedback
Negotiation
PIs: Ken Kennedy, Fran Berman, Andrew Chein, Keith Cooper, JD, Ian Foster, Lennart Johnsson, Dan Reed, Carl Kesselman, John Mellor-Crummey, Linda Torczon & Rich Wolski

20
39
Intelligent ComponentIntelligent Component♦ System to mediate between
user application and multiple possible libraries
♦ Self-Adaptivity and Learning Behavior Ø Heuristics are tuned based on
dataØ System gradually gets smarter
(database)Ø The system can educate the
user
♦ User Interaction Ø User can guide the system by
providing further informationØ System teaches user about
properties of the data
40
Research AreasResearch Areas♦ Automatically generating performance models
(e.g. for ScaLAPACK) on Grid resources♦ Evaluating Performance “Contracts” ♦ Near Optimal Scheduling (execution) on the
Grid♦ Rescheduling for changing resources♦ Checkpointing and fault tolerance♦ High-latency tolerant algorithms (SANS ideas)♦ Porting applications/libraries to GrADS
framework♦ Developing generic GrADSoft interfaces (API’s)
21
41
LAPACK For ClustersLAPACK For Clusters♦ Developing middleware which couples cluster system
information with the specifics of a user problem to launch cluster based applications on the “best” set of resource available.
♦ Using ScaLAPACK as the prototype software, but developing a framework
~ Mbit Switch, (fully connected)
~ Gbit Switch, (fully connected)
Remote memory server, e.g. IBP (TCP/IP)
Local network file server, SUN’s NFS (UDP/IP)e.g. 100 Mbit
Users, etc.
42
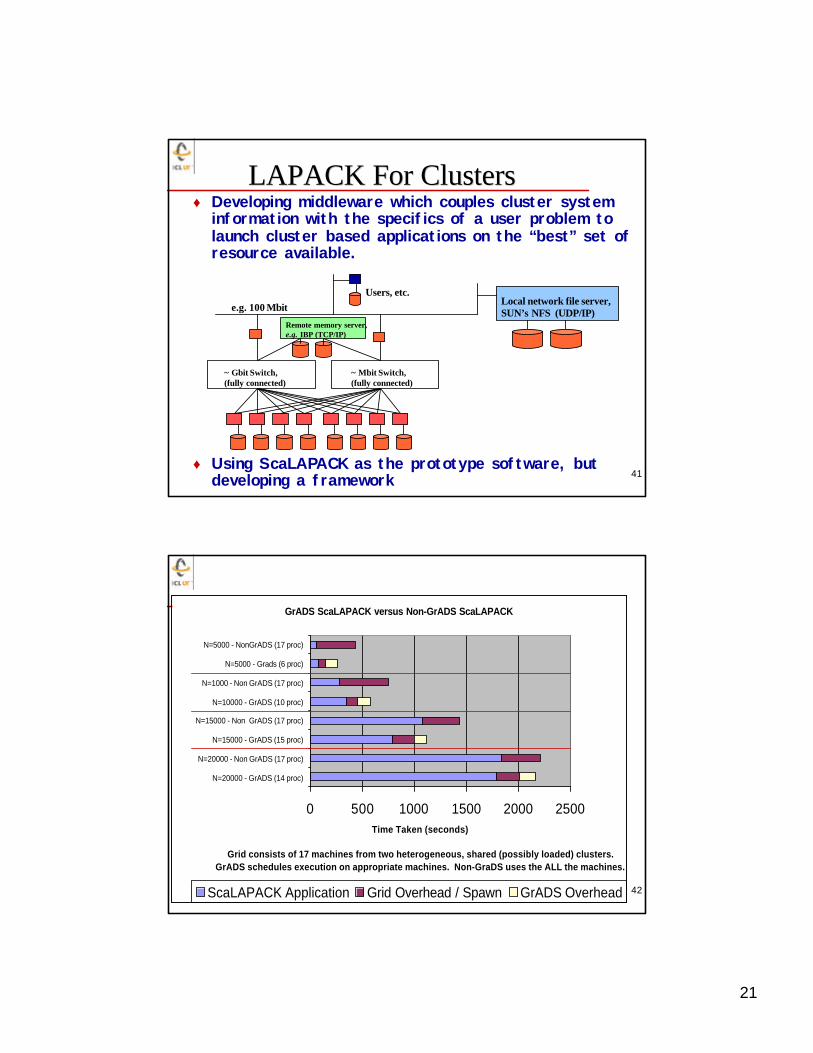
GrADS ScaLAPACK versus Non-GrADS ScaLAPACK
0 500 1000 1500 2000 2500
N=20000 - GrADS (14 proc)
N=20000 - Non GrADS (17 proc)
N=15000 - GrADS (15 proc)
N=15000 - Non GrADS (17 proc)
N=10000 - GrADS (10 proc)
N=1000 - Non GrADS (17 proc)
N=5000 - Grads (6 proc)
N=5000 - NonGrADS (17 proc)
Time Taken (seconds)
Grid consists of 17 machines from two heterogeneous, shared (possibly loaded) clusters. GrADS schedules execution on appropriate machines. Non-GraDS uses the ALL the machines.
ScaLAPACK Application Grid Overhead / Spawn GrADS Overhead

22
43
Research DirectionsResearch Directions♦ Parameterizable libraries♦ Fault tolerant algorithms♦ Annotated libraries♦ Hierarchical algorithm libraries♦ “Grid” (network) enabled strategies
A new division of labor between compiler writers, library writers, and algorithm developers and application developers will emerge.
44
Futures for Numerical Algorithms and SoftwareFutures for Numerical Algorithms and Software
♦ Numerical software will be adaptive, exploratory, and intelligent
♦ Determinism in numerical computing will be gone.Ø After all, its not reasonable to ask for exactness in numerical
computations.
ØAuditability of the computation, reproducibility at a cost
♦ Importance of floating point arithmetic will be undiminished.Ø16, 32, 64, 128 bits and beyond.
♦ Reproducibility, fault tolerance, and auditability
♦ Adaptivity is a key so applications can effectively use the resources.

23
45
Collaborators / SupportCollaborators / Support
♦ TOP500ØØH. Mauer, Mannheim UH. Mauer, Mannheim UØØH. Simon, NERSCH. Simon, NERSCØØE. Strohmaier, NERSCE. Strohmaier, NERSC
♦ GrADSØSathish Vadhiyar, UTKØAsim YarKhan, UTKØKen Kennedy, Fran
Berman, Andrew Chein, Keith Cooper, Ian Foster, Carl Kesselman, Lennart Johnsson, Dan Reed, Linda Torczon, & Rich Wolski
ØThanks
NSF Next Generation Software (NGS)
Scientific Discovery through Advanced Computing (SciDAC)