High Performance Chilled Water Systems · VPF System Limits (consult ... System Pump(s) P-1, P-2,...
56
© 2006 American Standard Inc. © 2012 Trane High Performance Chilled Water Systems High Performance Chilled Water Systems Mick Schwedler, PE Applications Engineering Trane
Transcript of High Performance Chilled Water Systems · VPF System Limits (consult ... System Pump(s) P-1, P-2,...

© 2006 American Standard Inc.
© 2012 Trane
High Performance Chilled Water Systems
High Performance Chilled Water Systems
Mick Schwedler, PEApplications EngineeringTrane

Normal Performance Chilled Water Plants ASHRAE/IESNA 90.1 (LEED Prerequisite)
System configuration
Design parameters
System control

Chiller Efficiency Requirements
Both full and part load efficiencies are required
Type Efficiency
< 150-ton water-cooled 4.45 COP 0.790 kW/tonscroll and screw chiller 5.20 IPLV 0.676 IPLV
150-ton < 300 tons water-cooled 4.90 COP 0.718 kW/tonscroll and screw chiller 5.60 IPLV 0.628 IPLV
300 tons water-cooled 5.50 COP 0.639 kW/tonscroll and screw chiller 6.15 IPLV 0.572 IPLV
300-ton water-cooled centrifugal 6.10 COP 0.576 kW/tonchiller (ARI Standard conditions) 6.40 IPLV 0.549 IPLV

Heat rejection equipment Fan speed control 7.5 hp
and greaterCapability to operate at 2/3
fan speed or less
ExceptionsClimates > 7200 CDD50
(e.g. Miami)
1/3 of fans on multiple fan application

ConfigurationNormal Performance Chilled Water
productionpumps
two-way valve
distributionpump
distributionloop
productionloop

Design ParametersNormal Performance Chilled Water Plant AHRI 550/590-2011 Standard Conditions44°F chilled water
2.4 gpm/ton chilled water (10°F (5.6°C T)
85°F entering condenser water
3.0 gpm/ton condenser water (10°F [9.3] T)

ControlNormal Performance Chilled Water Plant Chilled water distribution pump
P at most remote load
Cooling tower fans55°F (12.8°C) (as cold as possible)
Somewhere else
Constant volume condenser water pumps

High Performance Chilled Water Plants System configurations
Design parameters
System control

Variable-Primary-Flow Systems
variable-flowpumps
controlvalve
checkvalves

Flow requirementsVPF System Limits (consult manufacturer)
Absolute flows - Minimum and maximum
Flow rate changes 2% of design flow per minute
not good enough 10% of design flow per minute
borderline 30% of design flow per minute
many comfort cooling applications 50% of design flow per minute
best
Always need a bypass

Chiller ControlVariable W ater Flow
30
40
50
60
70
80
90
100
110
120
130
3:50:00 3:55:00 4:00:00 4:05:00 4:10:00Tim e (hour:m in:sec)
Wat
er T
emp
[deg
F]
-500
-300
-100
100
300
500
700
900
1100
1300
1500
Flow
[gpm
]Evaporator W ater F low
Evap Entering W ater Tem p
Evap Leaving W ater Tem p

BenefitsVPF System Installed costs
Fewer pumps
Reduced piping connections
Reduced electrical connections
Be aware of possible VFD additional costs
Operating Reduced pump operating costs

VPF Savings First cost: 4-8%
Annual energy: 3-8%
Life-cycle cost: 3-5%
http://www.arti-21cr.org/research/completed/finalreports/20070-final1.pdf

Specify and install proper flow control devices

Possible challengesVPF system Chiller control
capabilities
System complexity
Lack of training
Flow measurement -possible costs and accuracy

Series Counterflow
Evaporators in Series Condensers in Series Arranged in Series Counterflow
41°F(5°C)
50°F(10°C)
95.1°F(35°C)
88.1°F(31.2°C)

More informationVPF System Http:/trane.com/commercial
/library/newsletters.asp (1999 and 2002)
“Don’t Ignore Variable Flow,” Waltz, Contracting Business, July 1997
“Primary-Only vs. Primary-Secondary Variable Flow Systems,” Taylor, ASHRAE Journal, February 2002
“Comparative Analysis of Variable and Constant Primary-Flow Chilled-Water-Plant Performance,” Bahnfleth and Peyer, HPAC Engineering, April 2001
“Campus Cooling: Retrofitting Systems,” Kreutzmann, HPAC Engineering, July 2002

Ice Storage System
heat-transferfluid
heat exchanger
or cooling coil
pump
chillerice storagetanks

• Schematic representation of plant layout
• At a glance view of key system operating parameters
• Ability to set key setpoints and weather forecast
System Schematic

Mode Mode Scheduled Hours
System Pump(s)P-1, P-2, (P-3)
Chiller(s)CH-1, (CH-2)
Ice ValveVAL-1
Bypass ValveVAL-3
Diverting ValveVAL-2
Notes
Chiller Only
7am – 11am6pm – 11pm April to October
Modulate on system DPT-2 [setpoint] psid
Enabledto [temp] setpoint
100% to bypass ice
Modulate on chiller flow (DPT-1) to maintainchiller minimum [setpoint] psid
Fully open to building load
Use VPF add routine for number of chillers to operate
Tank Discharge Only
11am – 11pm November through March
Modulate on system DPT-2 [setpoint] psid
Off Modulate on system supply temp [setpoint] °F
Closed Fully open to building load
Simultaneous Chiller & Tank Discharge
11am-6pm April to October
Modulate on remote DP [setpoint] psid
Enabledto [temp] setpoint or [%RLA] limit or operator intervention
Modulate on system supply temp [setpoint] °F
Modulate on chiller flow (DPT-1) to maintainchiller minimum [setpoint] psid
Fully open to building load
Use VPF add routine for number of chillers to operate
Make Ice 11pm to 7am or until terminationsetpoint is reached.
Modulate to ice making flow using DPT-1 [xxx gpm]
Ice Making Modeenabled
Modulate on system supply temp of 15°F (100% to ice)
Closed Fully open to bypass
Make Ice and Cool
11pm to 7am when humidity alarm level
Modulate to ice making flow using DPT-1
Ice Making Modeenabled
Modulate on system supply temp
Closed Modulate to building DPT, starting at min
Control Mode Matrix

High Performance Chilled Water Plants System configurations
Design parameters
System control

a history ofChiller Performance
8.0
ASHRAE Standard 90
chill
er e
ffic
ien
cy,
CO
P
6.0
4.0
2.0
0.0NBI “best”
available90-75(1977)
90-75(1980)
90.1-89 90.1-99
centrifugal>600 tons
screw150-300 tons
scroll<100 tons
reciprocating<150 tons

chilled water plant design …ProvocationAre our “rules of thumb” …
44 F (6.7°C) chilled water supply
10 F T (5.6°C) for chilled water system
3 gpm/ton condenser water flow
… in need of repair?

High Performance Design Parameters ASHRAE GreenGuide
Chilled water T: 12°F to 20 °F (6.7 to 11.1 °C)
Condenser water T: 12°F to 18 °F (multi-stage) (6.7 to 10°C)
Kelly and Chan Chilled water T: 18°F (10°C)
Condenser water T: 14.2°F (7.9°C)(3.6 - 8.3% energy savings in various climates)

High Performance Design Parameters Taylor (ASHRAE Journal December 2011)
Chilled water:“To reiterate: our analysis suggests that it nevermakes sense to use the traditional 10⁰F or 12⁰F ∆Ts that are commonly used in standard practice.” (p.26)
Condenser water:“…life cycle costs were minimized at the largest of the three ∆Ts analyzed, about 15⁰F. This was true for office buildings and datacenters and for both single-stage centrifugal chillers and two-stage centrifugal chillers.” (p.34)
Article provides a simple method to arrive at job-specific flow rates

chilled water plant design …A Paradigm Shift New “rules of thumb”
41 F (5C) chilled water supply
16 F (8.9C) T across the evaporator—that’s at 1.5 gpm/ton
15 F (8.3C) T across the condenser—that’s at 2.0 gpm/ton
Resize the cooling tower accordingly
(We won’t change the coil, chiller or piping for now)

chilled water plant …humid climate
Base Design: 450 Tons 0.5% design
wet bulb: 78 F (25.6C)
Entering condenser water temperature (ECWT): 85 F (29.4 C)
Evaporator and condenser temperature differences: 10 F (5.6C)
Coil, valve and chilled water piping pressure drop: 80 ft
Condenser water piping pressure drop: 30 ft
Pump efficiency: 75%
Pump motorefficiency: 93%

traditional design …humid climate
System Energy Consumption
2.4/3.0
Chilled /Condenser Water Flows, gpm/ton
Ener
gy C
onsu
mpt
ion,
kW
TowerCondenser Water PumpChilled Water PumpChiller (100% Load)
0
50
100
150
200
250
300
350

traditional vs. low-flow design …
System Summary At Full Load
0
50
100
150
200
250
300
350
2.4/3.0 1.5/2.0
Chilled /Condenser Water Flows, gpm/ton
Ener
gy C
onsu
mpt
ion,
kW
TowerCondenser Water PumpChilled Water PumpChiller (100% Load)

comparison …humid climate
System Summary At 75% Load
0
50
100
150
200
250
300
350
2.4/3.0 1.5/2.0
Chilled /Condenser Water Flows, gpm/ton
Ener
gy C
onsu
mpt
ion,
kW
TowerCondenser Water PumpChilled Water PumpChiller (75% Load)

comparison …humid climate
System Summary At 50% Load
0
50
100
150
200
250
300
350
2.4/3.0 1.5/2.0
Chilled /Condenser Water Flows, gpm/ton
Ener
gy C
onsu
mpt
ion,
kW
TowerCondenser Water PumpChilled Water PumpChiller (50% Load)

comparison …humid climate
System Summary At 25% Load
0
50
100
150
200
250
300
350
2.4/3.0 1.5/2.0
Chilled /Condenser Water Flows, gpm/ton
Ener
gy C
onsu
mpt
ion,
kW
TowerCondenser Water PumpChilled Water PumpChiller (25% Load)

traditional vs. low-flow design …humid climate
Savings Summary
0
10.0
20.0
25% 50% 75% 100%
Load
Ope
ratin
g C
ost S
avin
gs, %
3.8%
6.7%
10.3%
16.5%
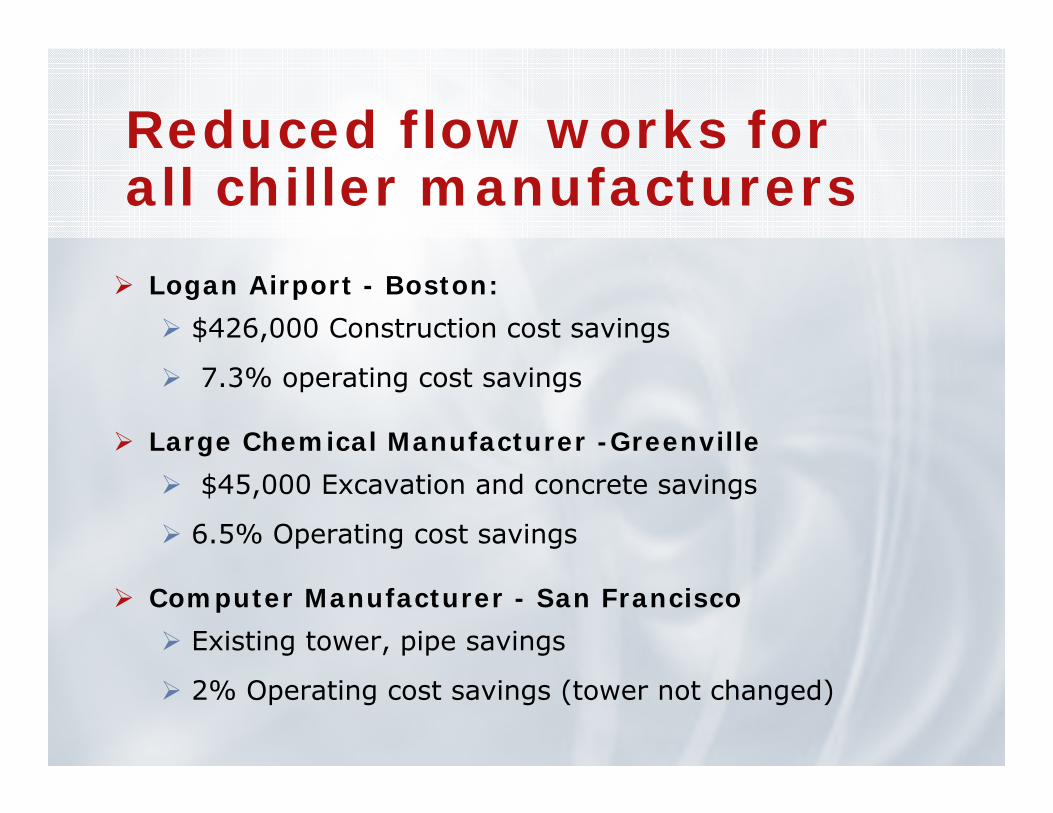
Reduced flow works for all chiller manufacturers Logan Airport - Boston:
$426,000 Construction cost savings
7.3% operating cost savings
Large Chemical Manufacturer -Greenville $45,000 Excavation and concrete savings
6.5% Operating cost savings
Computer Manufacturer - San Francisco Existing tower, pipe savings
2% Operating cost savings (tower not changed)

Low flow works for retrofit applications Chilled water side
Coil It’s a simple heat transfer device Reacts to colder entering water
by returning it warmer
Ideal for system expansion

Cooling Coil PerformanceMBH
EWT
GPM
GPM/ton
LWT
WTR
504
44°F
101
2.4
54°F
10°F
504
41°F
63
1.5
57°F
16°F
GPM reduction of 37.6%

Low flow works for retrofit applications
Condenser side retrofit opportunity Chiller needs to be
replaced
Cooling needs haveincreased by 50%
Cooling tower wasreplaced two years ago
Condenser pump and pipes are in good shape

Condenser side retrofit opportunity
Existing Retrofit
Capacity (tons) 500 750
Flow rate (gpm) 1500 1500
Condenser Entering Water Temperature (F)
85 (29.4 C)
88 (31.1 C)
Condenser Leaving Water Temperature (F)
95 (35 C)
103 (39.4 C)
Design Wet Bulb (F) 78 (25.6 C)
78 (25.6 C)

High Performance Design Parameters Low flow benefits systems - no
matter whose chiller is being used
Low flow works extremely well on existing systems
Low flow works on short piping runs

High PerformanceDesign OptionsEither …
Take full energy (operating cost) savings
Or …
Reduce piping size and cost
Experienced designers use pump,piping and tower savings to select aneven more efficient chiller

always, always,Always Remember …

Oh, by the way...
You may also do this with air

High PerformanceChilled Water Plants System configurations
Design parameters
System control

High PerformanceChilled Water Pump Control
Valve position Pump Pressure Sensor
Communicating BAS Pump Speed

Position (% open)of critical valve
75%
65%
Increase pump static pressure setpoint
Reduce pump static pressure setpoint
No action
pump-pressure optimizationControl Logic
Required by ASHRAE/IES 90.1-2010

High Performance Chiller-Tower Control
Plant Power vs CWS
0.0
200.0
400.0
600.0
800.0
1,000.0
1,200.060 62 64 66 68 70 72 74 76 78 80 82 84 86 88
Condenser Water Setpoint (°F)
Pow
er (k
W)
Lowest condenser water temperature available from tower at this load and wet-bulb temperature
Chillers cannot meet load above this condenser water temperature
Optimal operation
1,550 tons, 65°F Wet-bulb T t
1,160 tons, 59°F Wet-bulb T
730 tons, 54°F Wet-bulb Temperature
Hydeman, et. al. Pacific Gas and Electric. Used with permission.

High Performance Chiller-Tower Control
0
100
200
300
400
72 74 76 78 80 82 84Condenser water temperature (°F)
kW
Chiller kWTower kWTotal kW

High Performance Chiller-Tower Control Braun, Diderrich
Hydeman, Gillespie, Kammerud
Schwedler,ASHRAE Journal
Cascia
Crowther & Furlong, ASHRAE Journal

Chiller-tower optimizationEstimated Savings Crowther
(“Optimized” vs. driving water to 65°F) Chicago: 5.4%
Las Vegas: 2.6%
Miami: 8.5%
Based on chiller+tower annual energy consumption

High performance chilled water plant
Winchester Medical Center

Medical CenterWinchester, Virginia Five 750-ton chillers
0.571 kW/ton full load
Chilled water 58 to 42°F
Condenser water84 to 95°F(missed opportunity)
VFD’s
Variable primary flow
VFD’s on Chilled water pumps
Condenser water pumps
Cooling tower fans
Sophisticated control system with lots of Programming
Commissioning

WMC - August 12Chiller plant
0.0
200.0
400.0
600.0
800.0
1000.0
1200.0
1400.0
8/8/20
03 14:3
0
8/8/20
03 13:3
0
8/8/20
03 12:3
0
8/8/20
03 11:3
0
8/8/20
03 10:3
0
8/8/20
03 9:30
8/8/20
03 8:30
8/8/20
03 7:30
8/8/20
03 6:30
8/8/20
03 5:30
8/8/20
03 4:30
8/8/20
03 3:30
8/8/20
03 2:30
8/8/20
03 1:30
8/8/20
03 0:30
8/7/20
03 23:3
0
8/7/20
03 22:3
0
8/7/20
03 21:3
0
8/7/20
03 20:3
0
8/7/20
03 19:3
0
8/7/20
03 18:3
0
8/7/20
03 17:3
0
8/7/20
03 16:3
0
8/7/20
03 15:3
0
Time/Date
Load
(ton
s)
0.00
0.10
0.20
0.30
0.40
0.50
0.60
0.70
0.80
Effic
ienc
y (k
W/to
n)
tonskW/ton

WMC - Sept 1-7Chiller plant Weekly-Summary
0.0
200.0
400.0
600.0
800.0
1000.0
1200.0
1400.0
1600.01/
0/19
00 0
:00
1/0/
1900
0:0
01/
0/19
00 0
:00
1/0/
1900
0:0
01/
0/19
00 0
:00
9/1/
2003
14:
009/
1/20
03 1
9:30
9/2/
2003
1:0
09/
2/20
03 6
:30
9/2/
2003
12:
009/
2/20
03 1
7:30
9/2/
2003
23:
009/
3/20
03 4
:30
9/3/
2003
10:
009/
3/20
03 1
5:30
9/3/
2003
21:
009/
4/20
03 2
:30
9/4/
2003
8:0
09/
4/20
03 1
3:30
9/4/
2003
19:
009/
5/20
03 0
:30
9/5/
2003
6:0
09/
5/20
03 1
1:30
9/5/
2003
17:
009/
5/20
03 2
2:30
9/6/
2003
4:0
09/
6/20
03 9
:30
9/6/
2003
15:
009/
6/20
03 2
0:30
9/7/
2003
2:0
09/
7/20
03 7
:30
Time
Tons
0.00
0.10
0.20
0.30
0.40
0.50
0.60
0.70
0.80
kW/to
n
tonskW/ton

Remember...Without controls,it’s not a system.Without controls,it’s not a system.

The meter is on the building!

It’s a great time to be in this business!