HIGH PERFORMANCE CHILLED WATER SYSTEMS EarthWiseHVAC
23
7/18/2012 1 EarthWise HVAC Simon Ho e: [email protected] 2012 HIGH PERFORMANCE CHILLED WATER SYSTEMS 2 EarthWise HVAC – High Performance CHW Plants • Low Flow Low Temperature Systems • Variable Flow Systems – Variable CHW – Variable CDW • Chillers Piping Configurations • Chiller Tower Optimization • Pumping Optimization
Transcript of HIGH PERFORMANCE CHILLED WATER SYSTEMS EarthWiseHVAC

7/18/2012
1
EarthWise HVAC
Simon Hoe: [email protected]
2012
HIGH PERFORMANCE CHILLED WATER SYSTEMS
2
EarthWise HVAC –High Performance CHW Plants
• Low Flow Low Temperature Systems
• Variable Flow Systems
– Variable CHW
– Variable CDW
• Chillers Piping Configurations
• Chiller Tower Optimization
• Pumping Optimization
7/18/2012
2
3
LOW FLOW LOW TEMPERATURE HIGH EFFICIENCY SYSTEMS
4
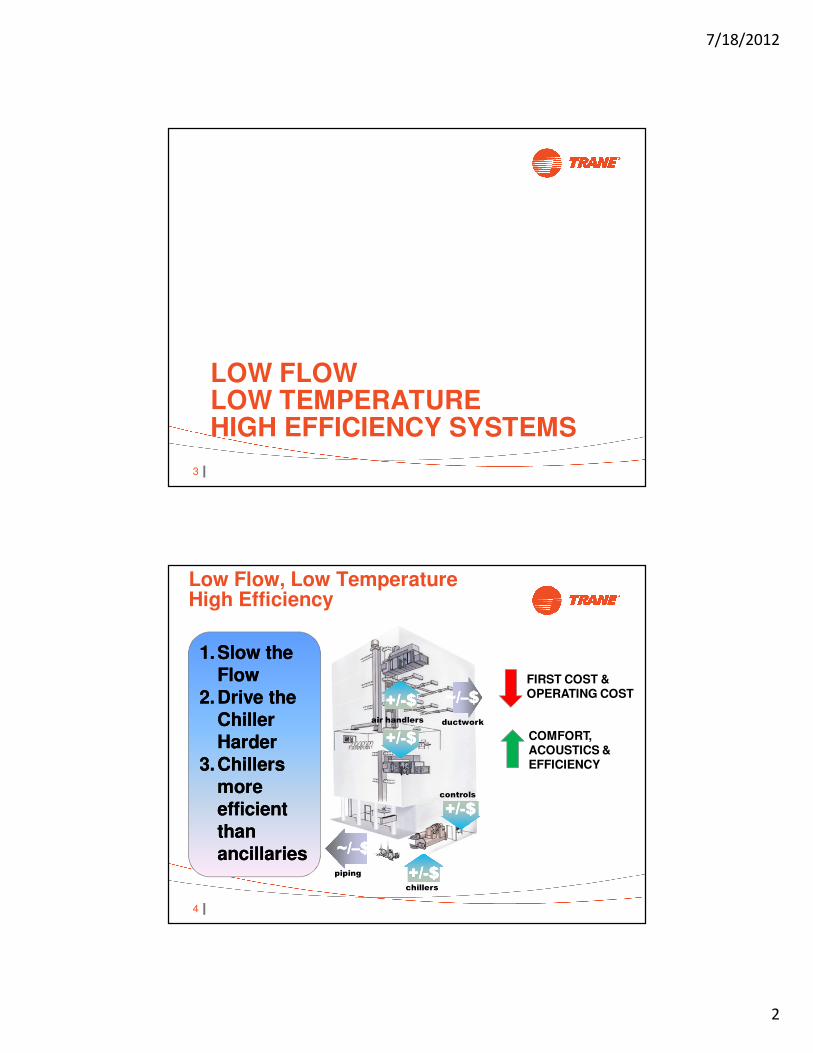
Low Flow, Low TemperatureHigh Efficiency
piping
~/~/––$$
ductwork
~/~/––$$
+/+/--$$
air handlers
+/+/--$$
+/+/--$$controls
chillers
+/+/--$$
FIRST COST &OPERATING COST
COMFORT,ACOUSTICS &EFFICIENCY
1.1.Slow the Slow the
FlowFlow
2.2.Drive the Drive the
Chiller Chiller
HarderHarder
3.3.Chillers Chillers
more more
efficient efficient
than than
ancillariesancillaries

7/18/2012
3
5
Low Flow Low Temperature
• Low flow CHW and/or CDW improves system efficiency at part load
– Pumping power reduction more than offset slight increase in chiller power
• Low flow also decreases infrastructure costs
– Piping, valves
– Insulation
– Pumps
– Towers
• CT sizing can reduce with warm (design) condenser water and lower flows
• Re-invest some of the capital back into higher efficiency chillers, towers, coils and controls
6
Chiller Efficiency (Code vs Best in Class)
3.0
3.5
4.0
4.5
5.0
5.5
6.0
6.5
7.0
7.5
8.0
0 500 1000 1500 2000
MEPS AU2008
1970s
1980s
1990s
2000s
2010s
kW
CO
P
Note: Efficiencies at full load at AHRI (Standard MEPS) conditions – water-cooled chillers
Higher Higher efficiencies efficiencies today allowtoday allowfor better for better
chiller chiller utilizationutilization

7/18/2012
4
7
CHW Design Parameters
Parameter Past/Conventional EarthWise
Leaving CHW, [oC] 6 ~ 7 4 ~ 6
CHW δδδδT, [K] 5 ~ 7 9 ~ 12
CHW Flow, [L/s/MW] 34 ~ 48 20 ~ 26
Leaving CDW, [oC] 35 36 ~ 38
CDW δδδδT, [K] 5.5 8 ~ 10
CDW Flow, [L/s/MW] 54 28 ~ 35
CooltoolsTM Chilled Water Plant Design Guide (Dec 2009) recommends
� 6.7 to 11.1K δT on chilled water and
� 6.7 to 10K δT on condenser δT
Steven Taylor (ASHRAE Dec 2011), “Clearly life-cycle costs will be lower, the higher the
(chilled water) δT ...” within the range of their analysis (up to 13.9K δT)
8
CHW Plant Efficiency
• Chiller efficiency improvements
– Minimum code requirements: MEPS compliant
– AHRI or Eurovent certified; assurance of performance
• CHW Plant Ancillaries do Count !
– CHW pumps
– CDW pumps
– Cooling Tower fans
• CHW Plant System Efficiency [COP] defined by
– Total Power Input includes power input of chillers and ancillaries
COOLING CAPACITY [kW]
TOTAL POWER INPUT [kW]
7/18/2012
5
9
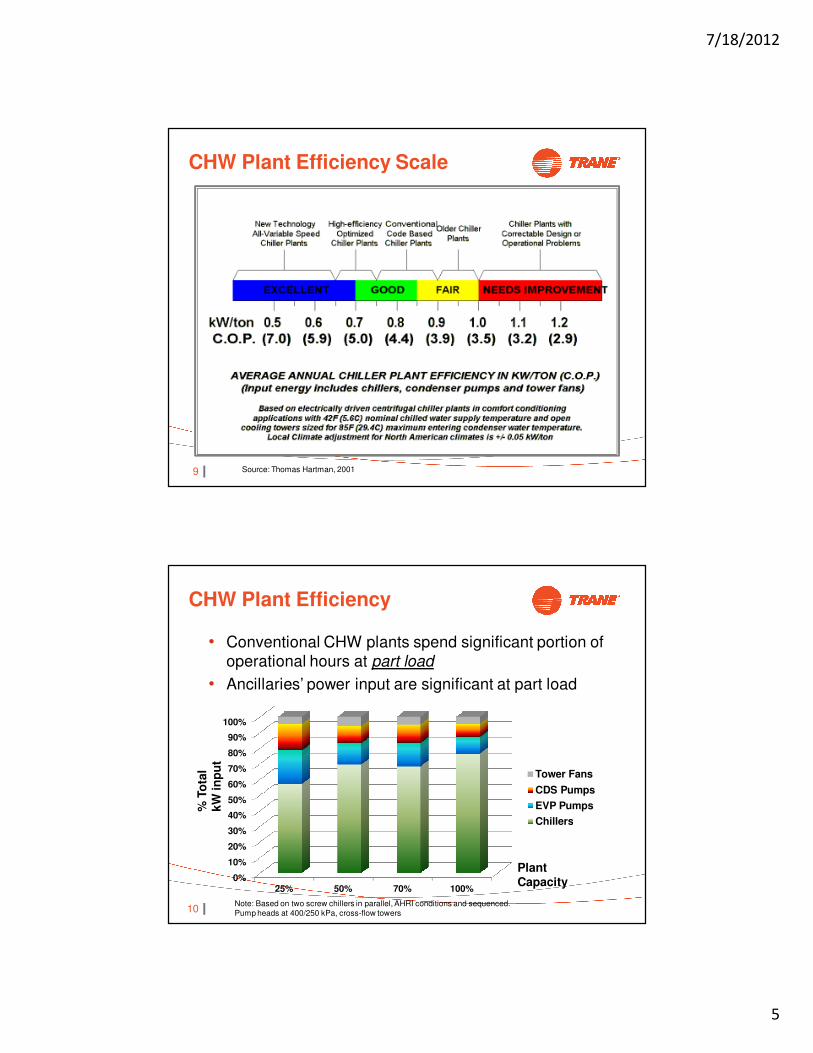
CHW Plant Efficiency Scale
Source: Thomas Hartman, 2001
10
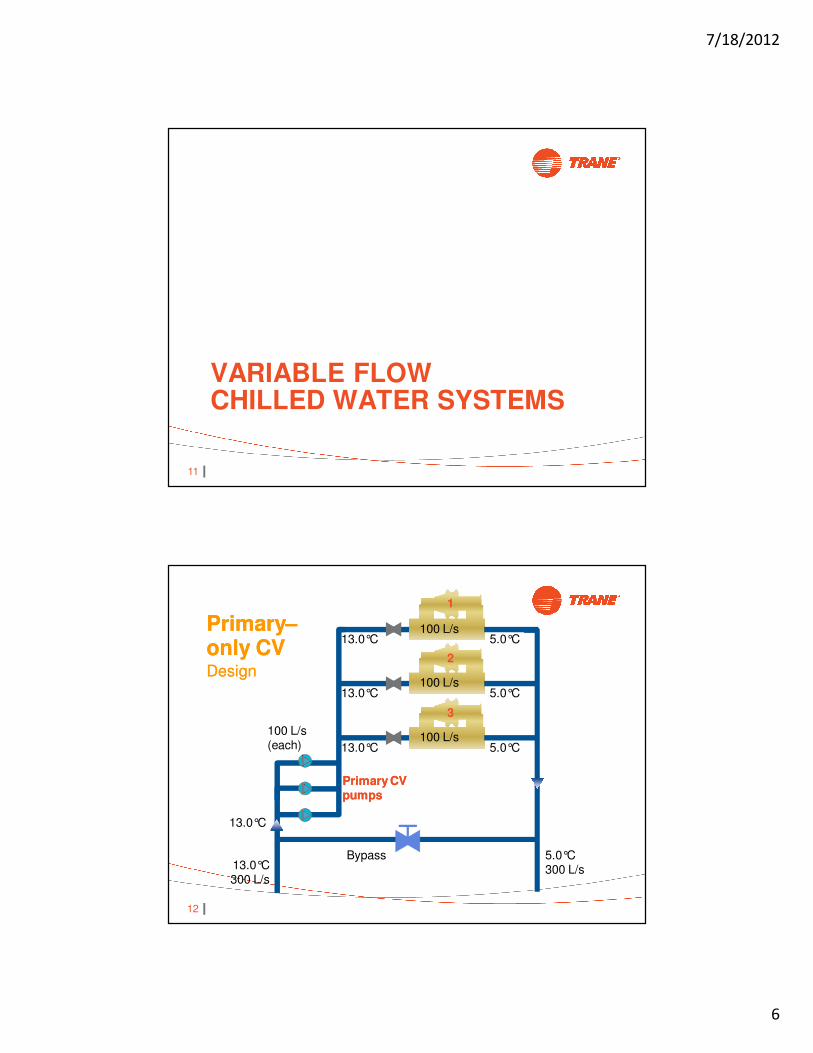
CHW Plant Efficiency
• Conventional CHW plants spend significant portion of operational hours at part load
• Ancillaries’ power input are significant at part load
0%
10%
20%
30%
40%
50%
60%
70%
80%
90%
100%
25% 50% 70% 100%
Tower Fans
CDS Pumps
EVP Pumps
Chillers
Plant Capacity
% T
ota
l kW
in
pu
t
Note: Based on two screw chillers in parallel, AHRI conditions and sequenced.
Pump heads at 400/250 kPa, cross-flow towers
7/18/2012
6
11
VARIABLE FLOWCHILLED WATER SYSTEMS
12
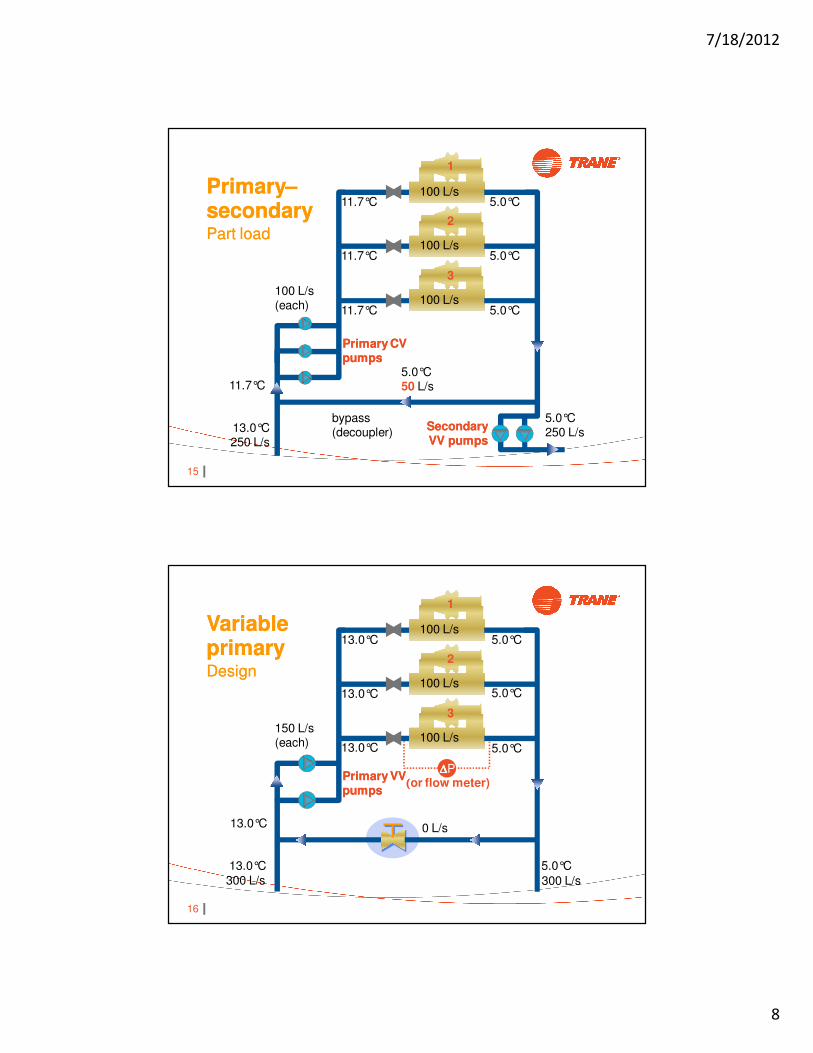
13.0°C300 L/s
5.0°C300 L/s
13.0°C
13.0°C 5.0°C100 L/s
1
13.0°C 5.0°C100 L/s
2
13.0°C 5.0°C100 L/s
3
100 L/s(each)
Bypass
Primary–only CVDesign
Primary–only CVDesign
Primary CVpumpsPrimary CVpumps

7/18/2012
7
13
13.0°C250 L/s
5.0°C250 L/s
11.7°C
11.7°C 5.0°C100 L/s
1
11.7°C 5.0°C100 L/s
2
11.7°C 5.0°C100 L/s
3
100 L/s(each)
Bypass
Primary–only CVPart Load
Primary–only CVPart Load
Primary CVpumpsPrimary CVpumps
5.0°C50 L/s
14
13.0°C300 L/s
5.0°C300 L/s
13.0°C
13.0°C 5.0°C100 L/s
1
13.0°C 5.0°C100 L/s
2
13.0°C 5.0°C100 L/s
3
100 L/s (each)
bypass(decoupler)
Primary–secondaryDesign
Primary–secondaryDesign
Primary CVpumpsPrimary CVpumps
secondaryVV pumpssecondaryVV pumps
7/18/2012
8
15
13.0°C250 L/s
5.0°C250 L/s
11.7°C
11.7°C 5.0°C100 L/s
1
11.7°C 5.0°C100 L/s
2
11.7°C 5.0°C100 L/s
3
100 L/s(each)
bypass(decoupler)
Primary–secondaryPart load
Primary–secondaryPart load
Primary CVpumpsPrimary CVpumps
SecondaryVV pumpsSecondaryVV pumps
5.0°C50 L/s
16
Variable primaryDesign
Variable primaryDesign
13.0°C
300 L/s
5.0°C
300 L/s
13.0°C
∆∆∆∆P
13.0°C 5.0°C100 L/s
1
13.0°C 5.0°C100 L/s
2
13.0°C 5.0°C100 L/s
3
((((or flow meter)Primary VVpumpsPrimary VVpumps
0 L/s
150 L/s(each)

7/18/2012
9
17
Variable primaryPart load
Variable primaryPart load
13.0°C
250 L/s
5.0°C
250 L/s
13.0°C
∆∆∆∆P
13.0°C 5.0°C83.3 L/s
1
13.0°C 5.0°C83.3 L/s
2
13.0°C 5.0°C83.3 L/s
3
0 L/s
Primary VVpumpsPrimary VVpumps
125 L/s(each)
((((or flow meter)
18
Variable primarySystem Flow <
Chiller Min Flow
Variable primarySystem Flow <
Chiller Min Flow
13.0°C
20 L/s
5.0°C
20 L/s
9.0°C
∆∆∆∆P
9.0°C 5.0°C40 L/s
1
OFF
2
OFF
3
5.0°C20 L/s
Primary VVpumpsPrimary VVpumps
1 pump 40 L/s
((((or flow meter)

7/18/2012
10
19
VPF - Advantages
• Less capital...more space
• Energy efficient
– Pumping savings during most operating conditions, down to minimum flow
– Pumping kW ∝ {Flow} 2.0 to 2.8
• Improves reliability of system with manifold
arrangement
• Separates pumping duty from cooling duty
– Not operating pumps to start chillers
• Chillers can fully realize its maximum capacity
– Over-pumping during part load to fully load chillers before bringing on the next chiller
20
VPF Chiller Lab Test
Capacity Control
with W ater Flow Compensation
30
40
50
60
70
80
90
100
110
120
130
0:00:00 0:10:00 0:20:00 0:30:00 0:40:00 0:50:00
Time (hour:min:sec)
Wate
r T
em
p [
deg
F]
-500.00
-300.00
-100.00
100.00
300.00
500.00
700.00
900.00
1,100.00
1,300.00
1,500.00
Wate
r F
low
[g
pm
]
Evaporator W ater Flow
Evap Entering W ater Temp
Evap Leaving W ater Temp
50% Flow in 30 sec
75 L/s
38 L/s
9.5°C
5.6°C
7/18/2012
11
21
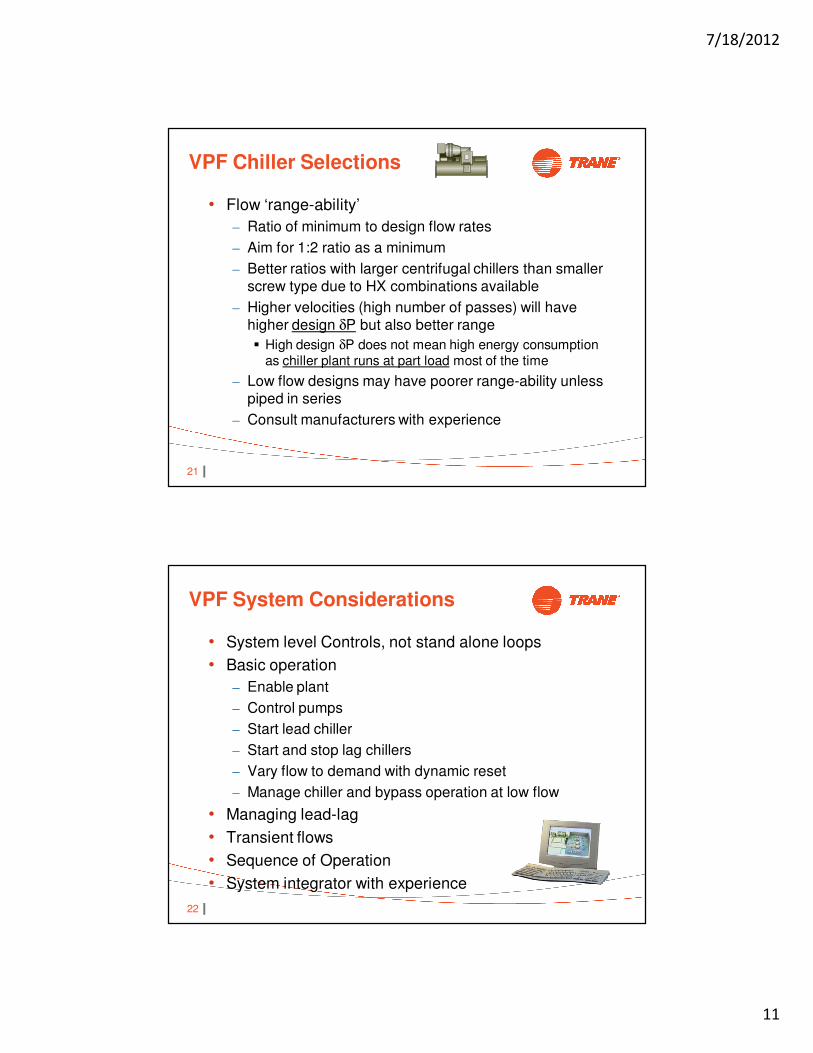
VPF Chiller Selections
• Flow ‘range-ability’
– Ratio of minimum to design flow rates
– Aim for 1:2 ratio as a minimum
– Better ratios with larger centrifugal chillers than smaller screw type due to HX combinations available
– Higher velocities (high number of passes) will have higher design δP but also better range
� High design δP does not mean high energy consumption as chiller plant runs at part load most of the time
– Low flow designs may have poorer range-ability unless piped in series
– Consult manufacturers with experience
22
VPF System Considerations
• System level Controls, not stand alone loops
• Basic operation
– Enable plant
– Control pumps
– Start lead chiller
– Start and stop lag chillers
– Vary flow to demand with dynamic reset
– Manage chiller and bypass operation at low flow
• Managing lead-lag
• Transient flows
• Sequence of Operation
• System integrator with experience
7/18/2012
12
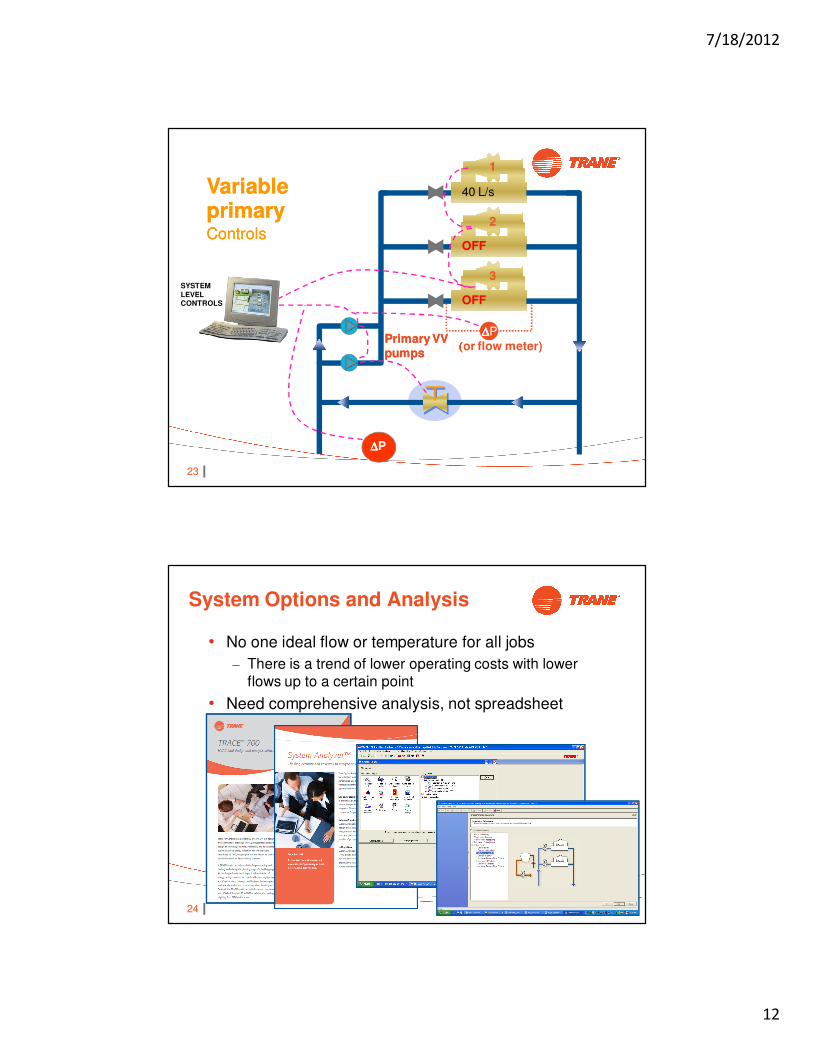
23
Variable primaryControls
Variable primaryControls
∆∆∆∆P
40 L/s
1
OFF
2
OFF
3
Primary VVpumpsPrimary VVpumps
((((or flow meter)
SYSTEM
LEVEL CONTROLS
∆∆∆∆P
24
System Options and Analysis
• No one ideal flow or temperature for all jobs
– There is a trend of lower operating costs with lower flows up to a certain point
• Need comprehensive analysis, not spreadsheet

7/18/2012
13
25
Full Load – System Input kW
0
50
100
150
200
250
300
350
400
450
500
Parallel AHRI Parallel AHRI, VPF
Low Flow CHW
Low Flow CHW & CDW
Tower Fans
CDS Pumps
EVP Pumps
Chillers
Note: Based on two screw chillers in parallel, sequenced. AHRI conditions compared to Low
Flow CHW 5.5/15.5C; Low Flow CDS 28/36C. Pump heads at 400/250 kPa, cross-flow towers
Syste
m k
W
26
75% Load – System Input kW
0
50
100
150
200
250
300
350
Parallel AHRI Parallel AHRI, VPF
Low Flow CHW
Low Flow CHW & CDW
Tower Fans
CDS Pumps
EVP Pumps
Chillers
Note: Based on two screw chillers in parallel, sequenced. AHRI conditions compared to Low
Flow CHW 5.5/15.5C; Low Flow CDS 28/36C. Pump heads at 400/250 kPa, cross-flow towers
Syste
m k
W

7/18/2012
14
27
50% Load – System Input kW
0
20
40
60
80
100
120
140
160
180
200
Parallel AHRI Parallel AHRI, VPF
Low Flow CHW
Low Flow CHW & CDW
Tower Fans
CDS Pumps
EVP Pumps
Chillers
Note: Based on two screw chillers in parallel, sequenced. AHRI conditions compared to Low
Flow CHW 5.5/15.5C; Low Flow CDS 28/36C. Pump heads at 400/250 kPa, cross-flow towers
Syste
m k
W
28
25% Load – System Input kW
0
20
40
60
80
100
120
Parallel AHRI
Parallel AHRI, VPF
Low Flow CHW
Low Flow CHW & CDW
Tower Fans
CDS Pumps
EVP Pumps
Chillers
Note: Based on two screw chillers in parallel, sequenced. AHRI conditions compared to Low
Flow CHW 5.5/15.5C; Low Flow CDS 28/36C. Pump heads at 400/250 kPa, cross-flow towers
Syste
m k
W
7/18/2012
15
29
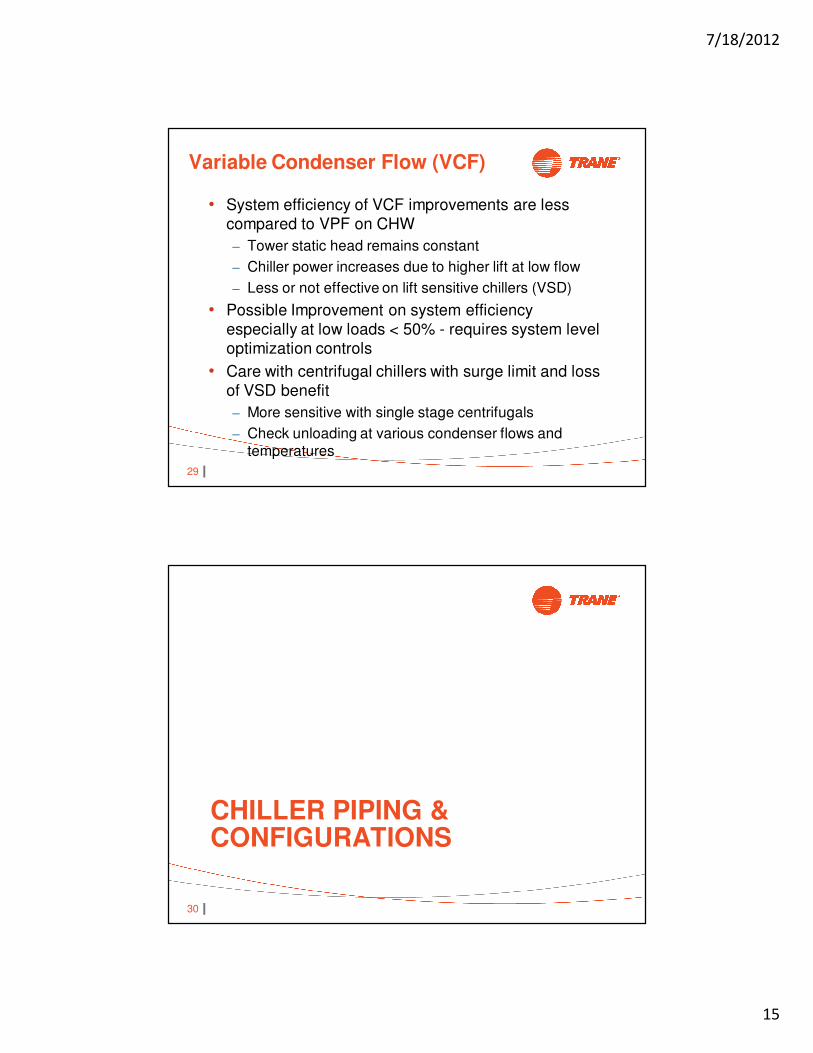
Variable Condenser Flow (VCF)
• System efficiency of VCF improvements are less
compared to VPF on CHW
– Tower static head remains constant
– Chiller power increases due to higher lift at low flow
– Less or not effective on lift sensitive chillers (VSD)
• Possible Improvement on system efficiency
especially at low loads < 50% - requires system level
optimization controls
• Care with centrifugal chillers with surge limit and loss of VSD benefit
– More sensitive with single stage centrifugals
– Check unloading at various condenser flows and temperatures
30
CHILLER PIPING & CONFIGURATIONS
7/18/2012
16
31
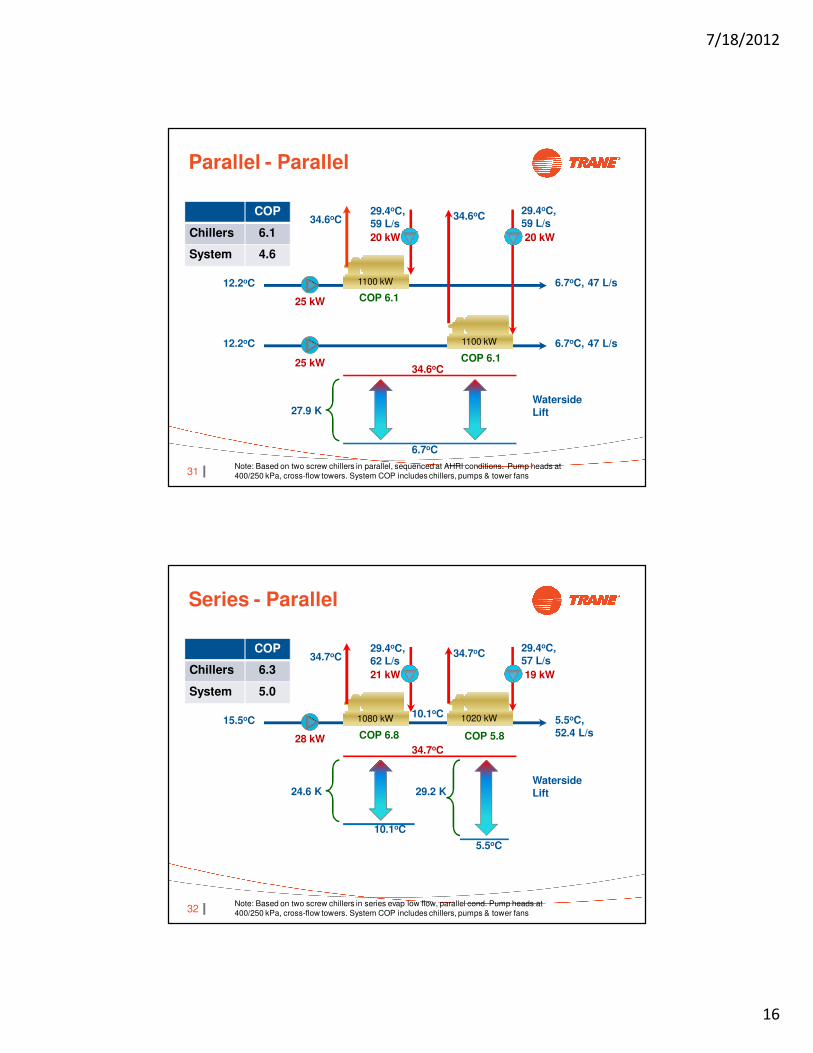
Parallel - Parallel
6.7oC, 47 L/s1100 kW1100 kW
1100 kW1100 kW 6.7oC, 47 L/s12.2oC
12.2oC
34.6oC 34.6oC29.4oC,
59 L/s
Note: Based on two screw chillers in parallel, sequenced at AHRI conditions. Pump heads at
400/250 kPa, cross-flow towers. System COP includes chillers, pumps & tower fans
25 kW
25 kW
20 kW20 kW
29.4oC,
59 L/s
27.9 KWaterside
Lift
COP 6.1
COP 6.1
COP
Chillers 6.1
System 4.6
34.6oC
6.7oC
32
Series - Parallel
5.5oC,
52.4 L/s
1080 kW1080 kW 1020 kW1020 kW15.5oC
34.7oC 34.7oC29.4oC,
57 L/s
Note: Based on two screw chillers in series evap low flow, parallel cond. Pump heads at
400/250 kPa, cross-flow towers. System COP includes chillers, pumps & tower fans
28 kW
19 kW21 kW
29.4oC,
62 L/s
24.6 KWaterside
Lift
COP 5.8COP 6.8
COP
Chillers 6.3
System 5.0
29.2 K
10.1oC
34.7oC
10.1oC
5.5oC

7/18/2012
17
33
Series – Counter-flow
5.5oC,
52.4 L/s
1200 kW1200 kW 1000 kW1000 kW15.5oC
36.1oC28.0oC,
75.5 L/s
Note: Based on two screw chillers in series evap low flow, counter-flow cond. Pump heads at
400/250 kPa, cross-flow towers. System COP includes chillers, pumps & tower fans
28 kW
25 kW31.7oC
26.0 KWaterside
Lift
COP 6.3COP 6.4
COP
Chillers 6.4
System 5.2
26.2 K
10.1oC
36.1oC31.7oC
10.1oC
5.5oC
34
Parallel ConfigurationLarge Capacity Plants
36.0oC
Note: Based on two duplex centrifugal chillers in series evap low flow, counter-flow cond.
Pump heads at 400/250 kPa, cross-flow towers. System COP includes chillers, pumps & tower fans
4 off
2.5MW,
COP 6.59
COP
Chillers 6.6
System 5.7
28.0oC,
349 L/s
116 kWp
113 kWp
5.5oC,
217 L/s16.5oC
30.5
K
5.5oC
36.0oC
Waterside
Lift
7/18/2012
18
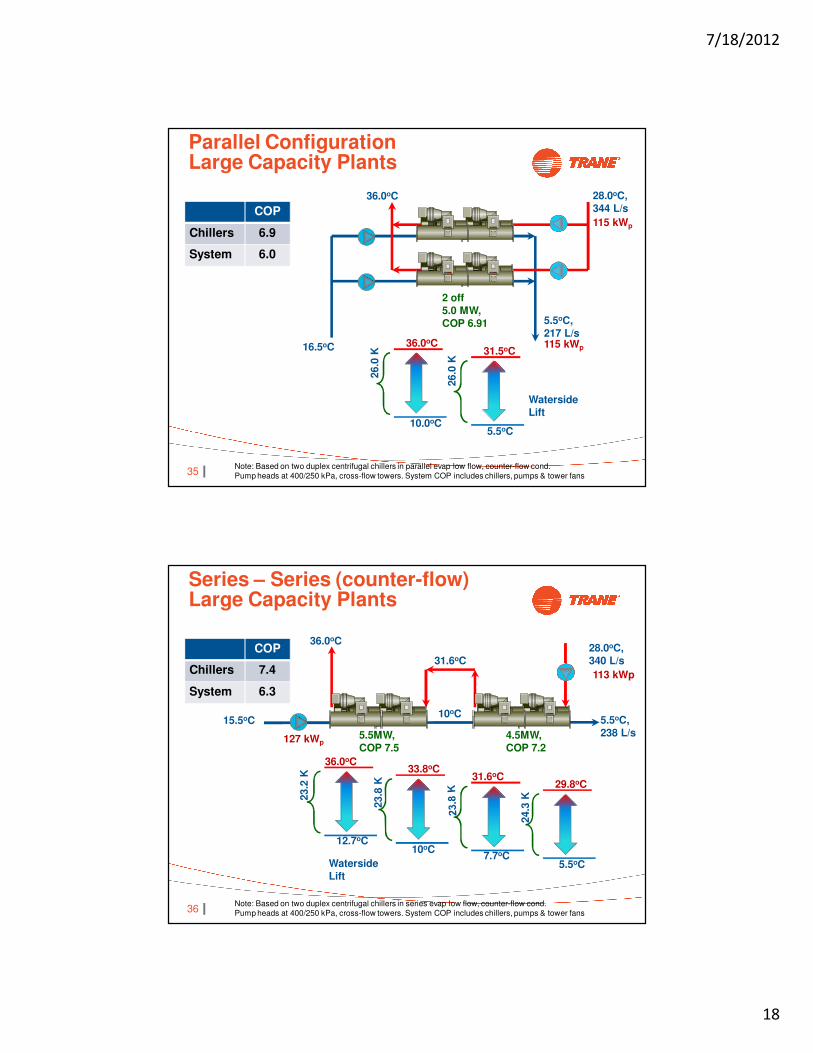
35
Parallel ConfigurationLarge Capacity Plants
36.0oC
Note: Based on two duplex centrifugal chillers in parallel evap low flow, counter-flow cond.
Pump heads at 400/250 kPa, cross-flow towers. System COP includes chillers, pumps & tower fans
2 off
5.0 MW,
COP 6.91
COP
Chillers 6.9
System 6.0
28.0oC,
344 L/s
115 kWp
115 kWp
5.5oC,
217 L/s
16.5oC
26.0
K
10.0oC
36.0oC
Waterside
Lift
26.0
K
5.5oC
31.5oC
36
Series – Series (counter-flow)Large Capacity Plants
15.5oC
36.0oC28.0oC,
340 L/s
Note: Based on two duplex centrifugal chillers in series evap low flow, counter-flow cond.
Pump heads at 400/250 kPa, cross-flow towers. System COP includes chillers, pumps & tower fans
127 kWp
113 kWp
31.6oC
23.2
K
5.5MW,
COP 7.5
COP
Chillers 7.4
System 6.3
10oC
4.5MW,
COP 7.2
5.5oC,
238 L/s
23.8
K
10oC
33.8oC36.0oC
12.7oC
24.3
K
5.5oC
29.8oC31.6oC
7.7oCWaterside
Lift
7/18/2012
19
37
Summary of EarthWise Chiller Plant Configurations
• Low flow CHW and CDW improves system COP
• Series connection improves performance at full and
part load
• Use variable flow to improve pumping efficiency
– VPF with Series chillers maximizes pump savings
• Potential savings with variable condenser water flow
at low loads
• Couple with overall chiller, pump and tower sequencing strategy
• Include optimal tower water control
38
CHILLER, TOWER AND PUMPING OPTIMIZATION
7/18/2012
20
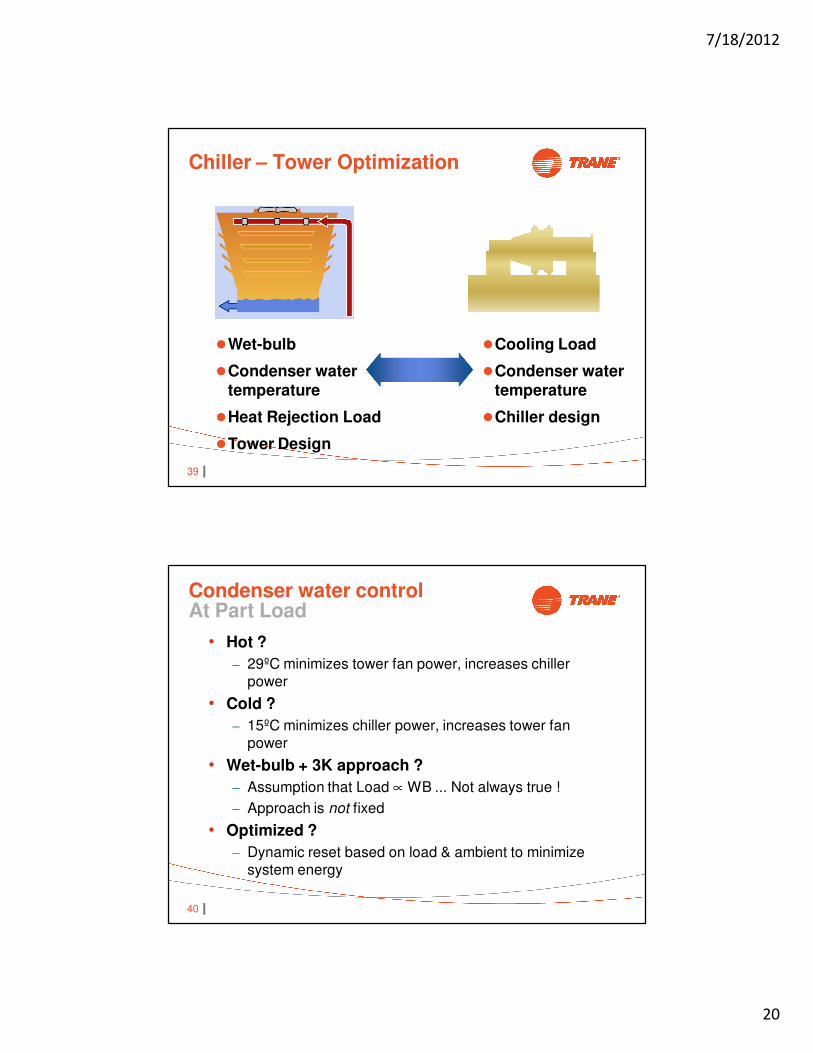
39
Chiller – Tower Optimization
�Cooling Load
�Condenser watertemperature
�Chiller design
�Wet-bulb
�Condenser watertemperature
�Heat Rejection Load
�Tower Design
40
Condenser water controlAt Part Load
• Hot ?
– 29ºC minimizes tower fan power, increases chiller power
• Cold ?
– 15ºC minimizes chiller power, increases tower fan power
• Wet-bulb + 3K approach ?
– Assumption that Load ∝ WB ... Not always true !
– Approach is not fixed
• Optimized ?
– Dynamic reset based on load & ambient to minimize system energy

7/18/2012
21
41
Chiller – Tower Optimization
condenser water temperature, °C
19
en
erg
y c
on
su
mp
tio
n, k
W
21 23 25 27170
29
tower
chiller
total
optimalcontrol point
Note: Chiller at 50% Load, ambient 10ºC WB
42
CTO comparisons
-
200,000
400,000
600,000
800,000
1,000,000
1,200,000
15C 18C 20C 22C 25C CTO
Towers
Pumps
Chillers
CT Minimum Temp Set Point [ºC]
CH
W P
lan
t A
nn
ual
En
erg
y C
on
s [
kW
h]
Sydney Commercial Office Application; BCA Class 5 schedules
2,200 kW cooling, water-cooled screw chillers, VAV, Econ cycle,
~ 6%
2 2 –– 3 yr 3 yr paybackpayback40% ROI40% ROI

7/18/2012
22
43
Chiller – Tower Optimization
TRACER
SYSTEM LEVEL
CONTROLS
TRH
FF
FF
TT
44
Pumping Optimization
• Variable Flow CHW systems
• System Level critical valve reset
– Keeps critical valve near fully open
– Dynamic reset of δP set point
• Minimizes pumping power
• Better coil and temperature control
• Better acoustics Air Handling Units
Control
Valves
Pressure
Differential
Controller or
Transmitter
VFD
VV CHWPTRACER
SYSTEM LEVEL
CONTROLS


![Chilled Water Distibution[1]](https://static.fdocuments.in/doc/165x107/55cf9df8550346d033b01542/chilled-water-distibution1.jpg)