High Performance Building Façade Solutions PIER Final ...gaia.lbl.gov/btech/papers/4583.pdf ·...
133
LBNL-4583E High Performance Building Façade Solutions PIER Final Project Report Authors: E.S. Lee S.E. Selkowitz D.L. DiBartolomeo J.H. Klems R.D. Clear K. Konis R. Hitchcock M. Yazdanian R. Mitchell M. Konstantoglou December 2009
Transcript of High Performance Building Façade Solutions PIER Final ...gaia.lbl.gov/btech/papers/4583.pdf ·...
LBNL-4583E
High Performance Building Façade Solutions PIER Final Project Report Authors: E.S. Lee S.E. Selkowitz D.L. DiBartolomeo J.H. Klems R.D. Clear K. Konis R. Hitchcock M. Yazdanian R. Mitchell M. Konstantoglou December 2009
Arnold Schwarzenegger
Governor HIGH PERFORMANCE BUILDING
FAÇADE SOLUTIONS
Prepared For: California Energy Commission Public Interest Energy Research Program
Prepared By: Lawrence Berkeley National Laboratory
PIE
R F
INA
L P
RO
JEC
T R
EP
OR
T
December 2009
Project: CEC-500-06-041

ii

iii
Prepared By: Lawrence Berkeley National Laboratory Eleanor S. Lee and Stephen E. Selkowitz Berkeley, California 94720 Contract No.500-06-041 Prepared For:
California Energy Commission
Michael Seaman Contract Manager Norman Bourassa PIER Buildings Team Leader Virginia Lew PIER Energy Efficiency Research Office
Manager
Thom Kelly, Ph.D. Deputy Director Energy Research & Development
Division
Melissa Jones Executive Director
DISCLAIMER
This report was prepared as the result of work sponsored by the California Energy Commission. It does not necessarily represent the views of the Energy Commission, its employees or the State of California. The Energy Commission, the State of California, its employees, contractors and subcontractors make no warrant, express or implied, and assume no legal liability for the information in this report; nor does any party represent that the uses of this information will not infringe upon privately owned rights. This report has not been approved or disapproved by the California Energy Commission nor has the California Energy Commission passed upon the accuracy or adequacy of the information in this report.

iv

DISCLAIMER
This document was prepared as an account of work sponsored by the United States Government. While this document is believed to contain correct information, neither the United States Government nor any agency thereof, nor The Regents of the University of California, nor any of their employees, makes any warranty, express or implied, or assumes any legal responsibility for the accuracy, completeness, or usefulness of any information, apparatus, product, or process disclosed, or represents that its use would not infringe privately owned rights. Reference herein to any specific commercial product, process, or service by its trade name, trademark, manufacturer, or otherwise, does not necessarily constitute or imply its endorsement, recommendation, or favoring by the United States Government or any agency thereof, or The Regents of the University of California. The views and opinions of authors expressed herein do not necessarily state or reflect those of the United States Government or any agency thereof or The Regents of the University of California.

Acknowledgments This work was supported by the California Energy Commission through its Public Interest Energy Research (PIER) Program on behalf of the citizens of California and by the Assistant Secretary for Energy Efficiency and Renewable Energy, Office of Building Technology, State and Community Programs, Office of Building Research and Standards of the U.S. Department of Energy under Contract No. DE-AC02-05CH11231.
We are indebted to Michael Seaman of the California Energy Commission and Marc LaFrance of the U.S. Department of Energy for their invaluable guidance, enthusiasm, and support throughout this multiyear project.
We would also like to thank the Project Advisory Committee members for taking the time to provide insightful technical and market-related input into the direction of this R&D:
3M Advanced Glazings Alanod Alcoa American Architectural Manufacturers Association Anshen +Allen Apogee Arup Atelier Ten Colt International Ltd. EFCO Enclos Flack & Kurtz General Services Administration Gensler Glass Association of North America Glen Raven Custom Fabrics, LLC Harvard University Heschong Mahone Group, Inc. HOK Hunter Douglas Integrated Design Associates, Inc. Kaplan McLaughlin Diaz Kawneer Loisos & Ubbelohde Lutron Electronics, Inc. Massachusetts Institute of Technology MechoShade Systems, Inc. National Fenestration Rating Council National Research Council, Canada NBBJ Oldcastle Glass Pacific Gas and Electric Company Pella Pennsylvania State University Pilkington Glass Sacramento Municipal Utility District Sage Electrochromics, Inc.
ii
Saint Gobain Samsung Siegel & Strain Architects Skidmore Owings and Merrill Somfy Systems, Inc. Southern California Edison Taylor Engineering The New York Times TRACO University of California, Berkeley University of Minnesota University of Texas at Austin University of Washington Victoria University, New Zealand Viracon Warema International Wausau Window and Wall Systems Window and Door Manufacturers Association Zimmer Gunsul-Frasca Architects The project team consisted of staff from a variety of disciplines within the Environmental Energy Technologies Division at the Lawrence Berkeley National Laboratory:
Robert D. Clear, Ph.D. Dennis DiBartolomeo Daniel E. Fuller Howdy Goudey Robert Hitchcock Carl Jacob Jonsson, Ph.D. Joseph H. Klems, Ph.D. Christian Kohler Kyle Konis Mark Mensch Robin Mitchell Duo Wang Mehry Yazdanian The project team also included colleagues from other institutions and companies: John Carmody, University of Minnesota Michael Donn, Victoria University, New Zealand Kerry Haglund, University of Minnesota Maria Konstantoglou, University of Thessaly, Volos, Greece Byong-Chul Park, Sejong University, Seoul, Korea Greg Ward, Anyhere Software
iii
Please cite this report as follows:
Lee, E.S., S.E. Selkowitz, D.L. DiBartolomeo, J.H. Klems, R.D. Clear, K. Konis, R. Hitchcock, M. Yazdanian, R. Mitchell, M. Konstantoglou. 2009. High Performance Building Façade Solutions. California Energy Commission, PIER. Project number CEC-500-06-041.
Preface The Public Interest Energy Research (PIER) Program supports public interest energy research and development that will help improve the quality of life in California by bringing environmentally safe, affordable, and reliable energy services and products to the marketplace.

iv
The PIER Program, managed by the California Energy Commission (Energy Commission) conducts public interest research, development, and demonstration (RD&D) projects to benefit the electricity and natural gas ratepayers in California. The Energy Commission awards up to $62 million annually in electricity-related RD&D, and up to $12 million annually for natural gas RD&D.
The PIER program strives to conduct the most promising public interest energy research by partnering with RD&D organizations, including individuals, businesses, utilities, and public or private research institutions.
PIER funding efforts are focused on the following RD&D program areas: Buildings End-Use Energy Efficiency Industrial/Agricultural/Water End-Use Energy Efficiency Renewable Energy Technologies Environmentally Preferred Advanced Generation Energy-Related Environmental Research Energy Systems Integration High Performance Building Façade Solutions is the final report for the High Performance Building Façade Solutions project, contract number 500-06-041, conducted by the Lawrence Berkeley National Laboratory, Berkeley, CA. The information from this project contributes to the PIER Building End-Use Energy Efficiency program.
For more information on the PIER Program, please visit the Energy Commission’s Web site at www.energy.ca.gov/pier or contact the Energy Commission at (916) 654-5164.

v
Table of Contents Preface ................................................................................................................................................. iii Table of Contents ................................................................................................................................v List of Figures ...................................................................................................................................... vi List of Tables........................................................................................................................................ viii Abstract ................................................................................................................................................ ix Executive Summary............................................................................................................................ 1 1.0 Introduction .......................................................................................................................... 22
1.1. Background and Overview ........................................................................................... 22 1.2. Project Objectives ............................................................................................................ 25
2.0 Project Method...................................................................................................................... 27 2.1. High Performance Façade System Design and Engineering .................................... 27
2.1.1. Description of Shading Systems .............................................................................. 27 2.1.2. Experimental Method ............................................................................................... 39
2.2. Tools for High Performance Façade Systems ............................................................. 49 2.3. Market Connections........................................................................................................ 50
3.0 Project Outcomes.................................................................................................................. 51 3.1. Full-scale Field Testing of Interior and Exterior Shading Systems.......................... 51
3.1.1. Interior Shading Systems.......................................................................................... 51 3.1.2. Exterior Shading Systems ......................................................................................... 64 3.1.3. Systems Engineering ................................................................................................. 77 3.1.4. Summary Findings .................................................................................................... 85
3.2. Simulation Tools ............................................................................................................. 93 3.2.1. Schematic Design Tools for Facades using EnergyPlus....................................... 93 3.2.2. Simulating Complex Fenestration Systems (CFS) with Radiance and EnergyPlus
...................................................................................................................................... 96 3.3. Market Connections........................................................................................................ 99
4.0 Conclusions and Recommendations ................................................................................. 108 5.0 References.............................................................................................................................. 114 Glossary and Abbreviations.............................................................................................................. 116 Glossary................................................................................................................................................ 116 Abbreviations ...................................................................................................................................... 116

vi
List of Figures Figure 1: Members of the Project Advisory Committee outside the LBNL Windows Testbed
Facility. .................................................................................................................................................6
Figure 2: Photographs of interior shading devices (slat angles are not the same in all the photographs). ....................................................................................................................................30
Figure 3: Interior and exterior photographs of exterior shading devices. VB-E2n (interior) image shows the upper and lower blinds in a fully raised position – note that the header of the lower blind blocked a small portion of the lower window..................................................34
Figure 4: Vertical cross-section view of exterior Venetian blind (VB-E1n). Dimensions are given in millimeters.....................................................................................................................................35
Figure 5: Vertical cross-section view of exterior Venetian blind (VB-E3opt). Dimensions are given in millimeters. .........................................................................................................................38
Figure 6: Exterior view of the LBNL Windows Testbed Facility with the VB-E1n and VB-E3opt systems installed on the left and middle test chamber windows, respectively. The reference case with an interior Venetian blind (reference-VB) is on the right-most chamber window..............................................................................................................................................................39
Figure 7: Floor plan of the LBNL Windows Testbed Facility.............................................................40
Figure 8: Schematic of HVAC system in the LBNL Windows Testbed Facility ..............................43
Figure 9: Typical Nikon990 setup for LDR image acquisition with adjacent vertical illuminance sensor (left). View of test room showing window-facing and VDT-facing camera orientation (right)..............................................................................................................................46
Figure 10: The average luminance for each of the above zones was computed from each HDR image using a bitmap mask (VDT-view).......................................................................................48
Figure 11: Interior shading: Daily lighting energy use (Wh) per test condition for the 6:00-18:00 period..................................................................................................................................................54
Figure 12: Interior shading: Daily cooling load due to solar and thermal heat gains through the window (kWh) over the 6:00-18:00 period....................................................................................55
Figure 13: Interior shading: Peak cooling load due to solar and thermal heat gains through the window (W). ......................................................................................................................................56
Figure 14: Interior shading: Summary of observed luminance values during clear sky conditions for each region indicated. Luminance values are the average luminance across the entire region. ...............................................................................................................................59
Figure 15: (Left) Falsecolor image of the auto-split-mir-VB system retracted during bright (> 3000 cd/m2) overcast sky conditions, 11:47 AM, February 20, 2008 and (Right) during dynamic sky conditions shortly afterwards at 12:07 PM. The falsecolor luminance scale was capped at 3000 cd/m2 so yellow regions indicate values that are greater than or equal to 3000 cd/m2. ........................................................................................................................................61

vii
Figure 16: Left: Automated split optical Venetian blind (auto-split-mir-VB). Right: reference Venetian blind (reference-VB). February 4, 10:02 AM. Falsecolor luminance threshold (yellow) ! 3000 cd/m2. .....................................................................................................................62
Figure 17: Summary of 5-minute Daylight Glare Index data for all paired comparisons during “clear” days. N = 23 days. ...............................................................................................................62
Figure 18: Weighted DGI values of paired comparisons for all sky conditions over 6-month period. Vertical lines indicate when seasonal adjustments of slat blocking angle were made..............................................................................................................................................................62
Figure 19: Interior shading: Visual comfort performance (window view) for test condition (y-axis) versus reference condition (x-axis) for all sky conditions. ................................................63
Figure 20: Exterior shading: Daily lighting energy use (Wh) per test condition for the 6:00-18:00 period..................................................................................................................................................68
Figure 21: Exterior shading: Daily cooling load due to solar and thermal heat gains through the window (kWh) over the 6:00-18:00 period....................................................................................69
Figure 22: Exterior shading: Peak cooling load due to solar and thermal heat gains through the window (W). ......................................................................................................................................70
Figure 23: Exterior shading: Summary of observed luminance values during clear sky conditions for each region indicated. Luminance values are the average luminance across the entire region indicated in white. ..............................................................................................72
Figure 24: Left: (VB-E3opt), right: reference interior Venetian blind (ref-VB). March 22, 10:02 solar time, “clear” sky conditions. Falsecolor luminance threshold (yellow) ! 3000 cd/m2. 74
Figure 25: Summary of 5-minute Daylight Glare Index calculations for all paired comparisons during “clear” days. N = 19 days. ..................................................................................................74
Figure 26: Weighted DGI values of paired comparisons for all sky conditions over the two 6-month test periods. Vertical lines indicate the dates of seasonal adjustment of blocking angle for the ref-VB only. The blocking angle for each section of the VB-E3opt was fixed in the same position for both test periods. ........................................................................................74
Figure 27: Exterior shading: Visual comfort performance (window-view) for test condition (y-axis) vs. reference condition (x-axis) for all sky conditions. .......................................................75
Figure 28: Exterior shading: Visual comfort performance (window-view) for test condition (y-axis) vs. reference condition (x-axis) for all sky conditions. .......................................................76
Figure 29: Views of header (below hoist beam), top of slat, and underside of slats.......................80
Figure 30: Views of lower hem bar (left) and header (right) mounted on the hoist system..........83
Figure 31: The main screen of COMFEN 2.2 allows comparison of four different façade designs..............................................................................................................................................................94
Figure 32: COMFEN 3 will have a new interface based on the Adobe Flash software. .................95
viii
Figure 33: Example output from the on-line Façade Design Tool. ....................................................96
Figure 34: Falsecolor luminance maps generated using the Radiance mkillum tool with and without the use of BSDF data (images a-c). Falsecolor luminance image taken in the LBNL Windows Testbed Facility (image d). ............................................................................................98
Figure 35: Nova Science crew setting up at LBNL Windows Testbed Facility.............................107
List of Tables
Table 1: Monitored Performance of Innovative Shading Systems ......................................................7
Table 2: Description of Venetian Blind Systems...................................................................................31
Table 3: Operation of Venetian Blind Systems .....................................................................................32
Table 4: Performance Data for Interior Shading Systems ...................................................................53
Table 5: Region Luminance Data for VDT Views; Interior Shading Systems..................................60
Table 6: Performance Data for Exterior Shading Systems ..................................................................67
Table 7: Region Luminance Data for VDT View; Exterior Shading Systems...................................73

ix
Abstract Building facades directly influence heating and cooling loads and indirectly influence lighting loads when daylighting is considered, and are therefore a major determinant of annual energy use and peak electric demand. Facades also significantly influence occupant comfort and satisfaction, making the design optimization challenge more complex than many other building systems.
This work focused on addressing significant near-term opportunities to reduce energy use in California commercial building stock by a) targeting voluntary, design-based opportunities derived from the use of better design guidelines and tools, and b) developing and deploying more efficient glazings, shading systems, daylighting systems, façade systems and integrated controls.
This two-year project, supported by the California Energy Commission PIER program and the US Department of Energy, initiated a collaborative effort between The Lawrence Berkeley National Laboratory (LBNL) and major stakeholders in the facades industry to develop, evaluate, and accelerate market deployment of emerging, high-performance, integrated façade solutions. The LBNL Windows Testbed Facility acted as the primary catalyst and mediator on both sides of the building industry supply-user business transaction by a) aiding component suppliers to create and optimize cost effective, integrated systems that work, and b) demonstrating and verifying to the owner, designer, and specifier community that these integrated systems reliably deliver required energy performance. An industry consortium was initiated amongst approximately seventy disparate stakeholders, who unlike the HVAC or lighting industry, has no single representative, multi-disciplinary body or organized means of communicating and collaborating. The consortium provided guidance on the project and more importantly, began to mutually work out and agree on the goals, criteria, and pathways needed to attain the ambitious net zero energy goals defined by California and the US.
A collaborative test, monitoring, and reporting protocol was also formulated via the Windows Testbed Facility in collaboration with industry partners, transitioning industry to focus on the importance of expecting measured performance to consistently achieve design performance expectations. The facility enables accurate quantification of energy use, peak demand, and occupant comfort impacts of synergistic facade-lighting-HVAC systems on an apples-to-apples comparative basis and its data can be used to verify results from simulations.
Emerging interior and exterior shading technologies were investigated as potential near-term, low-cost solutions with potential broad applicability in both new and retrofit construction. Commercially-available and prototype technologies were developed, tested, and evaluated. Full-scale, monitored field tests were conducted over solstice-to-solstice periods to thoroughly evaluate the technologies, uncover potential risks associated with an unknown, and quantify performance benefits. Exterior shading systems were found to yield net zero energy levels of performance in a sunny climate and significant reductions in summer peak demand. Automated interior shading systems were found to yield significant daylighting and comfort-related benefits.
In support of an integrated design process, a PC-based commercial fenestration (COMFEN) software package, based on EnergyPlus, was developed that enables architects and engineers to
x
quickly assess and compare the performance of innovative façade technologies in the early sketch or schematic design phase. This tool is publicly available for free and will continue to improve in terms of features and accuracy. Other work was conducted to develop simulation tools to model the performance of any arbitrary complex fenestration system such as common Venetian blinds, fabric roller shades as well as more exotic innovative façade systems such as optical louver systems.
The principle mode of technology transfer was to address the key market barriers associated with lack of information and facile simulation tools for early decisionmaking. The third party data generated by the field tests and simulation data provided by the COMFEN tool enables utilities to now move forward toward incentivizing these technologies in the marketplace.
Keywords: windows, facades, daylighting, solar control, energy efficiency, peak demand, visual comfort, buildings,
1
Executive Summary Introduction
Glazing and façade systems have very large impacts on all aspects of commercial building performance in California and the U.S. They directly influence peak heating and cooling loads, and indirectly influence lighting loads when daylighting is considered. In addition to being a major determinant of annual energy use, they can have significant impacts on peak cooling system sizing, electric load shape, and peak electric demand. Because they are prominent architectural and design elements and because they influence occupant preference, satisfaction and comfort, the design optimization challenge is more complex than with many other building systems.
The opportunities for improved design and technology leading to reduced energy use have been successfully pursued in California in recent years at two ends of the spectrum of performance and cost: first, by mandatory requirements as embodied in Title 24 and second, by emerging Research and Development (R&D) results.
In terms of mandatory codes and standards, with each new cycle of Title 24, there is an incremental tightening of the requirements for thermal properties, National Fenestration Rating Council (NFRC) ratings and skylight use, based on what is proven and cost effective in the marketplace at that time.
At the research and long-term emerging technology end of the spectrum, a recently completed Public Interest Energy Research (PIER) R&D project co-sponsored with the U.S. Department of Energy (PIER contract #500-01-023) demonstrated that large savings are possible when emerging switchable electrochromic glass technology is used in an appropriate architectural design and coupled to advanced, integrated controls. However, given the current cost of these systems and the slow pace of market evolution, it will be many years before promising technologies such as electrochromic glazings will have major market and energy impacts in California. The fundamental performance issues addressed in the electrochromics study still represent a key opportunity for California buildings to significantly reduce energy and demand if cooling and daylighting can be managed and optimized.
This phase of fenestration R&D focused on the significant untapped near-term opportunity to capture large savings in the California commercial building stock by:
! Targeting voluntary, design-based opportunities derived from the use of better design guidelines and tools. High-performance façades minimize lighting energy use through the admission of useful daylight without adversely increasing HVAC cooling loads. Innovative façades can also enable A/E teams to reach net zero energy goals by enabling use of low-energy cooling strategies such as natural ventilation and radiant cooling. To achieve this level of high performance on a routine basis across a broad spectrum of commercial buildings, easy to use, early schematic design tools targeted toward architects based on accurate, sophisticated building energy simulation engines will be critical.
! Developing and deploying more efficient glazings, shading systems, daylighting systems, façade systems and integrated controls. On the R&D end of the spectrum, there are a wide variety of innovative façade technologies on the market or emerging into the market that could deliver

2
potentially significant energy savings. The difficulty with promoting or accelerating market adoption of new, innovative technologies is lack of data or validation that quantitatively demonstrates the performance benefits of the technology and identifies the risks associated with use of the technology. Thorough vetting of a technology is a critical step prior to widespread promotion of an emerging technology through utility rebate or incentive programs, state energy-efficiency programs, and ultimately energy codes and standards. Full-scale testing of a technology in a realistic setting enables accurate evaluation of not only energy-efficiency impacts on lighting energy use and thermal loads but also more importantly, systematic evaluation of occupant comfort, satisfaction and acceptance issues associated with the technology and resultant indoor environment.
Using these two fundamental approaches, this project focused on developing and bringing to market, innovative façade technologies with significant potential for increased energy efficiency in buildings beyond applicable standards. As such, this work benefits electric utility customers (Public Resources Code 25620.1.(b)(2)), (Chapter 512, Statues of 2006)) and supports California’s goal to implement actions outlined in the Governor’s Green Buildings Action Plan to improve building performance and reduce grid-based electrical energy purchases in all State and commercial buildings by 20 percent by 2015 per the Energy Action Plan 2005.
Background
Conventional versus High-Performance Façade Design
The potential energy use and demand savings resulting from more informed decision-making when designing the façade of commercial buildings is significant. If one looks into the existing practice of façade design, the synergistic impacts of the façade on lighting and HVAC energy use is rarely understood and optimized in the early stages of design when fundamental and often irrevocable design decisions are being made. Even in the case of retrofitting existing buildings, recognition of and deliberate planning towards optimized whole building performance can lead to increased energy-efficiency over the life of the building.
The baseline condition for façade design is the Title-24 window system “solutions” where window area is restricted and the properties of the window (Solar Heat Gain Coefficient and U-factor) are prescribed by orientation. Overhangs and fins are given credit as static projection factors (which can enable greater window area). Using the Title-24 performance-based compliance method, Architects/ Engineers (A/Es) have the opportunity to consider a broader range of design options as long as they stay within the mandated energy budget. Interior shades are not included in the computation. With automated shades, manual user override is disallowed if credit is to be taken with Title-24. Energy credits for daylighting controls are implicit in mandated manually-operated, on-off, bi-level switching requirements in some space types irrespective of window condition.
A/Es typically design the façade in the early schematic design phase with little knowledge of the impacts of their design on energy, peak demand, and comfort, let alone Title-24 compliance. The architect may create a rough 3-D model of the building mass and immediate surroundings to quickly study solar shading, then apply shading elements according to rules-of-thumb knowledge of sun control and their sense of aesthetics. The mechanical engineer, if on board,
3
conducts basic design and sizing calculations to check plant and system capacity. Whole building energy simulations are not done to understand the relative importance of façade-lighting-heating, ventilating and air conditioning (HVAC) interactions and impacts. No optimization is done to achieve the best balance between the three systems. The architect then proceeds to design development to finalize the details of the façade, often with little additional supporting data. Thereafter, the façade design is essentially complete, requiring only minor adjustments to the glass choice in the construction documents phase. During the construction phase or upon occupancy, the building owner or tenants will select interior shading based on aesthetics, maintenance, and other utilitarian requirements. The electric lighting and HVAC systems will comply with the base building specification.
Because the façades industry is highly fragmented and diverse, manufacturers have very little ability to significantly affect this process early on. They can offer possible “fixes” to perceived problems. Some offer tailored simulation tools to enable architects to visualize differences between one product and another (e.g., HunterDouglas’ daylight tool). Images from case study buildings are often provided so that clients can understand the pros/cons of various systems, but these are often a marketing pitch for a particular product.
More and more, leading-edge innovators in the A/E industry are recognizing the significant energy savings potential of designing the façade as a synergistic component of a whole building system and adopting new methods of practice to leverage this opportunity, particularly if energy-efficiency goals are aggressive. High-performance façades minimize lighting energy use through the admission of useful daylight without adversely increasing HVAC cooling loads. Innovative façades can also enable A/E teams to reach net zero energy goals by enabling use of low-energy cooling strategies such as natural ventilation and radiant cooling. To achieve this level of high performance on a routine basis across a broad spectrum of commercial buildings, easy to use, early schematic design tools targeted toward architects based on accurate, sophisticated building energy simulation engines will be critical.
Innovative, Emerging Façade Technologies
On the R&D end of the spectrum, there are a wide variety of innovative façade technologies on the market or emerging into the market that could deliver potentially significant energy savings. The difficulty with promoting or accelerating market adoption of new, innovative technologies is two-fold:
a) the inventor’s or manufacturer’s product may have been developed to effectively address a specific aspect of building performance given their particular area of expertise or market interest but may not fully address other critical performance factors, and
b) the architect, facility manager, or building owner does not have the resources to thoroughly investigate a new product and is unwilling to take on the risk of specifying a product without knowing more about the technology beforehand.
For achieving energy-efficiency objectives, the difficulty is sorting out manufacturer’s claims and determining performance impacts, positive or negative, within the typically short amount of time allocated for the schematic design phase of the project. There is no readily available single source of third party information that provides architects and engineers with apples-to-apples comparative data on how one system will perform either in absolute terms or relative to

4
another. Simulation tools enable A/E teams to compare systems and understand energy trade-offs for façade solutions in specific building designs, but these tools are often limited in modeling capabilities, particularly for dynamic systems and emerging technologies, or are time-consuming and complex to learn and operate, providing only a small part of the broad range of information required for confident decision making. To make the matter more complex, the tools and information needed will vary widely with the training and skill of the decision maker and the design stage in which the decision is made.
To address this need, a broad information and decision support strategy was created and new elements have been implemented. As a basic information resource, a book was produced by University of Minnesota and the Lawrence Berkeley National Laboratory (LBNL) that reviewed commercially-available and emerging façade technologies and provided design guidance and limited data on lighting, HVAC, and comfort performance impacts of integrated daylighting design (see http://www.commercialwindows.org/). A source book on daylighting technologies was assembled by the International Energy Agency SHC Task 21/ ECBCS Annex 29 team of international researchers including LBNL that described and then assessed a wide variety of solar control and daylight enhancement technologies using full-scale field tests with a consistent field test method to compare daylight output from the technologies (see http://gaia.lbl.gov/iea21/). A Southern California Edison (SCE)-funded LBNL scoping study, with cost-share from PIER and DOE, also explained the concepts and use of a variety of façade technologies available on the market (see PIER report CEC-500-2006-052-AT15 and http://gaia.lbl.gov/hpbf/). Utilities continue to provide hands-on mockups of innovative technologies in publicly accessible centers (e.g. SCE’s Customer Technology Application Center and Pacific Gas and Electric’s Pacific Energy Center) and to conduct showcase demonstrations as product offerings evolve but performance data are also limited.
Manufacturers are typically interested in collaborating with publicly- or utility-funded programs that have the potential to raise consumer awareness and accelerate market deployment of their innovations. This interest can be leveraged to accelerate the process if the market pull of large owners can be harnessed as part of this process. A full-scale daylighting field test of automated shading and digitally addressable daylighting controls for the 1.2 Mft2, 52-story New York Times Headquarters Building in Manhattan led to significant improvements to two existing technologies that have been commercially available for decades. The demonstration project required improved functionality and resulted in investments in R&D that resulted in a higher performing system and at lower cost as a result of collaboration between LBNL, the building owner, manufacturers, and A/E consultants. Market demand for these products increased sharply after The Times installed the technologies. Motorized shading systems which five years ago simply implemented solar control (“block direct sunlight”) are now demonstrating more sophisticated performance (“improve daylight utilization” and “reduce glare”) in part due to the competitive marketplace generated by The New York Times project (http://windows.lbl.gov/comm_perf/newyorktimes.htm) and other projects.
Purpose
The primary objective of this phase of work was to address the two above critical needs:
a) provision of tools that enable timely, accurate, performance-based decisionmaking in the early stages of design, and
5
b) provision of third-party performance data that thoroughly evaluates the impacts of emerging façade technologies on building energy use, peak demand, and occupant comfort.
These needs address both the market push (innovation) and pull (demand) side of the problem, making it more likely that ambitious energy-efficiency goals will be achieved broadly and in a more timely fashion.
The focus of this work was on near-term, commercially available technologies due to the significant rise in public awareness and acceptance of the ramifications of increased greenhouse gas emissions and the subsequent accelerated demand for energy-efficiency products that could be used cost-effectively in buildings today. Prototype technologies were also developed and evaluated.
The project focused on vertical windows and curtain walls since they are elements of virtually all buildings and because prior research and design work, as well as new Title 24 standards, have addressed many of the issues related to skylight applications. Within the scope of building façades it addressed the full range of fenestration solutions ranging from punched holes in low-rise tilt up construction to all façades in high rise curtain walls. As such it will be applicable to most of the commercial stock in California.
The commercial building markets in California are diverse in terms of business goals, available resources, interest in maximizing energy savings, and tolerance for risk. This activity was designed to address the differing needs of these different market sectors. It was also designed to support manufacturers who want to develop and sell innovative new products, designers who need reliable tools and data to meet client and the Energy Commission energy efficiency and demand goals, and owners who expect energy efficiency investments to deliver reliable, cost effective savings. The program is targeted initially at early adopters (designers and owners) in the building industry, with the potential to spread rapidly to mainstream applications via utility programs, voluntary programs such as LEED ratings and ultimately building standards.
Project Outcomes
This two-year project, supported by the California Energy Commission and the US Department of Energy, initiated a collaborative effort between LBNL and major stakeholders in the facades industry to develop, evaluate, and accelerate market deployment of emerging, high-performance, integrated façade solutions. The LBNL Windows Testbed Facility acted as the primary catalyst and mediator on both sides of the building industry supply-user business transaction by a) aiding component suppliers to create and optimize cost effective, integrated systems that work, and b) demonstrating and verifying to the owner, designer, and specifier community that these integrated systems reliably deliver required energy performance. An industry consortium was initiated amongst approximately seventy disparate stakeholders (Figure 0), who unlike the HVAC or lighting industry, has no single representative, multi-disciplinary body or organized means of communicating and collaborating. The consortium provided guidance on the project and more importantly, began to mutually work out and agree on the goals, criteria, and pathways needed to attain the ambitious net zero energy goals defined by California and the US.

6
Figure 1: Members of the Project Advisory Committee outside the LBNL Windows Testbed Facility.
A collaborative test, monitoring, and reporting protocol was also formulated via the Windows Testbed Facility in collaboration with industry partners, transitioning industry to focus on the importance of expecting measured performance to consistently achieve design performance expectations. The facility enables accurate quantification of energy use, peak demand, and occupant comfort impacts of synergistic facade-lighting-HVAC systems on an apples-to-apples comparative basis and its data can be used to verify results from simulations.
The protocol was applied to near-term commercially-available technologies: interior and exterior shading systems, which have significant potential due to their low cost and broad applicability in new and retrofit construction. Full-scale, monitored field tests were conducted over solstice-to-solstice periods to thoroughly evaluate the technologies. Technology transfer was accomplished through partnerships with industry and by addressing critical market barriers associated with lack of data, information, and tools. This work has paved the way towards utilities being able to implement rebate and incentive programs throughout California.
A. Field Test of Interior Shading Systems
Interior shading systems have broad potential applicability in the near-term to new and retrofit construction because of their low to moderate cost. Their performance was evaluated for commercial building applications but the lessons learned can be extended to residential applications as well.
Six innovative interior shading systems were evaluated in a full-scale field test mockup of a south-facing private office in the predominantly sunny, moderate climate of Berkeley, California. The focus of the assessment was to determine whether significant lighting energy savings could be preserved when visual discomfort due to high window luminance levels were mitigated with interior shading systems. In general, large-area, transparent windows can admit sufficient quantities of daylight over all types of sky conditions and hours of the day, so inherently yields higher daylighting potential over its 30-50 year life than dark tinted windows.
7
Such a design however fails to provide sufficient control of direct sun and discomfort glare, particularly for self-luminous computer-based tasks, and thus results in loss of view and lighting energy savings since occupants tend to lower conventional shades year round.
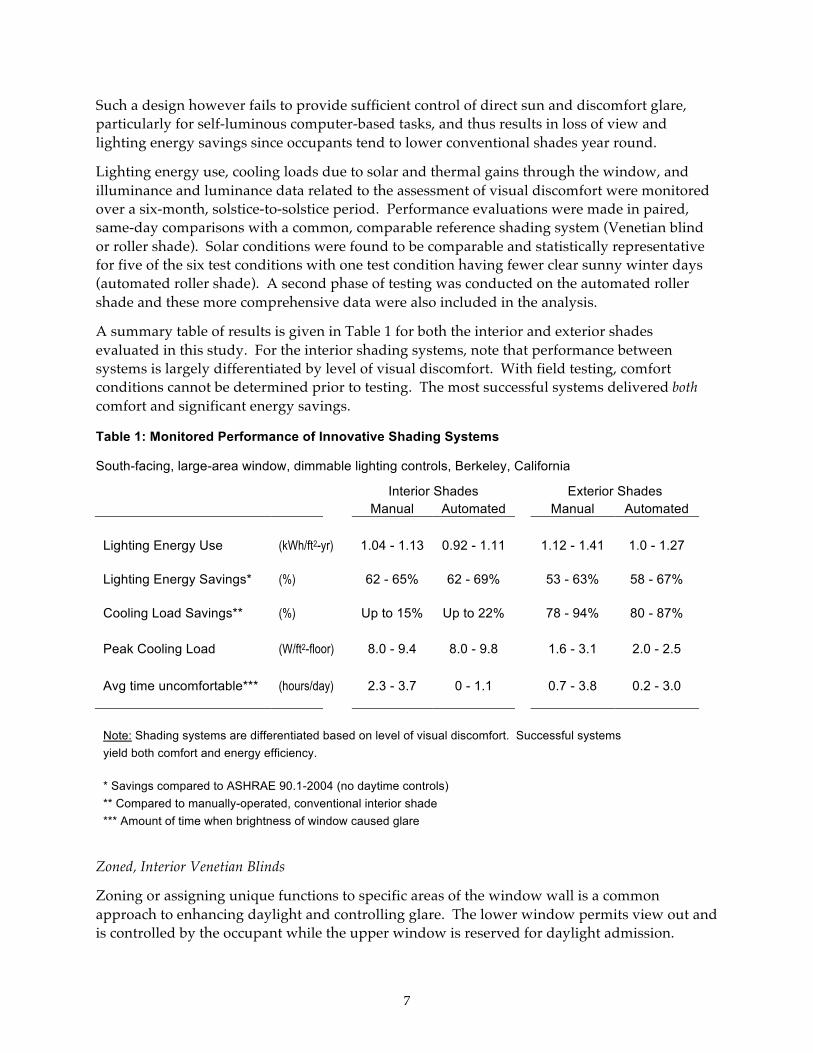
Lighting energy use, cooling loads due to solar and thermal gains through the window, and illuminance and luminance data related to the assessment of visual discomfort were monitored over a six-month, solstice-to-solstice period. Performance evaluations were made in paired, same-day comparisons with a common, comparable reference shading system (Venetian blind or roller shade). Solar conditions were found to be comparable and statistically representative for five of the six test conditions with one test condition having fewer clear sunny winter days (automated roller shade). A second phase of testing was conducted on the automated roller shade and these more comprehensive data were also included in the analysis.
A summary table of results is given in Table 1 for both the interior and exterior shades evaluated in this study. For the interior shading systems, note that performance between systems is largely differentiated by level of visual discomfort. With field testing, comfort conditions cannot be determined prior to testing. The most successful systems delivered both comfort and significant energy savings.
Table 1: Monitored Performance of Innovative Shading Systems
South-facing, large-area window, dimmable lighting controls, Berkeley, California
Interior Shades Exterior Shades Manual Automated Manual Automated Lighting Energy Use (kWh/ft2-yr) 1.04 - 1.13 0.92 - 1.11 1.12 - 1.41 1.0 - 1.27 Lighting Energy Savings* (%) 62 - 65% 62 - 69% 53 - 63% 58 - 67% Cooling Load Savings** (%) Up to 15% Up to 22% 78 - 94% 80 - 87% Peak Cooling Load (W/ft2-floor) 8.0 - 9.4 8.0 - 9.8 1.6 - 3.1 2.0 - 2.5 Avg time uncomfortable*** (hours/day) 2.3 - 3.7 0 - 1.1 0.7 - 3.8 0.2 - 3.0 Note: Shading systems are differentiated based on level of visual discomfort. Successful systems yield both comfort and energy efficiency. * Savings compared to ASHRAE 90.1-2004 (no daytime controls) ** Compared to manually-operated, conventional interior shade *** Amount of time when brightness of window caused glare
Zoned, Interior Venetian Blinds
Zoning or assigning unique functions to specific areas of the window wall is a common approach to enhancing daylight and controlling glare. The lower window permits view out and is controlled by the occupant while the upper window is reserved for daylight admission.

8
Zoned, interior Venetian blind systems can provide such functions. The lowest-cost solution is a conventional blind where the slat angles of the upper and lower sections differ and are ganged to move together (dependent relationship). A variant of this is to use two separately mounted blinds so that the slats can be controlled independently; the system tested in this case used slats with a prismatic surface treatment and concave-up geometry to produce a more useful daylight distribution within the room interior. For the field test, both systems were seasonally adjusted to block direct sun to emulate typical office occupants who adjust their shades once to reduce discomfort, then rarely adjust their shades for weeks or even months thereafter (behavior characterized in other field tests).
Both solutions produced significant lighting energy savings – 62-65% savings on average for a 12-h day over the monitored period compared to the full installed load given a large-area transparent, but failed to minimize visual discomfort. The bright window created an unacceptably high luminance contrast with the computer or video display terminal (VDT) task (200 cd/m2) for a significant fraction of the day. Under clear sky conditions, the level and duration of exceedance were worse for specific regions of the window when facing the sidewall. Window cooling loads were minimally increased: 1-3%. Peak window cooling loads were increased by 8% with the conventional zoned blind and were decreased by 2% with the optical blind. Lighting energy use savings are likely to be decreased while cooling load savings are likely to be increased if discomfort is minimized.
The zoned, conventional blind itself was simple and practical and is likely to have a small incremental cost over a conventional blind. The resultant room cavity luminance distribution was pleasing and comfortable when conditions were sunny outdoors. This type of system can be promoted to enhance daylighting but actual energy savings will be subject to the occupant. Informed use would likely improve savings. The likely higher cost of the optical zoned blind, both materials and installation, are harder to justify. Localized specular reflections off the lower prismatic surface increased visual discomfort under sunny conditions.
Translucent Clerestory Windows
Use of translucent glazings or panels in the upper area of the window produced similar results as the zoned blind systems. The translucent panel system tested was said to produce a near Lambertian or hemispherical output distribution and so had the potential to distribute incoming daylight to the ceiling as well as the floor with less discomfort glare compared to conventional acid-etched or fritted glass. Lighting energy savings were comparable to the zoned blind systems (65% savings) but the whole window luminance exceeded the 2000 cd/m2 limit on average 30% of the day over the six-month monitored period. The translucent panel reduced the overall visible transmittance to a low value (Tv=0.29). Lowering the transmittance further to reduce glare would restrict daylight and potential lighting energy savings. The transmittance must be determined prior to permanent installation (20-30 year life) and if inadequately scaled, could require an additional interior shade to reduce glare (and consequently daylight). The results for this system illustrate why translucent glazings, while simple and universal, should not be used in the near-view regions of the window wall in sunny climates. Use in high bay spaces like gymnasiums in overcast climates is typical for this type of window. Cooling loads were reduced by 15% and peak cooling loads were reduced by 14%.

9
Automated Shading Systems
Two motorized, automated, conventional interior shading systems were evaluated: a 3%-open roller shade with automated height adjustments and a conventional matte-white 2.54 cm (1-inch-) Venetian blind with automated slat angle adjustments. Both were controlled to exclude direct sun and restrict daylight levels to within a narrow setpoint range (570-670 lux) using a LBNL control system. The two systems produced 62-63% reductions in full lighting load. The automated blind reduced window cooling loads by 22% while the automated roller shade reduced loads by 9%. Peak cooling demand due to the window was reduced by 7-15%. Lighting energy use reductions were greatest during the summer, coinciding with peak summer demand (compared to the reference roller shade, which produces its greatest reduction in lighting energy use on sunny winter days in proportion to incident daylight).
A zoned, daylight-redirecting, automated blind system (auto-split-mir-VB1) was also evaluated. The blind used concave-up mirrored slats in the upper region to reflect direct sun to the ceiling plane and shiny white slats in the lower region. The upper and lower slats were ganged with dependent slat angles. The hardware was married to a control system provided by a partnering manufacturer, which provided automated solar exclusion, given a schedule of slat tilt angles. A scheduling function enabled use of a mid-day tilt angle that differed from the tilt angle used for the remainder of the day. When direct sun control was not needed (cloudy), the slats were set to a horizontal angle in the lower region of the blind. Lighting energy savings were 69% of full installed load, the highest level of savings of all six systems tested. Cooling loads were increased by 1% and peak cooling loads were increased by 7%.
All automated systems were distinguished from the static systems by their provision of visually comfortable conditions, thereby accomplishing the technical goal of optimizing daylight-glare trade-offs. The average whole window luminance of the automated roller shade (auto-RS) never exceeded the 2000 cd/m2 limit while the automated Venetian blind (auto-VB) exceeded the limit for less than 1% of the day over the monitored period. The auto-split-mir-VB1 exceeded the threshold for 9% of the day with an average luminance level of 2778 cd/m2 during the periods of exceedance. Analysis of discomfort glare using the more detailed high dynamic range (HDR) luminance dataset revealed that the automated retractable systems (auto-split-mir-VB1 and auto-RS) did however increase visual discomfort during cloudy and overcast sky conditions since the limit on control was not sufficiently conservative. Discomfort glare from the bright sky resulted when the shades were raised.
The motorized, automated roller shade is a mature technology and has a far larger market share in the U.S than motorized blinds. Motorized roller shades have been available on the market for 20-30 years. Encoded AC or DC tubular motors offer precise height adjustments. DC motors are quieter but tend to be more expensive than AC motors. The system tested was an encoded DC motorized product and delivered very quiet, smooth, and accurate height adjustments reliably over the course of the monitored period. Technical support and manufacturer responsiveness was excellent. Automation of these shades is a burgeoning capability: solar control was offered but not adopted by the market again over the past 20-30 years (<1% market penetration). More recently, manufacturers have significantly improved product offerings, in part in response to the large procurement made by The New York Times for their new Headquarters building in 2007 (Lee et al. 2005). This technology should be
10
promoted widely throughout the U.S. in medium- to large-scale commercial buildings, particularly in perimeter zones with open plan offices and dimmable lighting controls.
The automated Venetian blind technology is far less mature for different reasons, if low cost and broad applicability is the objective. Conventional, motorized Venetian blinds provide lift and tilt motion with the same motor so it is difficult to obtain precise, smooth movement without an encoded motor. AC or DC pulsed encoded motors can provide such function but are more expensive. The conventional automated Venetian blind used encoded DC motors but the coupling of the lift cords to the drive shaft broke within the first three to four months of use (the blind was large: one 3x2.74 m (10x9 ft) blind instead of two to minimize the cost of motorization). The optical, dual-zone blind used an unencoded, fixed speed AC motor so the quality of motion was noisy and abrupt; the control system, provided by an independent manufacturer, was not reliable nor well supported. Technical support and manufacturer responsiveness was quite poor. The optical blind is typically sold as a high-end product with a different motor controller and control system – this lower-end solution did not showcase the product in the best light. Automated interior Venetian blind systems can deliver potentially more significant cooling load reductions than automated roller shades but manufacturers will need to modify their product offerings to improve motorized performance.
B. Field Test of Exterior Shading Systems
Exterior shading systems provide a significant degree of solar control and can enable use of low-energy cooling strategies such as nighttime natural ventilation or radiant cooling to achieve very aggressive zero-energy goals. Coupling such systems with moderate to large-area transparent windows seems counter-intuitive: one can achieve the same reduction in thermal loads by simply downsizing the window and selecting a window with a low solar heat gain coefficient and U-value. Use of such systems, however, can enable use of daylight to offset lighting energy requirements and can be a near-term solution for overall very low energy use in both commercial and residential buildings.
A summary of results is given in Table 1 above. The most successful systems delivered both visual comfort and significant energy savings. All of the systems tested achieved energy efficiency levels that met the stringent requirements use of low-energy cooling systems and zero-energy buildings. Annual lighting energy use was 53-67% below ASHRAE 90.1-2004 code levels in all cases. Peak cooling load and cooling load reductions were very significant (71-94%) and absolute levels were sufficiently low to meet low-energy cooling performance requirements (< 4 W/ft2- in a 15-20 ft deep perimeter zone) despite the use of a very large-area, south-facing window.
Exterior Venetian Blinds
Four configurations of conventional exterior Venetian blinds were evaluated in a static or automated mode of operation and single- or dual-zone configuration. The modes of operation did not differ significantly because the fixed speed AC motor permitted only a few preset slat angles and the blind was never retracted unless conditions were too windy (>14 mps (31.3 miles/h). All blinds provided solar exclusion, but the slat angle in the upper section of the dual-zone blinds was set to a slightly more open angle to admit more daylight.
11
Lighting energy savings ranged from 58-63% of full installed load. Cooling loads were reduced by 78-94% in this sunny climate. Peak cooling loads were reduced from 108.7 W/m2-floor (10.1 W/ft2) for the reference condition to 17.2-33.2 W/m2-floor (1.6-3.1 W/ft2) in the 4.57 m (15 ft) deep perimeter zone. The first rule-of-thumb test for whether low-energy cooling strategies will be feasible is whether window loads can be maintained below 4 W/ft2-floor (assuming a perimeter zone depth of 4.57-6.1 m (15-20 ft)). These systems met this criterion.
The four conventional exterior blind systems however failed to sufficiently control window luminance to within acceptable levels for a significant fraction of the day: the 2000 cd/m2 limit was exceeded 22-32% of the day over the monitored period. To control glare and preserve daylight and views out, the underside of the slat can be specified with a lower surface reflectance (light gray paint), the visible transmittance of the window glazing could be lowered slightly, or an interior sheer drape or shade could be used in combination with the exterior blind. Alternatively, the exterior blind itself could be adjusted to a more closed position to further reduce solar heat gains and discomfort glare. Use of exterior blinds in the European Union (EU) to block direct sun during the summer is common, particularly in non-air-conditioned buildings. According to observations made by an EU engineer, occupants tend to learn how to operate a non-automated shading system “properly” after a few days of discomfort to achieve the best compromise between daylight, solar heat gain control, views out, and desired privacy. Automation provides more reliable control of summer heat gains.
The motorized exterior blind system executed reliable control and was well engineered. Technical support and response time were excellent and very informative. Although the timed AC motorized system limited slat angle adjustments to a few preset positions, the solution can be easily modified to provide a greater range of motion and more slat angles. The technology was practical, durable, and limited cost. An encoded AC motor would have provided more finessed control but would likely be less durable and more expensive.
This is a mature technology, provides net zero energy performance when coupled with the proper window design for daylighting, and is ready to be deployed widely throughout the U.S.
Static, Optical Exterior Louvered System
A three-zone, optical exterior blind was also evaluated. This system is meant to be positioned to a fixed angle and left for the remainder of the year. It can be manually adjusted or raised or lowered using a hand crank accessible either from the interior or exterior of the building. Vertical guide wires hold the system away from the façade to prevent movement in the wind. Like the static exterior blind, the system should be installed in locations with protection from high winds (typically low- to mid-rise construction).
The system yielded lighting energy savings of 53% due to daylighting compared to the full installed load. Cooling loads were reduced by 88% and peak cooling loads were reduced by 74%, resulting in peak levels of 28.0 W/m2-floor (2.6 W/ft2-floor). The slats were polished aluminum and so had a reflective appearance from the exterior.
The optical zoned blind and automated roller shade provided significantly better control of discomfort glare: whole window luminance levels facing the window exceeded the 2000 cd/m2 threshold 6% and 2%of the day, respectively, with minor levels of exceedance (2302 cd/m2 and
12
2374 cd/m2 average). The optical blind accomplished its control using a more closed slat angle throughout the year than the conventional blind and blocked direct views of the sky in the upper region.
For this limited test, this system is considerably simpler, delivered net zero energy performance when coupled with the proper window size and glazing type for daylighting, and delivered greater comfort compared to the automated exterior Venetian blinds. It is available through a single source in Germany but with little technical support. The technology is mature and should be considered for deployment throughout the U.S.
Automated Exterior Roller Shades
An automated exterior roller shade was evaluated. The system executed the prototype LBNL control algorithm which was designed to limit the depth of direct sun penetration into the space (0.91 m (3 ft) maximum depth) and maintain daylight levels within a threshold range, if there was sufficient daylight. This system yielded lighting energy savings of 67%, cooling load reductions of 80% and peak cooling load reductions of 76% (26.9 W/m2-floor, 2.5 W/ft2-floor).
The roller shade exerted control by using a densely woven shade (3%-open). The system failed to control luminance levels adequately under cloudy and overcast sky conditions because the shade was raised – the control threshold for raising the shade was set too high but could be modified to a lower value. Glare could be mitigated by modifying the control algorithm, lowering the visible transmittance of the window glazing, or having occupants use an interior sheer drape or shade in combination with the exterior roller shade to preserve daylight and views out.
The exterior roller shade used an encoded AC motor and its electronics was protected within the tubular motor housing. This enabled finer resolution and precise adjustments of height. Technical support was also excellent and very responsive.
This technology is mature and should be considered for widespread deployment throughout the U.S.
C. Software Tools
COMFEN
The COMmercial FENestration (COMFEN) tool was developed to support iterative analysis of integrated building systems with respect to energy efficiency and comfort impacts, enabling users to quickly visualize the trade-offs in performance as their designs evolve. The tool provides a simplified MS Excel-based user interface to the powerful but difficult to use EnergyPlus building energy simulation program and enables user-defined permutations on key variables in fenestration design.
The interface allows users to define up to four differently configured façade designs and then compare their performance. The user can define a single-zone space of arbitrary dimensions with up to four vertical windows on each façade. Façade design options include window orientation, size, placement on the façade, glazing and framing system, fixed exterior shading systems, automated interior, between-pane, and exterior roller shades and Venetian blinds, and stepped or continuous daylighting controls.

13
Annual simulations are performed on each façade design with a total computation time on a typical PC of less than one to two minutes. Analysis can be done for any location with an existing EnergyPlus weather file. All sixteen CEC weather zones were input into the Location Library.
Output data are graphically displayed side-by-side as bar or line charts for the four designs: annual energy use (total and component end uses), peak demand, CO2 emissions, daylight illuminance, daylight glare index (DGI), and percent people dissatisfied with the thermal environment. Monthly data are charted. The user can also input a date and obtain hourly daylight illuminance and DGI plots. The tool can be downloaded for free at the LBNL website: http://windows.lbl.gov/software/.
The tool continues to be updated with new features and capabilities. Debugging and validation of the tool are being conducted with input from beta users. The tool has been applied on several design projects in collaboration with architectural and engineering teams, with features added to support specific project requirements. The tool has also been introduced to architectural graduate students for use on design projects in a façade seminar.
On-line Façade Design Tool
An earlier on-line tool was developed in a previous project to provide data similar to that now produced by the COMFEN PC-based tool. This tool relied on a database of DOE-2 parametric simulations. In this project, a new database of EnergyPlus parametric simulations was created that expanded the range of design options. The tool enables side-by-side performance comparisons of four façade design scenarios for a small office or ranks design options based on user-specified design conditions (e.g., show all solutions for a north facing façade that yield the lowest energy use). This activity was conducted in collaboration with the University of Minnesota. The tool is publicly accessible at: http://www.commercialwindows.org/
Simulating Complex Fenestration Systems (CFS) with EnergyPlus and Radiance
This project provided synergistic support to a broad U.S. DOE-supported long-term activity to develop robust and reliable simulation tools that enable modeling of complex fenestration systems (CFS). CFS include products with light redirecting or scattering properties such as Venetian blind, roller shades, fritted glass, holographic glazings, mirrored louvers, laser cut panels, etc. EnergyPlus related activities focused on developing a technical plan to implement source code modifications to both the solar-optical and thermal calculations of window/ façade systems. For daylighting, the Radiance mkillum tool was expanded by Greg Ward, Anyhere Software, to accept Window 6 bi-directional transmittance and reflectance (or scattering) distribution function (BSDF) in an XML data format. The Radiance tool was validated in collaboration with Pennsylvania State University against ray-tracing simulations to verify that the code was error free and to quantify the errors associated with the entire workflow, including those associated with the base BSDF input data file. The tool is publicly available and has the capability to perform annual calculations within a reasonable amount of time. Trade-off analyses between accuracy and computation time were performed. The Radiance mkillum tool was incorporated within Window 6 to enable crude visualizations of daylight output from the systems defined in Window 6. Further development of these tools will continue.
14
D. Market Connections
This project galvanized a unique collaboration between stakeholders vested in the development and promotion of advanced facades. Prior to this CEC PIER- DOE project, there was no single means of vetting a façade technology or obtaining third party data on a technology, nor a reliable source or tool for modeling these innovative technologies. The project generated a critical dialog between manufacturers, the design community, and utilities on how to move forward toward high performance, energy-efficient, integrated façade solutions for net zero energy buildings where the obvious barriers of cost and complexity had typically hindered progress. The project also established methods or protocols for objective-based decisionmaking using field data at a time when the entire buildings industry is transitioning to a focus on measured performance in real buildings.
By bringing together manufacturers, architects, engineers, utilities, owners, and regulatory agencies, many members commented on the value of obtaining a broader view of goals, objectives, methods, and solutions outside of the typically limited domain of a component technology. The project advisory committee (PAC) consisted of approximately 70 high-level representatives from industry (e.g., Viracon, GSA, AIA, etc.). PAC meetings provided a unique opportunity for these stakeholders from disparate areas to discuss common challenges and possible solutions. The mandate by the California Public Utilities Commission (CPUC) to achieve net zero-energy buildings by 2030 generated additional interest and desire for coordinated action in an industry that is very much fragmented, resulting in widespread agreement within the Project Advisory Committee to recommend funding of future phases of this R&D project.
Several additional methods were used to obtain feedback and transfer the results of this project to industry: a) provision of data, information, and tools to industry as a means of laying the groundwork for utility rebate and incentive programs, ) b) collaboration with established methods of technology transfer via the California Emerging Technology Coordinating Council and the University of California (UC)/ California State University (CSU) Technology Demonstration program, c) collaboration with motivated owners or A/Es on showcase demonstrations, d) round table and one-on-one discussions with key stakeholders through Project Advisory Committee meetings, conferences, tours, and seminars, and e) information dissemination through publications, seminars, TV, radio, webinars, tours, and meetings.
Through discussions with LBNL and Heschong Mahone Group, Southern California Edison (SCE), a member of the ETCC, considered initiating a program to promote use of automated shading systems. Primary market barriers were identified via a HMG scoping study commissioned by SCE: a) high cost due to low production volumes, b) unfamiliarity of A/Es with product offerings, c) lack of adequate, simple design tools to estimate energy impacts, and d) lack of understanding on the part of the manufacturers of product benefits. Because of these factors, the SCE program was not initiated. Solicitations to collaborate with the ETCC and UC/CSU Technology Demonstration program were not successful due to the conservative criteria utilities placed on selecting which emerging technologies to promote.
The SCE study reinforced the critical need for the performance data and simulation tools developed in this project in order to more effectively quantify benefits and promote emerging façade technologies. The principle activity for market transfer in this project was to focus on

15
meeting these two critical needs. With the provision of these data and tools, the pathway to pilot demonstration projects and ultimately an established rebate and incentive program has been established and will be pursued in future phases of this work.
The research team provided design assistance and technical advice on many potential showcase demonstration projects. Meetings with the building owner, discussions with the A/E team, and limited building energy simulations led to the procurement of dimmable lighting controls for the perimeter zones of a high-rise office building in Manhattan. Another building owner committed to installing automated interior roller shades on forty floors of their high-rise building. Collaboration with a facility manager on a UC campus and a motivated A/E team has led to the inclusion of automated exterior shading on the façades of a new building; the project is currently in the design development phase.
Public awareness of this R&D was increased via popular press, educational seminars, conferences, meetings, hundreds of tours of the LBNL Windows Testbed facility, and publications.
A technology portfolio was produced that distills the lessons learned from working directly with and observing the performance of innovative façade technologies in the LBNL Windows Testbed Facility. The document was written for architects and engineers, utilities, and building owners who desire succinct, practical third-party information on the technical concepts and energy and comfort related performance of new façade technologies. The document will be expanded as future phases of field testing and simulations are performed on innovative façade technologies and systems.
A project website (http://lowenergyfacades.lbl.gov/) was also produced and launched for GreenBuild 2008 in combination with an afternoon seminar and facades educational booth. Like the technology portfolio, the website will continue to be updated as new information becomes available from future phases of this project.
Conclusions
At the conclusion of the project, there are a number of conflicting activities that characterize the industry:
1) Building energy-efficiency codes and standards are more aggressively targeting windows in commercial buildings using prescriptive-based measures. These codes (ASHRAE 90.1 and 189.1, California Title-24, LEED, International Green Construction Code, etc.) are considering mandating use of smaller-area windows (WWR!0.30 instead of WWR up to 0.45) with a very low solar heat gain coefficient for the glazing. Some require use of attached exterior shading and others place some limited minimum requirements on the visible transmittance of the window, usually as a light-to-heat-gain ratio (e.g., Tvis/SHGC of 1.5 or greater). Useful daylighting for lighting energy savings will be inherently limited by the design of these facades. Control of HVAC loads is the primary focus of these measures. These actions avoid addressing the complex trade-off synergistic impacts facades have on HVAC and lighting energy use, leaving potential greater energy-efficiency gains on the table so as to simplify practical implementation issues with integrated façade design.
16
2) For building owners who have the resources and intent to achieve net zero energy performance goals, the trend is in the opposite direction for typically new construction of commercial buildings. EU architects like Behnische Architects in collaboration with Transsolar use innovative façade and daylighting technologies in combination with building massing, an articulated façade design, and low-energy cooling strategies to attain more aggressive performance goals. These high-end buildings are able to specify larger windows to maintain high indoor environmental quality through connection to the outdoor with increased daylight, views, and occupant amenity. Such well-daylit buildings are also being promoted on the basis of possible increased productivity and health. In a separate CEC PIER project, the Heschong Mahone Group and the IESNA Daylighting Quality Metrics Subcommittee are working to define daylighting metrics that could be applied to LEED and Title-24 Standards. The activity is directed towards deriving practical metrics for a wide variety of commercial spaces by correlating subjective responses for real spaces to simulated data of the spaces. Such metrics accommodate the less tangible but equally important human factors for liveable spaces such as access to view and quality of a daylit space.
Measured performance data from this study illustrates how the latter method of integrated façade-lighting-HVAC design can be used to achieve the more aggressive net zero energy building and comfort goals in the near-term. Practical, commercially-available and emerging technologies were carefully monitored in a full-scale field test facility over a solstice-to-solstice period to quantify cooling load, lighting energy use, and comfort impacts and road test the technologies to judge market feasibility. The study was conducted in collaboration with industry so as to provide useful feedback for future product development. This research project generated enormous interest among utilities, manufacturers, and end-users. Further evaluations are planned for future phases of this research.
To meet the practical and growing demands of today’s market, two major categories of technologies were evaluated: interior and exterior shading devices.
Exterior shading systems
The field tests demonstrated that exterior Venetian blinds or roller shades can deliver energy and peak demand savings benefits at aggressive net zero-energy levels of performance. These systems are robust, fairly mature, and practical. Applicability is limited to low- to mid-rise buildings where local winds are of low velocity for the majority of the year: the systems must be retracted if winds exceed 30 miles per hour. These systems have been used throughout the EU over many decades in new and retrofit applications, in air-conditioned and non-conditioned buildings, and enable use of low-energy cooling strategies such as natural ventilation, radiant cooling, etc. Monitored data indicated that average daytime cooling loads due to the window could be reduced by 78-94% compared to conventional interior shading systems and peak cooling loads could be reduced by 71-84% or 17.2-33.2 W/m2-floor (1.6-3.1 W/ft2-floor) given a large-area, south-facing window in a 4.57 m (15 ft) deep perimeter zone in a sunny climate. Lighting energy use was 53-67% of ASHRAE 90.1-2004 prescribed levels.
Performance wise, the most significant challenge is how to control discomfort glare from the window and obtain useful daylight – two opposing performance objectives. Lighting energy use and visual comfort performance varied significantly depending on the design of the shading system and its operation. The automated exterior roller shade and an innovative zoned
17
static optical louver system exerted the greatest control over overall window luminance: the former due to an integrated prototype control algorithm, the latter due to the angle and geometry of the slats for this south-facing facade. Clearly the latter, without the need for automation, will have broader applicability because of its practical simplicity.
When specifying such systems, the design team must decide how best to control glare if needed – with the exterior blind itself or with a secondary interior shading system. The conventional exterior blind is best used to control solar heat gains whether automated or manually-operated on a seasonal basis. When coupled with a fairly large-area window with high visible transmittance, the energy-efficiency benefits of daylighting can be obtained if coupled with a manually-operated interior drape, scrim, or shade to cut the brightness of the sky or reflected sunlight off the exterior blinds. This has been done with interior blind systems in the Genzyme Building in Cambridge, Massachusetts and other EU buildings with self-reported occasional use – view is often more valued and glare well tolerated in these more overcast climates.
Interior shading systems
Field tests of interior shading devices indicated that automated shading systems hold significant potential for reducing energy and peak demand in perimeter zones. Interior shading systems can potentially be quickly and broadly deployed in both new and retrofit commercial buildings and have the potential to increase energy savings from daylighting potential in perimeter zones if discomfort glare due to the window can be adequately controlled. A solstice-to-solstice field test was conducted on a variety of interior shading devices, including automated motorized shading systems and split or zoned shading systems that subdivide the window into a lower view zone and an upper daylighting zone.
Static, zoned interior Venetian blind systems reduced discomfort glare from the window compared to conventional systems but yielded high luminance contrasts in its upper zone under sunny and partly cloudy conditions.
Automated, motorized interior shades provided more reliable performance, but at increased cost. Such systems have broad applicability throughout the U.S. in medium- to large-scale commercial buildings, particularly automated interior roller shades and dimmable lighting controls. Automated Venetian blinds and sunlight-redirecting mirrored louver systems deliver greater energy-efficiency but cost and complexity are market barriers toward widespread adoption that need to be resolved.
Measured data indicated that well designed automated systems can deliver significant reductions in lighting energy use and cooling and lighting peak demand and reliable control over discomfort glare for the majority of the time. The specific control algorithm used can significantly affect performance: the closed-loop integrated prototype control system developed by LBNL exerted greater control over interior daylight levels, peak cooling loads, and discomfort glare. Additional research is required to better understand the nature of occupant response to daylight and glare and then to develop technologies and algorithms to improve the control of window glare.
The sunlight-redirected interior motorized shading system was not showcased at its best potential since it was coupled with a low-end motor controller and control system as a potential solution for broader market applications. This mirrored concave-up slat system has the
18
potential to redirect sun to depths significantly greater than conventional depths of 15 ft from the window wall. Field tests of this and other sunlight redirecting systems are being planned for future work.
Commercially-available, motorized shading systems did vary significantly in quality, accuracy, and reliability, depending on the details of engineering, cost, and desired performance. Generally, tubular motorized systems that delivered only height adjustments, such as those used with interior and exterior roller shades, were less complex and generally more reliable than their Venetian blind counterparts, which had to deliver both height and slat angle control with a single motor. The control systems used for automation also varied considerably in terms of ease of use, reliability, and technical support. Additional work must be done to make the design, implementation, and commissioning of automated systems more turn-key. This is an emerging technology with several key demonstrations leading the efforts to increase market penetration (e.g., The New York Times Headquarters Building).
Switchable electrochromic glazing, evaluated in a prior phase of this CEC PIER project, offers mechanical simplicity without the wind, security, and other practical constraints of exterior shading. This technology continues to evolve, with existing and new U.S. manufacturers continuing to develop marketable, low-cost glazings with improved solar-optical properties and automated control systems. Such glazings will have broad applicability in all new and retrofit commercial buildings when high-volume manufacturing capabilities are brought on-line.
Simulation Tools to Support Market Deployment
To support the deployment of such technologies through performance-based design, the commercial fenestration (COMFEN) tool, which was developed in this project, puts a powerful capability into the hands of architects and engineers enabling quick, accurate, and comprehensive analysis of commercial building façade designs within a few minutes. The tool has a simple Excel-based user interface (software which most A/Es have in their office and are familiar with) that links to EnergyPlus and Window 6. The tool enables users to quickly visualize trade-offs in performance as their designs evolve. An analogous, web-based tool pulls data from a database of parametric EnergyPlus runs, providing similar functionality but with more limited and less flexible design options. Use of COMFEN on design assistance projects has provided insights as to how the tool could be better designed to meet the needs of those with ambitious ZEB performance goals. Development of this tool will continue in future phases of this work.
In a parallel activity, development of new simulation tools and associated data bases for modeling optically complex fenestration systems (CFS) is underway. All manufactured transparent glass in the world can be modeled and rated using Window 6, EnergyPlus, and Radiance simulation tools. All other façade technologies (Venetian blind, roller shades, fritted glass, angular-selective glazings, prismatic glazings, and other façade elements that produce non-specular output distributions of transmitted or reflected radiation) must be modeled using simplified methods with limited measured data. A new method was defined in prior research and work in this project focused on incorporating this method into simulation tools. These new tools (modules within EnergyPlus and Radiance) use bidirectional transmittance and reflectance or scattering distribution function (BSDF) data from Window 6 for any arbitrary window system (glass + shade combinations). The Radiance mkillum tool has been modified and

19
validated to accept such data. Continued development of BSDF-enabled Radiance tools is in progress. The new tools can perform annual computations in a fraction of the time it takes with conventional ray-tracing methods. Technical specifications for modifying EnergyPlus have been defined and work is in progress to reconcile the specifications with the existing legacy code.
Recommendations
This two-year research project represents an initial effort to address the critical needs of the buildings industry to have the tools and technological resources made available to more routinely and cost-effectively deliver high-performance façade solutions that optimize the complex trade-offs needed to meet aggressive energy, peak demand, daylighting, and comfort performance objectives.
This work, funded by CEC PIER and DOE, generated enormous interest amongst utilities, manufacturers, and end-users – the Project Advisory Committee consisted of 70 members, an afternoon seminar on advanced facades at GreenBuild 2008 had a total attendance of 1000 people, an ASHRAE Forum on Net Zero Energy Buldings was attended at standing room only levels, and solicitations for collaborations on technology R&D and demonstration projects were received by staff on an almost daily basis. Interest in energy-efficiency within California increased exponentially when the California Public Utilities Commission (CPUC) made a decision to adopt the California Long-Term Energy Efficiency Strategic Plan, which set a goal to achieve zero net energy in 100% of commercial construction by 2030 and 50% of existing construction by 2030.
In response to this increased interest, both CEC PIER and DOE have committed to a follow-on three-year phase of this work with significantly increased resources. This initial project established test methods and procedures, and gathered data necessary for designers and utilities to use in evaluating energy efficient glazing and façade systems and their components. Utilities are now beginning to take steps to integrate the findings into their Emerging Technology programs and are looking forward to continued project outcomes, given their more aggressive stance towards achieving ZEB goals. In future work, utilities will be able to finally implement an energy efficiency rebate for high performance glazing and façade systems.
In the short-term and as direct follow-on to the findings of this project, the following recommendations are made:
– Static and automated exterior shading systems should be widely promoted in California and in regions of the U.S. where significant cooling load reductions are desired. Utilities and building owners with aggressive net ZEB objectives should play a key role in this activity. Use of such systems is not yet turn-key: well documented, monitored demonstrations like The New York Times Headquarters activity can help accelerate market deployment of such technologies. California is particularly well positioned to promote such technologies because of its sunny climate and aggressive greenhouse gas emission reduction objectives mandated by the Governor and by the CPUC.
– The exterior shading systems should be promoted in combination with low-energy cooling strategies for new construction, and promoted in retrofit construction to reduce HVAC
20
loads and potentially improve comfort. The same systems can also be used to achieve a visually comfortable daylighted space to significantly reduce lighting energy use.
– Simulation tools should be used to guide the selection of the systems in order to optimize the trade-offs between cooling load reductions and lighting energy use reductions for a specific façade design and address parallel requirements for occupant comfort. These tools should be improved to better emulate the control sequences (manual or automated) of commercially available products. Showcase demonstrations can help spur interest and bolster confidence in the technology.
– Automated interior shading systems should also be widely promoted in commercial buildings that have significant daylighting potential and require reliable control of window glare. These systems provide indoor environmental quality benefits such as increased connection to the outdoors, view, productivity, and health benefits that are difficult to quantify but provide valued amenity benefits to occupants. Automated roller shades are recommended because of their mechanical simplicity. Automated Venetian blind systems and sunlight-redirecting systems have greater cooling load reduction and core daylighting potential but need further engineering to improve operational quality at lower cost.
– Further research is required to develop more robust daylight discomfort glare models so as to enable improvement in automated controls. Interior shade products can reduce cooling loads and improve thermal comfort but are not as effective as exterior systems. Additional research might address the scope for further improvement in cooling load reductions.
– The COMFEN PC-based tool and on-line web-based tool provides fundamental analysis of basic window options and therefore meets today’s analysis needs for the majority of the market for conventional shading systems in California and the U.S. As A/E teams strive to meet more stringent code requirements or even achieve net zero energy objectives, more innovative technological solutions will need to be incorporated into the tool with greater accuracy and flexibility. Further development of COMFEN is planned to address the engineering features as well as usability.
Many of these recommendations will be pursued in the next phase of this project. While the next phase or work will continue to have a strong emphasis on developing robust and facile tools for the industry and development of integrated, high performance façade technologies, more effort will be dedicated to working towards higher minimum codes and standards that promote the practice of integrated design and collaborating with utilities, large building owners, and other major stakeholders to create the demand for high efficiency buildings.
Benefits to California
Everyday, architects design facades without the benefit of performance feedback to inform their decisionmaking. In a time where energy-efficiency is playing an increasingly important role in the design of buildings, easy to use, fast, accurate, low-cost simulation tools are needed to help architects, engineers, and owners make informed decisions based on performance data. This is particularly relevant to California, which has possibly the most stringent energy code in the nation.

21
The technologies investigated in this study, most particularly commercially-available exterior shading systems, can provide California with near-term, practical options for significantly reducing lighting and cooling loads to net zero energy levels in commercial buildings throughout the state while improving occupant comfort and amenity. The technologies also enable significant reductions in summer peak demand: cooling as well as lighting electricity use, which can help California meet its aggressive energy-efficiency and greenhouse gas emission goals.
The products of this research have been broadly disseminated in educational seminars and conferences world-wide. Information in this report further delineates the performance impacts and maturity of near-term, high-performance commercial façade solutions.
22
1.0 Introduction 1.1. Background and Overview Glazing and façade systems have very large impacts on all aspects of commercial building performance in California and the U.S. They directly influence peak heating and cooling loads, and indirectly influence lighting loads when daylighting is considered. In addition to being a major determinant of annual energy use, they can have significant impacts on peak cooling system sizing, electric load shape, and peak electric demand. Because they are prominent architectural and design elements and because they influence occupant preference, satisfaction and comfort, the design optimization challenge is more complex than with many other building systems.
The opportunities for improved design and technology leading to reduced energy use have been successfully pursued in California in recent years at two ends of the spectrum of performance and cost: first, by mandatory requirements as embodied in Title 24 and second, by emerging Research and Development (R&D) results.
In terms of mandatory codes and standards, with each new cycle of Title 24, there is an incremental tightening of the requirements for thermal properties, National Fenestration Rating Council (NFRC) ratings and skylight use, based on what is proven and cost effective in the marketplace at that time.
At the research and longer term emerging technology end of the spectrum, a recently completed Public Interest Energy Research (PIER) R&D project co-sponsored with the U.S. Department of Enery (PIER contract #500-01-023) demonstrated that large savings are possible when emerging switchable electrochromic glass technology is used in an appropriate architectural design and coupled to advanced, integrated controls. However, given the current cost of these systems and the slow pace of market evolution, it will be many years before promising technologies such as electrochromic glazings will have major market and energy impacts in California.
The fundamental performance issues addressed in the electrochromics study still represent a key opportunity for California buildings to significantly reduce energy and demand if cooling and daylighting can be managed and optimized. This phase of fenestration R&D focused on the significant untapped near-term opportunity to capture large savings in the California commercial building stock by:
a) targeting voluntary, design-based opportunities derived from the use of better design guidelines and tools, and
b) developing and deploying more efficient glazings, shading systems, daylighting systems, façade systems and integrated controls.
Conventional versus High-Performance Façade Design
The potential energy use and demand savings resulting from more informed decision-making when designing the façade of commercial buildings is significant. If one looks into the existing practice of façade design, the synergistic impacts of the façade on lighting and HVAC energy use is rarely understood and optimized in the early stages of design when fundamental and often irrevocable design decisions are being made. Even in the case of retrofitting existing
23
buildings, recognition of and deliberate planning towards optimized whole building performance can lead to increased energy-efficiency over the life of the building.
The baseline condition for façade design is the Title-24 window system “solutions” where window area is restricted and the properties of the window (Solar Heat Gain Coefficient and U-factor) are prescribed by orientation. Overhangs and fins are given credit as static projection factors (which can enable greater window area). Using the Title-24 performance-based compliance method, Architects/ Engineers (A/Es) have the opportunity to consider a broader range of design options as long as they stay within the mandated energy budget. Interior shades are not included in the computation. With automated shades, manual user override is disallowed if credit is to be taken with Title-24. Energy credits for daylighting controls are implicit in mandated manually-operated, on-off, bi-level switching requirements in some space types irrespective of window condition.
A/Es typically design the façade in the early schematic design phase with little knowledge of the impacts of their design on energy, peak demand, and comfort, let alone Title-24 compliance. The architect may create a rough 3-D model of the building mass and immediate surroundings to quickly study solar shading, then apply shading elements according to rules-of-thumb knowledge of sun control and their sense of aesthetics. The mechanical engineer, if on board, conducts basic design and sizing calculations to check plant and system capacity. Whole building energy simulations are not done to understand the relative importance of façade-lighting-heating, ventilating and air conditioning (HVAC) interactions and impacts. No optimization is done to achieve the best balance between the three systems. The architect then proceeds to design development to finalize the details of the façade, often with little additional supporting data. Thereafter, the façade design is essentially complete, requiring only minor adjustments to the glass choice in the construction documents phase. During the construction phase or upon occupancy, the building owner or tenants will select interior shading based on aesthetics, maintenance, and other utilitarian requirements. The electric lighting and HVAC systems will comply with the base building specification.
Because the façades industry is highly fragmented and diverse, manufacturers have very little ability to significantly affect this process early on. They can offer possible “fixes” to perceived problems. Some offer tailored simulation tools to enable architects to visualize differences between one product and another (e.g., HunterDouglas’ daylight tool). Images from case study buildings are often provided so that clients can understand the pros/cons of various systems, but these are often a marketing pitch for a particular product.
More and more, leading-edge innovators in the A/E industry are recognizing the significant energy savings potential of designing the façade as a synergistic component of a whole building system and adopting new methods of practice to leverage this opportunity, particularly if energy-efficiency goals are aggressive. High-performance façades minimize lighting energy use through the admission of useful daylight without adversely increasing HVAC cooling loads. Innovative façades can also enable A/E teams to reach net zero energy goals by enabling use of low-energy cooling strategies such as natural ventilation and radiant cooling. To achieve this level of high performance on a routine basis across a broad spectrum of commercial buildings, easy to use, early schematic design tools targeted toward architects based on accurate, sophisticated building energy simulation engines will be critical.
24
Innovative, Emerging Façade Technologies
On the R&D end of the spectrum, there are a wide variety of innovative façade technologies on the market or emerging into the market that could deliver potentially significant energy savings. The difficulty with promoting or accelerating market adoption of new, innovative technologies is two-fold:
a) the inventor’s or manufacturer’s product may have been developed to effectively address a specific aspect of building performance given their particular area of expertise or market interest but may not fully address other critical performance factors, and
b) the architect, facility manager, or building owner does not have the resources to thoroughly investigate a new product and is unwilling to take on the risk of specifying a product without knowing more about the technology beforehand.
For achieving energy-efficiency objectives, the difficulty is sorting out manufacturer’s claims and determining performance impacts, positive or negative, within the typically short amount of time allocated for the schematic design phase of the project. There is no readily available single source of third party information that provides architects and engineers with apples-to-apples comparative data on how one system will perform either in absolute terms or relative to another. Simulation tools enable A/E teams to compare systems and understand energy trade-offs for façade solutions in specific building designs, but these tools are often limited in modeling capabilities, particularly for dynamic systems and emerging technologies, or are time-consuming and complex to learn and operate, providing only a small part of the broad range of information required for confident decision making. To make the matter more complex the tools and information needed will vary widely with the training and skill of the decision maker and the design stage in which the decision is made.
To address this need, a broad information and decision support strategy was created and new elements have been implemented. As a basic information resource, a book was produced by University of Minnesota and LBNL that reviewed commercially-available and emerging façade technologies and provided design guidance and limited data on lighting, HVAC, and comfort performance impacts of integrated daylighting design (see http://www.commercialwindows.org/). A source book on daylighting technologies was assembled by the International Energy Agency SHC Task 21/ ECBCS Annex 29 team of international researchers including LBNL that described and then assessed a wide variety of solar control and daylight enhancement technologies using full-scale field tests with a consistent field test method to compare daylight output from the technologies (see http://gaia.lbl.gov/iea21/). A Southern California Edison (SCE)-funded LBNL scoping study, with cost-share from PIER and DOE, also explained the concepts and use of a variety of façade technologies available on the market (see PIER report CEC-500-2006-052-AT15 and http://gaia.lbl.gov/hpbf/). Utilities continue to provide hands-on mockups of innovative technologies in publicly accessible centers (e.g. SCE’s Customer Technology Application Center and Pacific Gas and Electric’s Pacific Energy Center) and to conduct showcase demonstrations as product offerings evolve but performance data are also limited.
Manufacturers are typically interested in collaborating with publicly- or utility-funded programs that have the potential to raise consumer awareness and accelerate market

25
deployment of their innovations. This interest can be leveraged to accelerate the process if the market pull of large owners can be harnessed as part of this process. A full-scale daylighting field test of automated shading and digitally addressable daylighting controls for the 1.2 Mft2, 52-story New York Times Headquarters Building in Manhattan led to significant improvements to two existing technologies that have been commercially available for decades. The demonstration project required improved functionality and resulted in investments in R&D that resulted in a higher performing system and at lower cost as a result of collaboration between LBNL, the building owner, manufacturers, and A/E consultants. Market demand for these products increased sharply after The Times installed the technologies. Motorized shading systems which five years ago simply implemented solar control (“block direct sunlight”) are now demonstrating more sophisticated performance (“improve daylight utilization” and “reduce glare”) in part due to the competitive marketplace generated by The New York Times project (http://windows.lbl.gov/comm_perf/newyorktimes.htm) and other projects.
Thorough vetting of a technology is a critical step prior to widespread promotion of an emerging technology through utility rebate or incentive programs, state energy-efficiency programs, and ultimately energy codes and standards. Full-scale testing of a technology in a realistic setting enables hands-on evaluation of not only energy-efficiency impacts on lighting energy use and thermal loads but also more importantly, occupant comfort, satisfaction and acceptance with the technology and resultant indoor environment.
1.2. Project Objectives The primary objective of this phase of work was to address the two critical needs identified in the prior section:
a) provision of third-party performance data that thoroughly evaluates the impacts of emerging façade technologies on building energy use, peak demand, and occupant comfort, and
b) provision of tools that enable timely, accurate, performance-based decisionmaking in the early stages of design.
These needs address both the market push (innovation) and pull (demand) side of the problem, making it more likely that ambitious energy-efficiency goals will be achieved broadly and in a more timely fashion.
The focus of this work was on near-term, commercially available technologies due to the significant rise in public awareness and acceptance of the dangers of increased greenhouse gas emissions and the subsequent accelerated demand for energy-efficiency products that could be used cost-effectively in buildings today. The specific technical challenge that this work addressed was also shaped by the architectural trend to use larger, higher-transmittance windows either for design aesthetics or by the belief that “more daylight is better.” This renewed interest in daylighting may be driven by the energy savings potentials, the growing interest in LEED IEQ Daylighting points which tends to favor more glass, and the belief that there are possible health- and productivity benefits associated with daylight. Spectrally-selective, low-emittance coatings on clear glass reduce solar heat gains without loss of much daylight and have enabled design of such highly glazed facades while keeping in compliance with current energy codes. With such façade designs, offsetting lighting energy use in the perimeter zone with daylight must be accompanied by the desire to minimize cooling loads and

26
occupant thermal and visual discomfort. Identifying technologies that enable these performance tradeoffs to occur routinely and cost-effectively was a key objective of this work.
In support of the technology characterization and optimization goals, the project also intended to enhance the availability of decision support tools. This activity was preceded by the publication of a reference book and website to support specification of windows for commercial buildings in a separate DOE-funded project. This project was then tasked to build on this work by making further modifications to the on-line tool available on the website and by developing a downloadable commercial fenestration energy simulation tool called COMFEN. The main objective for the website, developed the prior year using a large data base of DOE-2 simulations, was to convert the data base to EnergyPlus data and to improve the web interface to more readily compare design alternatives. The development objectives for COMFEN were to develop parallel features as the on-line web-based tool but with greater flexibility and wider options, study the use of the tool in architectural and engineering offices, then based on those insights develop a new more flexible version of the user interface.
This project focused on vertical windows and curtain walls since they are elements of virtually all buildings and because prior research and design work, as well as new Title 24 standards, have addressed many of the issues related to skylight applications. Within the scope of building façades, this project addressed the full range of fenestration solutions ranging from punched holes in low-rise tilt up construction to all façades in high rise curtain walls. As such it will be applicable to most of the commercial stock in California.
The commercial building markets in California are diverse in terms of business goals, available resources, interest in maximizing energy savings, and tolerance for risk. This activity was designed to address the differing needs of these different market sectors. It was also designed to support manufacturers who want to develop and sell innovative new products, designers who need reliable tools and data to meet client and the Energy Commission energy efficiency and demand goals, and owners who expect energy efficiency investments to deliver reliable, cost effective savings. The program is targeted initially at early adopters (designers and owners) in the building industry, with the potential to spread rapidly to mainstream applications via utility programs, voluntary programs such as LEED ratings and ultimately building standards.

27
2.0 Project Method 2.1. High Performance Façade System Design and Engineering This section describes the methods used to conduct the task of “systems design and engineering” whose principle objectives were to evaluate the performance impacts of near-term commercially available technologies or prototype technologies and to use the data gathered from these evaluations to further design and engineer more optimal solutions in collaboration with industry.
The technologies were evaluated using full-scale monitored field tests to quantify the impacts on building energy use, peak demand, and occupant comfort in a typical commercial office space. Full-scale field tests enable evaluation of the actual technology under realistic sun and sky conditions without the simplifying assumptions that are often required by building energy simulation programs.
While the focus of the evaluations is on energy and demand savings, the research also addressed the other practical aspects and features needed in the marketplace (e.g., cost effectiveness, reliability, glare control, view, etc.) to ensure that systems are deployed and utilized as intended to achieve the expected savings. Extensive past work with owners and industrial partners has shown that these performance issues and features must be addressed in order to achieve the expected energy outcomes.
To summarize the methods used to complete this task, the research team first identified and prioritized commercially-available and emerging daylighting technologies, evaluated a short-listed set of technologies that met preliminary performance and market objectives, then conducted two solstice-to-solstice field tests in the LBNL Windows Testbed Facility on the selected technologies. Monitored performance data included lighting energy use, cooling loads due to window solar and thermal loads, and indoor environmental quality data related particularly to visual discomfort. While the technologies tested were commercially available, some required further tuning or modifications to ensure reliability, improve performance, or address an aspect of performance that was not previously considered by the manufacturer. These tasks were conducted in collaboration with the manufacturers, for some, in confidence to encourage an open dialogue.
A description of the shading systems is given in Section 2.1.1. A description of the experimental setup, data collected, and performance metrics is given in Section 2.1.2.
2.1.1. Description of Shading Systems
2.1.1.1. Method of Selection Due to practical time and resource constraints, only a limited number of all possible façade technologies or combinations of technologies can be evaluated in a field test program. An ad hoc method was used to determine which technologies were to be selected for this phase of research based on technical and market objectives, surveys of commercially-available technologies, discussions with specifiers, manufacturers, architects and engineers, utilities, and other stakeholders including Project Advisory Committee members, literature reviews, and by attending trade shows, conferences, and other venues.

28
There is a wide range of technical and market context and issues that shape the selection of façade technologies in commercial buildings. Selection of the short listed technologies for field testing was based on the following rationale, prior experience and judgment, and prior simulation, laboratory, field, or other studies, if any, that documented potential performance:
• Commercially available from multiple vendors • Significant sustained energy savings over the life of the installation • No negative impacts on occupant comfort and satisfaction with interior work
environment • Large potential market share or applicability • Life-cycle cost payback compatible with business investment needs, e.g., approximately
5 years for simple technologies and 10 years for integrated solutions • Reliable and practical • Significant demand response potential
Two six-month solstice-to-solstice phases of field testing were defined. The focus of the Phase 1 field tests was to derive and evaluate solutions that optimize energy-demand-daylight-comfort performance trade-offs routinely and cost-effectively. Through prior Lawrence Berkeley National Laboratory (LBNL) field tests of electrochromic windows1 and roller shades2, the research team found that daylighting potential can be significantly degraded if the systems are controlled solely to minimize discomfort glare. Given practical constraints for new and retrofit construction, interior shading systems are likely to have the greatest market impact, despite the difficulty of regulating such technologies via energy codes. This led the research team to consider “split” or zoned façade solutions that define separate functions for the vision (lower) and daylighting (upper clerestory) portion of the window wall.
The second phase of field tests focused on the same optimization issues but with increased emphasis on the reduction of solar heat gains. With the drive toward net zero energy buildings and well publicized use in the EU, there is an increased interest in the U.S. to use low-energy cooling strategies such as natural ventilation, radiant cooling, etc. Many exterior shading or double-façade systems developed for the European market are designed primarily to achieve significant summer solar heat gain/ cooling load reductions that enable use of low-energy cooling strategies. Solar control- and prototype- exterior shading systems that manage solar loads and daylighting were evaluated in Phase 2. Between-pane shading systems were considered because of their potential broader applicability but the research team chose to evaluate a larger number of systems instead (practically speaking, between-pane systems cannot be rotated every few days according to the defined experimental method whereas exterior systems can). These exterior shading systems may be more relevant for low- to mid-rise buildings located in the hotter climates in California and in the southern half of the U.S., or for buildings in any climate that have large windows.
2.1.1.2. Interior Shading Systems Six test conditions were investigated in Phase 1: four types of Venetian blinds, a fabric roller shade, and a translucent glazing system (Figure 1). For some, the shading systems were
1 http://windows.lbl.gov/comm_perf/Electrochromic/
2 http://windows.lbl.gov/comm_perf/newyorktimes.htm
29
divided into an upper clerestory and lower vision portion, where the dividing height occurred at the same height as the glazed window wall: 1.98 m (6.5 ft) height above the floor. A detailed description of the hardware and operational characteristics is given below.
Two reference conditions were defined: a “manually-adjusted” interior Venetian blind or fabric roller shade. There have been many field studies over the years to characterize occupants’ use of window blinds and these studies suggest that people tend to use their blinds to block direct sunlight and control glare. Rubin et al. (1978) suggested that the occupant arrives at a preferred position as a result of individual weighing of the positive (daylight, view) and negative effects (glare, privacy) of windows. Rea (1984) concluded that building occupants seldom adjust their window blinds during the course of the day; he found that they tend to set their blinds to a position in which solar glare is sufficiently excluded under most sky conditions and then leave the blinds in that position for weeks, months, or even years. These reference conditions represent a simple benchmark against which to judge the test cases.
In detail, the reference conditions defined for this study were:
1) Manually-operated Venetian blind (reference-VB): single 0.025-m- (1-inch-) wide, matte white Venetian blind in a fully-lowered position covering the entire window. Slat angles were seasonally adjusted three times over the six-month monitored period to block direct sun for the majority of the day (Tables 1-2).
2) Manually-operated roller shade (reference-RS): single, top-down, 3%-open, light gray (both sides) basketweave fiberglass/PVC fabric roller shade set to a height so that its bottom edge was 0.76 m (30 inch) above the floor. The shade was set at this height since a) it was likely to produce comfortable conditions (no irradiation on occupant, no sunlight on work tasks) and b) it increased interior illuminance sensor signals above noise levels for a related task.
The six test conditions were as follows (detailed data for each Venetian blind system are given in Tables 1-2):
1) Manually-operated split Venetian blind (split-VB): two, side-by-side, 0.025-m- (1-inch-) wide, matte white split Venetian blinds in a fully-lowered position covering the entire window. The blind is split into an upper and lower section where the lower slats have a fixed or ganged difference in tilt angle from the upper slats of the blind by virtue of how the slats were held on the string ladders. The lower surface of all slats had a low-e coating with a brushed silver appearance. Slat angles were adjusted seasonally over the six-month monitored period to block direct sun for the majority of the day.
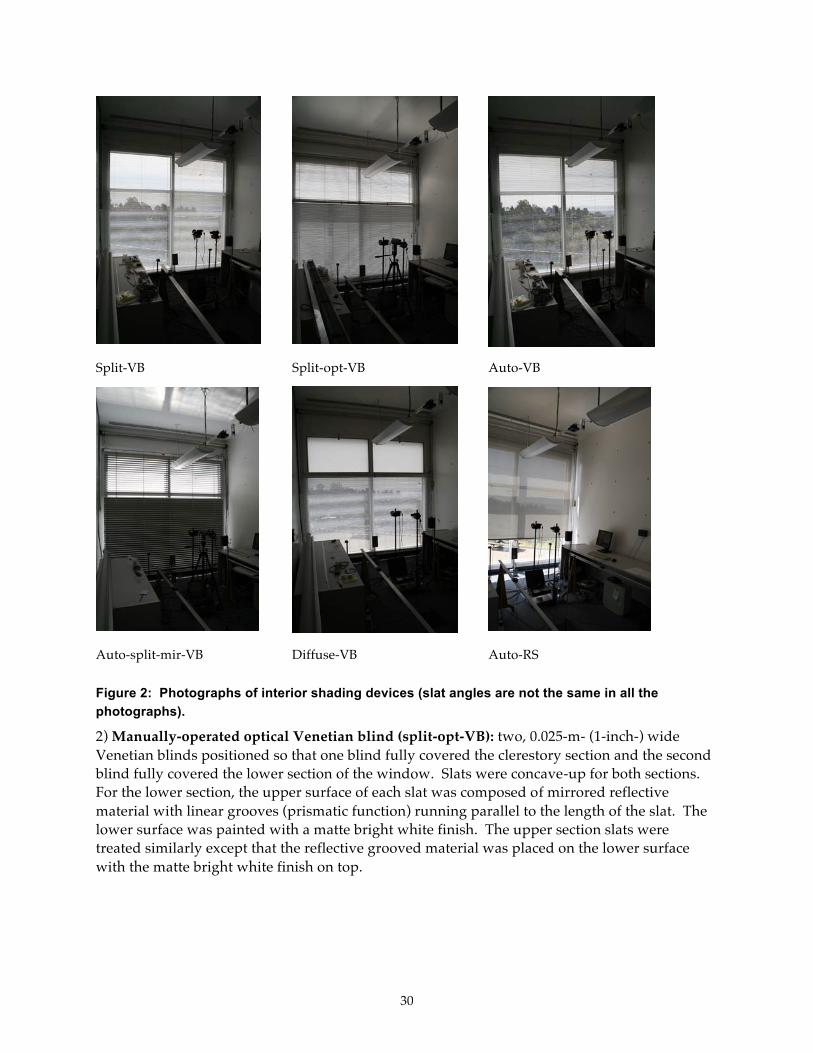
30
Split-VB Split-opt-VB Auto-VB
Auto-split-mir-VB Diffuse-VB Auto-RS
Figure 2: Photographs of interior shading devices (slat angles are not the same in all the photographs).
2) Manually-operated optical Venetian blind (split-opt-VB): two, 0.025-m- (1-inch-) wide Venetian blinds positioned so that one blind fully covered the clerestory section and the second blind fully covered the lower section of the window. Slats were concave-up for both sections. For the lower section, the upper surface of each slat was composed of mirrored reflective material with linear grooves (prismatic function) running parallel to the length of the slat. The lower surface was painted with a matte bright white finish. The upper section slats were treated similarly except that the reflective grooved material was placed on the lower surface with the matte bright white finish on top.

31
Table 2: Description of Venetian Blind Systems Shade type Zone Slat
concave Slat
width Slat
width Slat
spacing Slat
spacing Slat top surface
Slat bottom surface
Upper+lower slats ganged?
(mm) (in) (mm) (in)
Interior Systems
reference-VB none down 25.4 1.0 20.0 0.79 semi-gloss white
semi-gloss white
no
split-VB upper down 25.0 1.0 20.0 0.79 semi-gloss white
reflective metal
yes
lower down 25.0 1.0 20.0 0.79 white reflective metal
yes
split-opt-VB upper up 25.0 1.0 17.0 0.67 matte white prism no
lower up 25.0 1.0 17.0 0.67 prism matte white
no
auto-split-mir-VB upper up 82.5 3.2 71.4 2.81 mirror matte gray yes
lower up 82.5 3.2 71.4 2.81 shiny white matte gray yes
auto-VB none down 25.4 1.0 20.0 0.79 matte white matte white
no
diff-VB lower down 25.4 1.0 20.0 0.79 semi-gloss white
semi-gloss white
no
Exterior Systems
VB-E1n, VB-E1n-auton1
none down 100.0 3.94 85.0 3.35 semi-gloss white
semi-gloss white
no
VB-E2n, VB-E2n-auton1
upper down 100.0 3.94 85.0 3.35 semi-gloss white
semi-gloss white
no
lower down 100.0 3.94 85.0 3.35 semi-gloss white
semi-gloss white
no
VB-E3opt upper down 77.0 3.03 70.0 2.76 polished aluminium
matte light gray
yes
middle down 77.0 3.03 70.0 2.76 polished aluminium
matte light gray
yes
lower down 77.0 3.03 70.0 2.76 polished aluminium
matte light gray
yes
3) Automated Venetian blind (auto-VB): one 0.025-m- (1-inch-) wide, matte white Venetian blind in a fully-lowered position covering the entire window (same blind as the reference-VB). Automation was implemented using an LBNL prototype control algorithm via the manufacturer’s interface to an encoded DC motor. When the vertical exterior global illuminance was greater than 30,000 lux, the slat angle of the blind was adjusted every 1 min to block direct sun and then further closed to control daylight levels on the workplane at the rear of the room to within 570-670 lux, if needed. When less than 30,000 lux, the slat angle was set to horizontal to allow minimally obstructed view out or the slats were further closed to control daylight levels to within 570-670 lux. Slat angle adjustments were continuous, not stepped, over the full range of tilt angles. Slat angles were never permitted to be negative in order to block direct views of the sky.
4) Automated split optical Venetian blind (auto-split-mir-VB): one 0.083-m- (3.25-inch-) wide, zoned optically-treated Venetian blind covering the entire window when lowered. Slats were concave-up in both sections -- the upper clerestory region had slats with a shiny mirrored coating on the upper surface and a light gray finish on the underside of the slat; the lower view region had slats with a shiny white upper surface and the same gray underside as the clerestory zone. The blind was split into an upper and lower zone where the lower slats had a fixed or

32
ganged angle difference from the upper slats of the blind by virtue of how they were held on the string ladders.
Table 3: Operation of Venetian Blind Systems
Shade Zone Operation Auto?
SA SA SA BA BA BA Height
type winter equinox summer winter equinox summer above
(deg) (deg) (deg) (deg) (deg) (deg) floor (m)
Interior Systems reference-VB no 58 12 0 0 30 35 0 split-VB upper no 35 10 0 20 35 35 0 lower no 55 34 28 0 16 20 0 split-opt-VB upper no 28 6 0 20 35 35 0 lower no 50 12 0 0 30 35 0 auto-split-mir-VB upper early AM
late PM yes 15 5 0 20 35 30 0, 2.74
lower early AM late PM
yes 75 63 54 0 0 2 0, 2.74
upper 10:00-14:00 yes 28 28 8 6 6 25 0, 2.74 lower 10:00-14:00 yes 78 78 70 0 0 0 0, 2.74 auto-VB yes LBNL control of slat angles 0 diff-VB lower no 58 12 0 0 30 35 0
Exterior Systems
VB-E1n no 56 16 16 4 32 32 0 VB-E2n upper no 31 16 16 22 32 32 0 lower no 56 16 16 4 32 32 0 VB-E1n-auton1 yes Manufacturer control of slat angles: solar exclusion 0 VB-E2n-auton1 upper yes Manufacturer control of slat angles: daylight 0 lower Manufacturer control of slat angles: solar exclusion 0 VB-E3opt upper no 63 63 63 4 4 4 0 middle no 36 36 36 20 20 20 0 lower no 17 17 17 31 31 31 0 Positive slat angle: Occupant can see the exterior ground from the interior. Auto: automated; SA: slat angle; BS: blocking angle; deg: degrees Blocking angle is defined as the profile or cut-off angle between two slats at normal incidence to the glass. Slat angle was defined as the angle between horizontal and the plane defined by the two outside edges of the slat.
Automation was implemented using a separate manufacturer’s control system and hardware (motor controller, building controller, PC user interface, and exterior sensor) to interface to the unencoded AC motor mounted in the header of the blind. When the vertical exterior light level was greater than 20,000 units (manufacturer-specified value for a sensor with unknown calibration), then the blind was lowered from a fully-raised position to a fully-lowered position. The threshold value of 20,000 units corresponded to an exterior vertical illuminance of approximately 9000-15,000 lux. Slat angles were positioned to specific seasonal tilt angles via the user interface. Two sets of angles were specified for two periods over the course of the day: one set for 10:00-14:00 and another set for all other hours based on the requirement for solar exclusion in both zones and the desire for daylight redirection in the upper zone without an increase in glare. On some days for some unknown reason, the slat angles would be positioned

33
by the control system to the wrong angle or tilted at the wrong time; these data were omitted from the dataset.
5) Insulated, translucent diffusing panel and Venetian blind (diffuse-VB): 0.07-m- (2.75-inch) thick, white “veil” material, sandwiched between two sheets of 3-mm- (0.11-inch-) thick acrylic, edge sealed with structural silicone then placed against the inboard surface of the upper clerestory glazing. Manufacturer data indicated light diffusion properties that were close to a hemispherical diffuser with low associated U-value (estimated panel values were Tvis =0.47, SHGC=0.44, U-value=1.13 W/m2-˚C, 0.2 Btu/h-ft2-˚F; total window values undetermined). The panel had to be removed every three to four days as defined by the monitoring protocol and so was not installed as intended for real building applications. The thermal data, therefore, is not an accurate depiction of a real world installation. The same Venetian blind and slat angles as reference-VB were used to cover the entire lower window.
6) Automated roller shade (auto-RS): single, top-down roller shade (same shade as reference case) with automated height adjustments. The motorized system enabled precise adjustment of height: 100 steps over the full height or ~2.54-cm (1-inch) steps. Automated control was implemented using National Instruments LabView software where commands were sent via RS232 to the manufacturer’s motor controller. An LBNL control algorithm was implemented (similar to that implemented for the auto-VB). When the vertical exterior global illuminance was greater than 30,000 lux, then the roller shade height was adjusted every 1 min to prevent direct sun penetration from exceeding a depth of 0.91 m (3 ft) from the interior face of the glazing. The shade was further lowered to control daylight levels to within 570-670 lux on the workplane at the rear of the room if needed. When less than 30,000 lux, the shade was either raised or lowered to control daylight levels to within 570-670 lux. When raised, the motion was restricted to a maximum change of 10 steps (10% of the full height of the shade) every 5 min.
Note for all test and reference cases, the blind slat angles for the static systems were positioned using an inclinometer aimed at the mid-height of the upper or lower regions. Slat angle varied by 5˚ over the height of the blind for most systems. All shades were positioned 0.025 m (1 inch) from the inboard face of the window framing or 0.13 m (5.25 inch) from the face of the window glazing. When fully-retracted, the blind stack did not block the vision portion of the window wall.
2.1.1.3. Exterior Shading Systems Six test conditions were investigated in Phase 2: four types of exterior Venetian blinds, an optical exterior Venetian blind, and an exterior fabric roller shade (Figure 2). The reference shading condition was the same as that defined for the interior shading systems in Phase 1. The exterior automated roller shade was paired with reference roller shade as well as the automated interior roller shade system in Phase 1.
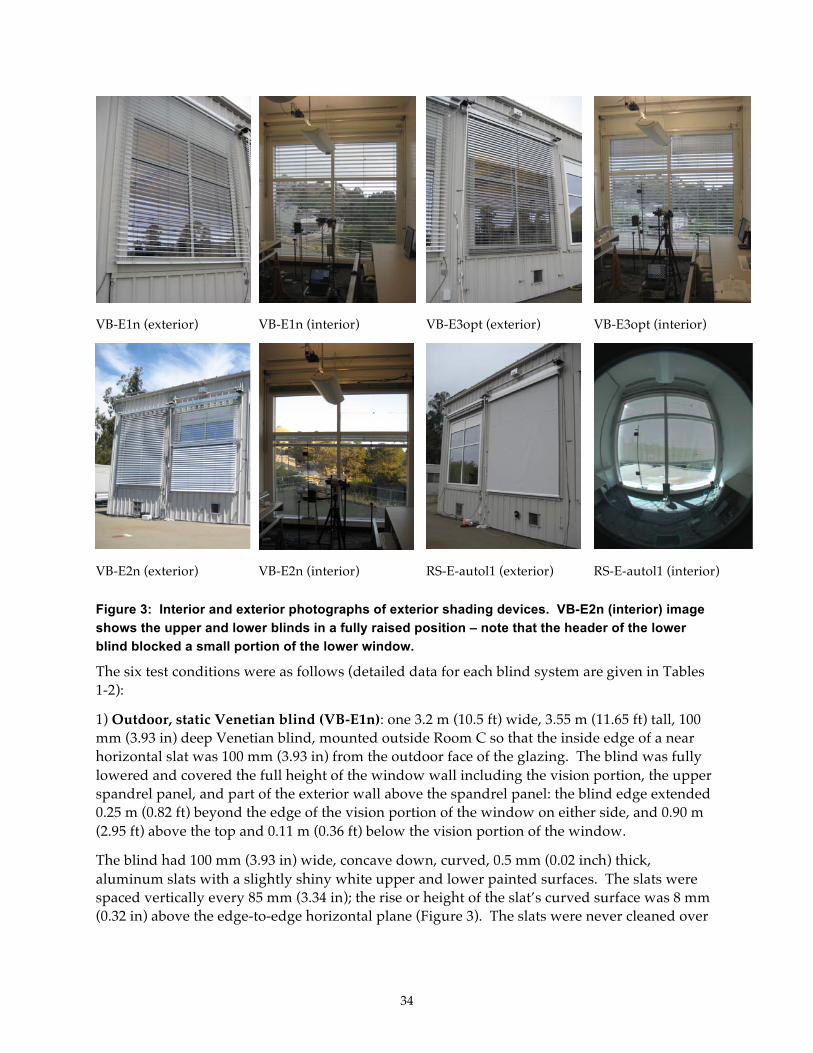
34
VB-E1n (exterior) VB-E1n (interior) VB-E3opt (exterior) VB-E3opt (interior)
VB-E2n (exterior) VB-E2n (interior) RS-E-autol1 (exterior) RS-E-autol1 (interior)
Figure 3: Interior and exterior photographs of exterior shading devices. VB-E2n (interior) image shows the upper and lower blinds in a fully raised position – note that the header of the lower blind blocked a small portion of the lower window.
The six test conditions were as follows (detailed data for each blind system are given in Tables 1-2):
1) Outdoor, static Venetian blind (VB-E1n): one 3.2 m (10.5 ft) wide, 3.55 m (11.65 ft) tall, 100 mm (3.93 in) deep Venetian blind, mounted outside Room C so that the inside edge of a near horizontal slat was 100 mm (3.93 in) from the outdoor face of the glazing. The blind was fully lowered and covered the full height of the window wall including the vision portion, the upper spandrel panel, and part of the exterior wall above the spandrel panel: the blind edge extended 0.25 m (0.82 ft) beyond the edge of the vision portion of the window on either side, and 0.90 m (2.95 ft) above the top and 0.11 m (0.36 ft) below the vision portion of the window.
The blind had 100 mm (3.93 in) wide, concave down, curved, 0.5 mm (0.02 inch) thick, aluminum slats with a slightly shiny white upper and lower painted surfaces. The slats were spaced vertically every 85 mm (3.34 in); the rise or height of the slat’s curved surface was 8 mm (0.32 in) above the edge-to-edge horizontal plane (Figure 3). The slats were never cleaned over
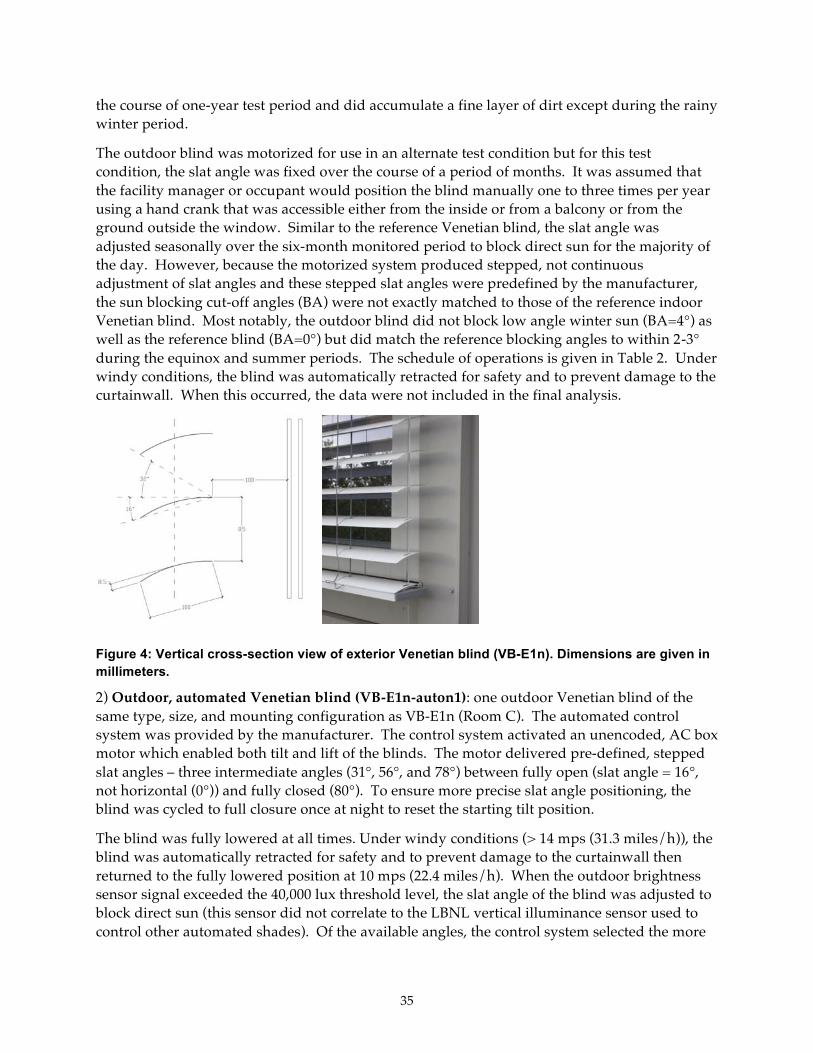
35
the course of one-year test period and did accumulate a fine layer of dirt except during the rainy winter period.
The outdoor blind was motorized for use in an alternate test condition but for this test condition, the slat angle was fixed over the course of a period of months. It was assumed that the facility manager or occupant would position the blind manually one to three times per year using a hand crank that was accessible either from the inside or from a balcony or from the ground outside the window. Similar to the reference Venetian blind, the slat angle was adjusted seasonally over the six-month monitored period to block direct sun for the majority of the day. However, because the motorized system produced stepped, not continuous adjustment of slat angles and these stepped slat angles were predefined by the manufacturer, the sun blocking cut-off angles (BA) were not exactly matched to those of the reference indoor Venetian blind. Most notably, the outdoor blind did not block low angle winter sun (BA=4°) as well as the reference blind (BA=0°) but did match the reference blocking angles to within 2-3° during the equinox and summer periods. The schedule of operations is given in Table 2. Under windy conditions, the blind was automatically retracted for safety and to prevent damage to the curtainwall. When this occurred, the data were not included in the final analysis.
Figure 4: Vertical cross-section view of exterior Venetian blind (VB-E1n). Dimensions are given in millimeters.
2) Outdoor, automated Venetian blind (VB-E1n-auton1): one outdoor Venetian blind of the same type, size, and mounting configuration as VB-E1n (Room C). The automated control system was provided by the manufacturer. The control system activated an unencoded, AC box motor which enabled both tilt and lift of the blinds. The motor delivered pre-defined, stepped slat angles – three intermediate angles (31°, 56°, and 78°) between fully open (slat angle = 16°, not horizontal (0°)) and fully closed (80°). To ensure more precise slat angle positioning, the blind was cycled to full closure once at night to reset the starting tilt position.
The blind was fully lowered at all times. Under windy conditions (> 14 mps (31.3 miles/h)), the blind was automatically retracted for safety and to prevent damage to the curtainwall then returned to the fully lowered position at 10 mps (22.4 miles/h). When the outdoor brightness sensor signal exceeded the 40,000 lux threshold level, the slat angle of the blind was adjusted to block direct sun (this sensor did not correlate to the LBNL vertical illuminance sensor used to control other automated shades). Of the available angles, the control system selected the more
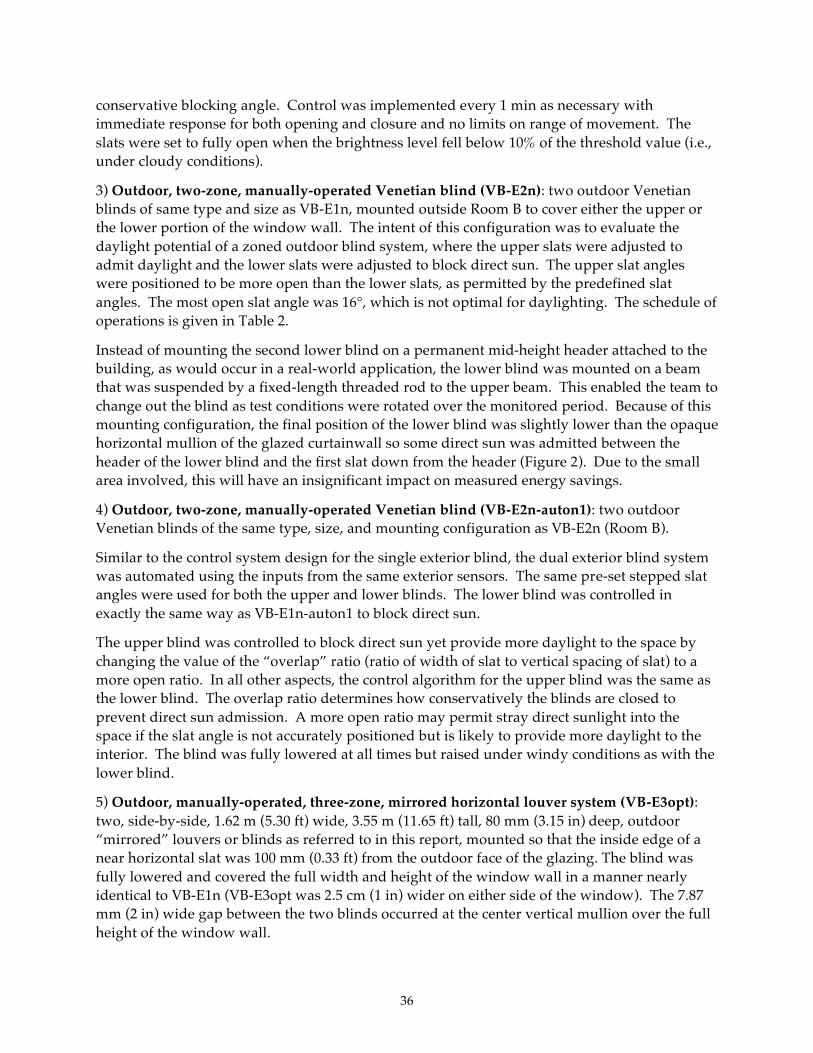
36
conservative blocking angle. Control was implemented every 1 min as necessary with immediate response for both opening and closure and no limits on range of movement. The slats were set to fully open when the brightness level fell below 10% of the threshold value (i.e., under cloudy conditions).
3) Outdoor, two-zone, manually-operated Venetian blind (VB-E2n): two outdoor Venetian blinds of same type and size as VB-E1n, mounted outside Room B to cover either the upper or the lower portion of the window wall. The intent of this configuration was to evaluate the daylight potential of a zoned outdoor blind system, where the upper slats were adjusted to admit daylight and the lower slats were adjusted to block direct sun. The upper slat angles were positioned to be more open than the lower slats, as permitted by the predefined slat angles. The most open slat angle was 16°, which is not optimal for daylighting. The schedule of operations is given in Table 2.
Instead of mounting the second lower blind on a permanent mid-height header attached to the building, as would occur in a real-world application, the lower blind was mounted on a beam that was suspended by a fixed-length threaded rod to the upper beam. This enabled the team to change out the blind as test conditions were rotated over the monitored period. Because of this mounting configuration, the final position of the lower blind was slightly lower than the opaque horizontal mullion of the glazed curtainwall so some direct sun was admitted between the header of the lower blind and the first slat down from the header (Figure 2). Due to the small area involved, this will have an insignificant impact on measured energy savings.
4) Outdoor, two-zone, manually-operated Venetian blind (VB-E2n-auton1): two outdoor Venetian blinds of the same type, size, and mounting configuration as VB-E2n (Room B).
Similar to the control system design for the single exterior blind, the dual exterior blind system was automated using the inputs from the same exterior sensors. The same pre-set stepped slat angles were used for both the upper and lower blinds. The lower blind was controlled in exactly the same way as VB-E1n-auton1 to block direct sun.
The upper blind was controlled to block direct sun yet provide more daylight to the space by changing the value of the “overlap” ratio (ratio of width of slat to vertical spacing of slat) to a more open ratio. In all other aspects, the control algorithm for the upper blind was the same as the lower blind. The overlap ratio determines how conservatively the blinds are closed to prevent direct sun admission. A more open ratio may permit stray direct sunlight into the space if the slat angle is not accurately positioned but is likely to provide more daylight to the interior. The blind was fully lowered at all times but raised under windy conditions as with the lower blind.
5) Outdoor, manually-operated, three-zone, mirrored horizontal louver system (VB-E3opt): two, side-by-side, 1.62 m (5.30 ft) wide, 3.55 m (11.65 ft) tall, 80 mm (3.15 in) deep, outdoor “mirrored” louvers or blinds as referred to in this report, mounted so that the inside edge of a near horizontal slat was 100 mm (0.33 ft) from the outdoor face of the glazing. The blind was fully lowered and covered the full width and height of the window wall in a manner nearly identical to VB-E1n (VB-E3opt was 2.5 cm (1 in) wider on either side of the window). The 7.87 mm (2 in) wide gap between the two blinds occurred at the center vertical mullion over the full height of the window wall.

37
The blind had inverted V-shape slats that were 77 mm (3.0 in) wide and 0.56 mm (0.022 inch) thick with a slightly polished aluminum top surface and a light gray matte painted under surface. The slats were spaced vertically every 70 mm (2.76 in); the rise or height of the slat’s V shape was 9 mm (0.35 in) above the edge-to-edge horizontal plane (Figure 4). The legs of the V were of equal 40 mm (1.57 in) length. The slats were never cleaned over the course of one-year test period and did accumulate a fine layer of dirt except during the rainy winter period.
The vertical height of the blind was subdivided into three horizontal zones of equal height (16 slats per zone), where the slats in each zone had a fixed or ganged difference in slat angle from the slats of the other two zones by virtue of how the slats were held on the string ladders. The height of the zones was predefined by the manufacturer. The lowest zone corresponded to a height of 0.41-1.16 m (0.125-3.79 ft) above the interior floor; the middle zone corresponded to a height of 1.16-2.27 m (3.79-7.46 ft) above the interior floor and spanned both the lower and upper glazed window openings; the upper zone corresponded to a height of 2.27-3.39 m (7.46-11.13 ft) above the interior floor. For reference, the upper clerestory window was 1.98-2.74 m (6.5-9.0 ft) above the floor. See Figure 2 for an interior view of the window wall.
The angular relationship of the slats between zones differed from that shown in the product literature provided by the manufacturer. In the literature, the slat angle becomes more horizontal or open from the bottom to top of the blind, enabling solar protection from overheating in the lower two zones and daylight redirection in the upper area of the window where the horizontal slat (leg of the V nearest the window) acts as a light shelf to reflect light to the ceiling. The product is designed to be static with no adjustments in slat angle required over the course of the year. The actual product provided by the manufacturer for this test was shipped in such a way that the slats could not be positioned without compromising its structural integrity as shown in the diagram due to the way the blind was assembled. The blind was modified to the extent possible as instructed, then confirmed by the manufacturer that the final installation was acceptable. The final slat configuration had slat angles that were more closed from bottom to top (Table 2), offering greater solar protection than the configuration shown in the literature. The lower and middle zones matched the product literature’s slat angles (measured off of the diagram), enabling partially obstructed views to the outdoors. The upper zone had a very closed slat angle which blocked direct sunlight for nearly all solar positions (cutoff or blocking angle of 4°) and direct views of the sky.
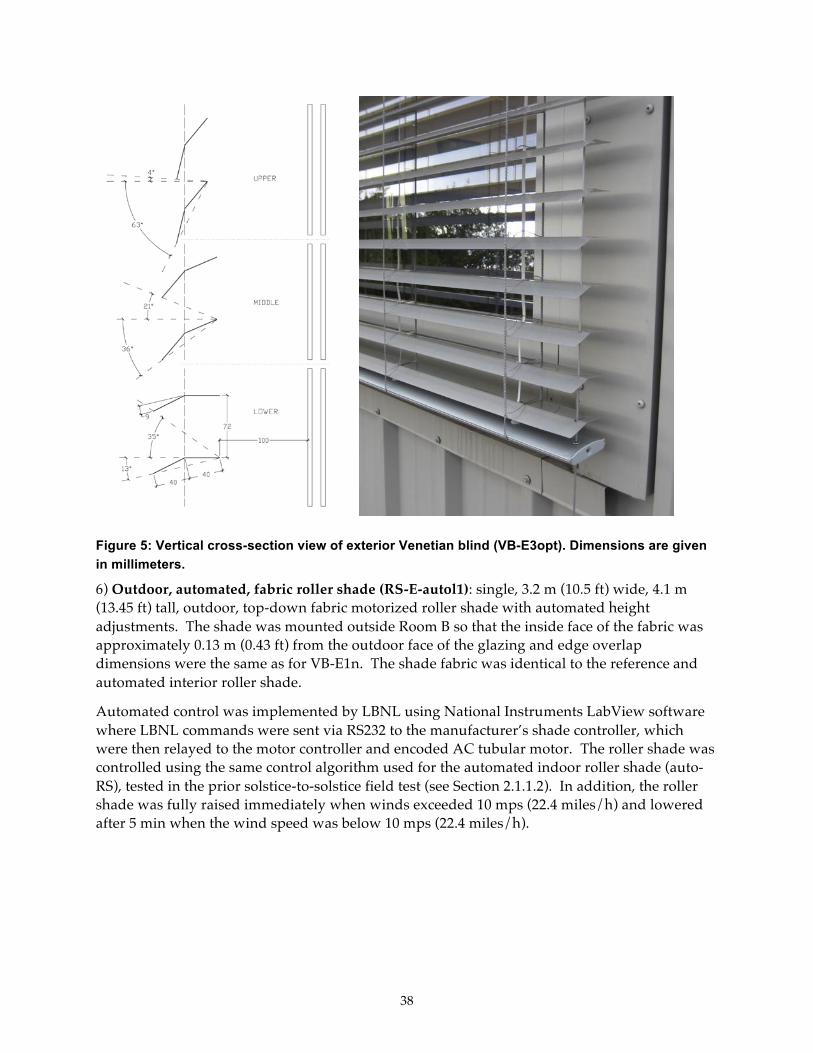
38
Figure 5: Vertical cross-section view of exterior Venetian blind (VB-E3opt). Dimensions are given in millimeters.
6) Outdoor, automated, fabric roller shade (RS-E-autol1): single, 3.2 m (10.5 ft) wide, 4.1 m (13.45 ft) tall, outdoor, top-down fabric motorized roller shade with automated height adjustments. The shade was mounted outside Room B so that the inside face of the fabric was approximately 0.13 m (0.43 ft) from the outdoor face of the glazing and edge overlap dimensions were the same as for VB-E1n. The shade fabric was identical to the reference and automated interior roller shade.
Automated control was implemented by LBNL using National Instruments LabView software where LBNL commands were sent via RS232 to the manufacturer’s shade controller, which were then relayed to the motor controller and encoded AC tubular motor. The roller shade was controlled using the same control algorithm used for the automated indoor roller shade (auto-RS), tested in the prior solstice-to-solstice field test (see Section 2.1.1.2). In addition, the roller shade was fully raised immediately when winds exceeded 10 mps (22.4 miles/h) and lowered after 5 min when the wind speed was below 10 mps (22.4 miles/h).
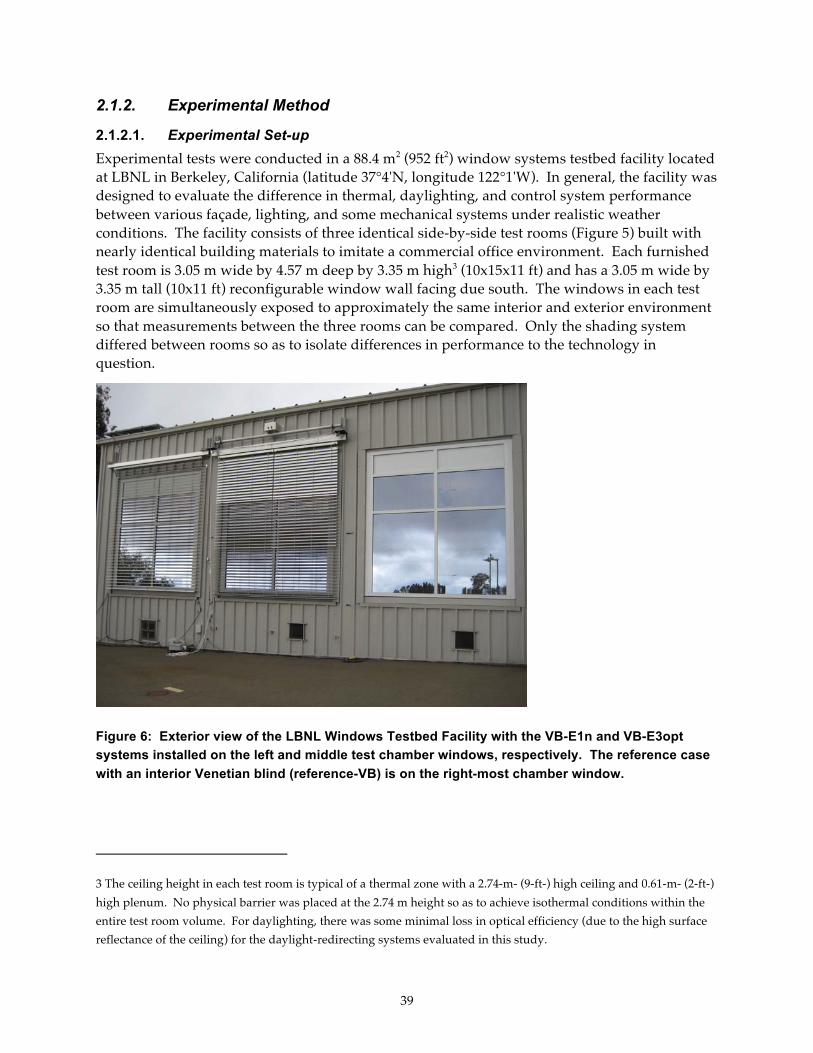
39
2.1.2. Experimental Method
2.1.2.1. Experimental Set-up Experimental tests were conducted in a 88.4 m2 (952 ft2) window systems testbed facility located at LBNL in Berkeley, California (latitude 37°4'N, longitude 122°1'W). In general, the facility was designed to evaluate the difference in thermal, daylighting, and control system performance between various façade, lighting, and some mechanical systems under realistic weather conditions. The facility consists of three identical side-by-side test rooms (Figure 5) built with nearly identical building materials to imitate a commercial office environment. Each furnished test room is 3.05 m wide by 4.57 m deep by 3.35 m high3 (10x15x11 ft) and has a 3.05 m wide by 3.35 m tall (10x11 ft) reconfigurable window wall facing due south. The windows in each test room are simultaneously exposed to approximately the same interior and exterior environment so that measurements between the three rooms can be compared. Only the shading system differed between rooms so as to isolate differences in performance to the technology in question.
Figure 6: Exterior view of the LBNL Windows Testbed Facility with the VB-E1n and VB-E3opt systems installed on the left and middle test chamber windows, respectively. The reference case with an interior Venetian blind (reference-VB) is on the right-most chamber window.
3 The ceiling height in each test room is typical of a thermal zone with a 2.74-m- (9-ft-) high ceiling and 0.61-m- (2-ft-) high plenum. No physical barrier was placed at the 2.74 m height so as to achieve isothermal conditions within the entire test room volume. For daylighting, there was some minimal loss in optical efficiency (due to the high surface reflectance of the ceiling) for the daylight-redirecting systems evaluated in this study.

40
Figure 7: Floor plan of the LBNL Windows Testbed Facility
With the exception of the shading technology to be tested, the window configuration was identical in all three test rooms. Large-area, high-transmittance windows were installed to address a number of competing considerations: 1) ability to measure small differences in thermal loads, 2) ability to quantify glare-daylight tradeoffs, and 3) current preference of the architectural community to specify large-area, high transmittance windows.
The windows had double-pane, spectrally selective, low-emittance glazing and thermally-broken aluminum framing. The overall window wall was 3.05-m wide by 3.35-m high (10x11 ft) with an opaque insulated spandrel panels making up the upper 0.61 m (2 ft) of the wall. The window wall was divided into an upper clerestory and lower vision zone then further subdivided into two equally-sized lites. The horizontal division between the upper and lower zones occurred at a height of 1.98 m (6.5 ft) above the floor. The maximum and minimum vision window head height was 2.77 m (9 ft) and 0.22 m (0.71 ft), respectively. Total vision area was 59% of the exterior wall area (i.e., window-to-wall-area ratio (WWR)=0.59, Aglass=6.57 m2 (70.7 ft2)) assuming a typical floor-to-floor height of 3.66 m (12 ft). The window-to-wall-area ratio for the entire window (excluding the spandrel panel) was 0.73. Center-of-glass properties were Tv=0.62, SHGC=0.40, and U-Value=1.7 W/m2-ºC (0.30 Btu/h-ft2-ºF).
Paired, same day comparisons (simultaneous measurements) were made between the reference and test shade conditions over a solstice-to-solstice period to evaluate performance over the range of solar positions that occur over a year. For Phase 1, the period of measurement was from December 21, 2007 to June 21, 2008. For Phase 2, the period of measurement was from June 21, 2008 to June 21, 2009, for the reasons explained in Section 2.1.2.3. The test condition
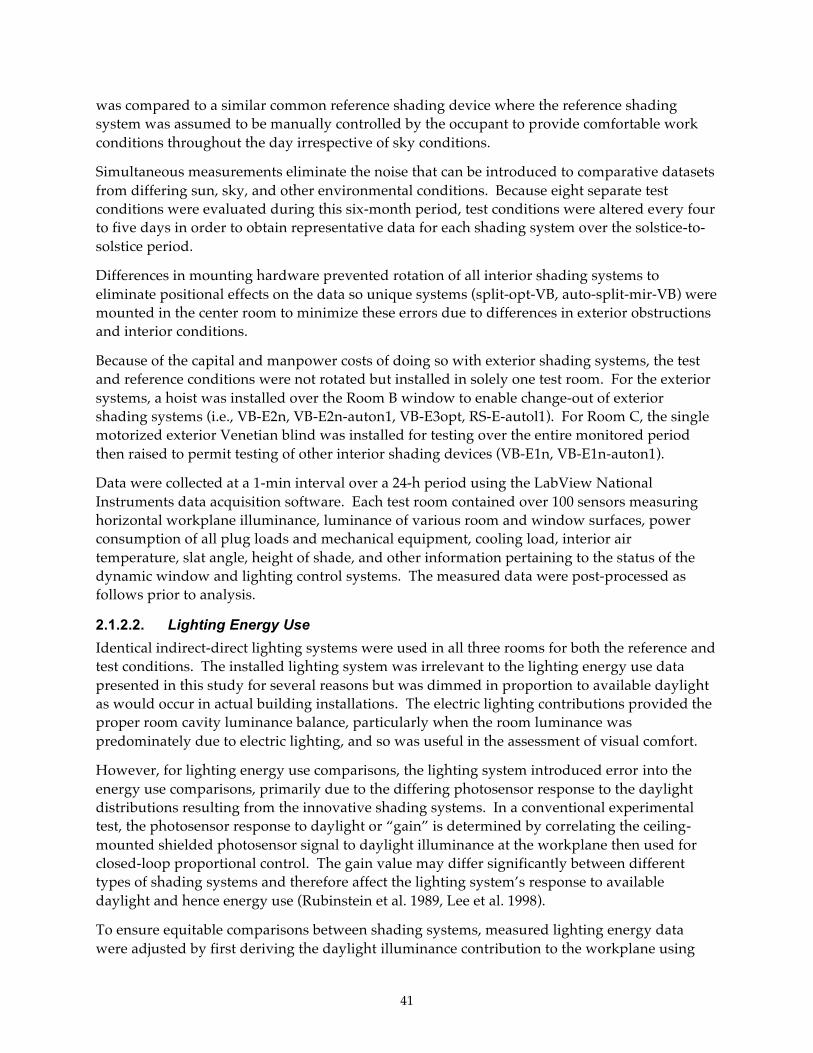
41
was compared to a similar common reference shading device where the reference shading system was assumed to be manually controlled by the occupant to provide comfortable work conditions throughout the day irrespective of sky conditions.
Simultaneous measurements eliminate the noise that can be introduced to comparative datasets from differing sun, sky, and other environmental conditions. Because eight separate test conditions were evaluated during this six-month period, test conditions were altered every four to five days in order to obtain representative data for each shading system over the solstice-to-solstice period.
Differences in mounting hardware prevented rotation of all interior shading systems to eliminate positional effects on the data so unique systems (split-opt-VB, auto-split-mir-VB) were mounted in the center room to minimize these errors due to differences in exterior obstructions and interior conditions.
Because of the capital and manpower costs of doing so with exterior shading systems, the test and reference conditions were not rotated but installed in solely one test room. For the exterior systems, a hoist was installed over the Room B window to enable change-out of exterior shading systems (i.e., VB-E2n, VB-E2n-auton1, VB-E3opt, RS-E-autol1). For Room C, the single motorized exterior Venetian blind was installed for testing over the entire monitored period then raised to permit testing of other interior shading devices (VB-E1n, VB-E1n-auton1).
Data were collected at a 1-min interval over a 24-h period using the LabView National Instruments data acquisition software. Each test room contained over 100 sensors measuring horizontal workplane illuminance, luminance of various room and window surfaces, power consumption of all plug loads and mechanical equipment, cooling load, interior air temperature, slat angle, height of shade, and other information pertaining to the status of the dynamic window and lighting control systems. The measured data were post-processed as follows prior to analysis.
2.1.2.2. Lighting Energy Use Identical indirect-direct lighting systems were used in all three rooms for both the reference and test conditions. The installed lighting system was irrelevant to the lighting energy use data presented in this study for several reasons but was dimmed in proportion to available daylight as would occur in actual building installations. The electric lighting contributions provided the proper room cavity luminance balance, particularly when the room luminance was predominately due to electric lighting, and so was useful in the assessment of visual comfort.
However, for lighting energy use comparisons, the lighting system introduced error into the energy use comparisons, primarily due to the differing photosensor response to the daylight distributions resulting from the innovative shading systems. In a conventional experimental test, the photosensor response to daylight or “gain” is determined by correlating the ceiling-mounted shielded photosensor signal to daylight illuminance at the workplane then used for closed-loop proportional control. The gain value may differ significantly between different types of shading systems and therefore affect the lighting system’s response to available daylight and hence energy use (Rubinstein et al. 1989, Lee et al. 1998).
To ensure equitable comparisons between shading systems, measured lighting energy data were adjusted by first deriving the daylight illuminance contribution to the workplane using

42
measured lighting power data then computing lighting energy use using a conventional relationship between power use and workplane illuminance. Quadratic fits between each illuminance sensor and electric lighting power levels were first derived from nighttime data where the electric lighting system was cycled to produce data at different levels of light output. These fits were corrected with a small factor to account for the differences in illuminance produced by the various shade types at varying heights. The fits had an average root-mean-square error of 3-7 lux in the 20-100% dimming range.
Once the electric lighting system’s contribution to illuminance was computed, daylight-only illuminance could be computed using total illuminance data measured during the experimental tests. Daylight illuminance at the four workplane illuminance sensors toward the rear of the room were averaged and then used to compute lighting energy use assuming a CEC Title-24-compliant lighting system with an installed lighting power density of 10.76 W/m2 (1.0 W/ft2) designed to provide 538 lux (50 fc) at the workplane. The linear dimming relationship was assumed to provide 100-0% light output for 100-20% power range (30-150 W) typical of dimmable electronic ballasts. Dimming systems can save more energy if allowed to switch “off” (i.e., standby power mode) but this study did not include this control option.
2.1.2.3. Window Solar and Thermal Loads Each test room is served by a dedicated fan coil unit which is designed to maintain stable room air temperatures to within 21±1°C (Figure 7). Cooling load measurements were made with a turbine flowmeter (Hoffer 3/8 in., linear flow range 0.75-7.5 gpm) and high stability thermistors (YSI 46016, <0.01°C drift at 70°C for 100 months). Heating, fan, lighting, and plug loads were measured with watt transducers (Ohio Semitronics GW5, 0.2% of reading). Each test room is surrounded by a secondary conditioned air space that serves as a thermal guard. This guard space is designed to provide near isothermal conditions surrounding each test room as would be typical of perimeter zone offices with an interior core zone. Details of the mechanical systems are described extensively in supporting documentation (Lee et al. 2006, Klems 2004).
The cooling or heating demand due to the window was measured for each test room. Measurements were corrected for thermal and room-to-room variations using a static thermal model. The resulting “dynamic net heat flow”, or standardized cooling demand, is expected to represent, on average, only the effects of solar gain (including internal solar storage) and thermal transmission through the window (including optical transmission of light back outward through the window) on a standardized room. Standardized is defined as results that have been corrected to eliminate small deviations from the standard interior temperature that occur in actual measurements. An extensive explanation of measurement, calculation, and error estimation methods is given in a prior publication (Lee et al. 2006) and in Klems 2008.
The average hourly cooling load was determined for each room by averaging the 1-min data over an hour then computing the hourly net heat flow or cooling load. The daily cooling load due to the window was then computed over the 12-h period defined by 6:00-18:00 (standard time), which was taken to represent the occupied hours of a commercial building. This is the period during which shading and lighting control would normally be utilized. Limiting the study in this way also had the practical advantage that shading systems could be rotated at night (which disturbs the thermal conditions of the test rooms).
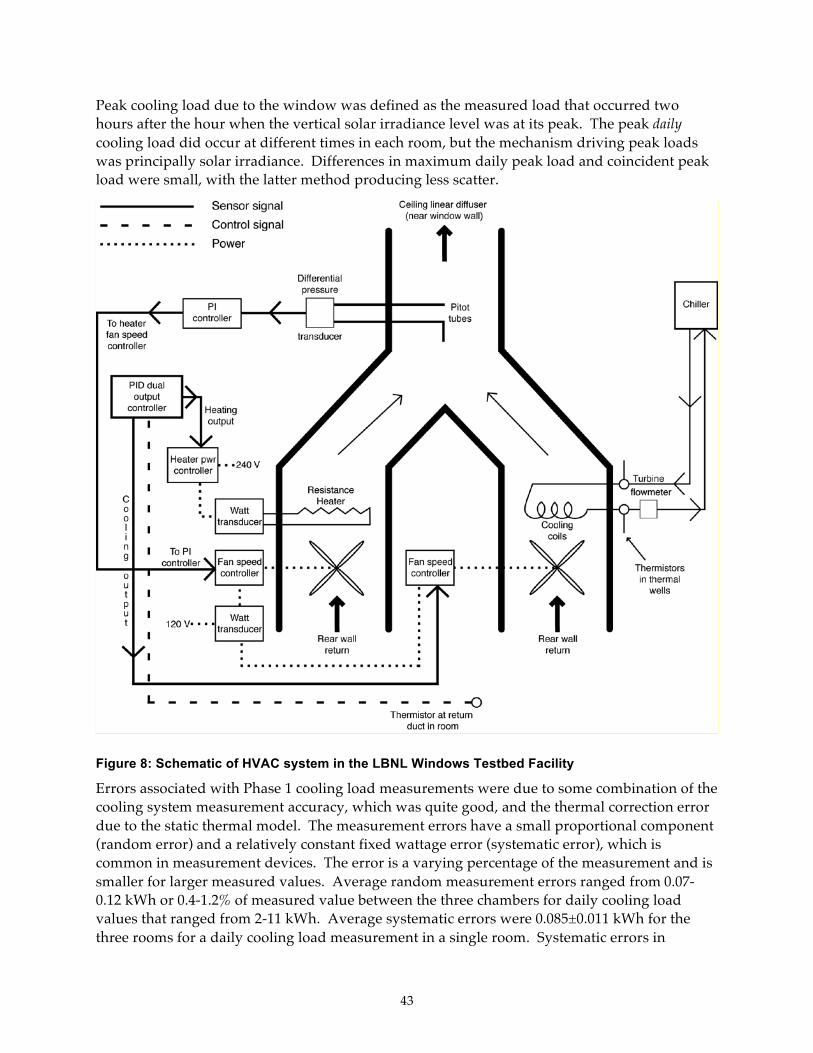
43
Peak cooling load due to the window was defined as the measured load that occurred two hours after the hour when the vertical solar irradiance level was at its peak. The peak daily cooling load did occur at different times in each room, but the mechanism driving peak loads was principally solar irradiance. Differences in maximum daily peak load and coincident peak load were small, with the latter method producing less scatter.
Figure 8: Schematic of HVAC system in the LBNL Windows Testbed Facility
Errors associated with Phase 1 cooling load measurements were due to some combination of the cooling system measurement accuracy, which was quite good, and the thermal correction error due to the static thermal model. The measurement errors have a small proportional component (random error) and a relatively constant fixed wattage error (systematic error), which is common in measurement devices. The error is a varying percentage of the measurement and is smaller for larger measured values. Average random measurement errors ranged from 0.07-0.12 kWh or 0.4-1.2% of measured value between the three chambers for daily cooling load values that ranged from 2-11 kWh. Average systematic errors were 0.085±0.011 kWh for the three rooms for a daily cooling load measurement in a single room. Systematic errors in
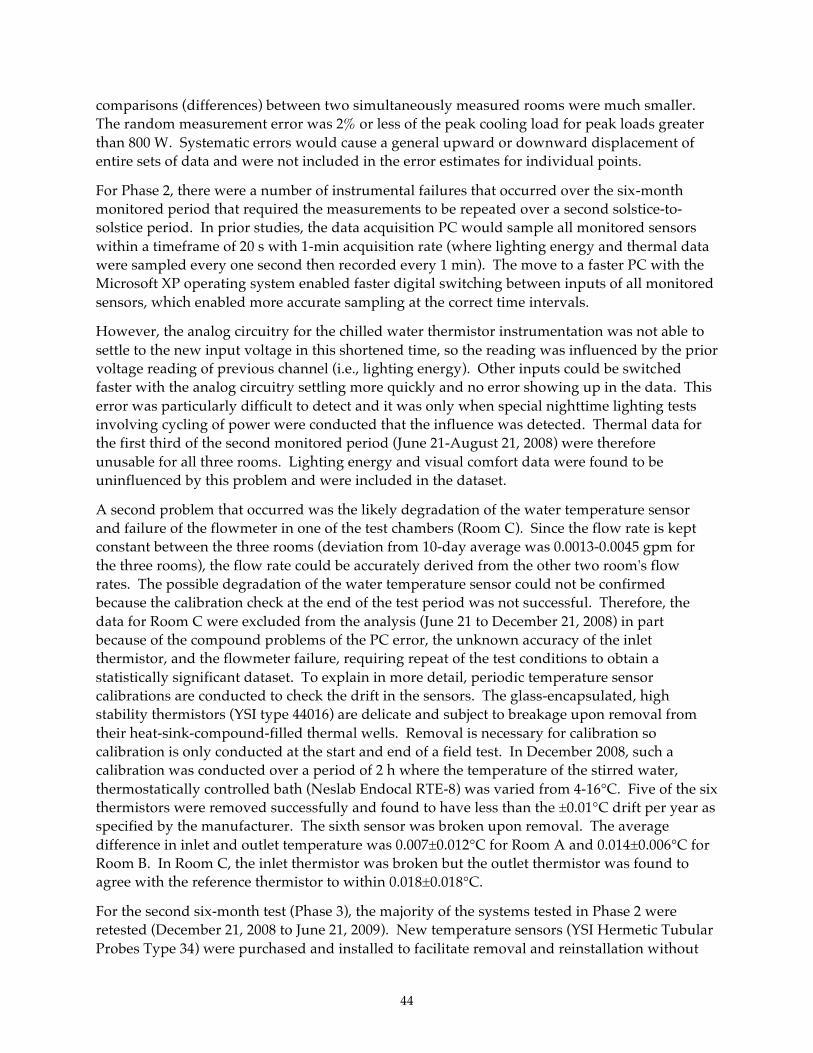
44
comparisons (differences) between two simultaneously measured rooms were much smaller. The random measurement error was 2% or less of the peak cooling load for peak loads greater than 800 W. Systematic errors would cause a general upward or downward displacement of entire sets of data and were not included in the error estimates for individual points.
For Phase 2, there were a number of instrumental failures that occurred over the six-month monitored period that required the measurements to be repeated over a second solstice-to-solstice period. In prior studies, the data acquisition PC would sample all monitored sensors within a timeframe of 20 s with 1-min acquisition rate (where lighting energy and thermal data were sampled every one second then recorded every 1 min). The move to a faster PC with the Microsoft XP operating system enabled faster digital switching between inputs of all monitored sensors, which enabled more accurate sampling at the correct time intervals.
However, the analog circuitry for the chilled water thermistor instrumentation was not able to settle to the new input voltage in this shortened time, so the reading was influenced by the prior voltage reading of previous channel (i.e., lighting energy). Other inputs could be switched faster with the analog circuitry settling more quickly and no error showing up in the data. This error was particularly difficult to detect and it was only when special nighttime lighting tests involving cycling of power were conducted that the influence was detected. Thermal data for the first third of the second monitored period (June 21-August 21, 2008) were therefore unusable for all three rooms. Lighting energy and visual comfort data were found to be uninfluenced by this problem and were included in the dataset.
A second problem that occurred was the likely degradation of the water temperature sensor and failure of the flowmeter in one of the test chambers (Room C). Since the flow rate is kept constant between the three rooms (deviation from 10-day average was 0.0013-0.0045 gpm for the three rooms), the flow rate could be accurately derived from the other two room's flow rates. The possible degradation of the water temperature sensor could not be confirmed because the calibration check at the end of the test period was not successful. Therefore, the data for Room C were excluded from the analysis (June 21 to December 21, 2008) in part because of the compound problems of the PC error, the unknown accuracy of the inlet thermistor, and the flowmeter failure, requiring repeat of the test conditions to obtain a statistically significant dataset. To explain in more detail, periodic temperature sensor calibrations are conducted to check the drift in the sensors. The glass-encapsulated, high stability thermistors (YSI type 44016) are delicate and subject to breakage upon removal from their heat-sink-compound-filled thermal wells. Removal is necessary for calibration so calibration is only conducted at the start and end of a field test. In December 2008, such a calibration was conducted over a period of 2 h where the temperature of the stirred water, thermostatically controlled bath (Neslab Endocal RTE-8) was varied from 4-16°C. Five of the six thermistors were removed successfully and found to have less than the ±0.01°C drift per year as specified by the manufacturer. The sixth sensor was broken upon removal. The average difference in inlet and outlet temperature was 0.007±0.012°C for Room A and 0.014±0.006°C for Room B. In Room C, the inlet thermistor was broken but the outlet thermistor was found to agree with the reference thermistor to within 0.018±0.018°C.
For the second six-month test (Phase 3), the majority of the systems tested in Phase 2 were retested (December 21, 2008 to June 21, 2009). New temperature sensors (YSI Hermetic Tubular Probes Type 34) were purchased and installed to facilitate removal and reinstallation without
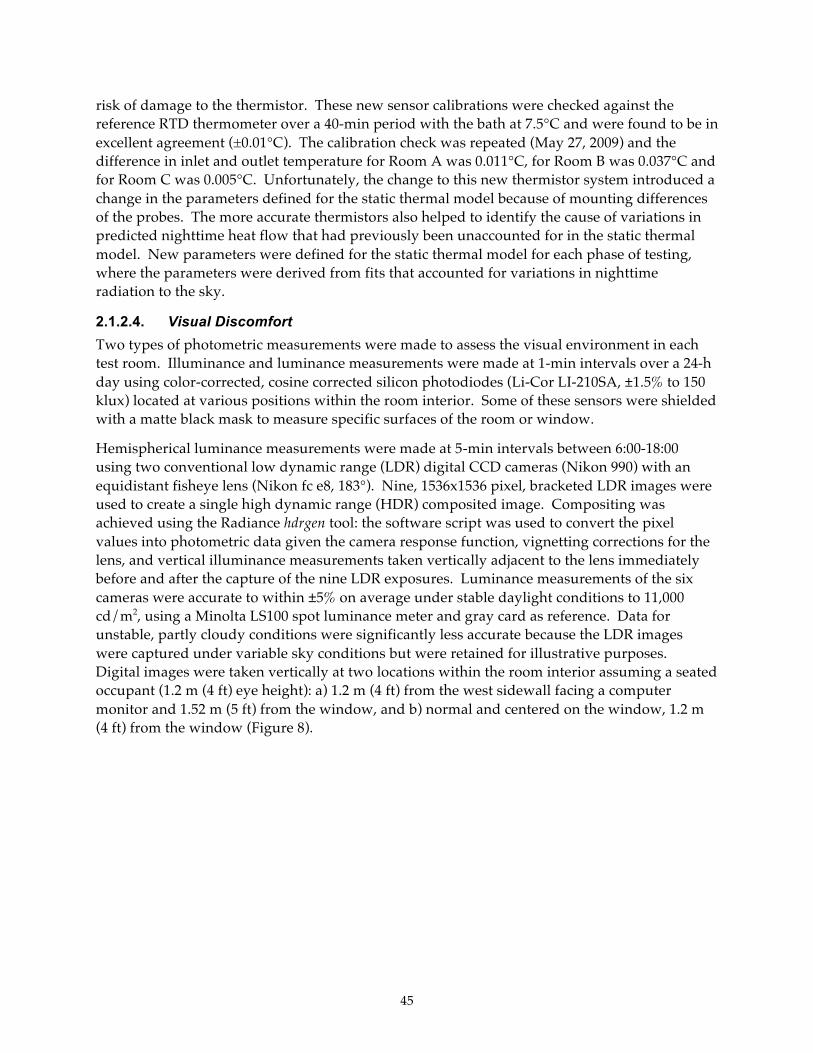
45
risk of damage to the thermistor. These new sensor calibrations were checked against the reference RTD thermometer over a 40-min period with the bath at 7.5°C and were found to be in excellent agreement (±0.01°C). The calibration check was repeated (May 27, 2009) and the difference in inlet and outlet temperature for Room A was 0.011°C, for Room B was 0.037°C and for Room C was 0.005°C. Unfortunately, the change to this new thermistor system introduced a change in the parameters defined for the static thermal model because of mounting differences of the probes. The more accurate thermistors also helped to identify the cause of variations in predicted nighttime heat flow that had previously been unaccounted for in the static thermal model. New parameters were defined for the static thermal model for each phase of testing, where the parameters were derived from fits that accounted for variations in nighttime radiation to the sky.
2.1.2.4. Visual Discomfort Two types of photometric measurements were made to assess the visual environment in each test room. Illuminance and luminance measurements were made at 1-min intervals over a 24-h day using color-corrected, cosine corrected silicon photodiodes (Li-Cor LI-210SA, ±1.5% to 150 klux) located at various positions within the room interior. Some of these sensors were shielded with a matte black mask to measure specific surfaces of the room or window.
Hemispherical luminance measurements were made at 5-min intervals between 6:00-18:00 using two conventional low dynamic range (LDR) digital CCD cameras (Nikon 990) with an equidistant fisheye lens (Nikon fc e8, 183°). Nine, 1536x1536 pixel, bracketed LDR images were used to create a single high dynamic range (HDR) composited image. Compositing was achieved using the Radiance hdrgen tool: the software script was used to convert the pixel values into photometric data given the camera response function, vignetting corrections for the lens, and vertical illuminance measurements taken vertically adjacent to the lens immediately before and after the capture of the nine LDR exposures. Luminance measurements of the six cameras were accurate to within ±5% on average under stable daylight conditions to 11,000 cd/m2, using a Minolta LS100 spot luminance meter and gray card as reference. Data for unstable, partly cloudy conditions were significantly less accurate because the LDR images were captured under variable sky conditions but were retained for illustrative purposes. Digital images were taken vertically at two locations within the room interior assuming a seated occupant (1.2 m (4 ft) eye height): a) 1.2 m (4 ft) from the west sidewall facing a computer monitor and 1.52 m (5 ft) from the window, and b) normal and centered on the window, 1.2 m (4 ft) from the window (Figure 8).

46
Figure 9: Typical Nikon990 setup for LDR image acquisition with adjacent vertical illuminance sensor (left). View of test room showing window-facing and VDT-facing camera orientation (right).
Discomfort due to Luminance Contrasts
Monitored luminance data were used to assess the contrast ratios between task and surrounding surfaces within the occupant’s field of view. For office occupancies with computer-based tasks, the luminous environment must be controlled to minimize visual discomfort due to large luminance contrasts between the task (computer display or visual display terminal (VDT)) and surrounding environment. Computer-based, self-luminous tasks require significantly lower surrounding luminance levels compared to paper-based or other conventional tasks, so this assessment of visual discomfort is conservative. Maximum contrast ratios recommended by the IESNA are 1:3, 1:10, and 1:40 between the task and immediately adjacent surfaces (0-30° field of view), background surfaces (30-60°), and remote surfaces (60-90°), respectively. The VDT was defined by a flat, high-brightness, low reflectance monitor with an average luminance of 200 cd/m2. Therefore, a maximum luminance of 2000 cd/m2 was set for remote surfaces (i.e., the window) and 600 cd/m2 for adjacent surfaces. To further substantiate use of these values, prior research suggests that luminance levels of surfaces within the occupant’s field of view be kept to no more than 2000-5000 cd/m2, assuming use of a low-reflectance, high-brightness computer displays with an average brightness of 200 cd/m2 (Gall et al. 2000). In a separate experiment, a window luminance of 2000 cd/m2 was found to be the threshold where there was a 50% probability that the occupant would lower the blinds to reduce glare (Clear et al. 2006). Given these alternate findings, the maximum contrast ratios were not strictly applied according to IESNA guidelines. Window regions within the 60-90° field of view were evaluated using the 1:10 limit (2000 cd/m2), not 1:40 limit (8000 cd/m2), for the view facing the VDT on the west sidewall. Window regions facing the window were evaluated using the absolute luminance limit of 2000 cd/m2.
Average whole window luminance facing the window was computed using the 1-min data from shielded illuminance sensors located 2.29 m (7.5 ft) from the window, centered on the window, at seated eye height (1.2 m (4 ft)). The shield was constructed to measure average luminance from the vision portion of the window (0.76-2.74 m (2.5-9 ft) height above the floor and 3.05 m (10 ft) width). Average region luminance was computed for specific regions of the HDR image defined by bitmap masks (Figure 9). For each day, the percentage of time between
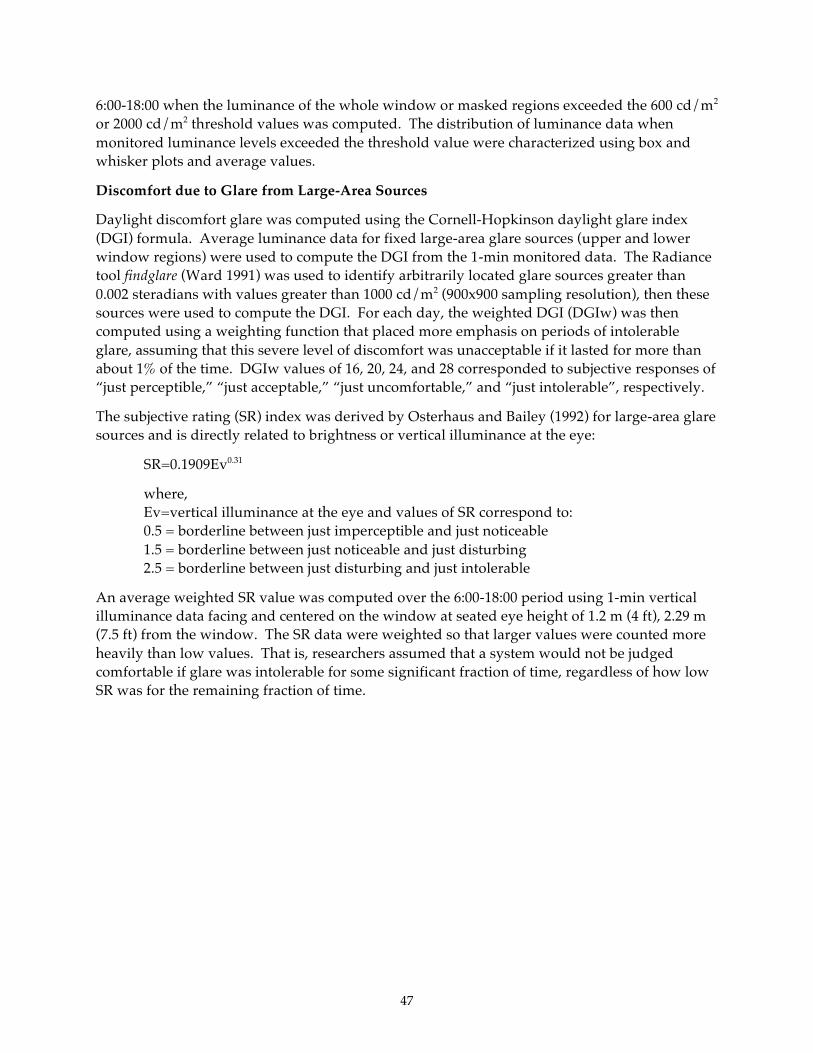
47
6:00-18:00 when the luminance of the whole window or masked regions exceeded the 600 cd/m2 or 2000 cd/m2 threshold values was computed. The distribution of luminance data when monitored luminance levels exceeded the threshold value were characterized using box and whisker plots and average values.
Discomfort due to Glare from Large-Area Sources
Daylight discomfort glare was computed using the Cornell-Hopkinson daylight glare index (DGI) formula. Average luminance data for fixed large-area glare sources (upper and lower window regions) were used to compute the DGI from the 1-min monitored data. The Radiance tool findglare (Ward 1991) was used to identify arbitrarily located glare sources greater than 0.002 steradians with values greater than 1000 cd/m2 (900x900 sampling resolution), then these sources were used to compute the DGI. For each day, the weighted DGI (DGIw) was then computed using a weighting function that placed more emphasis on periods of intolerable glare, assuming that this severe level of discomfort was unacceptable if it lasted for more than about 1% of the time. DGIw values of 16, 20, 24, and 28 corresponded to subjective responses of “just perceptible,” “just acceptable,” “just uncomfortable,” and “just intolerable”, respectively.
The subjective rating (SR) index was derived by Osterhaus and Bailey (1992) for large-area glare sources and is directly related to brightness or vertical illuminance at the eye:
SR=0.1909Ev0.31
where, Ev=vertical illuminance at the eye and values of SR correspond to: 0.5 = borderline between just imperceptible and just noticeable 1.5 = borderline between just noticeable and just disturbing 2.5 = borderline between just disturbing and just intolerable
An average weighted SR value was computed over the 6:00-18:00 period using 1-min vertical illuminance data facing and centered on the window at seated eye height of 1.2 m (4 ft), 2.29 m (7.5 ft) from the window. The SR data were weighted so that larger values were counted more heavily than low values. That is, researchers assumed that a system would not be judged comfortable if glare was intolerable for some significant fraction of time, regardless of how low SR was for the remaining fraction of time.

48
Figure 10: The average luminance for each of the above zones was computed from each HDR image using a bitmap mask (VDT-view).
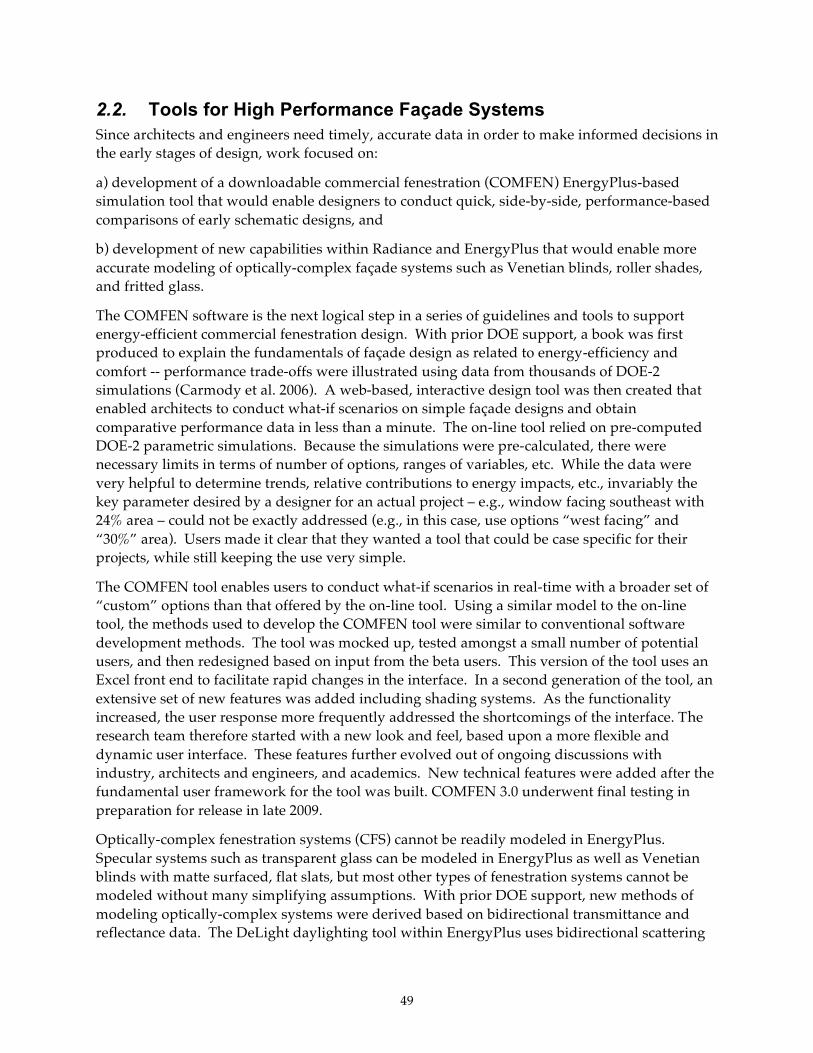
49
2.2. Tools for High Performance Façade Systems Since architects and engineers need timely, accurate data in order to make informed decisions in the early stages of design, work focused on:
a) development of a downloadable commercial fenestration (COMFEN) EnergyPlus-based simulation tool that would enable designers to conduct quick, side-by-side, performance-based comparisons of early schematic designs, and
b) development of new capabilities within Radiance and EnergyPlus that would enable more accurate modeling of optically-complex façade systems such as Venetian blinds, roller shades, and fritted glass.
The COMFEN software is the next logical step in a series of guidelines and tools to support energy-efficient commercial fenestration design. With prior DOE support, a book was first produced to explain the fundamentals of façade design as related to energy-efficiency and comfort -- performance trade-offs were illustrated using data from thousands of DOE-2 simulations (Carmody et al. 2006). A web-based, interactive design tool was then created that enabled architects to conduct what-if scenarios on simple façade designs and obtain comparative performance data in less than a minute. The on-line tool relied on pre-computed DOE-2 parametric simulations. Because the simulations were pre-calculated, there were necessary limits in terms of number of options, ranges of variables, etc. While the data were very helpful to determine trends, relative contributions to energy impacts, etc., invariably the key parameter desired by a designer for an actual project – e.g., window facing southeast with 24% area – could not be exactly addressed (e.g., in this case, use options “west facing” and “30%” area). Users made it clear that they wanted a tool that could be case specific for their projects, while still keeping the use very simple.
The COMFEN tool enables users to conduct what-if scenarios in real-time with a broader set of “custom” options than that offered by the on-line tool. Using a similar model to the on-line tool, the methods used to develop the COMFEN tool were similar to conventional software development methods. The tool was mocked up, tested amongst a small number of potential users, and then redesigned based on input from the beta users. This version of the tool uses an Excel front end to facilitate rapid changes in the interface. In a second generation of the tool, an extensive set of new features was added including shading systems. As the functionality increased, the user response more frequently addressed the shortcomings of the interface. The research team therefore started with a new look and feel, based upon a more flexible and dynamic user interface. These features further evolved out of ongoing discussions with industry, architects and engineers, and academics. New technical features were added after the fundamental user framework for the tool was built. COMFEN 3.0 underwent final testing in preparation for release in late 2009.
Optically-complex fenestration systems (CFS) cannot be readily modeled in EnergyPlus. Specular systems such as transparent glass can be modeled in EnergyPlus as well as Venetian blinds with matte surfaced, flat slats, but most other types of fenestration systems cannot be modeled without many simplifying assumptions. With prior DOE support, new methods of modeling optically-complex systems were derived based on bidirectional transmittance and reflectance data. The DeLight daylighting tool within EnergyPlus uses bidirectional scattering

50
distribution functions (BSDF) to model the daylighting performance in simple spaces (Carroll and Hitchcock 2005). In 2008, a research version of Window 6 was released that enabled users to create a single BSDF output file from a window system made up of arbitrary layers (e.g., frame, glass, interior roller shade). This project continued engine development work to enable modeling of CFS in both Radiance and EnergyPlus in collaboration with other related software development activities.
2.3. Market Connections The goal of this task was to make the knowledge gained, experimental results and lessons learned available to key decision-makers and end-users.
The primary method of technology transfer was to address two critical market barriers: lack of objective third-party information (Section 2.1) and lack of adequate simulation tools (Section 2.2) to quantify energy- and non-energy impacts of innovative façade solutions. With this information, key stakeholders (e.g., architects, engineers, manufacturers, facility managers, building owners, utilities) will be able to make informed decisions when selecting or promoting these technologies and quickly model and quantify what the potential energy, peak demand, and comfort impacts are likely to be.
Additional methods were used to achieve technology transfer. LBNL staff actively pursued collaborations with the Emerging Technologies Coordinating Council (ETCC) and the University of California (UC)/ California State University (CSU) Technology Demonstration program, which are both key mechanisms for transfer of PIER emerging technologies. In parallel, LBNL also pursued direct collaborations with A/E teams and building owners on showcase demonstrations.
Market connections were also accomplished through active engagement with the outside industry via the project advisory committee (PAC), one-on-one discussions with manufacturers, and meetings at conferences to solicit feedback on project direction and receive input on industry needs. Project results were disseminated using a variety of media: conference and journal publications, seminars, tours at LBNL, television and radio interviews, and publications in trade press.

51
3.0 Project Outcomes 3.1. Full-scale Field Testing of Interior and Exterior Shading Systems This section presents the monitored results of the full scale field testing of interior shading systems (Section 3.1.1) and exterior shading systems (Section 3.1.2), then discusses systems engineering issues associated with motorized shading and automation (Section 3.1.3). Summary findings are then given for each shading type under Section 3.1.4.
3.1.1. Interior Shading Systems Field data were collected under predominantly clear sky conditions so findings are illustrative of south-facing perimeter office zones in a sunny climate (latitude 38°N). The number of clear days per window treatment was examined for the Phase 1 test and it was found that the auto-RS condition had significantly fewer clear days than the remaining conditions: 42% of the measured days were clear compared to an average of 61% clear days for all systems. Comparisons between the auto-RS system and other systems were not adjusted for these differences in sky conditions. A second phase of tests was conducted with the auto-RS system and these data were included in the final analysis.
The innovative shading systems use a variety of tactics, from optics, subdivision of the window into view and daylighting zones, to automated controls in order to achieve a more balanced and comfortable luminous environment. Data from this experimental test quantify how these innovative solutions perform compared to conventional shading solutions under real sun and sky conditions and demonstrate the sensitivity of tradeoffs between daylight admission and window heat gain rejection while meeting basic visual comfort requirements.
3.1.1.1. Lighting Energy Use and Demand With daylight dimming controls, lighting energy savings were significant compared to a non-dimming case. All innovative interior shading systems yielded average savings on the order of 43-69%, or an average lighting power density (LPD) of 0.31-0.38 W/ft2-floor in a 4.57-m- (15-ft-) deep perimeter zone over the 6:00-18:00 period (Table 3, Figure 10). Differences in lighting energy use between conventional and innovative Venetian blind solutions with the same daylight dimming controls were small: -11% to 5% or 0.01-0.04 W/ft2 variation.
For all Venetian blind systems and the automated roller shade system, lighting energy use was greater in the winter and at or near minimum levels in the summer on clear and cloudy days. This is counterintuitive for south-facing facades on sunny days, since the incident daylight levels are greater during the winter than the summer. However, the seasonal slat tilt angles of the static blind systems and shade or blind position of the automated systems were more closed during the winter to block low-angle direct sun, resulting in greater lighting energy use. For the reference roller shade (h=0.76 m (30 in) above the floor), the trend was opposite: lighting energy use was near minimum levels on clear days during the winter period and greater during the summer in proportion to incident daylight levels because the 3%-open fabric shade modulates light like a filter.

52
These observations have two possible implications. Despite the large-area windows and high transmittance glass, some types of interior shading systems can reduce the inherent daylight potential of a façade (LPD=0.57 W/ft2 reference-RS; LPD=0.31 W/ft2 auto-split-mir-VB1).
One also intuitively assumes that the greater the levels of daylight availability, the greater the lighting energy savings: summer being greater than winter. But the available flux (vertical illuminance), solar angle of incidence on the window, and mode of how direct sun is blocked by the shading device all play a role in interior daylight levels and lighting energy use. Proper modeling of the shade type and mode of operation is needed to obtain accurate estimates of energy use and summer peak demand.
3.1.1.2. Window Solar and Thermal Loads Because some innovative shading systems were more “open” than the reference case and thus obstructed less daylight, daily cooling loads due to window solar and thermal heat gains were increased by 1-3% (Table 3, Figure 11). The auto-RS, auto-VB, and diffuse-VB, however, decreased loads by 3-9%4, 22%, and 15%, respectively, in part because they exerted more control over solar loads than the reference case. The automated systems blocked direct sun and maintained daylight illuminance to within a narrow range so its slat angle was more closed than the reference blind during clear sunny periods.
Peak window cooling loads were reduced by the auto-RS, auto-VB, and diffuse-VB by 8%, 12%, and 14%, respectively, or a maximum of 1.38 W/ft2-floor or 2.9 W/ft2-glass, with the remaining systems having small to no effect (Table 3, Figure 12). The significance of these increases or decreases depends on the relative efficiency of the cooling system versus the lighting system: lighting energy savings may be significantly greater than cooling energy use increases if an inefficient HVAC system is insensitive to small increases in loads.
The innovative, manually-operated shading systems produced small differences in cooling loads because the reference case shading systems were positioned to block direct sun, meeting minimum thermal and visual comfort requirements. The test cases produced not nearly as marked a difference in window cooling loads compared to lighting energy use. This reflects a well known fact that indoor shading systems combined with a low-e double glazing system have a limited range of possible variation in rejecting solar energy. They can only exclude solar energy by reflecting it out through the glazing (which has a hemispherical solar transmittance considerably smaller than 1: Tsol=0.316). This means that the daily cooling load can vary among systems only to the extent that their effective reflectance varies. Because peak cooling load also depends on how the transmitted solar gain is distributed around the room, there is somewhat more possibility for variation, but this is limited by the fact that the construction of a typical office is relatively uniform in terms of solar storage (partition walls, carpeted floors). One might anticipate the auto-split-mir-VB to show marked differences, but the high-reflectance, mirrored slats were used only on the upper clerestory zone and were operated not to exclude but to redirect sunlight into the space.
4 The interior automated roller shade was tested for a second phase, which had more representative sunny sky conditions for this climate than this phase of testing. See Table 5 for these data.
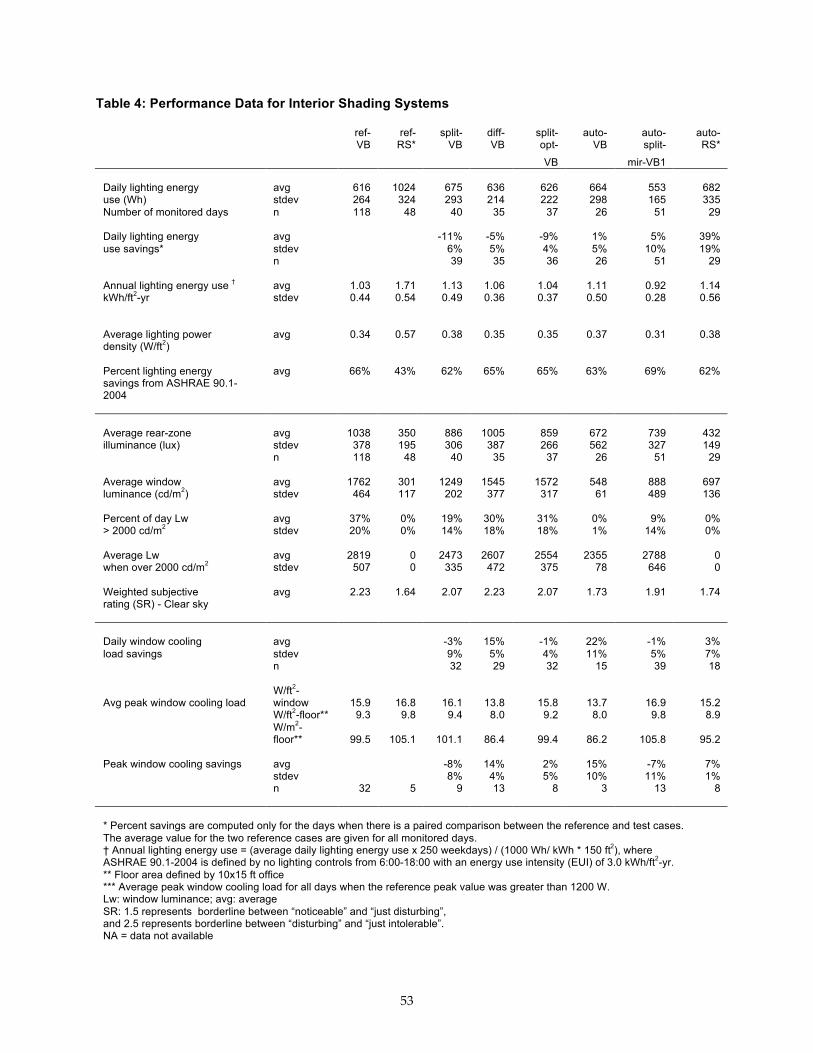
53
Table 4: Performance Data for Interior Shading Systems
ref-VB
ref-RS*
split-VB
diff-VB
split-opt-
auto-VB
auto-split-
auto-RS*
VB mir-VB1 Daily lighting energy avg 616 1024 675 636 626 664 553 682 use (Wh) stdev 264 324 293 214 222 298 165 335 Number of monitored days n 118 48 40 35 37 26 51 29 Daily lighting energy avg -11% -5% -9% 1% 5% 39% use savings* stdev 6% 5% 4% 5% 10% 19% n 39 35 36 26 51 29 Annual lighting energy use † avg 1.03 1.71 1.13 1.06 1.04 1.11 0.92 1.14 kWh/ft2-yr stdev 0.44 0.54 0.49 0.36 0.37 0.50 0.28 0.56 Average lighting power avg 0.34 0.57 0.38 0.35 0.35 0.37 0.31 0.38 density (W/ft2) Percent lighting energy avg 66% 43% 62% 65% 65% 63% 69% 62% savings from ASHRAE 90.1-2004 Average rear-zone avg 1038 350 886 1005 859 672 739 432 illuminance (lux) stdev 378 195 306 387 266 562 327 149 n 118 48 40 35 37 26 51 29 Average window avg 1762 301 1249 1545 1572 548 888 697 luminance (cd/m2) stdev 464 117 202 377 317 61 489 136 Percent of day Lw avg 37% 0% 19% 30% 31% 0% 9% 0% > 2000 cd/m2 stdev 20% 0% 14% 18% 18% 1% 14% 0% Average Lw avg 2819 0 2473 2607 2554 2355 2788 0 when over 2000 cd/m2 stdev 507 0 335 472 375 78 646 0 Weighted subjective avg 2.23 1.64 2.07 2.23 2.07 1.73 1.91 1.74 rating (SR) - Clear sky Daily window cooling avg -3% 15% -1% 22% -1% 3% load savings stdev 9% 5% 4% 11% 5% 7% n 32 29 32 15 39 18
Avg peak window cooling load W/ft2-window 15.9 16.8 16.1 13.8 15.8 13.7 16.9 15.2
W/ft2-floor** 9.3 9.8 9.4 8.0 9.2 8.0 9.8 8.9
W/m2-floor** 99.5 105.1 101.1 86.4 99.4 86.2 105.8 95.2
Peak window cooling savings avg -8% 14% 2% 15% -7% 7% stdev 8% 4% 5% 10% 11% 1% n 32 5 9 13 8 3 13 8 * Percent savings are computed only for the days when there is a paired comparison between the reference and test cases. The average value for the two reference cases are given for all monitored days. † Annual lighting energy use = (average daily lighting energy use x 250 weekdays) / (1000 Wh/ kWh * 150 ft2), where ASHRAE 90.1-2004 is defined by no lighting controls from 6:00-18:00 with an energy use intensity (EUI) of 3.0 kWh/ft2-yr. ** Floor area defined by 10x15 ft office *** Average peak window cooling load for all days when the reference peak value was greater than 1200 W. Lw: window luminance; avg: average SR: 1.5 represents borderline between “noticeable” and “just disturbing”, and 2.5 represents borderline between “disturbing” and “just intolerable”. NA = data not available

54
Figure 11: Interior shading: Daily lighting energy use (Wh) per test condition for the 6:00-18:00 period.

55
Figure 12: Interior shading: Daily cooling load due to solar and thermal heat gains through the window (kWh) over the 6:00-18:00 period.
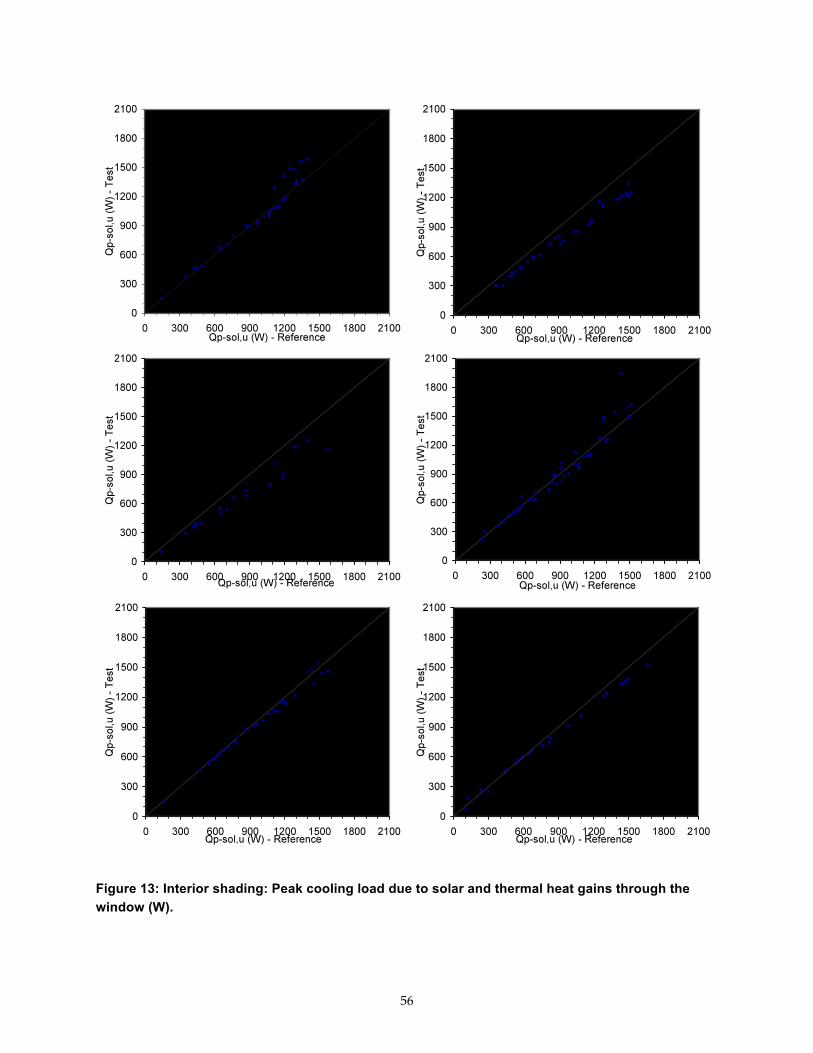
56
Figure 13: Interior shading: Peak cooling load due to solar and thermal heat gains through the window (W).
57
3.1.1.3. Visual Discomfort Based on the 1-min monitored shielded sensor data, the auto-RS, reference-RS, and auto-VB systems maintained average whole window luminance levels facing the window below the 2000 cd/m2 threshold level over the six-month monitored period. The roller shade fabric had an openness factor of 3%, so when lowered had a low average luminance level (small intense glare sources, such as the orb of the sun, could not be detected with this method). The auto-RS was lowered or the auto-VB slat angles were adjusted to block direct sun and maintain daylight levels within a specified range. This mode of control was sufficient to control average whole window luminance. Note that the reference-VB and auto-VB were identical systems with the exception of automatic control and yet there were significant differences in window luminance due simply to the adjustment of slat angle (Table 3).
For the remaining systems, the average whole window luminance exceeded the 2000 cd/m2 level for a significant fraction of the day. The worst were the reference-VB and diffuse-VB systems where the threshold was exceeded, on average 37% and 30% of the day with average luminance levels of 2819 cd/m2 and 2607 cd/m2, respectively. The data represent a worst-case position where the occupant faces and has a large solid angle view of the window but yields lower luminance levels since the average includes both the dark lower and bright upper regions of the window for the split shade configurations.
Analysis based on HDR Dataset
Use of the 5-min high dynamic range (HDR) luminance data provided more detailed information on the distribution of luminance within a seated occupant’s field of view for different types of sky conditions. The luminance data given here are for the occupant facing the west side wall where a computer monitor was situated, which is a less extreme case than facing the window.
Region Luminance
Under clear sky conditions, the two automated blind systems maintained average luminance levels of the upper, middle, and lower regions of the window below 2000 cd/m2 (5% of the day exceedance or less), whereas the static blind systems exceeded the threshold 16-52% of the day with average values that were significantly greater than the automated systems (Table 4, Figure 13). The automated roller shade exceeded the threshold value less frequently than the static blind systems (8-16% of the day), but had comparable average luminance levels in the middle and upper regions of the window during the periods of exceedance.
Between the automated blind and roller shade systems, the percentage of day and level of exceedance for the auto-RS were significantly greater in the three regions compared to the auto-VB and auto-split-mir-VB1. This was due to two reasons: a) the height of the auto-RS varied whereas only the slat angles of the auto-VB were varied and b) the 3%-open, light gray fabric of the roller shade itself became luminous and a large-area source of glare when backlit by the sun whereas the slats of the blinds were opaque and better able to control overall average luminance levels. The average luminance of the blinds was a combination of both the luminance of direct views of the exterior surroundings including the sky and the luminance of the slats.
58
The upper region of the window wall for the split zoned daylighting systems is a potential cause for direct source glare, particularly for occupants seated further from the window wall if sky views are not shielded from direct view. The position of the HDR measurements was 1.52 m (5 ft) from the window and so did not have the same relative position of view as one seated farther from the windows. Three blind systems were used, with the slat geometry, angle, and surface treatment differing between the systems. The auto-split-mir-VB1 controlled upper window luminance the best of the three (5% of day, 2572 cd/m2 average luminance) having a matte gray paint on the underside of the slats, with the split-opt-VB (16%, 3099 cd/m2) and split-VB (39%, 3722 cd/m2) following in performance. The translucent diffusing panel in the upper region (diff-VB) significantly exceeded the threshold value on average 30% of day with an average luminance of 4702 cd/m2 and a mean value of the upper quartile of observations at 8540 cd/m2.
For partly cloudy to overcast sky conditions, data are illustrative because there are significantly fewer number of days per test condition (n=1-10) and the actual sky conditions with a particular sky type designation (e.g., “dynamic sky”) can vary significantly between test conditions. These data are best analyzed using paired same-day comparisons with the reference case, which was done with the daylight glare index (DGI) analysis.
The two retractable automated shading systems (auto-RS and auto-split-mir-VB) provided significantly less comfortable conditions under variable and overcast sky conditions. For example, under overcast sky conditions the upper window luminance of the static shaded systems was well controlled, exceeding the 2000 cd/m2 threshold for no more than 2% of the day and with average luminance during the periods of exceedance that were near the 2000 cd/m2 value. The retractable automated systems, however, significantly exceeded the threshold value 22-40% of the day with average exceedance levels of 3785-4155 cd/m2. The auto-split-mir-VB was fully raised when the exterior vertical flux fell below a specified threshold value leading to 40% of day exceedance with average levels of 3785 cd/m2 (n=3). An example is shown in Figure 14. The automated roller shade was raised partially or fully depending the exterior vertical illuminance level and interior daylight illuminance level resulting in 33% of day exceedance and average levels of 4155 cd/m2 (n=7).
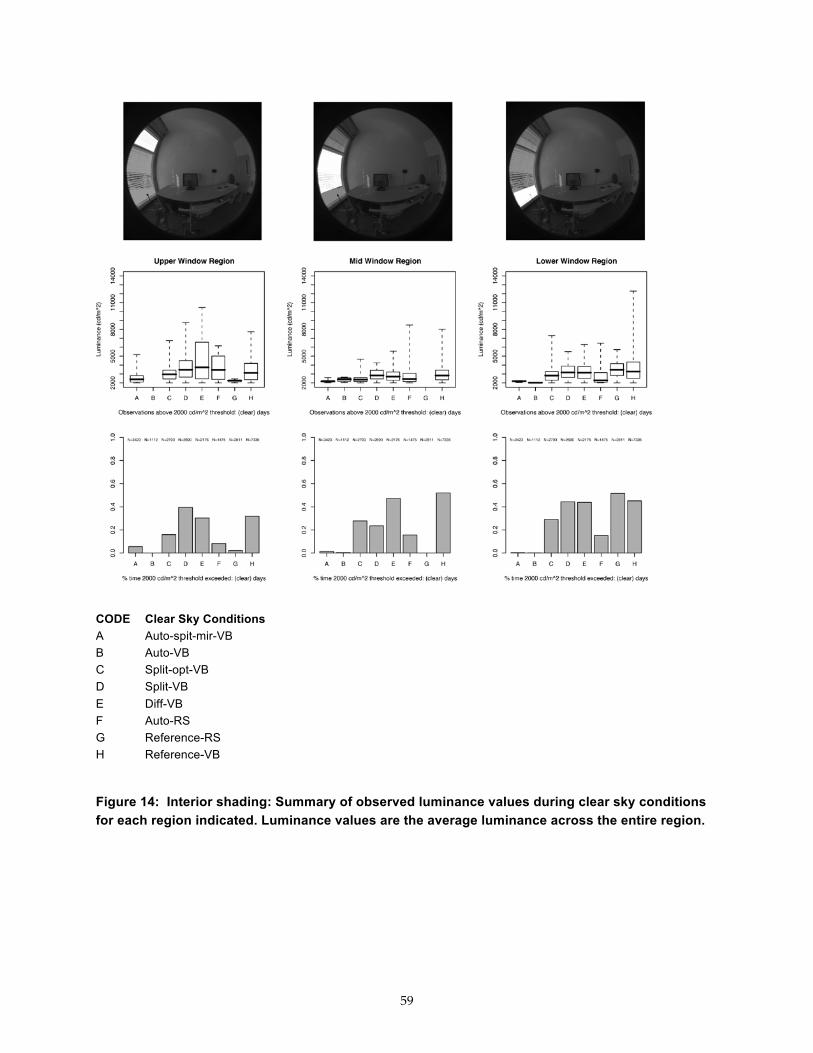
59
CODE Clear Sky Conditions A Auto-spit-mir-VB B Auto-VB C Split-opt-VB D Split-VB E Diff-VB F Auto-RS G Reference-RS H Reference-VB
Figure 14: Interior shading: Summary of observed luminance values during clear sky conditions for each region indicated. Luminance values are the average luminance across the entire region.

60
Table 5: Region Luminance Data for VDT Views; Interior Shading Systems Zone Upper Window Mid Window Lower Window Threshold (cd/m^2) 2000 2000 2000
Code Test Condition N (D
ays)
% T
ime
Abo
ve T
hres
h.
Mea
n Lu
mi.
Abo
ve th
resh
.
StD
ev. o
f Lum
i. A
bove
Thr
esh.
Mea
n Lu
mi.
of U
pper
Qua
rtile
Max
Lum
inan
ce
% T
ime
Abo
ve T
hres
h.
Mea
n Lu
mi.
Abo
ve th
resh
.
StD
ev. o
f Lum
i. A
bove
Thr
esh.
Mea
n Lu
mi.
of U
pper
Qua
rtile
Max
Lum
inan
ce
% T
ime
Abo
ve T
hres
h.
Mea
n Lu
mi.
Abo
ve th
resh
.
StD
ev. o
f Lum
i. A
bove
Thr
esh.
Mea
n Lu
mi.
of U
pper
Qua
rtile
Max
Lum
inan
ce
Clear Sky Conditions
A auto-split-mir-VB 28 5% 2572 599.5 3368 5172.7 1% 2189 135.3 2365 2595.2 0% 2180 80.01 2245 2274.6
B auto-VB 9 0% 0 0 0 0 0% 0 0 0 0 0% 2024 NA NaN 2024.3
C split-opt-VB 23 16% 3099 926.3 4319 6737.6 28% 2495 508.2 3181 4648.4 29% 3066 948.8 4380 7311.7
D split-VB 22 39% 3722 1338 5576 8758.4 23% 2929 595.8 3747 4242 44% 3286 854.9 4470 5515.1
E diffuse-VB 18 30% 4702 2606 8540 10462.4 47% 2913 811.9 4078 5566.8 44% 3363 1068 4910 6312.1
F auto-RS 12 8% 3770 1349 5552 6146.3 16% 2666 754.5 3483 8486.3 15% 2610 644.3 3454 6457.2
G ref-RS 23 2% 2230 129.3 2371 2455.5 0% 0 0 0 0 52% 3470 810.8 4509 5739.4
H ref.VB 59 32% 3418 1203 5167 7732.7 52% 3052 898.9 4320 8018 45% 3623 1418 5551 12291.3 Cloudy Sky Conditions
A auto-split-mir-VB 5 30% 4117 1568 6306 9431.4 11% 2740 512.8 3329 4353 0% 3280 364 3023 3537.7
B auto-VB 1 0% 0 0 0 0 27% 2511 356.1 2965 3501.2 4% 2500 211.1 2550 2758.4
C split-opt-VB 3 12% 4837 1549 6391 6487 10% 3752 613.6 4281 4319.9 12% 3783 975.2 4774 4821.9
D split-VB 0 0% 0 0 0 0 0% 0 0 0 0 0% 0 0 0 0
E diffuse-VB 1 8% 2227 241.4 2263 2902.9 19% 2621 442.1 3028 3888.4 1% 2349 NA NaN 2349.5
F auto-RS 3 17% 2629 468.4 3230 4236.6 17% 2369 287.5 2744 2995.4 1% 2377 491 2098 2943.5
G ref-RS 7 0% 2038 NA NaN 2037.6 0% 0 0 0 0 6% 2734 604.9 3525 4220.5
H ref.VB 6 16% 4867 4557 6999 46104.4 28% 3903 2035 5864 23830.8 18% 5526 2971 9398 18700 Dynamic Sky Conditions
A auto-split-mir-VB 7 27% 3737 2097 6360 20683.9 9% 3125 1300 3939 12773.7 1% 3233 3427 2379 13555.8
B auto-VB 4 1% 2390 183.9 2502 2604 2% 2540 463.4 2970 3349.1 4% 3073 1067 4493 5194
C split-opt-VB 10 8% 2465 377.7 2998 3485.3 35% 2687 452.9 3270 4425.2 25% 2992 1030 4343 7962.2
D split-VB 8 32% 3807 1259 5592 7168.2 24% 3151 719.3 4052 4728.7 32% 3397 1170 5116 6723.5
E diffuse-VB 4 45% 4567 1930 7223 9782 26% 4035 1081 5287 6074.1 33% 3689 1242 5468 6103.4
F auto-RS 4 24% 4202 2029 7178 10455.1 33% 3858 2247 6842 14518.4 13% 2745 597.6 3499 4479.3
G ref-RS 8 1% 2305 179.3 2393 2554.8 0% 0 0 0 0 38% 3210 820.6 4298 7265.9
H ref.VB 16 40% 4250 2127 6901 15674.5 55% 3949 1905 6084 16385.9 43% 4412 2221 7374 14993.4
Overcast Sky Conditions
A auto-split-mir-VB 3 40% 3785 1372 5708 8624.3 8% 2616 369.4 3000 3431.8 0% 2713 NA NaN 2713.2 B auto-VB 1 0% 0 0 0 0 0% 0 0 0 0 0% 0 0 0 0
C split-opt-VB 2 0% 0 0 0 0 0% 0 0 0 0 0% 0 0 0 0
D split-VB 3 0% 0 0 0 0 0% 0 0 0 0 0% 0 0 0 0
E diffuse-VB 2 1% 2177 237 2009 2344.6 20% 2868 468.3 3412 4051.8 2% 2391 355.8 2387 3062.4
F auto-RS 7 22% 4155 2193 7327 13380.1 12% 3951 2194 6881 11955.6 1% 2161 241.6 2367 2730.2
G ref-RS 5 0% 0 0 0 0 0% 0 0 0 0 0% 0 0 0 0
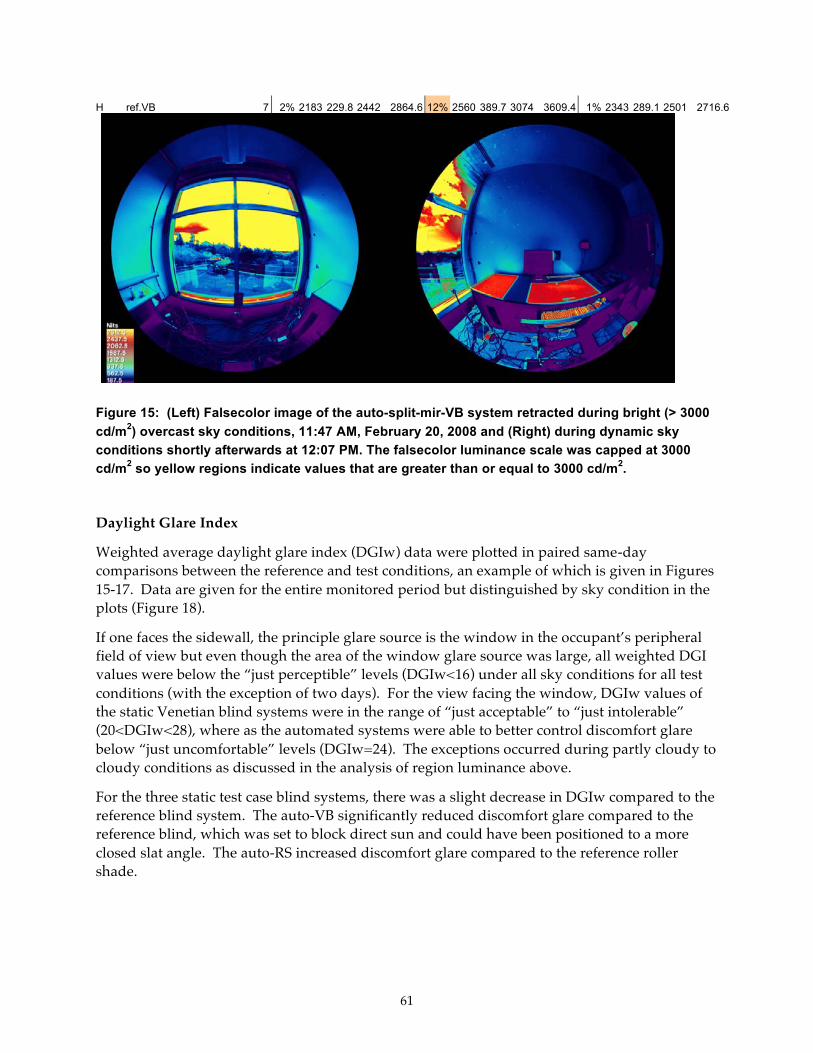
61
H ref.VB 7 2% 2183 229.8 2442 2864.6 12% 2560 389.7 3074 3609.4 1% 2343 289.1 2501 2716.6
Figure 15: (Left) Falsecolor image of the auto-split-mir-VB system retracted during bright (> 3000 cd/m2) overcast sky conditions, 11:47 AM, February 20, 2008 and (Right) during dynamic sky conditions shortly afterwards at 12:07 PM. The falsecolor luminance scale was capped at 3000 cd/m2 so yellow regions indicate values that are greater than or equal to 3000 cd/m2.
Daylight Glare Index
Weighted average daylight glare index (DGIw) data were plotted in paired same-day comparisons between the reference and test conditions, an example of which is given in Figures 15-17. Data are given for the entire monitored period but distinguished by sky condition in the plots (Figure 18).
If one faces the sidewall, the principle glare source is the window in the occupant’s peripheral field of view but even though the area of the window glare source was large, all weighted DGI values were below the “just perceptible” levels (DGIw<16) under all sky conditions for all test conditions (with the exception of two days). For the view facing the window, DGIw values of the static Venetian blind systems were in the range of “just acceptable” to “just intolerable” (20<DGIw<28), where as the automated systems were able to better control discomfort glare below “just uncomfortable” levels (DGIw=24). The exceptions occurred during partly cloudy to cloudy conditions as discussed in the analysis of region luminance above.
For the three static test case blind systems, there was a slight decrease in DGIw compared to the reference blind system. The auto-VB significantly reduced discomfort glare compared to the reference blind, which was set to block direct sun and could have been positioned to a more closed slat angle. The auto-RS increased discomfort glare compared to the reference roller shade.

62
Figure 16: Left: Automated split optical Venetian blind (auto-split-mir-VB). Right: reference Venetian blind (reference-VB). February 4, 10:02 AM. Falsecolor luminance threshold (yellow) ! 3000 cd/m2.
Figure 17: Summary of 5-minute Daylight Glare Index data for all paired comparisons during “clear” days. N = 23 days.
Figure 18: Weighted DGI values of paired comparisons for all sky conditions over 6-month period. Vertical lines indicate when seasonal adjustments of slat blocking angle were made.
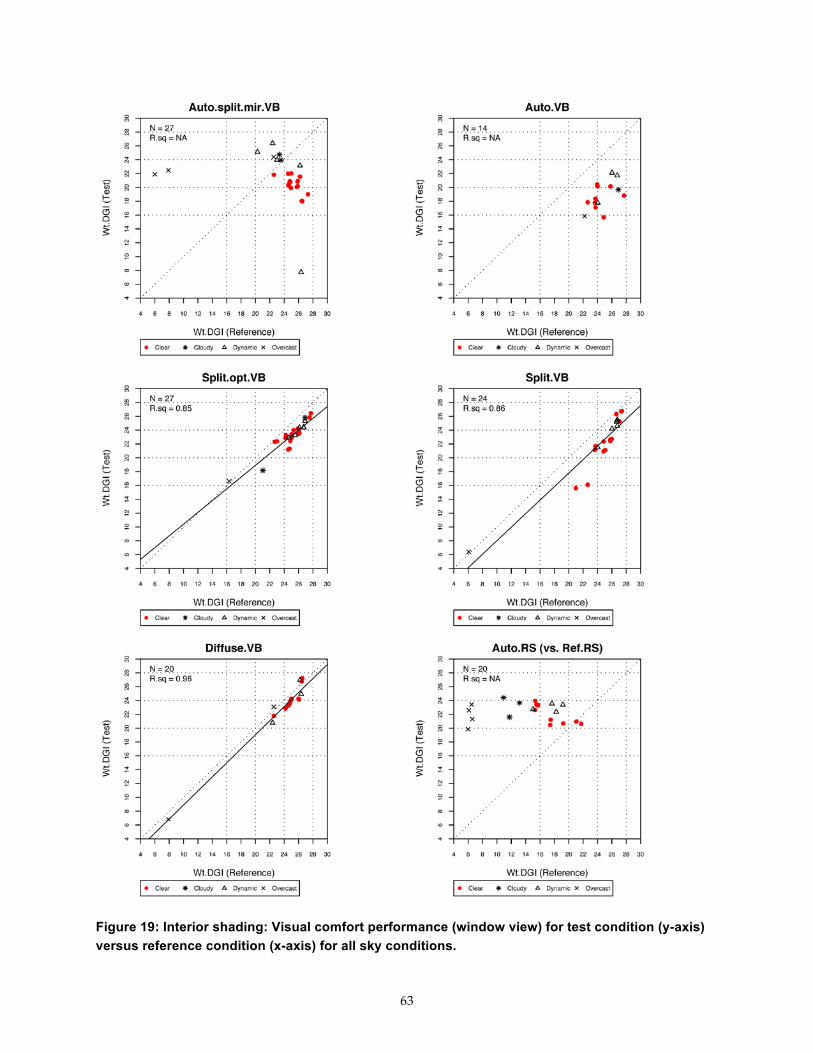
63
Figure 19: Interior shading: Visual comfort performance (window view) for test condition (y-axis) versus reference condition (x-axis) for all sky conditions.
64
Summary
This analysis illustrates the near similarity of conclusions one can draw based on the different performance parameters used to quantify and assess visual discomfort. Based on a simple measure of average whole window luminance normal to the window wall, the static split blind systems (diff-VB, split-VB, split-opt-VB) performed poorly while the auto-RS and auto-VB maintained window luminance levels below the threshold level of 2000 cd/m2 over the entire monitored period, which was largely characterized by clear sky conditions. More detailed analysis of region luminance confirmed this trend but the relative ranking of the three automated shading systems changed, with the auto-RS performing more poorly than the auto-VB and auto-split-mir-VB1 systems under clear sky conditions. Analysis under partly cloudy to overcast sky conditions indicated that the retractable automated shading systems (auto-RS and auto-split-mir-VB1) performed more poorly than the static reference and test conditions. The DGIw analysis under all sky conditions also indicated that automated shading systems yielded more comfortable conditions than the static shading systems with the auto-VB providing greatest control over daylight discomfort glare of all the systems tested.
The strategy of zoning the window wall into an upper daylight and lower view aperture has the potential of addressing the diametrically-opposed goals of controlling discomfort glare while admitting sufficient daylight to offset electric lighting use. This was largely true under clear sky conditions for the auto-split-mir-VB1 system: it was the most successful in controlling upper and lower window luminance levels to within acceptable levels and resulted in the least lighting energy use of all systems. However, the system blocked view completely in the lower section year-round under sunny conditions because of the ganged relationship between the upper and lower slats. The upper zone mirrored blind may be sufficient for daylighting the 4.57 m (15 ft) deep, south-facing perimeter zone under clear sky conditions and should be investigated further with a more optimal control algorithm. The remaining zoned static systems failed to adequately control discomfort glare to within acceptable levels.
One would hasten to add that the operable static shading systems, such as the split-opt-VB and split-VB, are likely to be able to produce comfortable conditions if the occupant positions the slats to a more closed angle. The translucent panel is unlikely to produce comfortable conditions unless a second interior shade is used with the panel to lower its luminance level. The control algorithms for the dynamic shading systems require adjustment to better address visual comfort requirements under not just clear sky conditions but partly cloudy and overcast sky conditions as well. For both the static and automated cases, view and daylight will be more impaired.
3.1.2. Exterior Shading Systems
3.1.2.1. Lighting Energy Use and Demand Like the interior shading systems with daylight dimming controls, lighting energy savings were significant: 53-67% compared to a condition when the lights are at full power over the 12-h period. Exterior shading systems reduced full load lighting energy use from 1800 Wh to an average use of 600-848 Wh per day or an equivalent installed lighting power density of 0.33-0.47 W/ft2-floor in a 4.57-m- (15-ft-) deep perimeter zone. The automated exterior roller shade yielded the greatest savings. The three-zone optical exterior blind yielded the least. Between
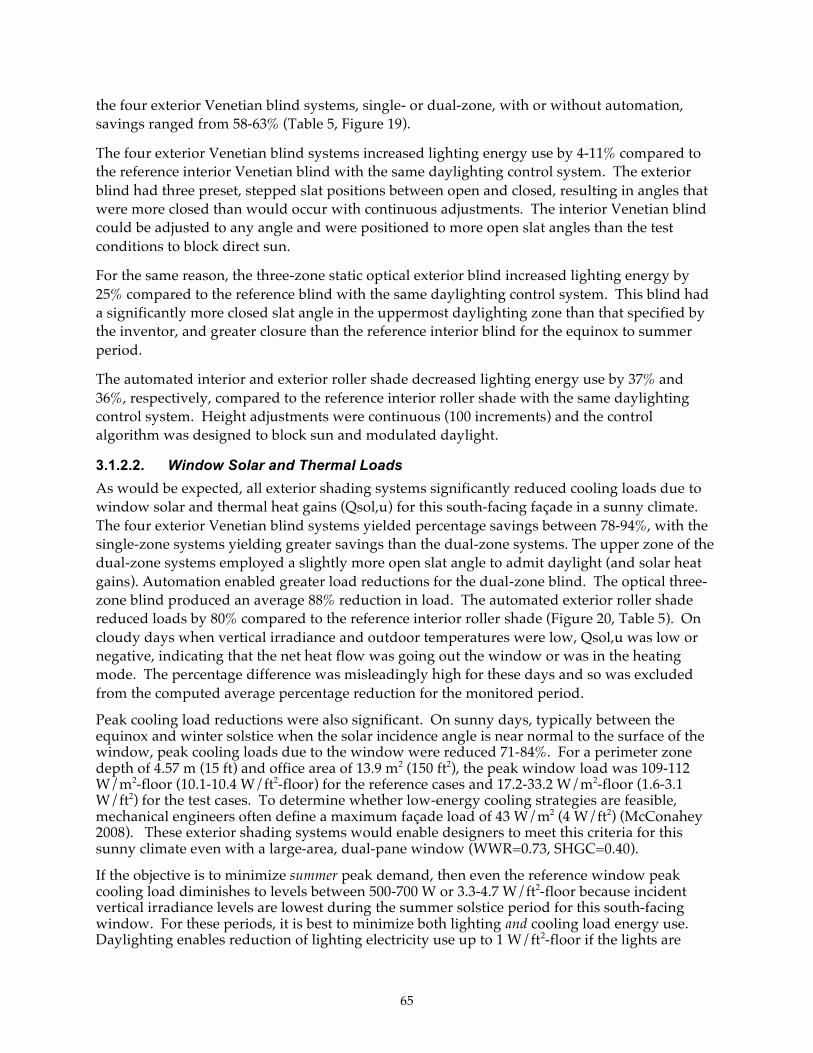
65
the four exterior Venetian blind systems, single- or dual-zone, with or without automation, savings ranged from 58-63% (Table 5, Figure 19).
The four exterior Venetian blind systems increased lighting energy use by 4-11% compared to the reference interior Venetian blind with the same daylighting control system. The exterior blind had three preset, stepped slat positions between open and closed, resulting in angles that were more closed than would occur with continuous adjustments. The interior Venetian blind could be adjusted to any angle and were positioned to more open slat angles than the test conditions to block direct sun.
For the same reason, the three-zone static optical exterior blind increased lighting energy by 25% compared to the reference blind with the same daylighting control system. This blind had a significantly more closed slat angle in the uppermost daylighting zone than that specified by the inventor, and greater closure than the reference interior blind for the equinox to summer period.
The automated interior and exterior roller shade decreased lighting energy use by 37% and 36%, respectively, compared to the reference interior roller shade with the same daylighting control system. Height adjustments were continuous (100 increments) and the control algorithm was designed to block sun and modulated daylight.
3.1.2.2. Window Solar and Thermal Loads As would be expected, all exterior shading systems significantly reduced cooling loads due to window solar and thermal heat gains (Qsol,u) for this south-facing façade in a sunny climate. The four exterior Venetian blind systems yielded percentage savings between 78-94%, with the single-zone systems yielding greater savings than the dual-zone systems. The upper zone of the dual-zone systems employed a slightly more open slat angle to admit daylight (and solar heat gains). Automation enabled greater load reductions for the dual-zone blind. The optical three-zone blind produced an average 88% reduction in load. The automated exterior roller shade reduced loads by 80% compared to the reference interior roller shade (Figure 20, Table 5). On cloudy days when vertical irradiance and outdoor temperatures were low, Qsol,u was low or negative, indicating that the net heat flow was going out the window or was in the heating mode. The percentage difference was misleadingly high for these days and so was excluded from the computed average percentage reduction for the monitored period.
Peak cooling load reductions were also significant. On sunny days, typically between the equinox and winter solstice when the solar incidence angle is near normal to the surface of the window, peak cooling loads due to the window were reduced 71-84%. For a perimeter zone depth of 4.57 m (15 ft) and office area of 13.9 m2 (150 ft2), the peak window load was 109-112 W/m2-floor (10.1-10.4 W/ft2-floor) for the reference cases and 17.2-33.2 W/m2-floor (1.6-3.1 W/ft2) for the test cases. To determine whether low-energy cooling strategies are feasible, mechanical engineers often define a maximum façade load of 43 W/m2 (4 W/ft2) (McConahey 2008). These exterior shading systems would enable designers to meet this criteria for this sunny climate even with a large-area, dual-pane window (WWR=0.73, SHGC=0.40).
If the objective is to minimize summer peak demand, then even the reference window peak cooling load diminishes to levels between 500-700 W or 3.3-4.7 W/ft2-floor because incident vertical irradiance levels are lowest during the summer solstice period for this south-facing window. For these periods, it is best to minimize both lighting and cooling load energy use. Daylighting enables reduction of lighting electricity use up to 1 W/ft2-floor if the lights are
66
permitted to be shut off and lighting heat gains of the same magnitude, assuming a 100% conversion of light to heat gains to the space. For a summer solstice day, for example, when vertical irradiance levels were 305 W/m2, the peak cooling load due to window solar and thermal heat gains and lighting loads was 181 W or 1.21 W/ft2-floor and lighting energy use was 24 W (minimum power) or 0.16 W/ft2-floor for the single-zone static exterior blind.
The window load and peak load can be diminished by using a smaller window to stay within low-energy cooling load requirements. To optimize for both cooling and lighting energy use and demand, the designer must use simulation tools to determine the optimum window solar-optical properties and area.
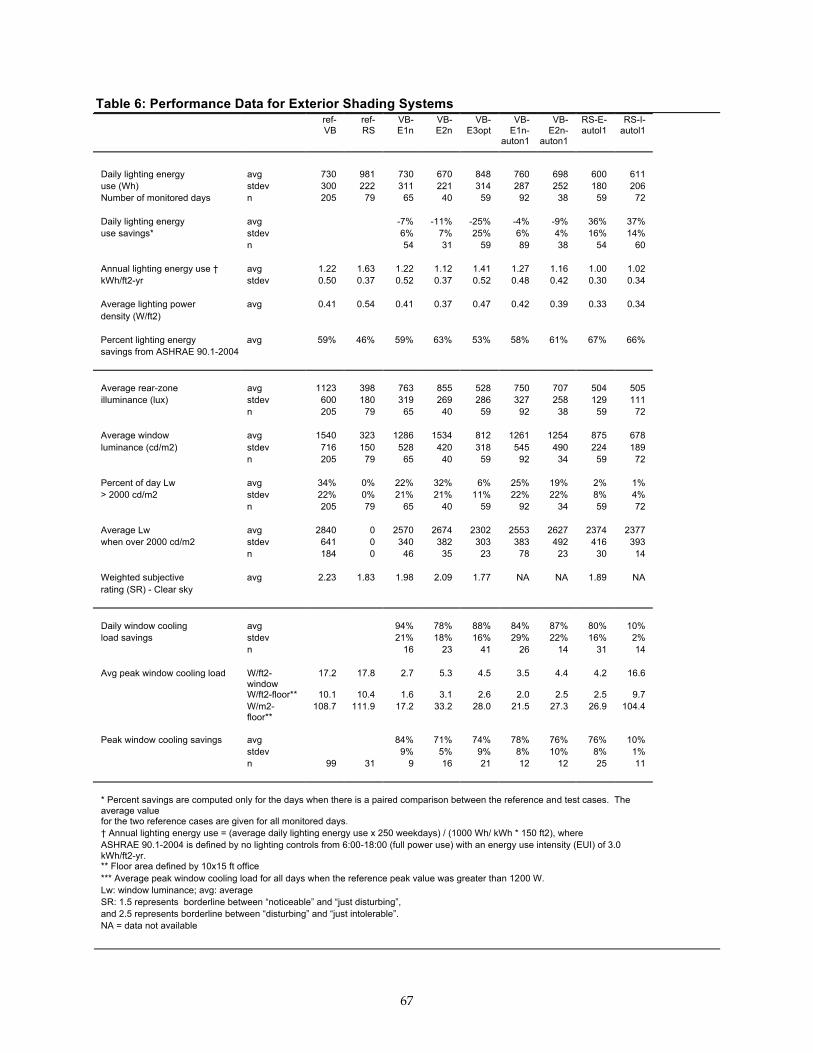
67
Table 6: Performance Data for Exterior Shading Systems ref-
VB ref-RS
VB-E1n
VB-E2n
VB- E3opt
VB-E1n-
VB-E2n-
RS-E- autol1
RS-I- autol1
auton1 auton1
Daily lighting energy avg 730 981 730 670 848 760 698 600 611 use (Wh) stdev 300 222 311 221 314 287 252 180 206 Number of monitored days n 205 79 65 40 59 92 38 59 72
Daily lighting energy avg -7% -11% -25% -4% -9% 36% 37% use savings* stdev 6% 7% 25% 6% 4% 16% 14%
n 54 31 59 89 38 54 60
Annual lighting energy use † avg 1.22 1.63 1.22 1.12 1.41 1.27 1.16 1.00 1.02 kWh/ft2-yr stdev 0.50 0.37 0.52 0.37 0.52 0.48 0.42 0.30 0.34
Average lighting power avg 0.41 0.54 0.41 0.37 0.47 0.42 0.39 0.33 0.34 density (W/ft2)
Percent lighting energy avg 59% 46% 59% 63% 53% 58% 61% 67% 66% savings from ASHRAE 90.1-2004
Average rear-zone avg 1123 398 763 855 528 750 707 504 505 illuminance (lux) stdev 600 180 319 269 286 327 258 129 111
n 205 79 65 40 59 92 38 59 72
Average window avg 1540 323 1286 1534 812 1261 1254 875 678 luminance (cd/m2) stdev 716 150 528 420 318 545 490 224 189
n 205 79 65 40 59 92 34 59 72
Percent of day Lw avg 34% 0% 22% 32% 6% 25% 19% 2% 1% > 2000 cd/m2 stdev 22% 0% 21% 21% 11% 22% 22% 8% 4%
n 205 79 65 40 59 92 34 59 72
Average Lw avg 2840 0 2570 2674 2302 2553 2627 2374 2377 when over 2000 cd/m2 stdev 641 0 340 382 303 383 492 416 393
n 184 0 46 35 23 78 23 30 14
Weighted subjective avg 2.23 1.83 1.98 2.09 1.77 NA NA 1.89 NA rating (SR) - Clear sky
Daily window cooling avg 94% 78% 88% 84% 87% 80% 10% load savings stdev 21% 18% 16% 29% 22% 16% 2%
n 16 23 41 26 14 31 14
Avg peak window cooling load W/ft2-window
17.2 17.8 2.7 5.3 4.5 3.5 4.4 4.2 16.6
W/ft2-floor** 10.1 10.4 1.6 3.1 2.6 2.0 2.5 2.5 9.7 W/m2-
floor** 108.7 111.9 17.2 33.2 28.0 21.5 27.3 26.9 104.4
Peak window cooling savings avg 84% 71% 74% 78% 76% 76% 10%
stdev 9% 5% 9% 8% 10% 8% 1% n 99 31 9 16 21 12 12 25 11
* Percent savings are computed only for the days when there is a paired comparison between the reference and test cases. The average value for the two reference cases are given for all monitored days. † Annual lighting energy use = (average daily lighting energy use x 250 weekdays) / (1000 Wh/ kWh * 150 ft2), where ASHRAE 90.1-2004 is defined by no lighting controls from 6:00-18:00 (full power use) with an energy use intensity (EUI) of 3.0 kWh/ft2-yr. ** Floor area defined by 10x15 ft office *** Average peak window cooling load for all days when the reference peak value was greater than 1200 W. Lw: window luminance; avg: average SR: 1.5 represents borderline between “noticeable” and “just disturbing”, and 2.5 represents borderline between “disturbing” and “just intolerable”. NA = data not available

68
Figure 20: Exterior shading: Daily lighting energy use (Wh) per test condition for the 6:00-18:00 period.

69
Figure 21: Exterior shading: Daily cooling load due to solar and thermal heat gains through the window (kWh) over the 6:00-18:00 period.
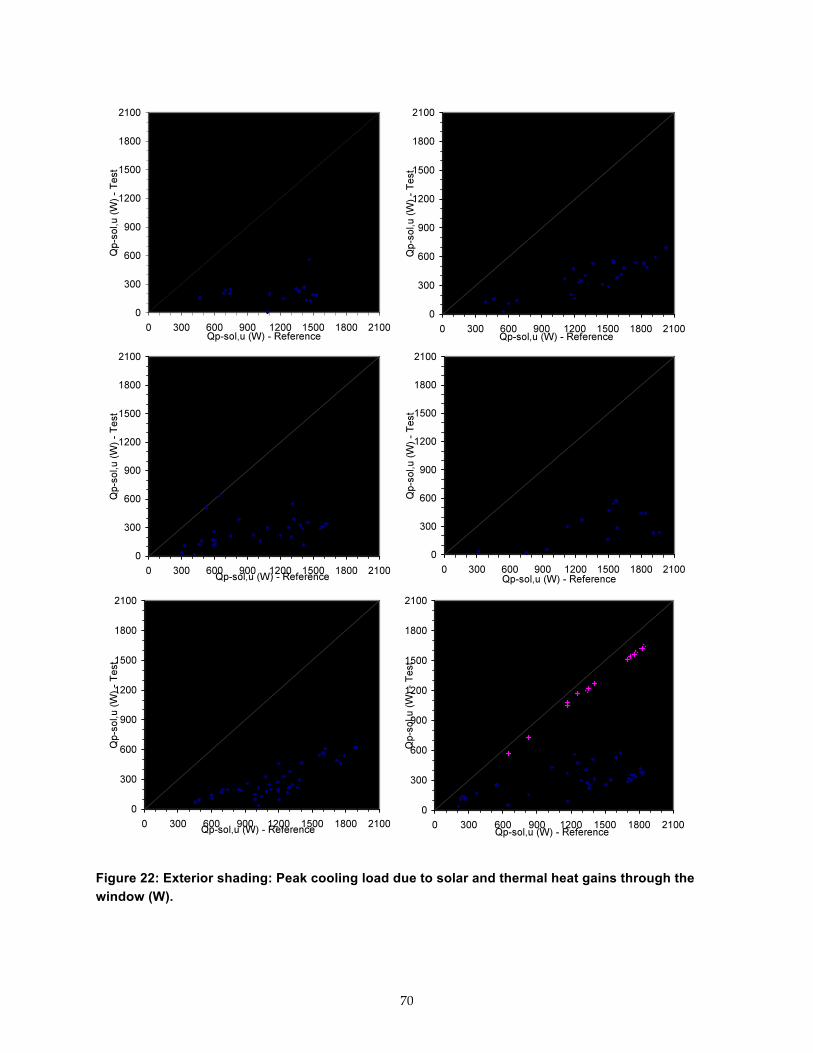
70
Figure 22: Exterior shading: Peak cooling load due to solar and thermal heat gains through the window (W).
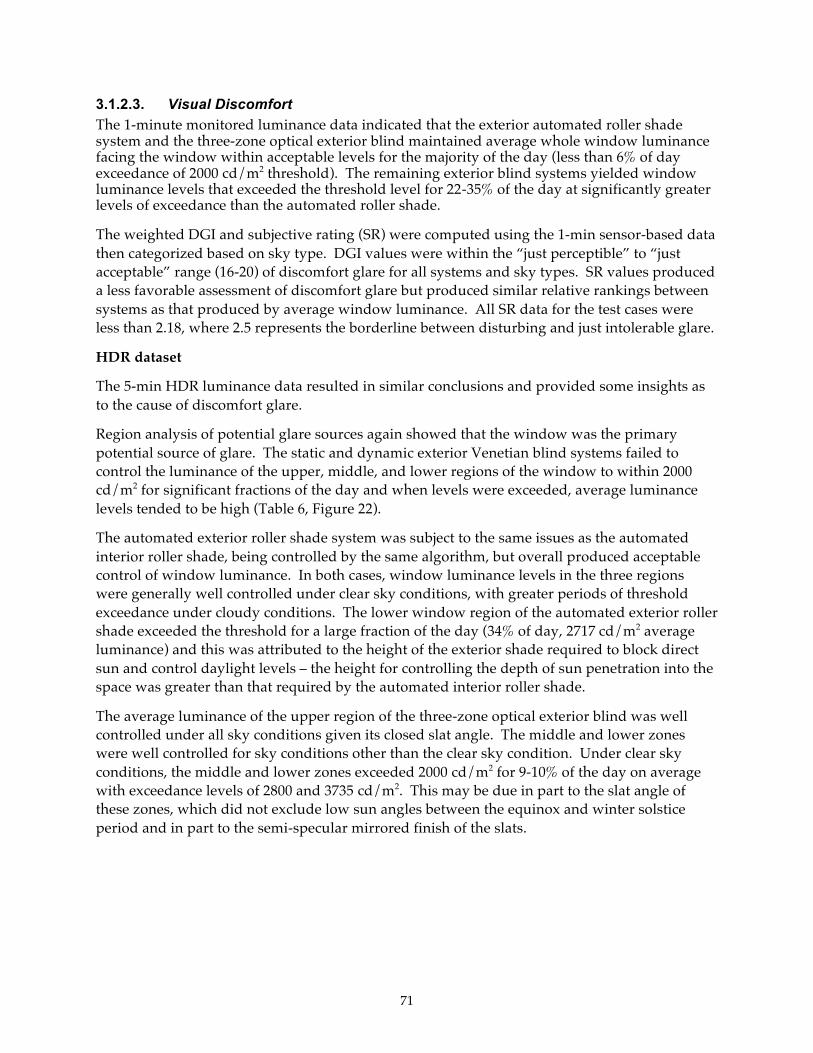
71
3.1.2.3. Visual Discomfort The 1-minute monitored luminance data indicated that the exterior automated roller shade system and the three-zone optical exterior blind maintained average whole window luminance facing the window within acceptable levels for the majority of the day (less than 6% of day exceedance of 2000 cd/m2 threshold). The remaining exterior blind systems yielded window luminance levels that exceeded the threshold level for 22-35% of the day at significantly greater levels of exceedance than the automated roller shade.
The weighted DGI and subjective rating (SR) were computed using the 1-min sensor-based data then categorized based on sky type. DGI values were within the “just perceptible” to “just acceptable” range (16-20) of discomfort glare for all systems and sky types. SR values produced a less favorable assessment of discomfort glare but produced similar relative rankings between systems as that produced by average window luminance. All SR data for the test cases were less than 2.18, where 2.5 represents the borderline between disturbing and just intolerable glare.
HDR dataset
The 5-min HDR luminance data resulted in similar conclusions and provided some insights as to the cause of discomfort glare.
Region analysis of potential glare sources again showed that the window was the primary potential source of glare. The static and dynamic exterior Venetian blind systems failed to control the luminance of the upper, middle, and lower regions of the window to within 2000 cd/m2 for significant fractions of the day and when levels were exceeded, average luminance levels tended to be high (Table 6, Figure 22).
The automated exterior roller shade system was subject to the same issues as the automated interior roller shade, being controlled by the same algorithm, but overall produced acceptable control of window luminance. In both cases, window luminance levels in the three regions were generally well controlled under clear sky conditions, with greater periods of threshold exceedance under cloudy conditions. The lower window region of the automated exterior roller shade exceeded the threshold for a large fraction of the day (34% of day, 2717 cd/m2 average luminance) and this was attributed to the height of the exterior shade required to block direct sun and control daylight levels – the height for controlling the depth of sun penetration into the space was greater than that required by the automated interior roller shade.
The average luminance of the upper region of the three-zone optical exterior blind was well controlled under all sky conditions given its closed slat angle. The middle and lower zones were well controlled for sky conditions other than the clear sky condition. Under clear sky conditions, the middle and lower zones exceeded 2000 cd/m2 for 9-10% of the day on average with exceedance levels of 2800 and 3735 cd/m2. This may be due in part to the slat angle of these zones, which did not exclude low sun angles between the equinox and winter solstice period and in part to the semi-specular mirrored finish of the slats.
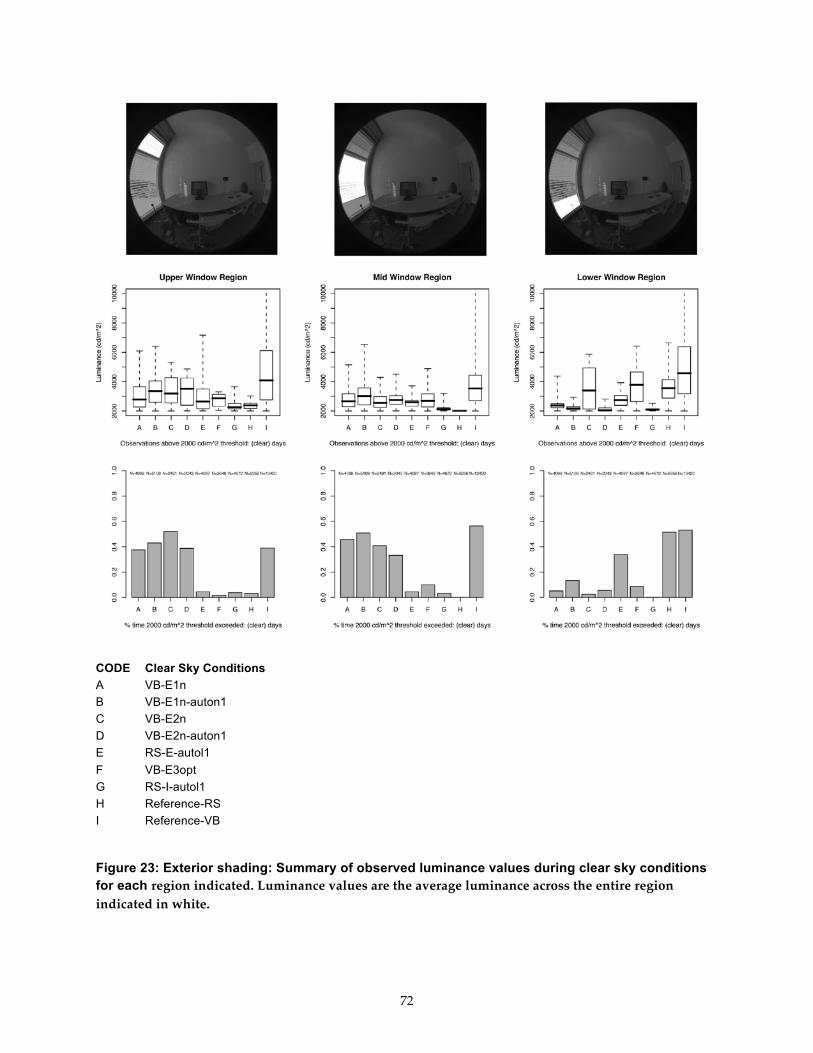
72
CODE Clear Sky Conditions A VB-E1n B VB-E1n-auton1 C VB-E2n D VB-E2n-auton1 E RS-E-autol1 F VB-E3opt G RS-I-autol1 H Reference-RS I Reference-VB
Figure 23: Exterior shading: Summary of observed luminance values during clear sky conditions for each region indicated. Luminance values are the average luminance across the entire region indicated in white.

73
Table 7: Region Luminance Data for VDT View; Exterior Shading Systems Zone Upper Window Mid Window Lower Window Threshold (cd/m^2) 2000 2000 2000
Code Test Condition N (D
ays)
% T
ime
Abo
ve T
hres
h.
Mea
n Lu
mi.
Abo
ve th
resh
.
StD
ev. o
f Lum
i. A
bove
Thr
esh.
Mea
n Lu
mi.
of U
pper
Qua
ntile
Max
Lum
inan
ce
% T
ime
Abo
ve T
hres
h.
Mea
n Lu
mi.
Abo
ve th
resh
.
StD
ev. o
f Lum
i. A
bove
Thr
esh.
Mea
n Lu
mi.
of U
pper
Qua
ntile
Max
Lum
inan
ce
% T
ime
Abo
ve T
hres
h.
Mea
n Lu
mi.
Abo
ve th
resh
.
StD
ev. o
f Lum
i. A
bove
Thr
esh.
Mea
n Lu
mi.
of U
pper
Qua
ntile
Max
Lum
inan
ce
Clear Sky Conditions
A VB-E1n 28 38% 3045 891 4339 6090 46% 2842 721 3875 5147 5% 2361 244 2614 4380 B VB-E1n-auton1 35 43% 3363 876 4485 6414 51% 3066 740 4055 6518 13% 2219 179 2476 2940 C VB-E2n 17 52% 3403 975 4790 5325 41% 2626 444 3244 4293 2% 3598 1375 5248 5869 D VB-E2n-auton1 14 39% 3388 899 4481 4865 33% 2792 468 3416 4515 6% 2122 157 2322 2815 E RS-E-autol1 (vs. ref-RS) 28 5% 3067 1208 4689 7168 4% 2563 333 2930 3709 34% 2717 394 3210 3924 F VB-E3opt 25 2% 2740 430 3200 3309 10% 2800 631 3661 4883 9% 3735 1125 5131 6423 G RS-I-autol1 32 4% 2334 252 2671 3654 3% 2176 181 2392 3198 0% 2145 163 2228 2515 H ref-RS 36 3% 2401 258 2737 3023 0% 2011 11 2004 2019 52% 3526 852 4599 6645 I ref-VB 92 39% 4580 2162 7586 16299 56% 3726 1366 5441 14688 53% 4977 2232 7938 19882 Cloudy Sky Conditions A VB-E1n 2 3% 3269 824 4098 4402 21% 2615 629 3385 4909 0% 0 0 0 0 B VB-E1n-auton1 9 16% 2976 770 3960 5245 29% 3031 703 4000 5471 4% 2174 259 2468 3205 C VB-E2n 2 13% 2959 862 4105 4884 14% 2811 691 3629 4651 0% 0 0 0 0 D VB-E2n-auton1 3 18% 2906 747 3952 4401 22% 2722 415 3197 3905 0% 0 0 0 0 E RS-E-autol1 (vs. ref-RS) 5 12% 2496 450 2910 5188 4% 2178 269 2429 3481 8% 2413 331 2792 3529 F VB-E3opt 6 0% 0 0 0 0 5% 2388 350 2790 3319 1% 2665 515 3083 3629 G RS-I-autol1 5 10% 2591 540 3220 4885 16% 2381 253 2715 3255 0% 0 0 0 0 H ref-RS 6 0% 0 0 0 0 0% 0 0 0 0 13% 3261 855 4384 4773 I ref-VB 14 14% 3523 1214 5134 7188 30% 3430 1085 4891 9057 20% 3468 1282 5261 10141 Dynamic Sky Conditions A VB-E1n 6 23% 2621 612 3511 4703 39% 2753 662 3656 5489 2% 2168 154 2340 2470 B VB-E1n-auton1 15 20% 2930 843 4076 7613 35% 2883 729 3923 5657 6% 2238 209 2537 2849 C VB-E2n 7 25% 2994 825 4188 5122 27% 2653 585 3472 4881 5% 2743 749 3692 4967 D VB-E2n-auton1 4 15% 2264 215 2539 3012 19% 2294 239 2628 2985 1% 2172 144 2209 2336 E RS-E-autol1 (vs. ref-RS) 13 9% 3136 1856 4941 12035 9% 2510 547 3124 5499 19% 2770 551 3488 4557 F VB-E3opt 10 0% 0 0 0 0 6% 2880 986 4265 5353 6% 2565 711 3539 4747 G RS-I-autol1 14 6% 2478 417 3041 3900 8% 2510 432 3087 4202 0% 0 0 0 0 H ref-RS 15 2% 2314 195 2550 2769 0% 0 0 0 0 36% 3546 839 4578 6257 I ref-VB 29 20% 3747 1539 5908 8946 42% 3427 1281 5216 8906 35% 3869 1558 6109 9738 Overcast Sky Conditions A VB-E1n 6 0% 0 0 0 0 5% 2688 370 3066 3738 0% 0 0 0 0 B VB-E1n-auton1 12 1% 2711 592 3364 4270 7% 2669 566 3423 4404 0% 0 0 0 0 C VB-E2n 1 0% 0 0 0 0 0% 0 0 0 0 0% 0 0 0 0 D VB-E2n-auton1 3 0% 0 0 0 0 1% 2639 284 2864 2942 0% 0 0 0 0 E RS-E-autol1 (vs. ref-RS) 3 14% 2435 351 2929 3604 11% 2377 362 2764 3697 1% 2383 248 2403 2827 F VB-E3opt 4 0% 0 0 0 0 1% 2182 15 2187 2193 0% 0 0 0 0 G RS-I-autol1 5 15% 2488 341 2927 3676 21% 2553 485 3055 6061 0% 0 0 0 0 H ref-RS 5 0% 0 0 0 0 0% 0 0 0 0 1% 2469 509 3050 3379 I ref-VB 30 2% 2775 730 3686 5523 10% 2808 652 3728 5383 3% 3147 1111 4658 6960
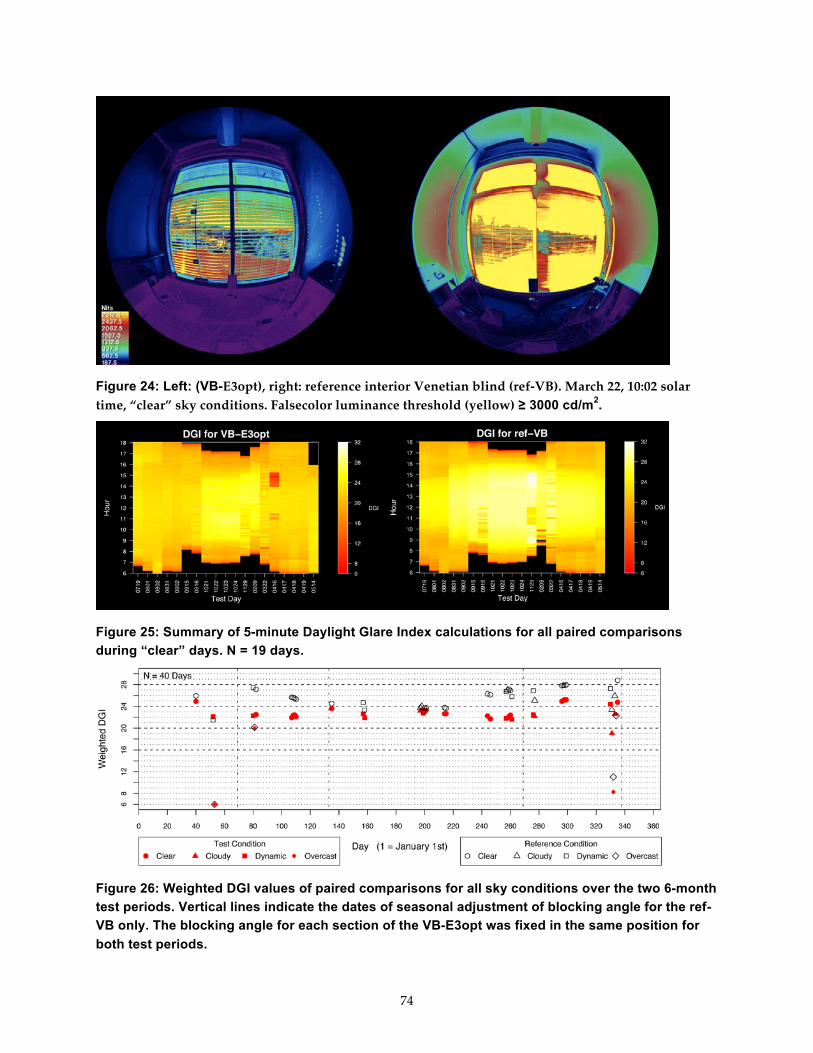
74
Figure 24: Left: (VB-E3opt), right: reference interior Venetian blind (ref-VB). March 22, 10:02 solar time, “clear” sky conditions. Falsecolor luminance threshold (yellow) ! 3000 cd/m2.
Figure 25: Summary of 5-minute Daylight Glare Index calculations for all paired comparisons during “clear” days. N = 19 days.
Figure 26: Weighted DGI values of paired comparisons for all sky conditions over the two 6-month test periods. Vertical lines indicate the dates of seasonal adjustment of blocking angle for the ref-VB only. The blocking angle for each section of the VB-E3opt was fixed in the same position for both test periods.

75
Figure 27: Exterior shading: Visual comfort performance (window-view) for test condition (y-axis) vs. reference condition (x-axis) for all sky conditions.
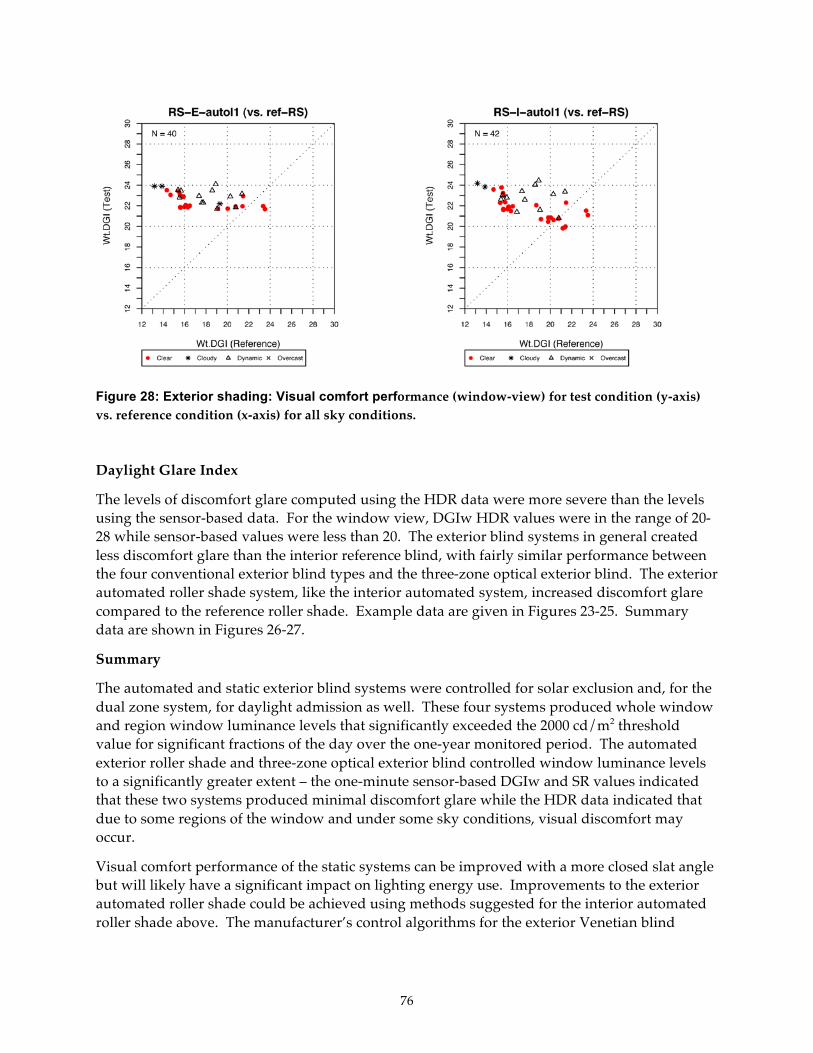
76
Figure 28: Exterior shading: Visual comfort performance (window-view) for test condition (y-axis) vs. reference condition (x-axis) for all sky conditions.
Daylight Glare Index
The levels of discomfort glare computed using the HDR data were more severe than the levels using the sensor-based data. For the window view, DGIw HDR values were in the range of 20-28 while sensor-based values were less than 20. The exterior blind systems in general created less discomfort glare than the interior reference blind, with fairly similar performance between the four conventional exterior blind types and the three-zone optical exterior blind. The exterior automated roller shade system, like the interior automated system, increased discomfort glare compared to the reference roller shade. Example data are given in Figures 23-25. Summary data are shown in Figures 26-27.
Summary
The automated and static exterior blind systems were controlled for solar exclusion and, for the dual zone system, for daylight admission as well. These four systems produced whole window and region window luminance levels that significantly exceeded the 2000 cd/m2 threshold value for significant fractions of the day over the one-year monitored period. The automated exterior roller shade and three-zone optical exterior blind controlled window luminance levels to a significantly greater extent – the one-minute sensor-based DGIw and SR values indicated that these two systems produced minimal discomfort glare while the HDR data indicated that due to some regions of the window and under some sky conditions, visual discomfort may occur.
Visual comfort performance of the static systems can be improved with a more closed slat angle but will likely have a significant impact on lighting energy use. Improvements to the exterior automated roller shade could be achieved using methods suggested for the interior automated roller shade above. The manufacturer’s control algorithms for the exterior Venetian blind
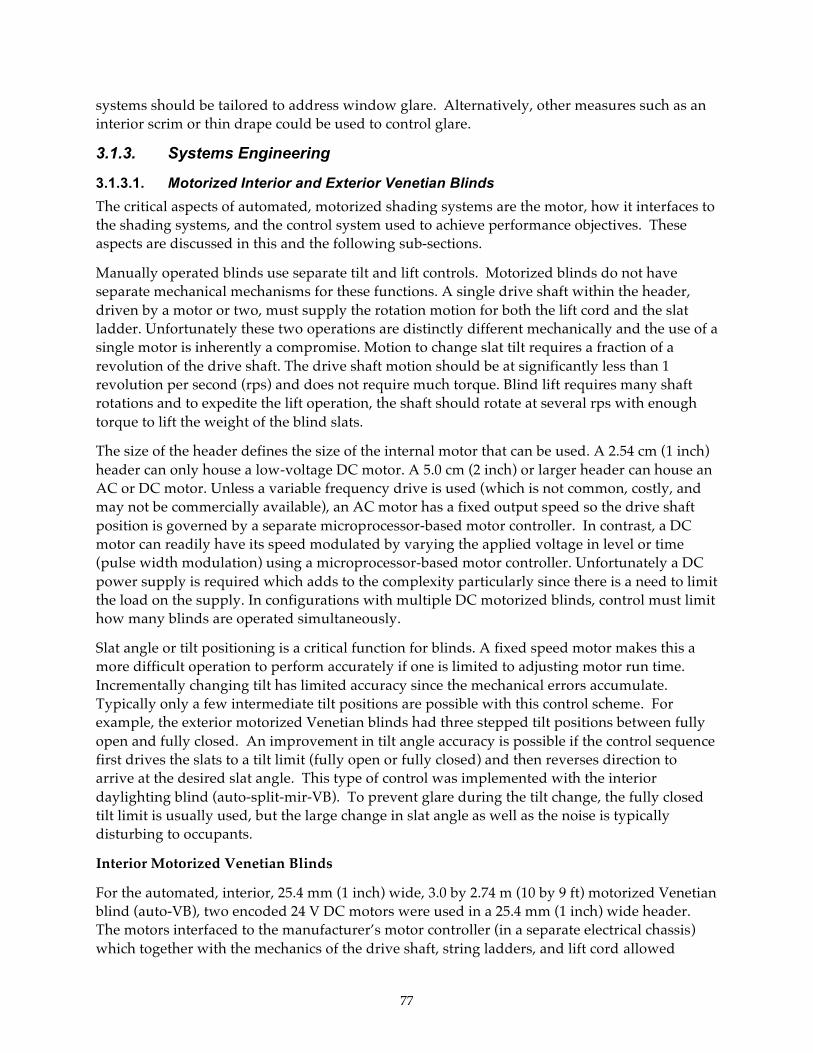
77
systems should be tailored to address window glare. Alternatively, other measures such as an interior scrim or thin drape could be used to control glare.
3.1.3. Systems Engineering
3.1.3.1. Motorized Interior and Exterior Venetian Blinds The critical aspects of automated, motorized shading systems are the motor, how it interfaces to the shading systems, and the control system used to achieve performance objectives. These aspects are discussed in this and the following sub-sections.
Manually operated blinds use separate tilt and lift controls. Motorized blinds do not have separate mechanical mechanisms for these functions. A single drive shaft within the header, driven by a motor or two, must supply the rotation motion for both the lift cord and the slat ladder. Unfortunately these two operations are distinctly different mechanically and the use of a single motor is inherently a compromise. Motion to change slat tilt requires a fraction of a revolution of the drive shaft. The drive shaft motion should be at significantly less than 1 revolution per second (rps) and does not require much torque. Blind lift requires many shaft rotations and to expedite the lift operation, the shaft should rotate at several rps with enough torque to lift the weight of the blind slats.
The size of the header defines the size of the internal motor that can be used. A 2.54 cm (1 inch) header can only house a low-voltage DC motor. A 5.0 cm (2 inch) or larger header can house an AC or DC motor. Unless a variable frequency drive is used (which is not common, costly, and may not be commercially available), an AC motor has a fixed output speed so the drive shaft position is governed by a separate microprocessor-based motor controller. In contrast, a DC motor can readily have its speed modulated by varying the applied voltage in level or time (pulse width modulation) using a microprocessor-based motor controller. Unfortunately a DC power supply is required which adds to the complexity particularly since there is a need to limit the load on the supply. In configurations with multiple DC motorized blinds, control must limit how many blinds are operated simultaneously.
Slat angle or tilt positioning is a critical function for blinds. A fixed speed motor makes this a more difficult operation to perform accurately if one is limited to adjusting motor run time. Incrementally changing tilt has limited accuracy since the mechanical errors accumulate. Typically only a few intermediate tilt positions are possible with this control scheme. For example, the exterior motorized Venetian blinds had three stepped tilt positions between fully open and fully closed. An improvement in tilt angle accuracy is possible if the control sequence first drives the slats to a tilt limit (fully open or fully closed) and then reverses direction to arrive at the desired slat angle. This type of control was implemented with the interior daylighting blind (auto-split-mir-VB). To prevent glare during the tilt change, the fully closed tilt limit is usually used, but the large change in slat angle as well as the noise is typically disturbing to occupants.
Interior Motorized Venetian Blinds
For the automated, interior, 25.4 mm (1 inch) wide, 3.0 by 2.74 m (10 by 9 ft) motorized Venetian blind (auto-VB), two encoded 24 V DC motors were used in a 25.4 mm (1 inch) wide header. The motors interfaced to the manufacturer’s motor controller (in a separate electrical chassis) which together with the mechanics of the drive shaft, string ladders, and lift cord allowed
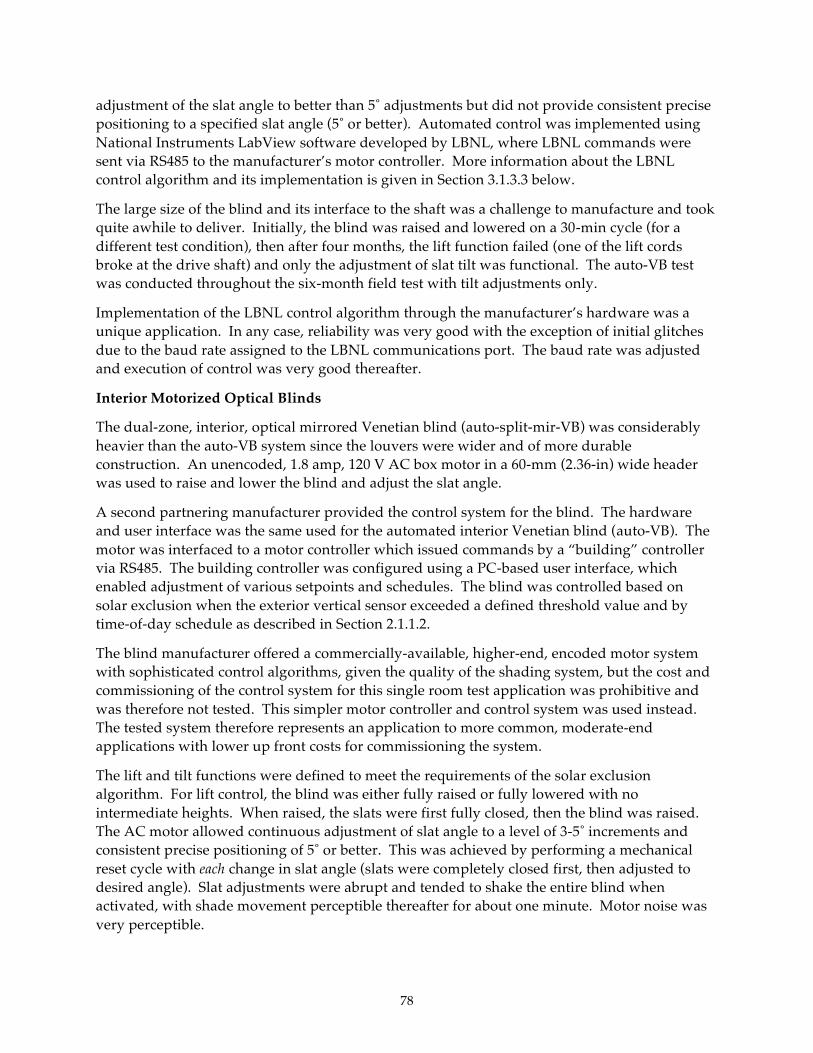
78
adjustment of the slat angle to better than 5˚ adjustments but did not provide consistent precise positioning to a specified slat angle (5˚ or better). Automated control was implemented using National Instruments LabView software developed by LBNL, where LBNL commands were sent via RS485 to the manufacturer’s motor controller. More information about the LBNL control algorithm and its implementation is given in Section 3.1.3.3 below.
The large size of the blind and its interface to the shaft was a challenge to manufacture and took quite awhile to deliver. Initially, the blind was raised and lowered on a 30-min cycle (for a different test condition), then after four months, the lift function failed (one of the lift cords broke at the drive shaft) and only the adjustment of slat tilt was functional. The auto-VB test was conducted throughout the six-month field test with tilt adjustments only.
Implementation of the LBNL control algorithm through the manufacturer’s hardware was a unique application. In any case, reliability was very good with the exception of initial glitches due to the baud rate assigned to the LBNL communications port. The baud rate was adjusted and execution of control was very good thereafter.
Interior Motorized Optical Blinds
The dual-zone, interior, optical mirrored Venetian blind (auto-split-mir-VB) was considerably heavier than the auto-VB system since the louvers were wider and of more durable construction. An unencoded, 1.8 amp, 120 V AC box motor in a 60-mm (2.36-in) wide header was used to raise and lower the blind and adjust the slat angle.
A second partnering manufacturer provided the control system for the blind. The hardware and user interface was the same used for the automated interior Venetian blind (auto-VB). The motor was interfaced to a motor controller which issued commands by a “building” controller via RS485. The building controller was configured using a PC-based user interface, which enabled adjustment of various setpoints and schedules. The blind was controlled based on solar exclusion when the exterior vertical sensor exceeded a defined threshold value and by time-of-day schedule as described in Section 2.1.1.2.
The blind manufacturer offered a commercially-available, higher-end, encoded motor system with sophisticated control algorithms, given the quality of the shading system, but the cost and commissioning of the control system for this single room test application was prohibitive and was therefore not tested. This simpler motor controller and control system was used instead. The tested system therefore represents an application to more common, moderate-end applications with lower up front costs for commissioning the system.
The lift and tilt functions were defined to meet the requirements of the solar exclusion algorithm. For lift control, the blind was either fully raised or fully lowered with no intermediate heights. When raised, the slats were first fully closed, then the blind was raised. The AC motor allowed continuous adjustment of slat angle to a level of 3-5˚ increments and consistent precise positioning of 5˚ or better. This was achieved by performing a mechanical reset cycle with each change in slat angle (slats were completely closed first, then adjusted to desired angle). Slat adjustments were abrupt and tended to shake the entire blind when activated, with shade movement perceptible thereafter for about one minute. Motor noise was very perceptible.

79
Commissioning of the system required minimal effort. The manufacturer visited the site to initiate the direct solar exclusion function, taking a few hours to do so. The exterior vertical sensor did not appear to need any lengthly start-up procedures to calibrate it to local conditions. The schedule merely required input of hour of day. However, the user interface was of obtuse design and required detailed knowledge to use.
It was difficult to determine what exactly the system was designed to do since the manufacturer was vague on how their system was designed, either due to concerns over intellectual property or simply not knowing the technical details. This made it difficult to troubleshoot the system. When obvious glitches were noted, provision of technical information by the manufacturer was very slow in response and jeopardized the timing of the experimental test. To answer technical questions, the U.S. supplier had to obtain information from the original EU engineers.
Automated control was implemented by the manufacturer with varying reliability. On some days for some unknown reason, the slat angles would be positioned to the wrong angle or tilted at the wrong time; these data were omitted from the dataset.
Given the quality of engineering of the blind, use of a lower-end, lower-cost control system was counterproductive to achieving the performance goals that this system was designed for, despite the lower cost of the overall system. It is unlikely that the occupant will be satisfied with the operations of this blind, particularly in a private office setting due to motor noise and visual distraction.
Exterior Motorized Venetian Blinds
All the conventional exterior Venetian blind systems were motorized, whether manually-operated or automated. The blinds had a runtime controlled AC box motor (1.8 amps, 120 volts) mounted in a 60-mm (2.36-inch) wide head rail. The motor had a fixed output speed so while relatively inexpensive, it required that tilt stops be spaced at least 200 ms apart to allow the motor to accurately respond. A 1-second tilt time, for example, would enable a total of six tilt stops between 0° (horizontal) and 90° (closed). The blind that was tested was set up to deliver five tilt stops over a 16-90° angular range. The blind was cycled to fully open at night to reset the angular position, enabling more accurate slat positioning (1° or better) at the start of the next day.
The control system for this test positioned the blind to either a fully raised or fully lowered position, but could be raised and lowered, with slat angle adjustments at any height. When lowered, shade height was determined by time and vertical travel distance was constrained by an upper and lower limit switch and a compression switch at the header.
The blind was held away from the façade using vertical guide wires tensioned from top to bottom. For blinds wider than 8.5 ft, three guide wires are recommended to prevent deflection at the center of the blind when under wind load. Under windy conditions (> 14 mps (31.3 miles/h)) the exterior blind was fully raised to protect the shade. A unique “double omega” punch was used to attach each slat to the ladder braid to prevent the slats from fluttering in the wind, stay aligned, and provide a consistent appearance and tilt – without this attachment, individual slats could turn to different angles and only be realigned after fully raising the blind.
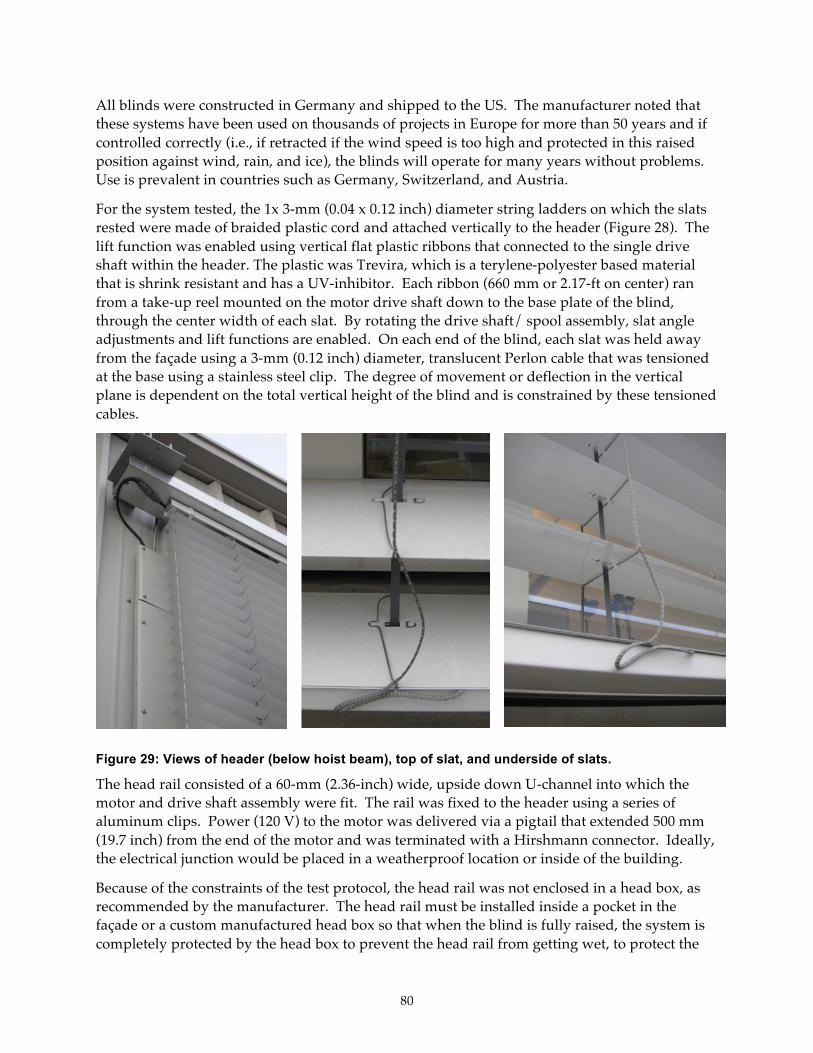
80
All blinds were constructed in Germany and shipped to the US. The manufacturer noted that these systems have been used on thousands of projects in Europe for more than 50 years and if controlled correctly (i.e., if retracted if the wind speed is too high and protected in this raised position against wind, rain, and ice), the blinds will operate for many years without problems. Use is prevalent in countries such as Germany, Switzerland, and Austria.
For the system tested, the 1x 3-mm (0.04 x 0.12 inch) diameter string ladders on which the slats rested were made of braided plastic cord and attached vertically to the header (Figure 28). The lift function was enabled using vertical flat plastic ribbons that connected to the single drive shaft within the header. The plastic was Trevira, which is a terylene-polyester based material that is shrink resistant and has a UV-inhibitor. Each ribbon (660 mm or 2.17-ft on center) ran from a take-up reel mounted on the motor drive shaft down to the base plate of the blind, through the center width of each slat. By rotating the drive shaft/ spool assembly, slat angle adjustments and lift functions are enabled. On each end of the blind, each slat was held away from the façade using a 3-mm (0.12 inch) diameter, translucent Perlon cable that was tensioned at the base using a stainless steel clip. The degree of movement or deflection in the vertical plane is dependent on the total vertical height of the blind and is constrained by these tensioned cables.
Figure 29: Views of header (below hoist beam), top of slat, and underside of slats.
The head rail consisted of a 60-mm (2.36-inch) wide, upside down U-channel into which the motor and drive shaft assembly were fit. The rail was fixed to the header using a series of aluminum clips. Power (120 V) to the motor was delivered via a pigtail that extended 500 mm (19.7 inch) from the end of the motor and was terminated with a Hirshmann connector. Ideally, the electrical junction would be placed in a weatherproof location or inside of the building.
Because of the constraints of the test protocol, the head rail was not enclosed in a head box, as recommended by the manufacturer. The head rail must be installed inside a pocket in the façade or a custom manufactured head box so that when the blind is fully raised, the system is completely protected by the head box to prevent the head rail from getting wet, to protect the
81
slats when it is windy, and to prevent the slats from getting wet and freezing if the temperature falls significantly.
Automated control was implemented by a controls engineering partner of the manufacturer using an integrated microprocessor and runtime motor controller located outside the building in a separate box. The microprocessor was programmed by PC-based software also supplied by the manufacturer. In this way, critical runtime parameters for defining height and tilt were entered and other user options could be selected. Runtime parameters were correlated to angular and height position by the manufacturer by timing opening and closure rates at the final installation.
The system received input data from two exterior sensors: a roof-mounted sun position-dependent horizontal sensor that measured the brightness of angular segments of the skydome and a roof-mounted anemometer that measured local wind speed.
The configuration interface was a PC-based application where critical hardware parameters and end user settings were specified. Setting options were as follows:
• Runtime values for extending and retracting • Runtime values for tilting, including setting intermediate tilt positions. • Window dimensions • Glare free interior zone dimensions (not used) • Latitude and orientation of window for solar control • Wind speed retraction threshold • Vertical exterior brightness sensor threshold
To launch automated control, the system was installed and wired as defined by the manufacturer then the manufacturer was permitted remote access to adjust the settings. A web-cam interface was set up so that the manufacturer could implement control and watch the operation of the blind in real time. Implementation of direct solar exclusion required some commissioning by the manufacturer to set the brightness sensor threshold value.
The control system worked reliably during automated operations. Technical support and responsiveness provided by the manufacturer was excellent, timely, and very informative. In order to implement static operations with the same hardware setup, the manufacturer created a unique application for this experiment. This application had a software glitch when wind conditions required the blind to retract. Instead of returning the blind to a static condition, the blind was thereafter operated in the automatic mode. This glitch was fixed. When these errors occurred, the data were not used in the analysis.
Smaller angular increments and greater accuracy in positioning are possible if an encoding mechanism is incorporated. In this scheme, closed loop control of the drive shaft is done by creating an electrical signal directly proportional to shaft rotation. A microprocessor is integral to this mechanism and drives the motor to meet the desired position, determined by monitoring the encoder signal (typically a pulse train) in real time. This is an expensive control option, particularly if the motor is AC powered. The encoding electronics require a separate power supply and switching the AC line adds complexity. The electronics for controlling lower power encoded DC motors is typically less expensive but the required DC power supply adds to the total cost.
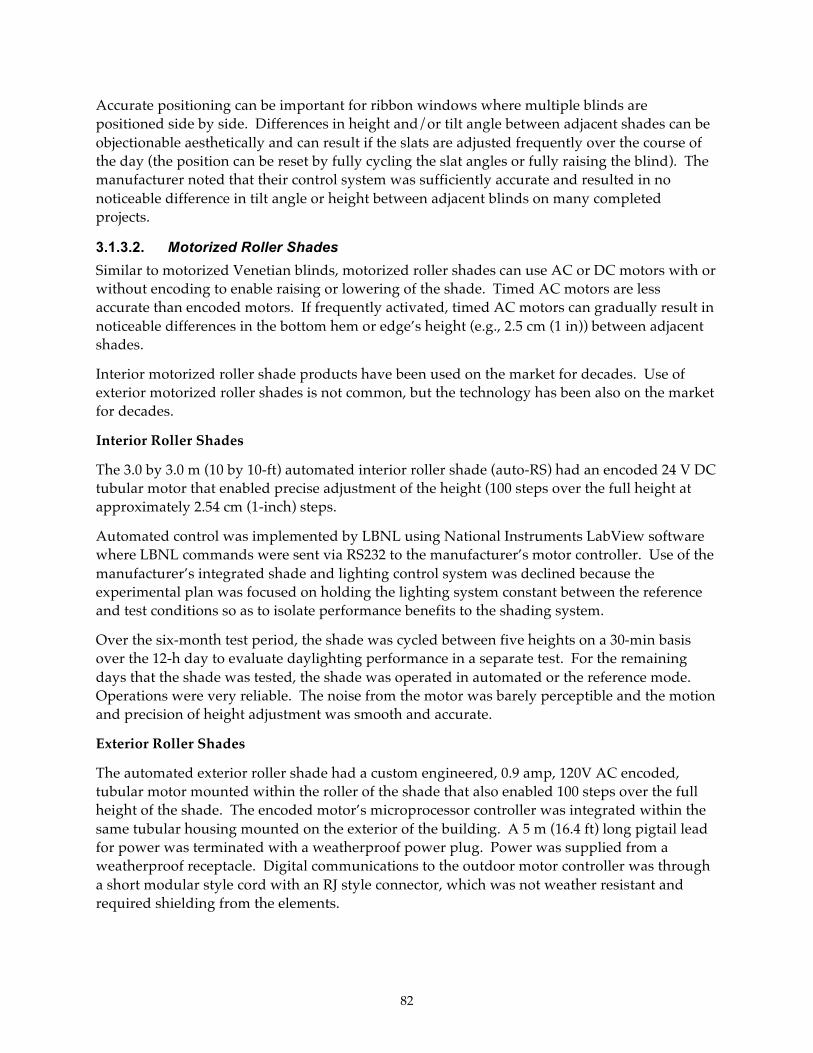
82
Accurate positioning can be important for ribbon windows where multiple blinds are positioned side by side. Differences in height and/or tilt angle between adjacent shades can be objectionable aesthetically and can result if the slats are adjusted frequently over the course of the day (the position can be reset by fully cycling the slat angles or fully raising the blind). The manufacturer noted that their control system was sufficiently accurate and resulted in no noticeable difference in tilt angle or height between adjacent blinds on many completed projects.
3.1.3.2. Motorized Roller Shades Similar to motorized Venetian blinds, motorized roller shades can use AC or DC motors with or without encoding to enable raising or lowering of the shade. Timed AC motors are less accurate than encoded motors. If frequently activated, timed AC motors can gradually result in noticeable differences in the bottom hem or edge’s height (e.g., 2.5 cm (1 in)) between adjacent shades.
Interior motorized roller shade products have been used on the market for decades. Use of exterior motorized roller shades is not common, but the technology has been also on the market for decades.
Interior Roller Shades
The 3.0 by 3.0 m (10 by 10-ft) automated interior roller shade (auto-RS) had an encoded 24 V DC tubular motor that enabled precise adjustment of the height (100 steps over the full height at approximately 2.54 cm (1-inch) steps.
Automated control was implemented by LBNL using National Instruments LabView software where LBNL commands were sent via RS232 to the manufacturer’s motor controller. Use of the manufacturer’s integrated shade and lighting control system was declined because the experimental plan was focused on holding the lighting system constant between the reference and test conditions so as to isolate performance benefits to the shading system.
Over the six-month test period, the shade was cycled between five heights on a 30-min basis over the 12-h day to evaluate daylighting performance in a separate test. For the remaining days that the shade was tested, the shade was operated in automated or the reference mode. Operations were very reliable. The noise from the motor was barely perceptible and the motion and precision of height adjustment was smooth and accurate.
Exterior Roller Shades
The automated exterior roller shade had a custom engineered, 0.9 amp, 120V AC encoded, tubular motor mounted within the roller of the shade that also enabled 100 steps over the full height of the shade. The encoded motor’s microprocessor controller was integrated within the same tubular housing mounted on the exterior of the building. A 5 m (16.4 ft) long pigtail lead for power was terminated with a weatherproof power plug. Power was supplied from a weatherproof receptacle. Digital communications to the outdoor motor controller was through a short modular style cord with an RJ style connector, which was not weather resistant and required shielding from the elements.
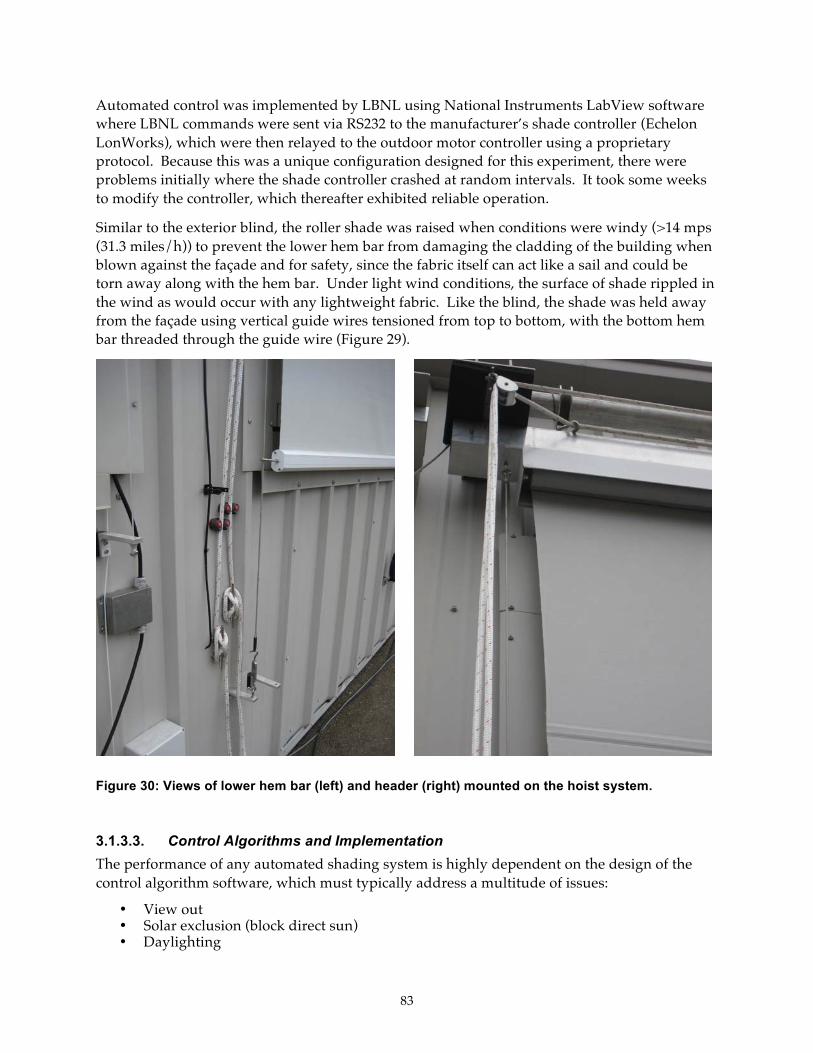
83
Automated control was implemented by LBNL using National Instruments LabView software where LBNL commands were sent via RS232 to the manufacturer’s shade controller (Echelon LonWorks), which were then relayed to the outdoor motor controller using a proprietary protocol. Because this was a unique configuration designed for this experiment, there were problems initially where the shade controller crashed at random intervals. It took some weeks to modify the controller, which thereafter exhibited reliable operation.
Similar to the exterior blind, the roller shade was raised when conditions were windy (>14 mps (31.3 miles/h)) to prevent the lower hem bar from damaging the cladding of the building when blown against the façade and for safety, since the fabric itself can act like a sail and could be torn away along with the hem bar. Under light wind conditions, the surface of shade rippled in the wind as would occur with any lightweight fabric. Like the blind, the shade was held away from the façade using vertical guide wires tensioned from top to bottom, with the bottom hem bar threaded through the guide wire (Figure 29).
Figure 30: Views of lower hem bar (left) and header (right) mounted on the hoist system.
3.1.3.3. Control Algorithms and Implementation The performance of any automated shading system is highly dependent on the design of the control algorithm software, which must typically address a multitude of issues:
• View out • Solar exclusion (block direct sun) • Daylighting
84
• Glare • Dampening of response to avoid motor noise and visual distraction • Dampening of response to extend motor or shading system lifetime • Protection of the shading system from weather (wind, ice, snow) • Building security • Scheduling and occupancy • Fire, egress, and other safety concerns
The automated, motorized shading business model is fairly fragmented and is rarely provided by a single company as a turn-key product, possibly due to low market demand. The shade hardware can be purchased from multiple component vendors and assembled to form a system (e.g., motor, shading system, sensors, etc.). The motor controller and microprocessor (programmable logic controller or desktop computer) that executes the control algorithm (i.e., tells the motor controller how to position the shade) is typically the domain of the control systems manufacturer or consultant and the quality of execution can vary widely.
Three different control implementations were tested:
• a solar exclusion and scheduling algorithm hardcoded in a programmable logic controller (PLC) offered by a major manufacturer of motorized shading systems;
• a solar exclusion and simple daylighting algorithm hardcoded in a PLC and offered by a separate controls consulting firm to a major manufacturer of exterior motorized blind systems; and,
• a solar exclusion, closed-loop daylighting algorithm implemented on a PC using LabView: the implementation was developed and tested by LBNL over the years.
For the first two systems, the PLC settings were adjusted using a PC-based user interface. The algorithms are detailed in Sections 2.1.1.2 and 2.1.1.3. Comments on the commissioning requirements and reliability are given in Section 3.1.3.1.
For the LBNL control system, both the interior and exterior Venetian blinds and roller shades were operated using the same control algorithm. This shade algorithm was developed to primarily minimize both cooling and lighting energy use on a real-time basis within internally-load dominated perimeter zones in typical commercial office buildings (Lee et al. 1998). To minimize cooling loads due to the window and lighting system, the shading system is positioned to block direct solar radiation then further closed to control interior daylight levels to within a specified range assuming a closed-loop proportional dimmable fluorescent daylighting control system. This second step further reduces window cooling loads while enabling the lights to be dimmed to optimum levels. The fluorescent system is then dimmed in response to available daylight.
To obtain correct control of direct sun, the control system needs to know the building site latitude, façade orientation, time of day, and whether the sun is shining or obscured by clouds. A solar profile angle is computed using standard equations to locate the position of the sun relative to the façade. This profile angle is used along with the geometry of the shading system, façade, and interior space to determine how to exclude sun with the shading system.
To determine if the sun is shining or obscured by clouds, a number of methods can be used. The simplest is to measure either the horizontal or vertical illuminance using several sensors for redundancy and then comparing the value to a pre-defined threshold value based on site observations and client definitions of “direct” sunlight. The type of sensor used and its shield
85
determines the accuracy of the data. The sensor should be cosine and spectrally corrected and stable over the range of outdoor conditions. Over the course of this test, Li-Cor illuminance sensors which met these criteria were placed to measure incident vertical illuminance just above the shaded window. A scissors lift was needed to access the sensor. Driving rains degraded the performance of the sensor, causing the sensor to eventually read high by about 10% over the 24-month test period.
The LBNL system required detailed commissioning to obtain high performance and reliable control of this closed-loop proportional control system:
! The ceiling-mounted shielded photosensor signal and daylight illuminance level at the work plane must be correlated over a range of shade positions (height and tilt) and sky conditions during the day in the final furnished space. This is a highly variable relationship so a conservative slope or “gain” is usually defined to ensure that the fluorescent control system provides sufficient light under all shade conditions.
! The ceiling-mounted photosensor signal and fluorescent power level (ballast control voltage) at varying levels of fluorescent light output must be correlated to the work plane illuminance level. This test must be conducted at night after 200 h of lamp burn-in in the final furnished space and adjusted as lamp output degrades over time.
Open-loop control systems are simpler and easier to commission but cannot deliver the optimum energy performance benefits of this integrated shading control system.
3.1.4. Summary Findings Twelve different innovative shading systems were evaluated using side-by-side monitored field tests in a full-scale mockup of a south-facing, furnished, private office with a large-area, high-transmittance window. State-of-the-art, spectrally selective low-e windows and a continuous dimmable fluorescent lighting system were used. The baseline reference shading condition was defined by an occupied condition where an interior shade was lowered to control direct sun and glare and left at this position throughout the day, as indicated by prior field studies of shade usage in occupied buildings. For the reference Venetian blind, the blind was fully lowered and the slat angle was set on a seasonal basis to exclude direct sun for the majority of the day. The reference roller shade system was set to a height of 0.76 m (2.5 ft) above the floor. Sky conditions were predominantly clear and sunny over the solstice-to-solstice monitored periods.
Each of the innovative shading systems were designed specifically to address one or more of the following performance objectives, while addressing practical constraints such as low cost, durability, maintenance, user acceptability, ease of manufacturability, and other factors:
• Solar control • Daylighting • Visual and thermal discomfort • View out
Intuitively, most end users understand that use of conventional shading systems results in some sort of compromise between the above performance objectives. One lowers the shade to block direct sun, reduce window glare, reduce window heat gains, and increase privacy. One raises

86
the shade to admit daylight, access view out, increase window heat gains (in a winter condition), and combat gloom. Innovative systems attempt to reduce these trade-off compromises to improve overall performance.
3.1.4.1. Manually-operated, Dual-zone, Interior Venetian Blinds Manually-operated, interior shading systems have the broadest applicability in both new and retrofit commercial buildings because of their low cost. However, they are difficult to regulate using energy codes, such as California’s Title-24, or promote using utility incentive programs because reductions in energy use or demand benefits are not assured. Interior shading systems are often selected by the tenant upon move in to the space, if not already installed as part of the base building, can be changed over the life of the building, and operated in ways that can defeat the energy-savings potential of the device. The same can be said for the most part of dual-zone, interior shading systems unless occupants are well educated as to the design intent of the system. Promotion of this technology will likely be accomplished on the basis of amenity rather than energy-cost savings.
Monitored data showed that lighting energy use of the two dual-zone Venetian blinds (split-VB and split-opt-VB) was 9-11% greater compared to the reference shading system with the same daylighting control system. Savings were 62-65% compared to a non-dimming case. Window cooling loads due to solar and thermal heat gains were increased by 2-8% given the more open slat angles in the upper zone compared to the reference blind. Peak cooling loads were reduced by 2% or increased by 8% for the split-opt-VB and split-VB, respectively. The dual-zone optical blind (split-opt-VB) performed better than the dual-zone ganged blind (split-VB) with respect to the energy-related performance parameters.
In terms of comfort parameters, however, window luminance was best controlled by the dual-zone blind with a matte white finish on the upper surface and a low-reflectance metallic finish on the under surface of the slats (split-VB), if the judgment is made based on average whole window luminance facing the window over the monitored period. The window luminance threshold value of 2000 cd/m2 was exceeded less often and the magnitude of exceedance was significantly less compared to the reference blind and the dual-zone blind with prismatic reflecting slats (split-opt-VB). Still, the luminance threshold was exceeded for an unacceptable percentage of the day in all three cases: 19-37%. Region luminance data confirmed this trend. With dual zone blinds, one concern is that the upper zone can be a direct glare source to occupants seated farther from the window, as occurs in open plan offices with low-height partitions. Under clear sky conditions, the upper zone window luminance was found to be high for a large fraction of the day for both split blind systems, with the split-VB performing the worst (39% of day the 2000 cd/m2 threshold was exceeded with an average luminance of 3722 cd/m2 when exceeded). The weighted average daylight glare index (DGIw) indicated that if the occupant faces the sidewall to perform computer-based tasks, discomfort glare is below “just perceptible” levels under all sky conditions for all three system, reference and test cases. For the view facing the window, DGIw values were in the range of 20-28 or “just acceptable” to “just intolerable” levels, with the test cases yielding slightly more comfortable conditions than the reference case.
The split-VB was simple to install, easy to operate, and resulted in a soft diffusion of daylight over the entire room cavity under sunny conditions when the sun was in the plane of the
87
window. Partially obstructed view out was possible between the equinox and summer solstice for this south-facing window. Between the equinox and winter solstice, the lower zone obscured view entirely to block low angle sun, but the upper zone countered with daylight. The incremental cost of the blind is assumed to be small over a conventional blind because the ganged zoned relationship between the upper and lower slats is achieved simply by clamping the vertical supports to the string ladders on which the slats rest. Maintaining a consistent difference in slat angles between the upper and lower zone may be difficult to achieve with multiple side by side blinds straight from the factory. Tuning of the string ladder clamping system may be required at the site.
The split-opt-VB was more costly to install since the upper zone was not ganged to the lower zone using the same header. Instead, the two zones were achieved by using two separate blinds hung one above the other. An intermediate beam or window mullion is needed to hang the lower blind but provides the added flexibility of being able to tailor slat position to specific needs. The added cost of the prismatic slats is unknown. Like the split-VB, this blind resulted in a more balanced luminance distribution over the room surfaces, combating the conventional cave-like contrasts one often sees in a sidelit room. However, the prismatic surface of the slats caused small-area specular reflections to occur off the slats or off the window glazing, which in turn caused visual discomfort.
Prior to the start of the test, the research team repeatedly requested that the manufacturer provide detailed guidance on how to position the slats, but no specific information was relayed in time for testing. Therefore, the lower slat angles were adjusted seasonally to block direct sun for the majority of the day. After the test, the EU manufacturer stated that the slats were incorrectly positioned and results were therefore invalid: the lower and upper slat angles should have been set at the same horizontal angle to reflect solar out the window, bring in diffuse daylight, and provide view out. While perhaps adequate for the predominantly overcast sky conditions of the EU, for this sunny climate, such a position would admit direct sunlight and create uncomfortable conditions, necessitating manual repositioning of the blind to block direct sun over the course of the day. Prior field studies suggest that blind repositioning on a daily basis is unrealistic: most occupants set and forget the shading system for periods of weeks or even months. The suggested horizontal slat angle was adhered to for the equinox to summer solstice period, but for the winter solstice to equinox period when the sun was at a lower altitude, the lower blind had to be more closed.
One must speculate what the energy use savings would be if comfort conditions were first satisfied. Comparing the monitored energy performance data would have been easier if visual comfort requirements were met first, or if comfort performance could be normalized between all test conditions. However, the research team could not predict a priori the shade position that would yield visually comfortable conditions under real sun and sky conditions. Simulations must also be conducted by trial and error to define solutions that first meet basic visual and thermal comfort requirements. Clearly, the reference and test case blinds needed to be more closed to reduce discomfort glare and window luminance and this will likely increase lighting energy use and reduce cooling load. The magnitude of these trade-offs could be further investigated using simulation tools capable of modeling optically-complex systems (see Section 3.2.2).
88
To obtain the performance benefits associated with this class of shading devices, the end user must understand the basis for the shade’s design and then operate the shade accordingly. This is a tall order and not sufficient grounds to clearly justify an “investment” based solely on energy savings. It is likely that end users will adjust slat angles to block sun and glare and also raise the shade partially or fully on occasion to obtain an unobstructed view out. The primary benefit of low-cost, dual-zone blind systems is the sense of a more uniform, brighter room cavity luminance distribution when the lower blinds are closed to control glare.
3.1.4.2. Daylighting with Translucent Panels Translucent insulating glass units or panels can have broad market applicability in new commercial buildings because of their simplicity and low maintenance. For retrofit markets, translucent films can be applied to the interior surface of the glazing as a low-cost option. However, conventional translucent glazings are known to cause discomfort glare when backlit by direct sun and so are typically placed in clerestory windows in high bay spaces out of the direct field of view, such as in school gymnasiums.
The translucent panel tested in the monitored field study (diffuse-VB) was constructed with a white veil material sandwiched between two sheets of acrylic (in commercial applications, the material would be glass). The panel was said to have close to hemispherical or Lambertian diffusion properties and therefore of superior performance compared to conventional acid etched or fritted glass. The argument was that if the transmission of the panel is sufficiently low and/or if the optical output from the panel is hemispherically diffusing (instead of specularly downward into the eyes of the occupants), then discomfort glare may be mitigated while preserving the daylighting function of the window. The panel used for this study had a visible transmittance of 0.47, which when combined with the window, resulted in a visible transmittance at normal incidence of approximately 0.29. The panel was used in the upper zone of the window wall and the same reference blind was used in the lower zone.
Lighting energy use was increased by 5% compared to the reference blind but lighting energy savings compared to a non-dimmable lighting system were nearly comparable: 65% versus 66%. Study of this system was focused on the lighting and comfort trade-offs of this system, given the design intent of the panel. The cooling load performance data are not given for a real-world application due to the practical constraints of the field test procedure: the 7 cm (2.75 in) thick panel was placed inboard of the existing window, not used as the primary window as intended. Reduction in window loads were favorable however: 15% reduction in window loads and 14% reduction in peak window loads compared to the reference blind system due to the lower SHGC and U-value of the panel.
Under sunny conditions, the average window luminance was significantly reduced compared to the reference blind, both in terms of frequency and degree of exceedance over the threshold value but the system still failed to control window luminance to within the 2000 cd/m2 limit for 30% of the day under the full range of monitored conditions. Under clear sky conditions, the luminance of the upper window region exceeded the 2000 cd/m2 limit on average 30% of the day with an average luminance of 4702 cd/m2 when exceeding the limit. Under clear sky conditions, the weighted discomfort glare index values were nearly equal to that of the reference blind.

89
To satisfy visual comfort requirements if one uses the panels in an office-like setting, one must further reduce the visible transmittance of the panel, which in turn increases lighting energy use. Because the properties of the panel are fixed once purchased, one must optimize for daylighting and glare at the design stages of the building or else resort to use of interior shades for glare control after the panels have been installed. Under cloudy conditions, the low-transmittance panel created a slightly gloomy appearance to the room with its diffuse lighting quality. There was no view out through this translucent glazing material.
3.1.4.3. Automated Interior Shading Systems Motorized interior shading systems have been used commercially for 20-30 years in commercial buildings in lobbies, conference rooms, and other public spaces but have rarely been used as an automated system. Automated roller shades and louver systems have been more recently used in well publicized, daylit buildings such as the Genzyme Building in Cambridge or The New York Times Headquarters in Manhattan. The systems span a range of mid-priced solutions for broad scale applications to high-priced optically-engineered solutions with the promised potential of significantly greater performance, amenity, and user-friendly features.
The three systems evaluated in this field study performed better overall than their static counterparts. The automated, mirrored blind (auto-split-mir-VB1) reduced lighting energy use by 5% compared to the reference blind and by 69% compared to a non-dimmable lighting system (average daytime (6:00-18:00) lighting power density of 0.31 W/ft2-floor). The automated blind and roller shade systems, which were both controlled using a prototype LBNL algorithm, achieved an average 62-63% reduction in full power lighting load. These levels were comparable to the static systems.
The automated mirrored blind increased average window cooling loads by 10%, while the auto-VB and auto-RS decreased cooling loads by 22% and 4%, respectively, compared to the reference-VB and reference-RS. Peak cooling loads were increased by 7% with the mirrored blind, while the auto-VB and auto-RS decreased peak cooling loads by 15% and 7%, respectively. Cooling load reductions are dependent on the material, geometry, and reflectance properties of the shading system. Both the reference and tested systems used light colored materials to reflect solar radiation back out the window. Peak cooling loads were still significant: 105.1 W/m2-floor (9.8 W/ft2-floor) for the reference-RS shading case with this large-area dual pane window (WWR=0.73, SHGC=0.40).
The automated systems were distinguished from the static systems by their provision of visually comfortable conditions, thereby accomplishing the technical goal of optimizing daylight-glare trade-offs. The average whole window luminance of the auto-RS never exceeded the 2000 cd/m2 limit while the auto-VB exceeded the limit for less than 1% of the day over the monitored period. The auto-split-mir-VB1 exceeded the threshold for 9% of the day with an average luminance level of 2778 cd/m2 during the periods of exceedance. Analysis of discomfort glare using the more detailed HDR dataset revealed that the automated retractable systems (auto-split-mir-VB1, auto-RS) did however increase visual discomfort during cloudy and overcast sky conditions since the limit on control was not sufficiently conservative. Discomfort glare from the bright sky resulted when the shades were raised. The weighted DGI analysis confirmed this finding: values were below the “just perceiptible” level facing the
90
sidewall, but for a view facing the window, the DGIw values were lower than the reference condition under sunny conditions are significantly greater if the systems were retractable.
The automated roller shade system was robust, reliable, and mechanically simpler, compared to the automated Venetian blind systems tested in this field study. This encoded DC-motorized system provided very quiet, precise, and repeatable height adjustments. The manufacturer providing the shading systems was responsive, timely, and technically savvy. The LBNL control system enabled direct optimization with the lighting system using the same ceiling-mounted photosensor as the lighting system, but requires some technical expertise and time to commission properly.
Both the conventional and optical Venetian blinds were disappointing for different reasons. The motorized conventional blind used an encoded AC motor but the lift function failed within the six-month period of testing. Slat angle adjustments were reliable, but the adjustments were made rapidly and motor noise was perceptible, being a potential source of distraction to the occupants. An encoded, pulsed DC motor system was engineered by LBNL in prior research but similar systems are not offered commercially, probably due to cost.
The optical Venetian blind itself was beautifully engineered but was rather large for a private office setting. The modest control system provided by a partnering manufacturer implemented rapid and noisy slat adjustments to full closure each time slat adjustments were needed. The raise and lower function was equally noisy. The control system itself was not completely reliable and the technical support was insufficient, vague, and untimely so diagnosis of operational glitches were not possible (as with other manufacturers) and proper operation was only established after trial and error inputs to the PC-based user interface. The ganged relationship between the lower and upper sections prevented view out the lower section when the upper section was open and controlled for daylight. End users could lift the blind to a height where they could look under the lower edge of the blind, but this would likely increase cooling loads. The blind manufacturer did offer an encoded motor control system with control algorithms that enable daylight redirection with the mirrored upper clerestory section of the blind but was unable to provide this system for the test due to lack of resources (an engineer from the EU would had to have been flown out to commission the system). Given the quality of engineering on the blind, the system warrants use of a well designed control system, which puts the cost of the system in the realm of higher-end solutions, rather than the low- to medium priced solutions needed for widespread use in commercial buildings
3.1.4.4. Static or Manually-operated Exterior Shading Systems Static or manually-operated exterior louvered systems provide significant solar control and are used widely throughout the EU on non-air conditioned, low- to mid-rise, historic and new commercial buildings. The EU climate is moderate and typically overcast, so these systems can provide a practical solution for maintaining comfortable thermal conditions during periodic sunny summer conditions. When asked about how reliably occupants operate these systems, an EU engineer stated that occupants quickly learn by experience to adjust the systems and avoid thermal discomfort.
Fixed, static louvered systems are commercially available from a number of sources and mimic the shading function of deep overhangs or fins but with a slimmer profile. Manually-operated louver systems, which are less common in the U.S., have a hand crank that can be accessed from

91
the exterior or interior. The crank enables occupants or the facility manager to adjust both the height and slat angle of the shading system. Because the systems are not automated, the shades are held away from the façade using vertical cables to prevent movement in the wind. The systems are designed for applications where wind speeds are anticipated to be low.
Two conventional exterior Venetian blind systems were evaluated (VB-E1n, VB-E2n) with the assumption that the blinds were lowered throughout the year but the slat angles were adjusted seasonally to block direct sun using one of the five available preset slat angles. Single- and dual-zone systems were tested. The upper clerestory section of the dual-zone blind could be adjusted independently of the lower blind and was set to slat angles that were more open than the lower blind to admit more daylight. Lighting energy use was increased by 7-11% compared to the reference interior Venetian blind, but savings compared to a non-dimming case were still high: 59-61%. Both systems resulted in visually uncomfortable conditions for an unacceptably high percentage of the day (38-52%), with moderately high levels of exceedance (2626-3403 cd/m2) in the upper and middle regions of the window under clear sky conditions. Cooling load reductions were significant, as would be expected in this sunny climate: 78-94% compared to the reference interior blind system. Peak cooling loads were reduced from 108.7 W/m2-floor (10.1 W/ft2) for the reference condition to 17.2-33.2 W/m2-floor (1.6-3.1 W/ft2) in the 4.57 m (15 ft) deep perimeter zone.
To reduce discomfort glare, a more closed angle than the solar exclusion angle is required, which in turn will reduce cooling loads further, increase lighting loads, and reduce view out. The limited preset slat angles placed restrictions on the test: a true manually-operated exterior blind system would allow fine tuning of slat angles.
The three-zone optical exterior blind (VB-E3opt) can be adjusted using a hand crank but was designed to be fully lowered and left at a specific slat position year round. The inventor stated that the blind was designed to be applicable to any façade, independent of orientation or latitude. For this south-facing façade, lighting energy use was increased by 25% or 0.06 W/ft2 compared to the reference interior Venetian blind but yielded an average 53% reduction in total installed load (0.47 W/ft2-floor) during the 12-h period. Cooling load reductions were 88% and peak cooling load reductions were 74%. Peak cooling load levels were 28.0 W/m2-floor (2.6 W/ft2-floor). The three-zone system provided considerably better control of discomfort glare compared to the conventional static reference and exterior blinds because it had overall a more closed slat angle throughout the year and blocked direct views of the sky in the upper region. Whole window luminance levels facing the window exceeded the 2000 cd/m2 threshold 6%of the day with minor levels of exceedance (2302 cd/m2 average). Partial view out was possible throughout the year. The polished aluminum louvers created a reflective surface from the exterior and so for some cities with zoning regulations against such facades, the area of use would need to be limited according to such regulations.
3.1.4.5. Automated Exterior Shading Systems Automated exterior shading systems add complexity and cost, but can add features that outweigh these disadvantages such as reliable responsiveness to critical peak demand events, seasonal response to heating and cooling demands of the perimeter zone, and daily response to sunny or overcast daylight conditions. Automation can provide increased amenity by raising
92
the system for unmitigated views out under overcast sky conditions and during periods when outdoor daylight levels are low.
The manufacturer of the automated exterior Venetian blind systems provided two fairly simple control solutions, but notes that more sophisticated control could have been provided if requested. The research team deliberately provided little guidance, as might be expected of an inexperienced client. Model-based control algorithms will be tested in future work. The actual slat operations of the two automated Venetian blind control systems were distinguished only during the winter period for this south-facing facade, so performance levels were generally comparable. On average, performance levels were also comparable to the static exterior Venetian blind systems. The control algorithms for the two automated systems were simple and primarily directed toward reliable solar exclusion. What is not evident in the data is the benefit of view with automation when direct sun control is not required. The blind was retracted during these periods, enabling completely unobstructed views out.
The fixed speed AC motor is a practical, low-cost solution for exterior blind systems and is likely to be more reliable than encoded counterparts over the long run. This does place restrictions on the quality and accuracy of slat adjustments, which then limits the fine tuning one would like to have to modulate daylight levels once solar exclusion has been accomplished. However, because the systems must be raised to prevent damage under windy conditions, interior shades may need to be installed as backup, in which case the control algorithm for the exterior shade might best be directed toward simple solar control, leaving the control of discomfort glare and daylight to the occupants. This potential need for interior shades adds complexity and uncertainty to cost-benefit performance evaluations. For the fairly exposed site conditions of this test, windy conditions were rare at this site: only four winter days out of the one year period required that the shades be raised.
Like the other exterior shading systems, the automated roller shade provided significant energy and peak demand benefits compared to the reference case. The automated exterior roller shade was compared to a static interior roller shade so the percent lighting energy savings (36%) were significantly greater than that for the blind systems (-4% to -25%), but average lighting energy use savings compared to a non-dimming system were comparable to the blinds (i.e., 67% for the roller shade compared to a range of 53-59% for the blinds). The automated exterior roller shade was controlled by an LBNL algorithm that provided solar control and daylight optimization. Cooling load and peak cooling load reductions were not as high as the single-zone exterior blind systems but were still respectable: 80% cooling load and 76% peak cooling load reductions were attained compared to the interior reference roller shade. Unlike the blind systems, the automated system exerted significantly better control over window luminance levels, exceeding the 2000 cd/m2 limit on average 2% of the day. Detailed analysis revealed that discomfort would occur from bright regions of the sky when the shade was retracted under partly cloudy or overcast sky conditions. Partial view out through the fabric and unobstructed views out through the vision window below the shade was possible for the majority of the year. The automated roller shade is considerably less complex than the blind systems: the encoded AC motor was able to protect the electronics of the motor controller in the tubular housing of the header and execute accurate height adjustments over an almost continuous range of heights (e.g., 100 steps). Like the automated exterior blinds, an unencoded AC motor could be used as well, with nighttime reset to improve daytime accuracy in height positioning. Protection from
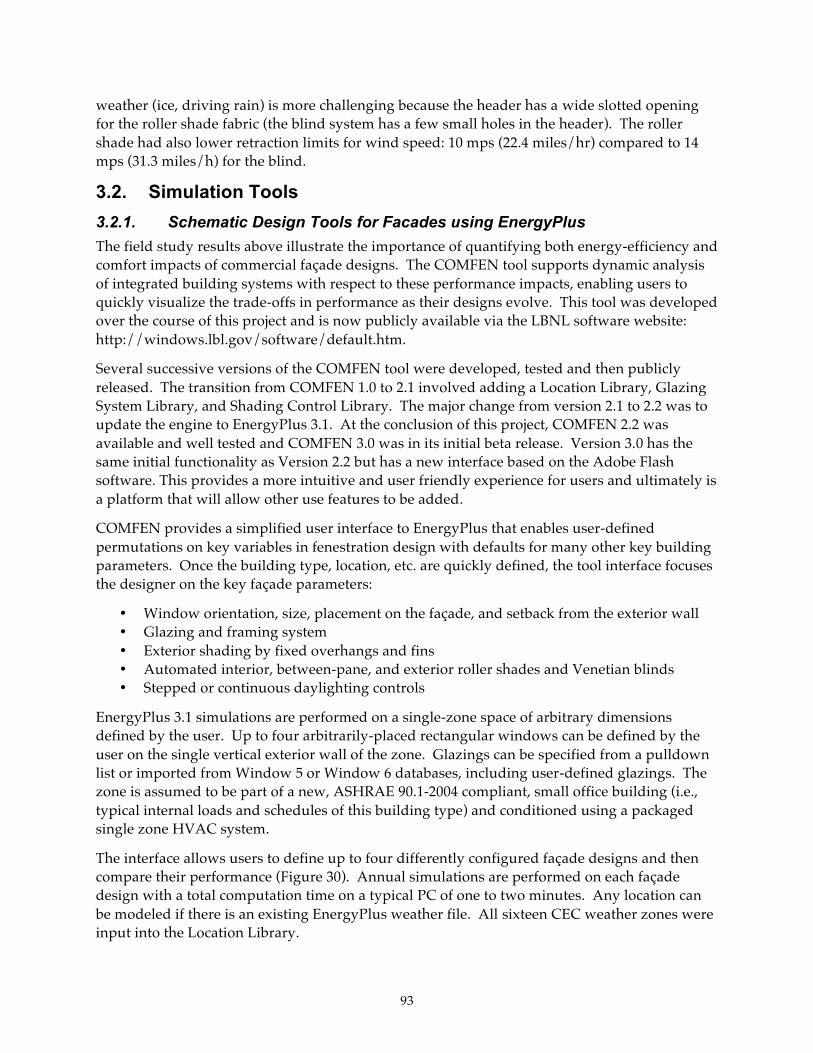
93
weather (ice, driving rain) is more challenging because the header has a wide slotted opening for the roller shade fabric (the blind system has a few small holes in the header). The roller shade had also lower retraction limits for wind speed: 10 mps (22.4 miles/hr) compared to 14 mps (31.3 miles/h) for the blind.
3.2. Simulation Tools 3.2.1. Schematic Design Tools for Facades using EnergyPlus The field study results above illustrate the importance of quantifying both energy-efficiency and comfort impacts of commercial façade designs. The COMFEN tool supports dynamic analysis of integrated building systems with respect to these performance impacts, enabling users to quickly visualize the trade-offs in performance as their designs evolve. This tool was developed over the course of this project and is now publicly available via the LBNL software website: http://windows.lbl.gov/software/default.htm.
Several successive versions of the COMFEN tool were developed, tested and then publicly released. The transition from COMFEN 1.0 to 2.1 involved adding a Location Library, Glazing System Library, and Shading Control Library. The major change from version 2.1 to 2.2 was to update the engine to EnergyPlus 3.1. At the conclusion of this project, COMFEN 2.2 was available and well tested and COMFEN 3.0 was in its initial beta release. Version 3.0 has the same initial functionality as Version 2.2 but has a new interface based on the Adobe Flash software. This provides a more intuitive and user friendly experience for users and ultimately is a platform that will allow other use features to be added.
COMFEN provides a simplified user interface to EnergyPlus that enables user-defined permutations on key variables in fenestration design with defaults for many other key building parameters. Once the building type, location, etc. are quickly defined, the tool interface focuses the designer on the key façade parameters:
• Window orientation, size, placement on the façade, and setback from the exterior wall • Glazing and framing system • Exterior shading by fixed overhangs and fins • Automated interior, between-pane, and exterior roller shades and Venetian blinds • Stepped or continuous daylighting controls
EnergyPlus 3.1 simulations are performed on a single-zone space of arbitrary dimensions defined by the user. Up to four arbitrarily-placed rectangular windows can be defined by the user on the single vertical exterior wall of the zone. Glazings can be specified from a pulldown list or imported from Window 5 or Window 6 databases, including user-defined glazings. The zone is assumed to be part of a new, ASHRAE 90.1-2004 compliant, small office building (i.e., typical internal loads and schedules of this building type) and conditioned using a packaged single zone HVAC system.
The interface allows users to define up to four differently configured façade designs and then compare their performance (Figure 30). Annual simulations are performed on each façade design with a total computation time on a typical PC of one to two minutes. Any location can be modeled if there is an existing EnergyPlus weather file. All sixteen CEC weather zones were input into the Location Library.

94
Output data are graphically displayed side-by-side as bar or line charts for the four designs: annual energy use (total and component end uses), peak demand, CO2 emissions, daylight illuminance, daylight glare index (DGI), and percent people dissatisfied with the thermal environment. Monthly data are charted. The user can also input a date and obtain hourly daylight illuminance and DGI plots.
The software is beginning to be used by architects on several real projects. While initially the plan was to release and promote COMFEN 2.2, the team decided to wait for the 3.0 version since its interface is notably better. COMFEN will continue to undergo testing and modification as new versions of EnergyPlus are released and new features are added (Figure 31). The team also has prototype versions that work with the Google Sketchup interface and another version that can be linked to Radiance. Further functional capabilities as well as usability features are planned for the next development phase. For the latest version, download the software at: http://windows.lbl.gov/software/
Figure 31: The main screen of COMFEN 2.2 allows comparison of four different façade designs.

95
Figure 32: COMFEN 3 will have a new interface based on the Adobe Flash software.
On-line Façade Design Tool
In parallel with the COMFEN work, the database and interface for the on-line commercial façade design tool was updated. An earlier version of this on-line tool relied on a database of DOE-2 parametric simulations. In this project, a new database of EnergyPlus parametric simulations was created that expanded the range of design options. The tool enables side-by-side performance comparisons of four façade design scenarios for a small office or ranks design options based on user-specified design conditions (e.g., show all solutions for a north facing façade that yield the lowest energy use).
Input options include:
• Location: seven U.S. locations, including Los Angeles • Window orientation: North, east, south, west • Window area (window-to-wall area ratio, WWR): five sizes ranging from 15-75% in
increments of 15% • Glazing type: 14 different glazing types ranging from single-pane clear to quadruple-
pane, spectrally-selective low-E • Interior shades: none or a simple diffusing shade deployed every hour based on direct
sun and glare, if needed • Exterior shades: none, 0.61 m or 1.22 m (2 ft or 4 ft) overhang

96
• Daylight controls: none, stepped, or continuous controls
Output data are shown in a series of bar charts that include annual energy use, peak demand, CO2 emissions, average daylight illuminance, DGI, and PPD (Figure 32). This tool can be accessed from the project website or directly at: http://www.commercialwindows.org/
Figure 33: Example output from the on-line Façade Design Tool.
3.2.2. Simulating Complex Fenestration Systems (CFS) with Radiance and EnergyPlus The Window 6 program includes new capabilities to calculate bi-directional transmittance and reflectance distribution function (BTDF and BRDF, also collectively referred to as BSDF for “Scattering”) characteristics of optically complex fenestration systems (CFS). These CFS can include layers of products with conventional scattering or even sunlight re-directing properties (e.g., holographic glazing, laser-cut glass). Window 6 outputs BSDF data files formatted to an XML schema definition (XSD) which are intended to be used by thermal and daylighting simulation tools. This project provided synergistic support to a broad U.S. DOE-supported long-term activity to develop robust and reliable BSDF-enabled simulation tools. EnergyPlus related activities included:
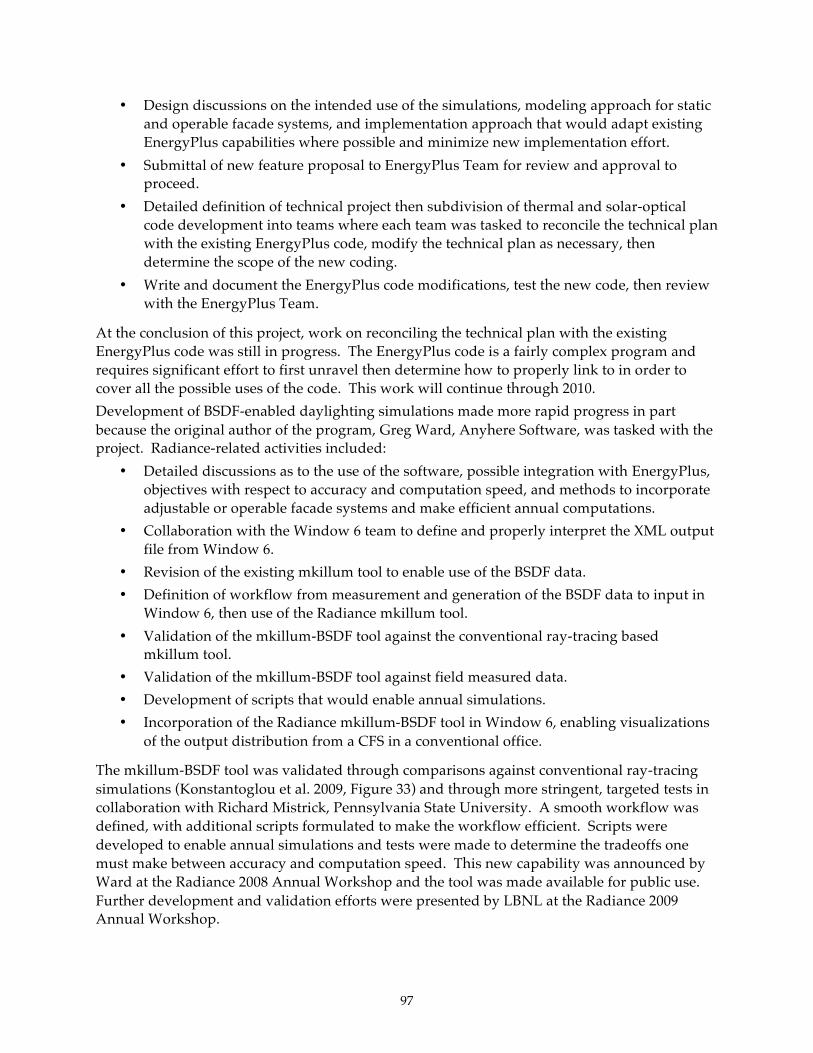
97
• Design discussions on the intended use of the simulations, modeling approach for static and operable facade systems, and implementation approach that would adapt existing EnergyPlus capabilities where possible and minimize new implementation effort.
• Submittal of new feature proposal to EnergyPlus Team for review and approval to proceed.
• Detailed definition of technical project then subdivision of thermal and solar-optical code development into teams where each team was tasked to reconcile the technical plan with the existing EnergyPlus code, modify the technical plan as necessary, then determine the scope of the new coding.
• Write and document the EnergyPlus code modifications, test the new code, then review with the EnergyPlus Team.
At the conclusion of this project, work on reconciling the technical plan with the existing EnergyPlus code was still in progress. The EnergyPlus code is a fairly complex program and requires significant effort to first unravel then determine how to properly link to in order to cover all the possible uses of the code. This work will continue through 2010. Development of BSDF-enabled daylighting simulations made more rapid progress in part because the original author of the program, Greg Ward, Anyhere Software, was tasked with the project. Radiance-related activities included:
• Detailed discussions as to the use of the software, possible integration with EnergyPlus, objectives with respect to accuracy and computation speed, and methods to incorporate adjustable or operable facade systems and make efficient annual computations.
• Collaboration with the Window 6 team to define and properly interpret the XML output file from Window 6.
• Revision of the existing mkillum tool to enable use of the BSDF data. • Definition of workflow from measurement and generation of the BSDF data to input in
Window 6, then use of the Radiance mkillum tool. • Validation of the mkillum-BSDF tool against the conventional ray-tracing based
mkillum tool. • Validation of the mkillum-BSDF tool against field measured data. • Development of scripts that would enable annual simulations. • Incorporation of the Radiance mkillum-BSDF tool in Window 6, enabling visualizations
of the output distribution from a CFS in a conventional office.
The mkillum-BSDF tool was validated through comparisons against conventional ray-tracing simulations (Konstantoglou et al. 2009, Figure 33) and through more stringent, targeted tests in collaboration with Richard Mistrick, Pennsylvania State University. A smooth workflow was defined, with additional scripts formulated to make the workflow efficient. Scripts were developed to enable annual simulations and tests were made to determine the tradeoffs one must make between accuracy and computation speed. This new capability was announced by Ward at the Radiance 2008 Annual Workshop and the tool was made available for public use. Further development and validation efforts were presented by LBNL at the Radiance 2009 Annual Workshop.

98
a) Falsecolour luminance map (cd/m2) rendered with the use of BSDF data. Matte-VB: January 15, 10:00 AM.
c) Difference in luminance (cd/m2) image (b) and (a) (nonBSDF – BSDF).
b) Falsecolour luminance map (cd/m2) rendered without use of BSDF data. Matte-VB: January 15, 10:00 AM.
d) HDR picture taken on the 01/15 at 10:00 AM in the test room.
Figure 34: Falsecolor luminance maps generated using the Radiance mkillum tool with and without the use of BSDF data (images a-c). Falsecolor luminance image taken in the LBNL Windows Testbed Facility (image d).
One can now visualize the output distribution of a CFS through an option within Window 6 that runs the Radiance mkillum script. The resultant image is not entirely satisfactory unless
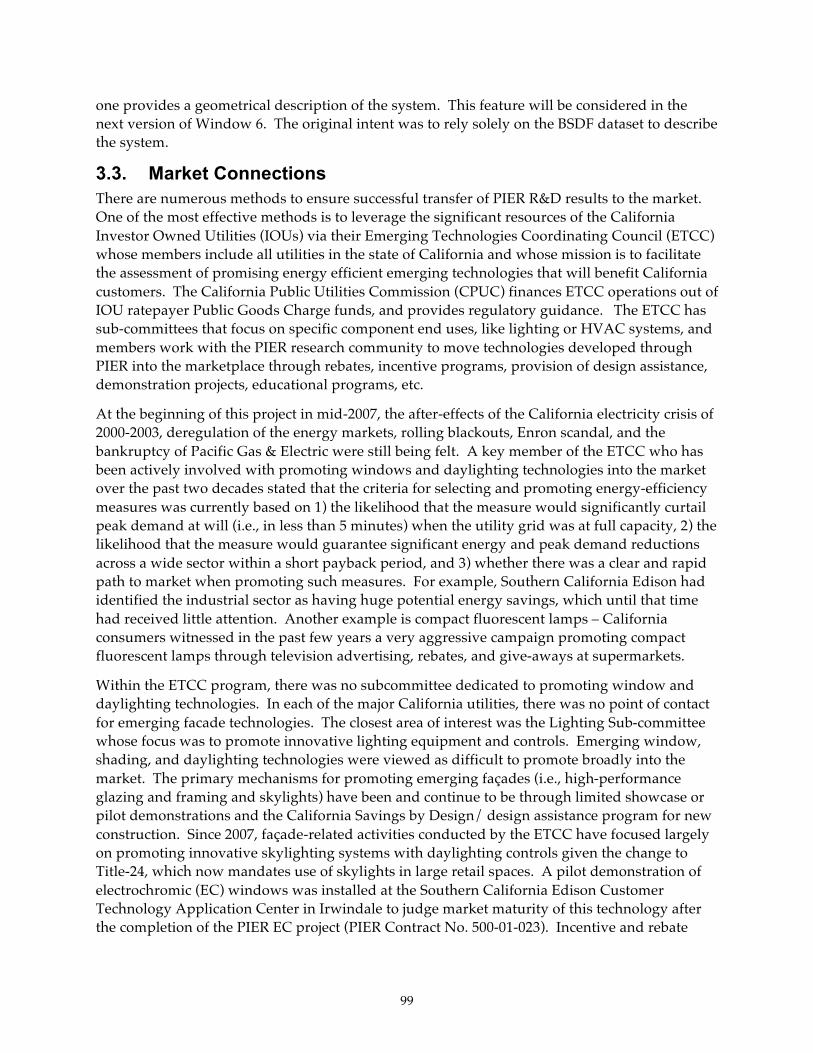
99
one provides a geometrical description of the system. This feature will be considered in the next version of Window 6. The original intent was to rely solely on the BSDF dataset to describe the system.
3.3. Market Connections There are numerous methods to ensure successful transfer of PIER R&D results to the market. One of the most effective methods is to leverage the significant resources of the California Investor Owned Utilities (IOUs) via their Emerging Technologies Coordinating Council (ETCC) whose members include all utilities in the state of California and whose mission is to facilitate the assessment of promising energy efficient emerging technologies that will benefit California customers. The California Public Utilities Commission (CPUC) finances ETCC operations out of IOU ratepayer Public Goods Charge funds, and provides regulatory guidance. The ETCC has sub-committees that focus on specific component end uses, like lighting or HVAC systems, and members work with the PIER research community to move technologies developed through PIER into the marketplace through rebates, incentive programs, provision of design assistance, demonstration projects, educational programs, etc.
At the beginning of this project in mid-2007, the after-effects of the California electricity crisis of 2000-2003, deregulation of the energy markets, rolling blackouts, Enron scandal, and the bankruptcy of Pacific Gas & Electric were still being felt. A key member of the ETCC who has been actively involved with promoting windows and daylighting technologies into the market over the past two decades stated that the criteria for selecting and promoting energy-efficiency measures was currently based on 1) the likelihood that the measure would significantly curtail peak demand at will (i.e., in less than 5 minutes) when the utility grid was at full capacity, 2) the likelihood that the measure would guarantee significant energy and peak demand reductions across a wide sector within a short payback period, and 3) whether there was a clear and rapid path to market when promoting such measures. For example, Southern California Edison had identified the industrial sector as having huge potential energy savings, which until that time had received little attention. Another example is compact fluorescent lamps – California consumers witnessed in the past few years a very aggressive campaign promoting compact fluorescent lamps through television advertising, rebates, and give-aways at supermarkets.
Within the ETCC program, there was no subcommittee dedicated to promoting window and daylighting technologies. In each of the major California utilities, there was no point of contact for emerging facade technologies. The closest area of interest was the Lighting Sub-committee whose focus was to promote innovative lighting equipment and controls. Emerging window, shading, and daylighting technologies were viewed as difficult to promote broadly into the market. The primary mechanisms for promoting emerging façades (i.e., high-performance glazing and framing and skylights) have been and continue to be through limited showcase or pilot demonstrations and the California Savings by Design/ design assistance program for new construction. Since 2007, façade-related activities conducted by the ETCC have focused largely on promoting innovative skylighting systems with daylighting controls given the change to Title-24, which now mandates use of skylights in large retail spaces. A pilot demonstration of electrochromic (EC) windows was installed at the Southern California Edison Customer Technology Application Center in Irwindale to judge market maturity of this technology after the completion of the PIER EC project (PIER Contract No. 500-01-023). Incentive and rebate

100
programs for window films, awnings in desert climates, and double-pane windows were also offered by SCE.
In parallel with the ETCC pathway, PIER also promotes emerging technologies through the University of California (UC)/ California State University (CSU) Technology Demonstration program, administered through the CIEE. The 2007-2010 portfolio of building technologies was focused principally on smart lighting fixtures (occupancy and photosensor based), HVAC measures (duct sealing, VAV static pressure reset, etc.), and energy information systems. PIER technologies were selected on the basis that the UC or CSU client would ultimately deploy the technology widely across all campuses having gained experience working with the technology in a limited demonstration. The technology was typically purchased by the program with the cost of installing the technology borne by the facility manager. The demonstration program required minimal involvement of the PIER R&D team. For emerging window technologies, the cost of installation is non-trivial and determining applicability is site-specific (north or south-facing? Dark tinted glass or heavily obstructed window?), requiring some basic knowledge about HVAC and lighting systems and occupancy requirements before specifying the product. The existing demonstration program was unable to accommodate this level of complexity even though large savings appear possible.
In late 2007 and in response to solicitations by LBNL to collaborate, SCE with input from LBNL and HMG identified automated exterior and between-pane shading systems as an area of interest. SCE funded a product evaluation study by Heschong Mahone Group (HMG) to determine market viability and at its conclusion, HMG identified several key barriers – cost and complexity – to widespread deployment. SCE submitted an internal proposal in late 2008 to do a follow-up study, identifying a market size in California of 2200 Mft2. Primary market barriers were identified: a) high cost due to low production volumes, b) unfamiliarity of A/Es with product offerings, c) lack of adequate, simple design tools to estimate energy impacts, and d) lack of understanding on the part of the manufacturers of product benefits. Because of these factors, the SCE program was not initiated.
The SCE study reinforced the critical need for the performance data and simulation tools developed in this project in order to more effectively quantify benefits and promote emerging façade technologies. The principle activity for market transfer in this project was to meet these two critical needs first, through the provision of field test data and simulation tools. The field tests in the LBNL Windows Testbed Facility has the distinct advantage over pilot demonstration projects of being able to accurately measure the HVAC-related impacts of façade technologies. Pilot demonstrations or controlled field studies under occupied conditions are also critical to assess how user behavior, comfort, satisfaction, and acceptance play a role in determining actual energy savings, but project resources were insufficient to conduct such studies. With the provision of these data and tools, the pathway to pilot demonstration projects and ultimately an established rebate and incentive program has been established and will be pursued in future phases of this work.
A second method of technology transfer was pursued in parallel: showcase demonstrations identified through direct partnerships with building owners and A/Es. This method has had significantly greater success than the ETCC route because it targets the risk-taking innovators or leading edge of the building industry rather than the more conservative laggards on the technology adoption curve. This stakeholder group is represented by forward thinking
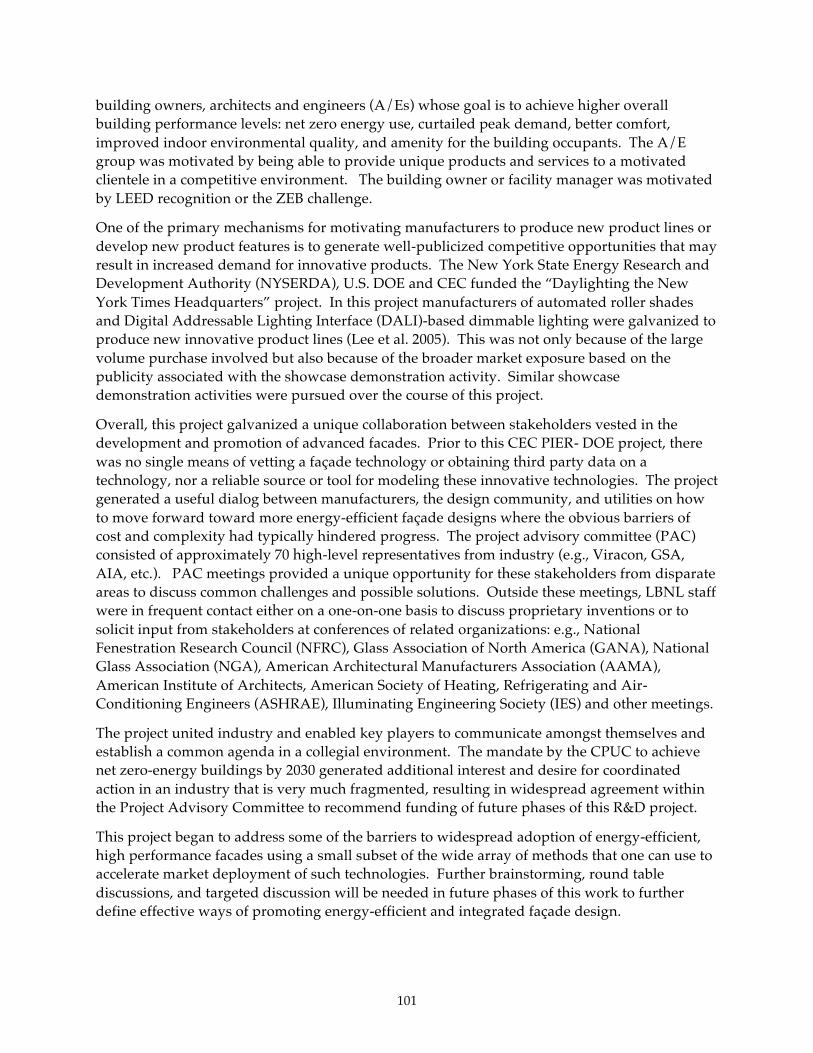
101
building owners, architects and engineers (A/Es) whose goal is to achieve higher overall building performance levels: net zero energy use, curtailed peak demand, better comfort, improved indoor environmental quality, and amenity for the building occupants. The A/E group was motivated by being able to provide unique products and services to a motivated clientele in a competitive environment. The building owner or facility manager was motivated by LEED recognition or the ZEB challenge.
One of the primary mechanisms for motivating manufacturers to produce new product lines or develop new product features is to generate well-publicized competitive opportunities that may result in increased demand for innovative products. The New York State Energy Research and Development Authority (NYSERDA), U.S. DOE and CEC funded the “Daylighting the New York Times Headquarters” project. In this project manufacturers of automated roller shades and Digital Addressable Lighting Interface (DALI)-based dimmable lighting were galvanized to produce new innovative product lines (Lee et al. 2005). This was not only because of the large volume purchase involved but also because of the broader market exposure based on the publicity associated with the showcase demonstration activity. Similar showcase demonstration activities were pursued over the course of this project.
Overall, this project galvanized a unique collaboration between stakeholders vested in the development and promotion of advanced facades. Prior to this CEC PIER- DOE project, there was no single means of vetting a façade technology or obtaining third party data on a technology, nor a reliable source or tool for modeling these innovative technologies. The project generated a useful dialog between manufacturers, the design community, and utilities on how to move forward toward more energy-efficient façade designs where the obvious barriers of cost and complexity had typically hindered progress. The project advisory committee (PAC) consisted of approximately 70 high-level representatives from industry (e.g., Viracon, GSA, AIA, etc.). PAC meetings provided a unique opportunity for these stakeholders from disparate areas to discuss common challenges and possible solutions. Outside these meetings, LBNL staff were in frequent contact either on a one-on-one basis to discuss proprietary inventions or to solicit input from stakeholders at conferences of related organizations: e.g., National Fenestration Research Council (NFRC), Glass Association of North America (GANA), National Glass Association (NGA), American Architectural Manufacturers Association (AAMA), American Institute of Architects, American Society of Heating, Refrigerating and Air-Conditioning Engineers (ASHRAE), Illuminating Engineering Society (IES) and other meetings.
The project united industry and enabled key players to communicate amongst themselves and establish a common agenda in a collegial environment. The mandate by the CPUC to achieve net zero-energy buildings by 2030 generated additional interest and desire for coordinated action in an industry that is very much fragmented, resulting in widespread agreement within the Project Advisory Committee to recommend funding of future phases of this R&D project.
This project began to address some of the barriers to widespread adoption of energy-efficient, high performance facades using a small subset of the wide array of methods that one can use to accelerate market deployment of such technologies. Further brainstorming, round table discussions, and targeted discussion will be needed in future phases of this work to further define effective ways of promoting energy-efficient and integrated façade design.
102
To inform the public of the outcomes of this project and to solicit feedback, the LBNL team members are routinely invited to speak at various conferences and meetings world-wide. In California, LBNL put on seminars hosted by the utilities and local chapters of some of these national organizations. LBNL project staff are often interviewed for trade and popular press articles through which the results of this project are disseminated. The LBNL site attracts numerous visitors from all over the world. The Windows Testbed Facility is one of the more popular, toured facilities at LBNL, particularly given the increased interest in climate change. LBNL staff have been interviewed for television programs world-wide, including Austrian news (due to Governor Schwarzenegger) and Lehrer NewsHour. LBNL is recognized world-wide as an authoritative source on fenestration/ daylighting R&D. Staff receives daily inquiries from a broad range of people world-wide trying to solve specific engineering issues, find information on specific technologies, academics looking for teaching material, manufacturers looking for methods and data for marketing material, utilities, building owners, etc. All these activities and inquiries were fielded with the joint CEC-DOE project funds.
The following sections provide more detailed information on the technology transfer activities that occurred within this project.
Showcase Demonstrations
Potential showcase demonstrations were pursued primarily in response to inquiries made by design teams, or through leads provided by utilities, project advisory committee members, state agencies, and other stakeholders. Typically, a detailed interview was conducted initially to ascertain the project goals, stage of development, constraints, schedule, and whether collaboration was warranted. Site visits were made and on some occasions, presentations to the A/E team and building owner were made to explain technical concepts and performance benefits of innovative façade technologies. In some cases, limited simulations were made to quantify the performance benefits of various design strategies or the A/E team was instructed on how to use the COMFEN tool to generate the necessary data. In other cases, manufacturers requested that LBNL provide review of performance data and input on applicability. Because there were no significant project resources dedicated to follow through on potential demonstrations, the LBNL team typically requested that the project team request funding from their local utilities or state agencies to support further involvement. However, showcase demonstrations of innovative facade technologies were not included in the utility or state-funded programs for the reasons stated above.
The project team had more success working directly with building owners and A/E teams who were motivated to deliver high performance facades and who already understood the benefits of integrated façade-lighting-HVAC design. Many of these teams had defined aggressive net zero-energy goals and therefore had to address the façade in order to accomplish these goals. Meetings with the building owner, discussions with the A/E team, and limited building energy simulations led to the procurement of dimmable lighting controls for the perimeter zones of a high-rise office building in Manhattan. Another building owner in Manhattan decided to procure automated interior roller shades of similar control design to The New York Times Headquarters Building and install the shades on forty floors of their high-rise building. Collaboration with a facility manager on a UC campus and a motivated A/E team has led to the inclusion of automated exterior shading on the façades of a new building; the project is currently in the design development phase.
103
Technology Portfolio and Project Website
A technology portfolio was produced to provide technical information and performance data on the field-tested technologies to architects and engineers in a practical, succinct format. The document will be incorporated into the project website in future phases of this project.
The project website was developed and contains all relevant information on the project as well as links to related work.
Cleantech to Market Program
LBNL worked with a team of business and engineering students who evaluated the market potential of switchable windows and provided insights into pathways to market via the Berkeley Energy and Resources Collaborative “Cleantech to Market Program”. These insights were summarized in a document: “Electrochromic Windows: Linking the Value Chain” and presented at an evening reception to 30 venture capitalist firms, company representatives as well as about a dozen attorneys and general energy/cleantech experts.
UC Berkeley Facades Seminar
Selkowitz, Lee, and other LBNL staff co-taught a graduate architectural seminar on high-performance facades design at the Department of Architecture, UC Berkeley, Berkeley, Spring 2008 and 2009. The seminar consisted of lectures, software demonstrations, tours of the LBNL laboratories including the Windows Testbed Facility, and a design project that evolved as the students learned more about various aspects of façade design. The design projects were reviewed at the conclusion of the seminar.
Journal and Conference Articles
At the time of this final report, the following articles were in press or had been published. Additional articles will be submitted in the future.
Jonnson, J.C., Lee, E.S., Rubin, M. 2008. Light-scattering properties of a woven shade-screen material used for daylighting and solar heat gain control. SPIE Optical Engineering+Applications 2008.
Hitchcock, R.J., Mitchell, R., Yazdanian, M., Lee, E., Huizenga, C. 2008. COMFEN: A commercial fenestration/ façade design tool. SimBuild 2008, Berkeley, CA.
Lee, E.S., D.L. DiBartolomeo, J.H. Klems, Ph.D., R.D. Clear, Ph.D., K. Konis, M. Yazdanian, B.C. Park. 2008. Field Measurements of Innovative Interior Shading Systems for Commercial Buildings. Presented at the ASHRAE 2009 Annual Meeting, Louisville, KY, June 20-24, 2009 and to be published in the ASHRAE Transactions, Vol. 115, Part 2.
Konstantoglou, M., J.C. Jonsson, E.S. Lee. 2009. Simulating Complex Window Systems using BSDF Data. Proceedings of the 26th Conference on Passive and Low Energy Architecture (PLEA), Quebec City, Canada, 22-24 June 2009.
Mardaljevic, J., L. Heschong, E. Lee. 2009. Daylight metrics and energy savings. Lighting Res. Technol. 2009; 0: 1–23.
104
Educational Seminars
Educational seminars were given at the following conferences to disseminate project results:
Seminar on commissioning daylighting systems at The New York Times Headquarters Building, E. Lee, F. Rubinstein, and G. Hughes (NYT), LightFair, New York, NY, May 2007.
Intelligent façade systems seminar, E. Lee, S. Selkowitz, and N. Kiezl (Atelier Ten), LightFair, New York, NY, May 2007.
Building tour of The New York Times Headquarters Building, G. Hughes (NYT), A. Uysal (SBLD Studio), E. Lee (LBNL), LightFair, New York, NY, May 2007.
S. Selkowitz and E. Lee, presentations to approximately 40 members of the State Energy Advisory Board and tour of windows testbed facility, August 14, 2007. STEAB (www.steab.org.) has a statutory responsibility to advise the Asst Secretary of EERE about technology development and programs of interest to the states.
S. Selkowitz, SOMFY Symposium, Annecy, France, July 14-18, 2007.
S. Selkowitz, NFRC meeting, Denver, CO, July 23-27, 2007.
Lee presented a seminar on Daylighting The New York Times Headquarters building at LBNL EETD noontime seminar series, October 3, 2007.
Selkowitz made an invited presentation to the American Physical Society group looking at energy efficiency options for the future, October 2007. Dian Grueneich, Commissioner of the CPUC, spoke on policy implications for aggressive energy saving; Selkowitz spoke on technology opportunities. The past work with the Times and the current PIER project were highlighted as examples of what was needed to greatly increase future savings.
Seminar on commissioning automated shading and daylighting control systems in the New York Times Headquarters, E. Lee, ASHRAE 2008 Winter Meeting, New York, New York, January 22, 2008.
Selkowitz presented facades R&D at the AAMA 71st Annual Conference, February 24-27, 2008, Indian Wells, CA.
Selkowitz presented facades R&D to Sejong University and Samsung in Seoul, March 14, 2008. Samsung constructs high-rise commercial towers world-wide.
Selkowitz presented summary of R&D activities related to complex glazings, NFRC Spring Meeting, Nashville, TN, March 2008
Selkowitz presented a lunch plenary at Building Envelope Science and Technology conference, Minneapolis, June 12, 2008. Attendance was about 260 people.
Selkowitz presented a noontime seminar on “Façade and Daylighting Solutions for Zero Energy Buildings” to the AIA San Francisco chapter on July 9, 2008.
Lee presented the CEC PIER project at the Joint Utility Lighting Emerging Technologies meeting on July 14, 2008 at the Pacific Energy Center in San Francisco.

105
Lee and Selkowitz presented latest work on simulation tools, IBPSA/ SimBuild 2008 conference, Berkeley, CA, July 29, 2008.
Selkowitz gave a talk on how windows and daylighting are key to ZEB at the Innovations Conference, MacGraw Hill, October 5-6, 2008 in New York City.
Hitchcock presented the COMFEN software at the 2008 Glass Fabrication & Glazing Educational Conference during the Contract Glazing Session in Las Vegas, NV.
Selkowitz was invited to participate in a workshop on core daylighting at the University of British Columbia, Vancouver, October 7-8, 2008.
Selkowitz participated in a Building Envelope Forum, hosted by DOE in Washington DC, October 15, 2008.
Selkowitz gave a talk on net zero energy buildings, including facades, at the Emerging Technologies Summit in San Diego, October 25-26, 2008. Approximately 300 attendees.
Selkowitz, Loftness (Carnegie Mellon), and Stephan Behnische presented a 1.5-hour seminar on bioclimatic façade design and principles, Lee and Saxena (HMG) presented a 1.5-hour seminar on dynamic facades at GreenBuild 2008, November 17-21, Boston, MA. Approximately 450 attendees per seminar. An educational booth on integrated, high-performance facades was presented at GreenBuild as well, with poster, hardware, and live software demos on display.
Lee gave a graduate seminar on dynamic facades at Harvard to students from both the Harvard and MIT graduate schools, November 20, 2008.
Selkowitz discussed pathways to ZEB at MIT in November 2008 during GreenBuild week in Boston. Selkowitz’s talk can now be accessed at:
http://techtv.mit.edu/collections/miteiseminars/videos/1598-stephen-selkowitz---zero-energy-buildings-potentials-and-realities
Selkowitz and Lee presented 45-min talks each on recent R&D results at the CSI Building Products Manufacturers Alliance meeting at LBNL, December 8-9, 2008.
Provided tours of the Windows Testbed Facility to 40 members of the Consortium for Energy Efficiency of windows R&D, January 13, 2009.
Presentation of project results to KMD Architects sustainability team, February 6, 2009, at LBNL.
Lee gave a 3-hour lecture on facades R&D to building science and architectural graduate seminar at UC Berkeley, February 18, 2009.
Selkowitz and Lee presented recent windows R&D at the ASHRAE Net-Zero Countdown Conference, March 29-31, 2009.
Selkowitz participated in a webinar hosted by Alcoa to promote energy efficient windows and daylighting, April 16, 2009.
Lee and Selkowitz presented latest research in a 3-hour seminar on dynamic window-daylighting systems, May 3, 2009 at LightFair, New York.

106
Mardaljevic, an EU colleague, presented results from the New York Times work in a “Tools and Metrics” workshop at the 3rd Velux Daylight Symposium, Rotterdam, May 13-14, 2009. http://www.thedaylightsite.com/
Held Facades Workshop at LBNL, June 2-3, 2009 to discuss strategic direction and technical hurdles for enabling modeling and evaluation of complex fenestration systems.
Presented and published conference paper: “Dynamic Building Facades for Zero Energy Buildings” for Glass Processing Days, Tampere, Finland, June 12-15, 2009.
Kohler presented poster for: “Field Measurements of Innovative Interior Shading Systems for Commercial Buildings” at the ASHRAE 2009 Annual Meeting, Louisville, KY, June 20-24, 2009.
Konstantoglou presented a poster and published the manuscript for: “Simulating Complex Window Systems using BSDF Data” at the 26th Conference on Passive and Low Energy Architecture (PLEA), Quebec City, Canada, 22-24 June 2009.
Popular press
Celebration of Lighting. Consulting-Specifying Engineer, Issue 6: June 1, 2007. Mention of intelligent facades talk given at Lightfair 2007.
Cool shades! Shading in Glass: Daylighting with hermetically sealed computer-controlled louvers between lites. Glass Magazine, Vol. 57, Number 8, August 2007. LBNL quoted in article.
A. Chen, CNET Networks Business interview at windows testbed facility, http://news.zdnet.com/2422-13568_22-161821.html, August 7, 2007. Video clip includes acknowledgment of the CEC PIER program.
Glass Technology to Cut Energy Costs, Commercial Building Products, September 2007. LBNL quoted in article.
“Back to the Times: Revisiting The New York Times Headquarters Building Upon Its Completion”, Science@Berkeley Lab, 10/23/07, http://www.lbl.gov/Science-Articles/Archive/sabl/2007/Oct/nytimes.html. Electric Perspectives to reprint article in their magazine.
Hosted Thomas Friedman, foreign correspondent for The New York Times and Pulitzer Prize winner, at LBNL and showcased this project as an example of what actions are needed and being taken to accelerate use of energy-efficiency technologies in the buildings sector. February 2008.
Lee conducted interview at windows testbed on March 23, 2008 with Peter Byck, who is working on a documentary called “Carbon Nation” focused on global warming technological solutions.
Selkowitz, Lee, and Kohler interviewed in: “Energy-Saving Windows: A Legacy Of '70s Oil Crisis”, National Public Radio, Morning Edition, October 15, 2008. http://www.npr.org/templates/story/story.php?storyId=95309739

107
Selkowitz was interviewed for a NOVA Energy Special. NOVA filmed a 2-hour interview with Selkowitz then shot some footage of various experiments including those being conducted at the Windows Testbed (Figure 34). NOVA Energy show aired day after presidential inauguration with footage of LBNL windows R&D, Steve Chu, and Governor Schwarzenegger on California energy-efficiency R&D, January 2009. http://www.pbs.org/wgbh/nova/energy/
Figure 35: Nova Science crew setting up at LBNL Windows Testbed Facility.
Local ABCNews interviewed Kohler regarding facades R&D, including the work being conducted at the Windows Testbed Facility (aired February 25, 2009): http://abclocal.go.com/kgo/story?section=news/assignment_7&id=6678677
Lee was filmed by Re:Vision (http://urbanrevision.com) February 27, 2009 for a video on “Top Science related to the Built Environment: Emerging, Appropriate and Available Sustainable Technologies and Materials”. The ultimate goal of the video is to educate stakeholders about what future technologies look like and where technology disruption exists in integrated solutions.
108
4.0 Conclusions and Recommendations
At the conclusion of the project, there are a number of conflicting activities that characterize the industry:
1) Building energy-efficiency codes and standards are more aggressively targeting windows in commercial buildings using prescriptive-based measures. These codes (ASHRAE 90.1 and 189.1, California Title-24, LEED, International Green Construction Code, etc.) are considering mandating use of smaller-area windows (WWR!0.30 instead of WWR up to 0.45) with a very low solar heat gain coefficient for the glazing. Some require use of attached exterior shading and others place some limited minimum requirements on the visible transmittance of the window, usually as a light-to-heat-gain ratio (e.g., Tvis/SHGC of 1.5 or greater). Useful daylighting for lighting energy savings will be inherently limited by the design of these facades. Control of HVAC loads is the primary focus of these measures. These actions avoid addressing the complex trade-off synergistic impacts facades have on HVAC and lighting energy use, leaving potential greater energy-efficiency gains on the table so as to simplify practical implementation issues with integrated façade design.
2) For building owners who have the resources and intent to achieve net zero energy performance goals, the trend is in the opposite direction for typically new construction of commercial buildings. EU architects like Behnische Architects in collaboration with Transsolar use innovative façade and daylighting technologies in combination with building massing, an articulated façade design, and low-energy cooling strategies to attain more aggressive performance goals. These high-end buildings are able to specify larger windows to maintain high indoor environmental quality through connection to the outdoor with increased daylight, views, and occupant amenity. Such well-daylit buildings are also being promoted on the basis of possible increased productivity and health. In a separate CEC PIER project, the Heschong Mahone Group and the IESNA Daylighting Quality Metrics Subcommittee are working to define daylighting metrics that could be applied to LEED and Title-24 Standards. The activity is directed towards deriving practical metrics for a wide variety of commercial spaces by correlating subjective responses for real spaces to simulated data of the spaces. Such metrics accommodate the less tangible but equally important human factors for liveable spaces such as access to view and quality of a daylit space.
Measured performance data from this study illustrates how the latter method of integrated façade-lighting-HVAC design can be used to achieve the more aggressive net zero energy building and comfort goals in the near-term. Practical, commercially-available and emerging technologies were carefully monitored over a solstice-to-solstice period to quantify cooling load, lighting energy use, and comfort impacts and road test the technologies to judge market feasibility. The study was conducted in collaboration with industry so as to provide useful feedback for future product development. This research project generated enormous interest among utilities, manufacturers, and end-users. Further evaluations are planned for future phases of this research.
To meet the practical and growing demands of today’s market, two major categories of technologies were evaluated: interior and exterior shading devices.
109
Exterior shading systems
The field tests demonstrated that exterior Venetian blinds or roller shades can deliver energy and peak demand savings benefits at aggressive net zero-energy levels of performance. These systems are robust, fairly mature, and practical. Applicability is limited to low- to mid-rise buildings where local winds are of low velocity for the majority of the year: the systems must be retracted if winds exceed 30 miles per hour. These systems have been used throughout the EU over many decades in new and retrofit applications, in air-conditioned and non-conditioned buildings, and enable use of low-energy cooling strategies such as natural ventilation, radiant cooling, etc. Monitored data indicated that average daytime cooling loads due to the window could be reduced by 78-94% compared to conventional interior shading systems and peak cooling loads could be reduced by 71-84% or 17.2-33.2 W/m2-floor (1.6-3.3 W/ft2-floor) given a large-area, south-facing window in a 4.57 m (15 ft) deep perimeter zone in a sunny climate. Lighting energy use was 53-67% of ASHRAE 90.1-2004 prescribed levels.
Performance wise, the most significant challenge is how to control discomfort glare from the window and obtain useful daylight – two opposing performance objectives. Lighting energy use and visual comfort performance varied significantly depending on the design of the shading system and its operation. The automated exterior roller shade and an innovative zoned static optical louver system exerted the greatest control over overall window luminance: the former due to an integrated prototype control algorithm, the latter due to the angle and geometry of the slats for this south-facing facade. Clearly the latter, without the need for automation, will have broader applicability because of its practical simplicity.
When specifying such systems, the design team must decide how best to control glare if needed – with the exterior blind itself or with a secondary interior shading system. The conventional exterior blind is best used to control solar heat gains whether automated or manually-operated on a seasonal basis. When coupled with a fairly large-area window with high visible transmittance, the energy-efficiency benefits of daylighting can be obtained if coupled with a manually-operated interior drape, scrim, or shade to cut the brightness of the sky or reflected sunlight off the exterior blinds. This has been done with interior blind systems in the Genzyme Building in Cambridge, Massachusetts and other EU buildings with self-reported occasional use – view is often more valued and glare well tolerated in these more overcast climates.
Interior shading systems
Field tests of interior shading devices indicated that automated shading systems hold significant potential for reducing energy and peak demand in perimeter zones. Interior shading systems can potentially be quickly and broadly deployed in both new and retrofit commercial buildings and have the potential to increase energy savings from daylighting potential in perimeter zones if discomfort glare due to the window can be adequately controlled. A solstice-to-solstice field test was conducted on a variety of interior shading devices, including automated motorized shading systems and split or zoned shading systems that subdivide the window into a lower view zone and an upper daylighting zone.
110
Static, zoned interior Venetian blind systems reduced discomfort glare from the window compared to conventional systems but yielded high luminance contrasts in its upper zone under sunny and partly cloudy conditions.
Automated, motorized interior shades provided more reliable performance, but at increased cost. Such systems have broad applicability throughout the U.S. in medium- to large-scale commercial buildings, particularly automated interior roller shades and dimmable lighting controls. Automated Venetian blinds and sunlight-redirecting mirrored louver systems deliver greater energy-efficiency but cost and complexity are market barriers toward widespread adoption that need to be resolved.
Measured data indicated that well designed automated systems can deliver significant reductions in lighting energy use and cooling and lighting peak demand and reliable control over discomfort glare for the majority of the time. The specific control algorithm used can significantly affect performance: the closed-loop integrated prototype control system developed by LBNL exerted greater control over interior daylight levels, peak cooling loads, and discomfort glare. Additional research is required to better understand the nature of occupant response to daylight and glare and then to develop technologies and algorithms to improve the control of window glare.
The sunlight-redirected interior motorized shading system was not showcased at its best potential since it was coupled with a low-end motor controller and control system as a potential solution for broader market applications. This mirrored concave-up slat system has the potential to redirect sun to depths significantly greater than conventional depths of 15 ft from the window wall. Field tests of this and other sunlight redirecting systems are being planned for future work.
Commercially-available, motorized shading systems did vary significantly in quality, accuracy, and reliability, depending on the details of engineering, cost, and desired performance. Generally, tubular motorized systems that delivered only height adjustments, such as those used with interior and exterior roller shades, were less complex and generally more reliable than their Venetian blind counterparts, which had to deliver both height and slat angle control with a single motor. The control systems used for automation also varied considerably in terms of ease of use, reliability, and technical support. Additional work must be done to make the design, implementation, and commissioning of automated systems more turn-key. This is an emerging technology with several key demonstrations leading the efforts to increase market penetration (e.g., The New York Times Headquarters Building).
Switchable electrochromic glazing, evaluated in a prior phase of this CEC PIER project, offers mechanical simplicity without the wind, security, and other practical constraints of exterior shading. This technology continues to evolve, with existing and new U.S. manufacturers continuing to develop marketable, low-cost glazings with improved solar-optical properties and automated control systems. Such glazings will have broad applicability in all new and retrofit commercial buildings when high-volume manufacturing capabilities are brought on-line.
Simulation Tools to Support Market Deployment
To support the deployment of such technologies through performance-based design, the commercial fenestration (COMFEN) tool, which was developed in this project, puts a powerful
111
capability into the hands of architects and engineers enabling quick, accurate, and comprehensive analysis of commercial building façade designs within a few minutes. The tool has a simple Excel-based user interface (software which most A/Es have in their office and are familiar with) that links to EnergyPlus and Window 6. The tool enables users to quickly visualize trade-offs in performance as their designs evolve. An analogous, web-based tool pulls data from a database of parametric EnergyPlus runs, providing similar functionality but with more limited and less flexible design options. Use of COMFEN on design assistance projects has provided insights as to how the tool could be better designed to meet the needs of those with ambitious ZEB performance goals. Development of this tool will continue in future phases of this work.
In a parallel activity, development of new simulation tools and associated data bases for modeling optically complex fenestration systems (CFS) is underway. All manufactured transparent glass in the world can be modeled and rated using Window 6, EnergyPlus, and Radiance simulation tools. All other façade technologies (Venetian blind, roller shades, fritted glass, angular-selective glazings, prismatic glazings, and other façade elements that produce non-specular output distributions of transmitted or reflected radiation) must be modeled using simplified methods with limited measured data. A new method was defined in prior research and work in this project focused on incorporating this method into simulation tools. These new tools (modules within EnergyPlus and Radiance) use bidirectional transmittance and reflectance or scattering distribution function (BSDF) data from Window 6 for any arbitrary window system (glass + shade combinations). The Radiance mkillum tool has been modified and validated to accept such data. Continued development of BSDF-enabled Radiance tools is in progress. The new tools can perform annual computations in a fraction of the time it takes with conventional ray-tracing methods. Technical specifications for modifying EnergyPlus have been defined and work is in progress to reconcile the specifications with the existing legacy code.
Recommendations
This two-year research project represents an initial effort to address the critical needs of the buildings industry to have the tools and technological resources made available to more routinely and cost-effectively deliver high-performance façade solutions that optimize the complex trade-offs needed to meet aggressive energy, peak demand, daylighting, and comfort performance objectives.
This work, funded by CEC PIER and DOE, generated enormous interest amongst utilities, manufacturers, and end-users – the Project Advisory Committee consisted of 70 members, an afternoon seminar on advanced facades at GreenBuild 2008 had a total attendance of 1000 people, an ASHRAE Forum on Net Zero Energy Buldings was attended at standing room only levels, and solicitations for collaborations on technology R&D and demonstration projects were received by staff on an almost daily basis. Interest in energy-efficiency within California increased exponentially when the California Public Utilities Commission (CPUC) made a decision to adopt the California Long-Term Energy Efficiency Strategic Plan, which set a goal to achieve zero net energy in 100% of commercial construction by 2030 and 50% of existing construction by 2030.
112
In response to this increased interest, both CEC PIER and DOE have committed to a follow-on three-year phase of this work with significantly increased resources. This initial project established test methods and procedures, and gathered data necessary for designers and utilities to use in evaluating energy efficient glazing and façade systems and their components. Utilities are now beginning to take steps to integrate the findings into their Emerging Technology programs and are looking forward to continued project outcomes, given their more aggressive stance towards achieving ZEB goals. In future work, utilities will be able to finally implement an energy efficiency rebate for high performance glazing and façade systems.
In the short-term and as direct follow-on to the findings of this project, the following recommendations are made:
– Static and automated exterior shading systems should be widely promoted in California and in regions of the U.S. where significant cooling load reductions are desired. Utilities and building owners with aggressive net ZEB objectives should play a key role in this activity. Use of such systems is not yet turn-key: well documented, monitored demonstrations like The New York Times Headquarters activity can help accelerate market deployment of such technologies. California is particularly well positioned to promote such technologies because of its sunny climate and aggressive greenhouse gas emission reduction objectives mandated by the Governor and by the CPUC.
– The systems should be promoted in combination with low-energy cooling strategies for new construction, and promoted in retrofit construction to reduce HVAC loads and potentially improve comfort. The same systems can also be used to achieve a visually comfortable daylighted space to significantly reduce lighting energy use.
– Simulation tools should be used to guide the selection of the systems in order to optimize the trade-offs between cooling load reductions and lighting energy use reductions for a specific façade design and address parallel requirements for occupant comfort. These tools should be improved to better emulate the control sequences (manual or automated) of commercially available products. Showcase demonstrations can help spur interest and bolster confidence in the technology.
– Automated interior shading systems should also be widely promoted in commercial buildings that have significant daylighting potential and require reliable control of window glare. These systems provide indoor environmental quality benefits such as increased connection to the outdoors, view, productivity, and health benefits that are difficult to quantify but provide valued amenity benefits to occupants. Automated roller shades are recommended because of their mechanical simplicity. Automated Venetian blind systems and sunlight-redirecting systems have greater cooling load reduction and core daylighting potential but need further engineering to improve operational quality at lower cost.
– Further research is required to develop more robust daylight discomfort glare models so as to enable improvement in automated controls. Interior shade products can reduce cooling loads and improve thermal comfort but are not as effective as exterior systems. Additional research might address the scope for further improvement in cooling load reductions.
– The COMFEN PC-based tool and on-line web-based tool provides fundamental analysis of basic window options and therefore meets today’s analysis needs for the majority of the

113
market for conventional shading systems in California and the U.S. As A/E teams strive to meet more stringent code requirements or even achieve net zero energy objectives, more innovative technological solutions will need to be incorporated into the tool with greater accuracy and flexibility. Further development of COMFEN is planned to address the engineering features as well as usability.
Many of these recommendations will be pursued in the next phase of this project. While the next phase or work will continue to have a strong emphasis on developing robust and facile tools for the industry and development of integrated, high performance façade technologies, more effort will be dedicated to working towards higher minimum codes and standards that promote the practice of integrated design and collaborating with utilities, large building owners, and other major stakeholders to create the demand for high efficiency buildings.
Benefits to California
Everyday, architects design facades without the benefit of performance feedback to inform their decisionmaking. In a time where energy-efficiency is playing an increasingly important role in the design of buildings, easy to use, fast, accurate, low-cost simulation tools are needed to help architects, engineers, and owners make informed decisions based on performance data. This is particularly relevant to California, which has possibly the most stringent energy code in the nation.
The technologies investigated in this study, most particularly commercially-available exterior shading systems, can provide California with near-term, practical options for significantly reducing lighting and cooling loads to net zero energy levels in commercial buildings throughout the state while improving occupant comfort and amenity. The technologies also enable significant reductions in summer peak demand: cooling as well as lighting electricity use, which can help California meet its aggressive energy-efficiency and greenhouse gas emission goals.
The products of this research have been broadly disseminated in educational seminars and conferences world-wide. Information in this report further delineates the performance impacts and maturity of near-term, high-performance commercial façade solutions.
114
5.0 References Carmody, J., S. Selkowitz, E.S. Lee, D. Arasteh, T. Wilmert. 2004. Window Systems for High Performance Commercial Buildings. New York: W.W. Norton and Company, Inc.
Clear, R.D., V. Inkarojrit, E.S. Lee. 2006. Subject responses to electrochromic windows. Energy and Buildings 38(7):758-779. LBNL-57125.
Gall, Dietrich, Vandahl, C., Jordanow, W., Joranowa, S. 2000. Light protection equipments in office rooms. Technische Universität Ilmenau, Department of Lighting Engineering, Ilmenau (Germany). http://www3.tuilmenau.de/fakmb/fileadmin/template/fglt/publikationen/2000/Roll_Zeitschr_eng.pdf
Carroll, W.L., R.J. Hitchcock. 2005. Delight2 Daylighting Analysis in EnergyPlus: Integration and Preliminary User Results. Proceedings of the Building Simulation Conference, 9th International Building Performance Simulation Association Conference, Montreal, Canada, August 15-18, 2005. LBNL-57531.
Klems, J. 2004. Thermal calibration of the windows testbed facility. Technical report. http://windows.lbl.gov/comm_perf/Electrochromic/refs/LBNL_electrochromics_10.pdf
Klems, J. 2008. Recalibration of the Windows Testbed Facility for Shading System Measurements. Internal document can be found at: http://lowenergyfacades.
Konstantoglou, M., J.C. Jonsson, E.S.Lee. 2009. Simulating Complex Window Systems using BSDF Data. Proceedings of the 26th Conference on Passive and Low Energy Architecture (PLEA), Quebec City, Canada, 22-24 June 2009.
Lee, E.S., D. L. DiBartolomeo, E.L. Vine, S.E. Selkowitz. 1998. Integrated performance of an automated Venetian blind/electric lighting system in a full-scale private office. Proceedings of the Thermal Performance of the Exterior Envelopes of Buildings VII, Clearwater Beach, Florida. LBNL-41443.
Lee, E.S., D. L. DiBartolomeo, S. E Selkowitz. 1998. The effect of Venetian blinds on daylight photoelectric control performance. Journal for the Illuminating Engineering Society 28(1):3-23. LBNL-40867.
Lee, E.S., S.E. Selkowitz, G.D. Hughes, R.D. Clear, G.J. Ward, J. Mardaljevic, J. Lai, M. Inanici, V. Inkarojrit. 2005. Daylighting the New York Times headquarters building: Final report. LBNL-57602.
Lee, E.S., D.L. DiBartolomeo, J.H. Klems, M. Yazdanian, S.E. Selkowitz. 2006. Monitored energy performance of electrochromic windows controlled for daylight and visual comfort. ASHRAE Transactions 112(2):122-141. LBNL-58912.
McConahey, E. “Finding the right mix: Mixed mode ventilation”, ASHRAE Journal, September 2008, pp. 40-49.

115
Osterhaus, W.K.E., Bailey, I.L. Large Area Glare Sources and Their Effect on Discomfort and VisualPerformance at Computer Workstations. Proceedings of the IEEE Industry Application Society Annual Meeting, Houston, Texas, October 4-9, 1992, Vol. II: 1825-1829.
Rea, M. 1984. Window blind occlusion: a pilot study. Building and Environment, 19(2), 133-137.
Rubin, A. I., Collins, B.L., Tibbott, R.L. 1978. Window blinds as a potential energysaver - A case study (NBS Building Science Series 112). Washington, DC: U.S. Department of Commerce, National Bureau of Standards.
Rubinstein, F., Ward, G., Verderber R. 1989. Improving the performance of photoelectrically controlled lighting systems. J of the IES 1989 (1): 70-94.
Ruck, N., O. Aschehoug, S. Aydinli, J. Christoffersen, G. Courret, I. Edmonds, R. Jakobiak, M. Kischkoweit-Lopin, M. Klinger, E.S. Lee, L. Michel, J.L. Scartezzini, and S. Selkowitz. 2000. Daylight in buildings: A source book on daylighting systems and components. LBNL-47493.
Ward, G. 1991. RADIANCE Visual Comfort Calculation. IEA SHC Task 12, ADELINE 2.0 Documentation. LESO-EPFL. http://radsite.lbl.gov/radiance/man_html/findglare.1.html
116
Glossary and Abbreviations Glossary Tv Visible transmittance of the glass. All reported values are given for center-of-
glass, not the whole window.
Abbreviations ACEEE American Council for an Energy Efficient Economy
AMU Air mass unit
BMCS Building management control system
COP Coefficient of performance
CPUC California Public Utilities Commission
Ctz Climate zone
COG Center of glass
COP Coefficient of performance
CTAP Customer Technology Application Center
DALI Digital addressable lighting interface
DGI Daylight glare index
DOE Department of Energy
DR Demand response
EC Electrochromic
EMCS Energy Management Control System
EU European Union
Ev Vertical illuminance
GUI Graphical user interface
HDR High dynamic range
HVAC Heating, ventilation, air-conditioning system
IGU Insulating glass unit
IC Integrated circuit
IEA International Energy Agency
ISO International Standards Organization
117
I-V Current-to-voltage
LBNL Lawrence Berkeley National Laboratory
LAN Local area network
LCD Liquid crystal display
LED Light-emitting diode
NAHB National Association of Home Builders
NFRC National Fenestration Rating Council
NREL National Renewable Energy Laboratory
PIB Polyisobutylene
PTR Photopic transmittance ratio
R&D Research and development
SCE Southern California Edison
SHGC Solar heat gain coefficient
SWIFT Switchable Facade Technology
Tv Visible transmittance
VAV Variable air volume
VDT Visual display terminal (computer monitor)