High Performance Building Envelopes - University of … · High Performance Building Envelopes: ......
76
High Performance Building Envelopes: Principles from Natural Homologues and Analogues by Jed Laver 08 December. 2008 A Master’s Report Submitted to the Faculty of the School of Architecture. In Partial Fulfillment of the Requirements For the Degree of Master of Architecture in the Graduate College of The University of Arizona. Emerging Material Technologies University of Arizona School of Architecture Fall 2008
Transcript of High Performance Building Envelopes - University of … · High Performance Building Envelopes: ......
High Performance Building Envelopes: Principles from Natural Homologues and Analogues
by Jed Laver08 December. 2008
A Master’s Report Submitted to the Faculty of the School of Architecture. In Partial Fulfillment of the Requirements For the Degree of Master of Architecture in the Graduate College of The University of Arizona.
Emerging Material TechnologiesUniversity of ArizonaSchool of ArchitectureFall 2008

3
High Performance Building Envelopes:
Principles from Natural Homologues and Analogues
By Jed Laver
A Master’s Report Submitted to the Faculty of the Department of Architecture. In Partial Fulfillment of the Requirements For the Degree of Master of Architecture in the Graduate College of The University of Arizona.
Approval by Master’s Report Thesis Committee Members:
________________________________________________________
Dale Clifford, Chair DateAssistant Professor
________________________________________________________
Alvaro Malo, DateProfessor of Architecture
________________________________________________________
Dr. Pamela B. Vandiver DateProfessor of Material Science
________________________________________________________
Jason Vollen DateProfessor of Architecture Rensselaer Polytechnic Institute
Emerging Material TechnologiesUniversity of ArizonaSchool of ArchitectureFall 2008

5
The University of Arizona Electronic Theses and Dissertations
Reproduction and Distribution Rights Form
Name (Last, First, Middle) (please print)
Jed Laver
Degree (Ph.D., ED.D., MS, MA, etc: MArch II
Major: Architecture
Date you defended: December 08 2008
Title of Dissertation (please print)
High Performance Building Envelopes: Principles from Natural Homologues and Analogues
The University of Arizona Library Release
I hereby grant to the University of Arizona Library the nonexclusive worldwide right to reproduce and distribute my dissertation or thesis and abstract (herein, the “licensed materials”), in whole or in part, in any and all media of distribution and in any format in existence now or developed in the future. I represent and warrant to the University of Arizona that the licensed materials are my original work, that I am the sole owner of all rights in and to the licensed materials, and that none of the licensed materials infringe or violate the rights of others. I further represent that I have obtained all necessary rights to permit the University of Arizona Library to reproduce and distribute any nonpublic third party software necessary to access, display, run or print my dissertation or thesis. I acknowledge that University of Arizona Library may elect not to distribute my dissertation or thesis in digital format if, in its reasonable judgment, it believes all such rights have not been secured.
Signed:_______________________________
Date: ________________________________
Last updated: Feb 15, 2005
7
Table of Contents
Acknowledgments 1. 9
Introduction 12. 2
Abstract 12.1. 2
Homologues and Analogues 13. 7
Barrel Cacti 13.1. 8Termite Mounds 13.2. 9Thermal Experimentation 23.3. 0Design strategies 23.4. 2
EcoCeramic Research 24. 5
EcoCeramic Research 24.1. 6Prototypes 24.2. 9Ceramics 34.3. 2Assembly 34.4. 4Forming logic 34.5. 6Fabrication 34.6. 8Demonstration project 44.7. 2Thermal analysis 44.8. 6
Thermal Tests 45. 9
Thermal Principles 55.1. 0Expected results 55.2. 1Methodology 55.3. 2Thermal findings 55.4. 7Applications 55.5. 9Conclusions 65.6. 0Bibliography 65.7. 1Glossary 65.8. 3Figure list 65.9. 6
Appendices 66. 9
Appendix A 76.1. 0Appendix B 76.2. 4Appendix C 76.3. 8Appendix D 76.4. 9
9
Acknowledgments
We gratefully acknowledge the following people and companies, whose support and services enabled us to reach the current status of the project.
Institutional Support:University of Arizona: Vice President of Research Office Faculty Initiation
Grant
Boston Society of Architects: Research Grants in Architecture
University of Arizona, school of architecture
University of Arizona: Professor Aurore Chabot, ceramics laboratory in the College of Art
Industry Support:Glaz-Tech Industries Inc.
Architectural Glass and Glazing
Catalina China
Grant Road Lumber
Marjon Ceramics INC.
Solid Concepts
Technical Support:Dr. William Bickel: UA department. of Physics
Peter Testa Principal in Charge of Design of TESTA Architecture & Design and founding director of the Emergent Design
Paulus Musters: UA College of Architecture & Landscape Architecture, laboratory coordinator
Matt Gindlsburger, technical and analytical support using the CNC laboratory
Brent Vanderworth, providing day to day critics
David Stone Material experimentalist
Dana Smith for the use of her kilns
11
EcoCeramic CreditThis thesis relies extensively on the EcoCeramic Research project as a medium for proof of concept. EcoCeramic Research is a grant funded research project with Jason Vollen as the Principles Investigator. The author collaborated with Kelly Winn as the principle graduate designers. EcoCeramic is a material driven investigation into ceramics and composites in architecture. Kelly Winn integrated his research of digital fabrication, simulation, and rapid prototyping into the EcoCeramic research process. The author developed a thermal performance building envelope system based off of natural homologues and analogues also integrating his research in EcoCeramic. Each graduate researcher collaborated in the creation of EcoCeramic as a proof of concept for their respected research topics.
Photographs, illustrations and drawings created during the EcoCeramic phase of this project were often created jointly by both the author and Kelly Winn. The author gratefully acknowledges Kelly Winn as the principle photographer during EcoCeramic research. Without whom the project, as designed, would not have been possible. The author further expresses gratitude to his advisors, Dale Clifford, Jason Vollen, Álvaro Malo and Dr. Pamela Vandiver for their extensive input and intellectual contribution to this thesis..
12
Abstract
Design derived from natural homologues and analogues began with the primitive hut and has continued throughout history. Nature in relation to performance driven architecture, however, is a recent and developing field of study. The principles that allow flora and fauna to survive in the arid climate of the Sonoran Desert are investigated for thermal design strategies, specifically that of the barrel cacti and termite mounds.
The design principles are studied, tested, and integrated into a masonry wall system, EcoCeramic. EcoCeramic is grant funded research project charged with investigating composite materials in ceramic architecture. The project moves through prototyping, fabrication and assembly of the wall system. By integrating natural homologues and analogues into EcoCeramic research the designers intend to decrease the summer thermal gains, and increase the solar gains in winter months.
The masonry wall will test and demonstrate the design potential of ceramics and the effectiveness of passive design strategies. Testing is accomplished through the use of data loggers, guarded hot box and control tests for smaller experiments. This project is a detailed report of the fabrication, testing, and optimization of materials and full scale units, as well as the integration of the recorded design data into a performance profile.
Introduction
13
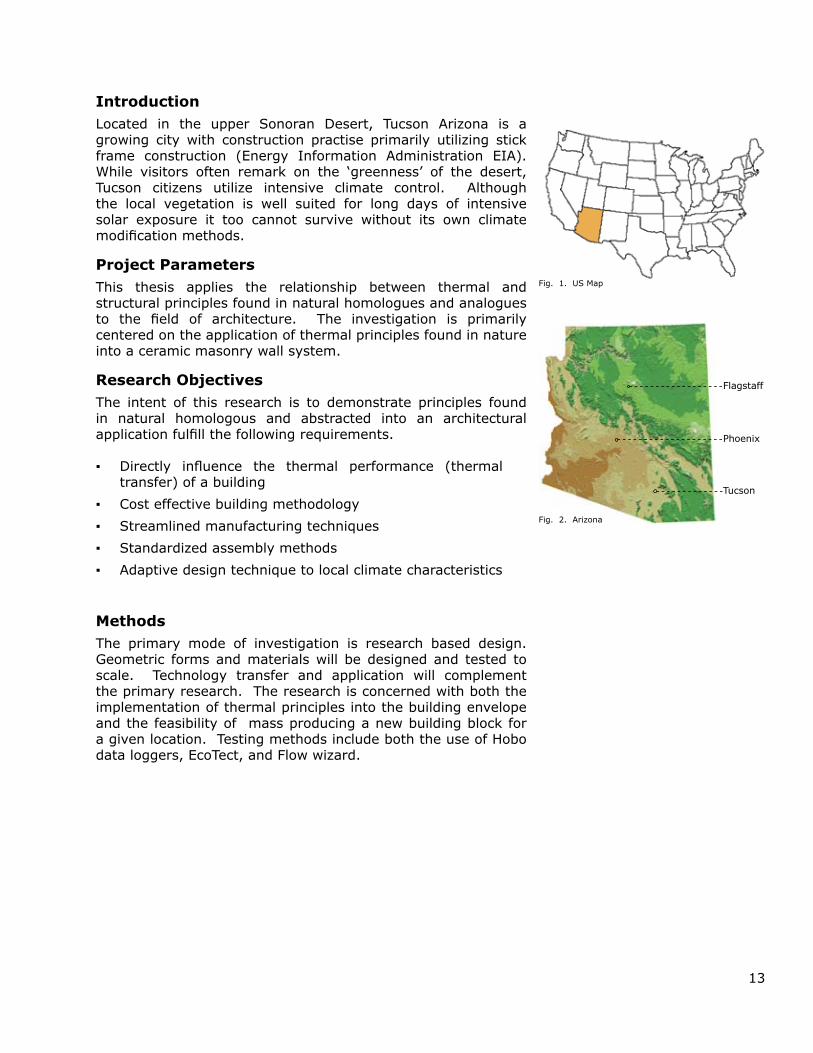
IntroductionLocated in the upper Sonoran Desert, Tucson Arizona is a growing city with construction practise primarily utilizing stick frame construction (Energy Information Administration EIA). While visitors often remark on the ‘greenness’ of the desert, Tucson citizens utilize intensive climate control. Although the local vegetation is well suited for long days of intensive solar exposure it too cannot survive without its own climate modification methods.
Project ParametersThis thesis applies the relationship between thermal and structural principles found in natural homologues and analogues to the field of architecture. The investigation is primarily centered on the application of thermal principles found in nature into a ceramic masonry wall system.
Research ObjectivesThe intent of this research is to demonstrate principles found in natural homologous and abstracted into an architectural application fulfill the following requirements.
Directly influence the thermal performance (thermal ▪transfer) of a building
Cost effective building methodology ▪
Streamlined manufacturing techniques ▪
Standardized assembly methods ▪
Adaptive design technique to local climate characteristics ▪
MethodsThe primary mode of investigation is research based design. Geometric forms and materials will be designed and tested to scale. Technology transfer and application will complement the primary research. The research is concerned with both the implementation of thermal principles into the building envelope and the feasibility of mass producing a new building block for a given location. Testing methods include both the use of Hobo data loggers, EcoTect, and Flow wizard.
Flagstaff
Phoenix
Tucson
US MapFig. 1.
ArizonaFig. 2.

14
Regional Weather TrendsTo some, global climate change remains a scientific uncertainty; however, empirical evidence is clear: regions of the earth are experiencing abnormal and severe weather patterns (NOAA comparative climate data). In the arid region of Southern Arizona, the average temperature has increased 2.5 degrees in the last 50 years, while the number of cloudy days and the inches of annual rainfall have decreased (Arid Land Institue) (NOAA Tucson Historic Temperatures). This increasingly hot and arid climate necessitates a unique and bio-climatic response in order to effectively dwell in the region.
Regional Building CultureIn an age of economy and mass production, many building projects use international building techniques and assemblies regardless of place. Regional architecture is often relegated to a boutique style or dismissed off-handedly as traditional. Of the homes in Phoenix, Frank Loyd Wright reports: “...three fourths of the dwellings here are of wood and brick brought from great distances and worked up into patterns originated, east, and thirty years ago. The houses are quite as indigenous as a cocked hat and almost as deciduous; one half of the cost of the whole-freight.” (Wright p141).
In southern Arizona, the arid climate necessitates an understanding of the properties of building materials and the principles of thermodynamic performance. Contractors, architects, and builders are aware of the high thermal conditions of the Sonoran desert. The most common response to the heat is a standard formula to mitigate the environmental forces; this includes the use of higher R-value wall sections, reduced fenestration, and more “efficient” air conditioning units. In 2001, the Department of Energy (DOE) reported that the implementation of these strategies is marginally effective: buildings were only maintaining the interior micro climate in the range of 60% efficiency (DOE 2001 Residential Energy Consumption survey).
In contrast to these more “modern” architectural techniques, the traditional rammed earth architecture of the Southwest region has relied on the principles of thermal mass. Construction of a high thermal mass home is labor intensive and consequently perceived as cost-prohibitive. Typical estimates for rammed earth construction can range from 50 to 100 dollars more per square foot than stick framing. The designers can postulate that the primary reason for a lack of thermal mass appropriation is an inadequate understanding of the thermal environment and a lack of familiarity with the vernacular construction.
50 year average Temperature & Precipitation
2008 Arid Lands Institute University of Arizona
Average precipitation and Temperature Fig. 3.
Stick & Frame ConstructionFig. 4.
Rammed earth ConstructionFig. 5. Photograph from flicker.com
15
Residential Energy Consumption Survey 2001
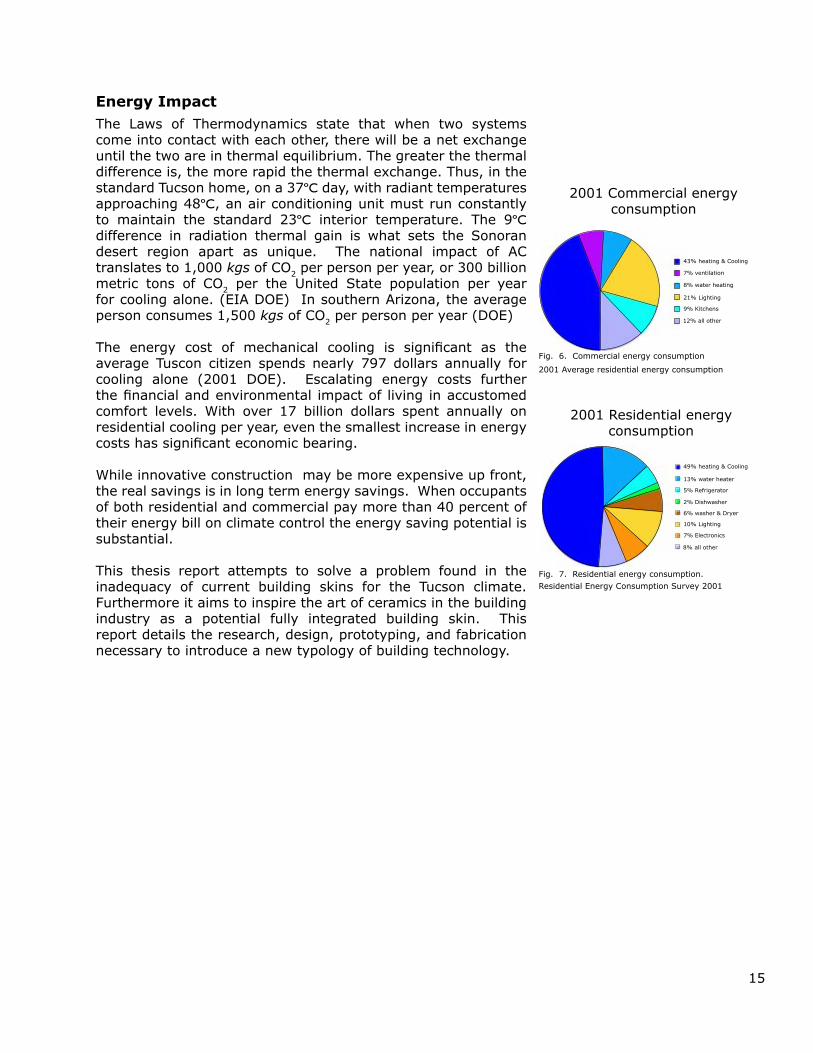
49% heating & Cooling
13% water heater
5% Refrigerator
2% Dishwasher
6% washer & Dryer
10% Lighting
7% Electronics
8% all other
43% heating & Cooling
7% ventilation
8% water heating
21% Lighting
9% Kitchens
12% all other
2001 Commercial energy consumption
2001 Average residential energy consumption
Energy ImpactThe Laws of Thermodynamics state that when two systems come into contact with each other, there will be a net exchange until the two are in thermal equilibrium. The greater the thermal difference is, the more rapid the thermal exchange. Thus, in the standard Tucson home, on a 37ºC day, with radiant temperatures approaching 48ºC, an air conditioning unit must run constantly to maintain the standard 23ºC interior temperature. The 9ºC difference in radiation thermal gain is what sets the Sonoran desert region apart as unique. The national impact of AC translates to 1,000 kgs of CO2 per person per year, or 300 billion metric tons of CO2 per the United State population per year for cooling alone. (EIA DOE) In southern Arizona, the average person consumes 1,500 kgs of CO2 per person per year (DOE)
The energy cost of mechanical cooling is significant as the average Tuscon citizen spends nearly 797 dollars annually for cooling alone (2001 DOE). Escalating energy costs further the financial and environmental impact of living in accustomed comfort levels. With over 17 billion dollars spent annually on residential cooling per year, even the smallest increase in energy costs has significant economic bearing.
While innovative construction may be more expensive up front, the real savings is in long term energy savings. When occupants of both residential and commercial pay more than 40 percent of their energy bill on climate control the energy saving potential is substantial.
This thesis report attempts to solve a problem found in the inadequacy of current building skins for the Tucson climate. Furthermore it aims to inspire the art of ceramics in the building industry as a potential fully integrated building skin. This report details the research, design, prototyping, and fabrication necessary to introduce a new typology of building technology.
Commercial energy consumptionFig. 6.
Residential energy consumption.Fig. 7.
2001 Residential energy consumption

17
Homologues and Analogues

18
Barrel CactiBarrel cacti were investigated due to their obvious ribs and valleys and their ability to self shade. Investigation revealed the following:
The researcher observed thatCacti thorns change color by elevation. ▪
Cacti thorns change color from base to tip. ▪
Cacti change in geometric and tissue density. ▪
Cacti lose more water in winter than summer due to ▪aperture openings.
Cacti modify micro climate in radiation absorption and ▪convection.
Sources: Lewis & Nobal, Watson, Gibbs, Smith ▪
Applying these findings to architecture, the following possibilities emerge
If a wall system used localized density and intentional ▪conductivity, it could maneuver thermal loads to the ground or the air.
If a wall system had a gradient density in material and ▪geometry, the top and bottom of the wall would respond differently (to heat/thermal energy).
If the skin worked primarily to shade and reduce radiation ▪on horizontal surfaces the interiors could maintain comfort levels for longer durations.
If the geometry prohibited or limited solar access during ▪the hottest periods, perhaps the cooling load would change.
The system could transfer heat to the ground via the ▪foundation, the root system.
Barrel Cacti ribFig. 8.
Barrel CactiFig. 9. RibsFig. 10.
Winter, apexFig. 11. Summer apexFig. 12.
19
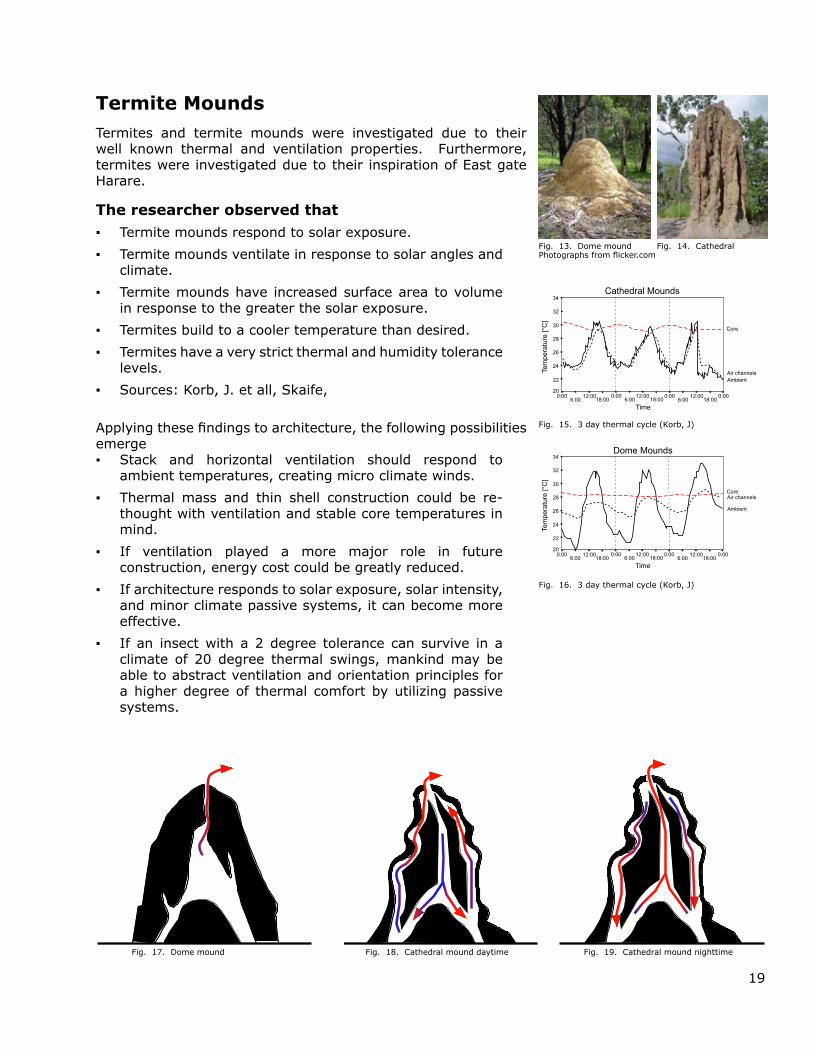
Termite MoundsTermites and termite mounds were investigated due to their well known thermal and ventilation properties. Furthermore, termites were investigated due to their inspiration of East gate Harare.
The researcher observed thatTermite mounds respond to solar exposure. ▪
Termite mounds ventilate in response to solar angles and ▪climate.
Termite mounds have increased surface area to volume ▪in response to the greater the solar exposure.
Termites build to a cooler temperature than desired. ▪
Termites have a very strict thermal and humidity tolerance ▪levels.
Sources: Korb, J. et all, Skaife, ▪
Applying these findings to architecture, the following possibilities emerge
Stack and horizontal ventilation should respond to ▪ambient temperatures, creating micro climate winds.
Thermal mass and thin shell construction could be re- ▪thought with ventilation and stable core temperatures in mind.
If ventilation played a more major role in future ▪construction, energy cost could be greatly reduced.
If architecture responds to solar exposure, solar intensity, ▪and minor climate passive systems, it can become more effective.
If an insect with a 2 degree tolerance can survive in a ▪climate of 20 degree thermal swings, mankind may be able to abstract ventilation and orientation principles for a higher degree of thermal comfort by utilizing passive systems.
0:00 12:006:00 18:00
Time
34
32
30
28
26
24
22
20Te
mpe
ratu
re [°
C]
0:00 12:006:00 18:00
0:00 12:006:00 18:00
0:00
Dome Mounds
Core
Ambient
Air channels
0:00 12:006:00 18:00
Time
34
32
30
28
26
24
22
20
Tem
pera
ture
[°C
]
0:00 12:006:00 18:00
0:00 12:006:00 18:00
0:00
Cathedral Mounds
Core
AmbientAir channels
Dome moundFig. 13. Cathedral Fig. 14.
3 day thermal cycle (Korb, J)Fig. 15.
3 day thermal cycle (Korb, J)Fig. 16.
Photographs from flicker.com
Dome moundFig. 17. Cathedral mound daytimeFig. 18. Cathedral mound nighttimeFig. 19.
20
22
26
30
34
38
42
46
50
0 5 10 15 20 25 30 35 40 45 50 55 60 65 70 75
Time
Tem
p
Pyramid baseTop Temp Bottom Temp Apex pyramid
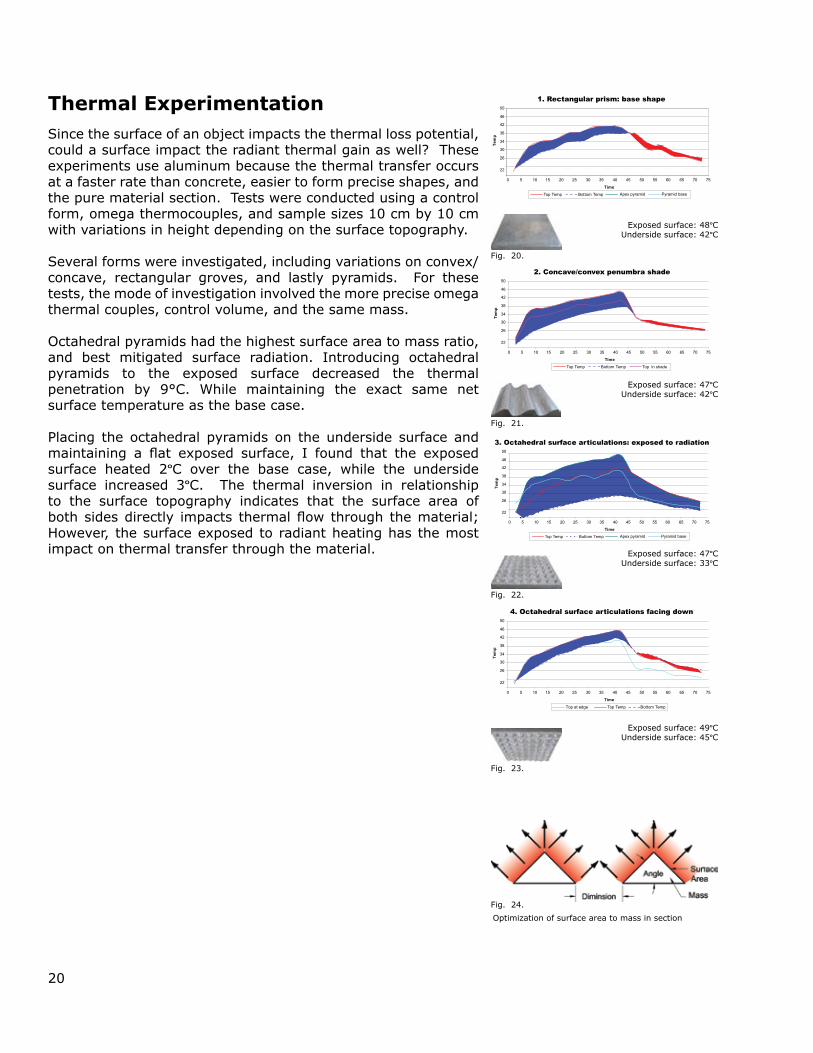
3. Octahedral surface articulations: exposed to radiation
22
26
30
34
38
42
46
50
0 5 10 15 20 25 30 35 40 45 50 55 60 65 70 75
Time
Tem
p
Top at edge Top Temp Bottom Temp
4. Octahedral surface articulations facing down
22
26
30
34
38
42
46
50
0 5 10 15 20 25 30 35 40 45 50 55 60 65 70 75
Time
Tem
p
Pyramid baseTop Temp Bottom Temp Apex pyramid
1. Rectangular prism: base shape
22
26
30
34
38
42
46
50
0 5 10 15 20 25 30 35 40 45 50 55 60 65 70 75
Time
Tem
p
Top Temp Bottom Temp Top in shade
2. Concave/convex penumbra shade
Exposed surface: 48ºCUnderside surface: 42ºC
Exposed surface: 47ºCUnderside surface: 42ºC
Exposed surface: 47ºCUnderside surface: 33ºC
Exposed surface: 49ºCUnderside surface: 45ºC
Optimization of surface area to mass in section
Thermal ExperimentationSince the surface of an object impacts the thermal loss potential, could a surface impact the radiant thermal gain as well? These experiments use aluminum because the thermal transfer occurs at a faster rate than concrete, easier to form precise shapes, and the pure material section. Tests were conducted using a control form, omega thermocouples, and sample sizes 10 cm by 10 cm with variations in height depending on the surface topography.
Several forms were investigated, including variations on convex/concave, rectangular groves, and lastly pyramids. For these tests, the mode of investigation involved the more precise omega thermal couples, control volume, and the same mass.
Octahedral pyramids had the highest surface area to mass ratio, and best mitigated surface radiation. Introducing octahedral pyramids to the exposed surface decreased the thermal penetration by 9°C. While maintaining the exact same net surface temperature as the base case.
Placing the octahedral pyramids on the underside surface and maintaining a flat exposed surface, I found that the exposed surface heated 2ºC over the base case, while the underside surface increased 3ºC. The thermal inversion in relationship to the surface topography indicates that the surface area of both sides directly impacts thermal flow through the material; However, the surface exposed to radiant heating has the most impact on thermal transfer through the material.
Fig. 20.
Fig. 21.
Fig. 22.
Fig. 23.
Fig. 24.
21
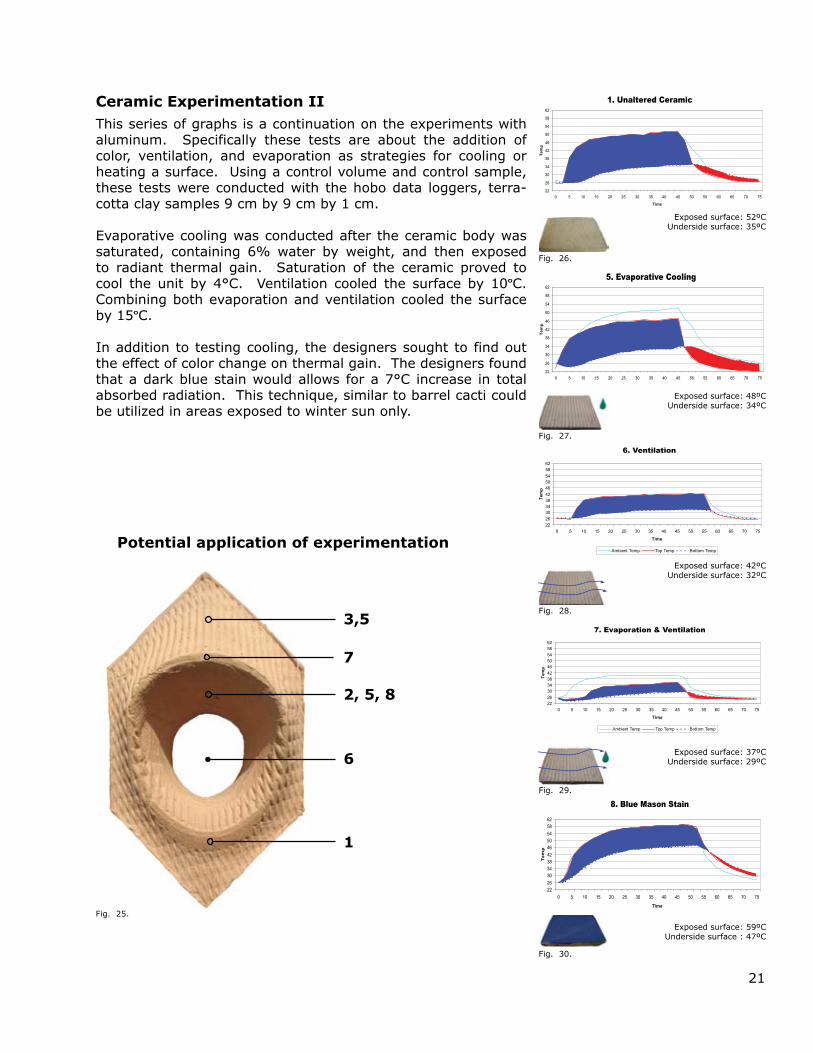
Ceramic Experimentation IIThis series of graphs is a continuation on the experiments with aluminum. Specifically these tests are about the addition of color, ventilation, and evaporation as strategies for cooling or heating a surface. Using a control volume and control sample, these tests were conducted with the hobo data loggers, terra-cotta clay samples 9 cm by 9 cm by 1 cm.
Evaporative cooling was conducted after the ceramic body was saturated, containing 6% water by weight, and then exposed to radiant thermal gain. Saturation of the ceramic proved to cool the unit by 4°C. Ventilation cooled the surface by 10ºC. Combining both evaporation and ventilation cooled the surface by 15ºC.
In addition to testing cooling, the designers sought to find out the effect of color change on thermal gain. The designers found that a dark blue stain would allows for a 7°C increase in total absorbed radiation. This technique, similar to barrel cacti could be utilized in areas exposed to winter sun only.
2226303438424650545862
0 5 10 15 20 25 30 35 40 45 50 55 60 65 70 75
Time
Tem
p
Ambient Temp Top Temp Bottom Temp
8. Blue Mason Stain
22
26
30
34
38
42
46
50
54
58
62
0 5 10 15 20 25 30 35 40 45 50 55 60 65 70 75
Time
Tem
p
Ambient Top Temp Bottom Temp
1. Unaltered Ceramic
22
26
30
34
38
42
46
50
54
58
62
0 5 10 15 20 25 30 35 40 45 50 55 60 65 70 75
Time
Tem
p
Ambient Top Temp Bottom Temp
5. Evaporative Cooling
2226303438424650545862
0 5 10 15 20 25 30 35 40 45 50 55 60 65 70 75
TimeTe
mp
Ambient Temp Top Temp Bottom Temp
6. Ventilation
2226303438424650545862
0 5 10 15 20 25 30 35 40 45 50 55 60 65 70 75
Time
Tem
p
Ambient Temp Top Temp Bottom Temp
7. Evaporation & Ventilation
Exposed surface: 52ºCUnderside surface: 35ºC
Exposed surface: 42ºCUnderside surface: 32ºC
Exposed surface: 48ºCUnderside surface: 34ºC
Exposed surface: 37ºCUnderside surface: 29ºC
Exposed surface: 59ºCUnderside surface : 47ºC
6
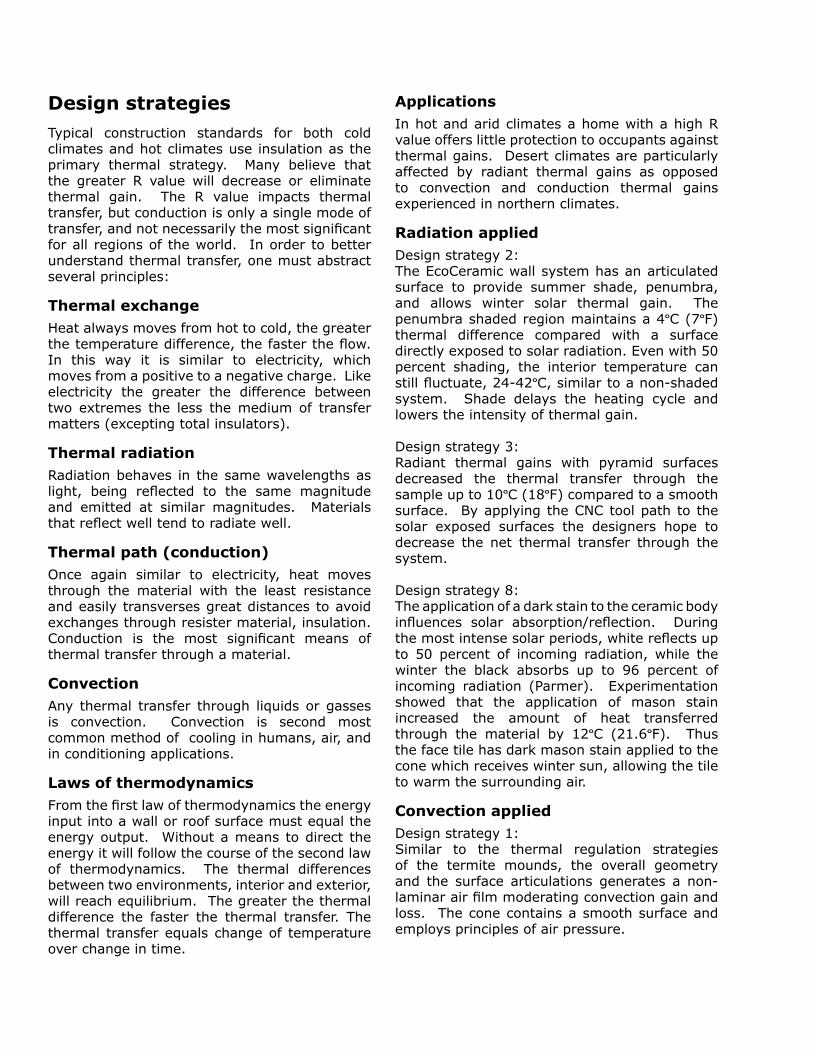
2, 5, 8
3,5
1
Potential application of experimentation
7
Fig. 25.
Fig. 26.
Fig. 27.
Fig. 28.
Fig. 29.
Fig. 30.
Design strategiesTypical construction standards for both cold climates and hot climates use insulation as the primary thermal strategy. Many believe that the greater R value will decrease or eliminate thermal gain. The R value impacts thermal transfer, but conduction is only a single mode of transfer, and not necessarily the most significant for all regions of the world. In order to better understand thermal transfer, one must abstract several principles:
Thermal exchangeHeat always moves from hot to cold, the greater the temperature difference, the faster the flow. In this way it is similar to electricity, which moves from a positive to a negative charge. Like electricity the greater the difference between two extremes the less the medium of transfer matters (excepting total insulators).
Thermal radiationRadiation behaves in the same wavelengths as light, being reflected to the same magnitude and emitted at similar magnitudes. Materials that reflect well tend to radiate well.
Thermal path (conduction)Once again similar to electricity, heat moves through the material with the least resistance and easily transverses great distances to avoid exchanges through resister material, insulation. Conduction is the most significant means of thermal transfer through a material.
Convection Any thermal transfer through liquids or gasses is convection. Convection is second most common method of cooling in humans, air, and in conditioning applications.
Laws of thermodynamicsFrom the first law of thermodynamics the energy input into a wall or roof surface must equal the energy output. Without a means to direct the energy it will follow the course of the second law of thermodynamics. The thermal differences between two environments, interior and exterior, will reach equilibrium. The greater the thermal difference the faster the thermal transfer. The thermal transfer equals change of temperature over change in time.
Applications In hot and arid climates a home with a high R value offers little protection to occupants against thermal gains. Desert climates are particularly affected by radiant thermal gains as opposed to convection and conduction thermal gains experienced in northern climates.
Radiation appliedDesign strategy 2:The EcoCeramic wall system has an articulated surface to provide summer shade, penumbra, and allows winter solar thermal gain. The penumbra shaded region maintains a 4ºC (7ºF) thermal difference compared with a surface directly exposed to solar radiation. Even with 50 percent shading, the interior temperature can still fluctuate, 24-42ºC, similar to a non-shaded system. Shade delays the heating cycle and lowers the intensity of thermal gain.
Design strategy 3:Radiant thermal gains with pyramid surfaces decreased the thermal transfer through the sample up to 10ºC (18ºF) compared to a smooth surface. By applying the CNC tool path to the solar exposed surfaces the designers hope to decrease the net thermal transfer through the system.
Design strategy 8:The application of a dark stain to the ceramic body influences solar absorption/reflection. During the most intense solar periods, white reflects up to 50 percent of incoming radiation, while the winter the black absorbs up to 96 percent of incoming radiation (Parmer). Experimentation showed that the application of mason stain increased the amount of heat transferred through the material by 12ºC (21.6ºF). Thus the face tile has dark mason stain applied to the cone which receives winter sun, allowing the tile to warm the surrounding air.
Convection appliedDesign strategy 1:Similar to the thermal regulation strategies of the termite mounds, the overall geometry and the surface articulations generates a non-laminar air film moderating convection gain and loss. The cone contains a smooth surface and employs principles of air pressure.
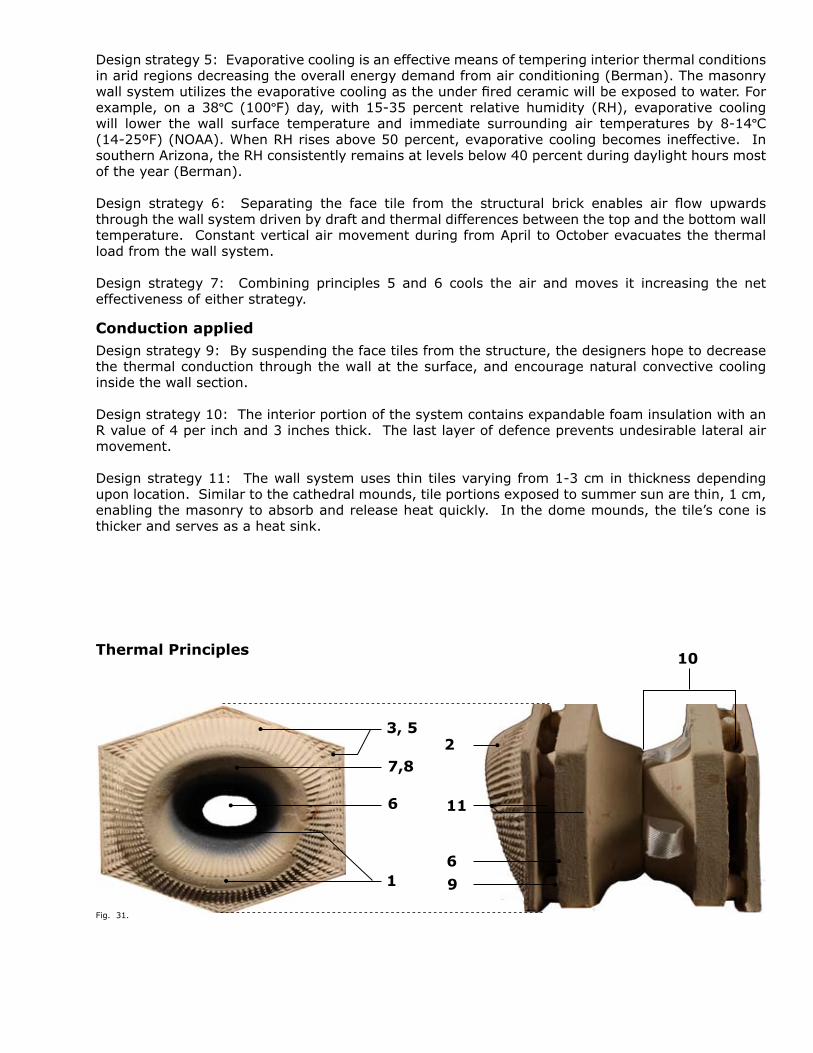
Design strategy 5: Evaporative cooling is an effective means of tempering interior thermal conditions in arid regions decreasing the overall energy demand from air conditioning (Berman). The masonry wall system utilizes the evaporative cooling as the under fired ceramic will be exposed to water. For example, on a 38ºC (100ºF) day, with 15-35 percent relative humidity (RH), evaporative cooling will lower the wall surface temperature and immediate surrounding air temperatures by 8-14ºC (14-25ºF) (NOAA). When RH rises above 50 percent, evaporative cooling becomes ineffective. In southern Arizona, the RH consistently remains at levels below 40 percent during daylight hours most of the year (Berman).
Design strategy 6: Separating the face tile from the structural brick enables air flow upwards through the wall system driven by draft and thermal differences between the top and the bottom wall temperature. Constant vertical air movement during from April to October evacuates the thermal load from the wall system.
Design strategy 7: Combining principles 5 and 6 cools the air and moves it increasing the net effectiveness of either strategy.
Conduction appliedDesign strategy 9: By suspending the face tiles from the structure, the designers hope to decrease the thermal conduction through the wall at the surface, and encourage natural convective cooling inside the wall section.
Design strategy 10: The interior portion of the system contains expandable foam insulation with an R value of 4 per inch and 3 inches thick. The last layer of defence prevents undesirable lateral air movement.
Design strategy 11: The wall system uses thin tiles varying from 1-3 cm in thickness depending upon location. Similar to the cathedral mounds, tile portions exposed to summer sun are thin, 1 cm, enabling the masonry to absorb and release heat quickly. In the dome mounds, the tile’s cone is thicker and serves as a heat sink.
3, 5
7,8
6
1
2
10
6
9
11
Thermal Principles
Fig. 31.

24
Fig. 32.
25
EcoCeramic Research
26
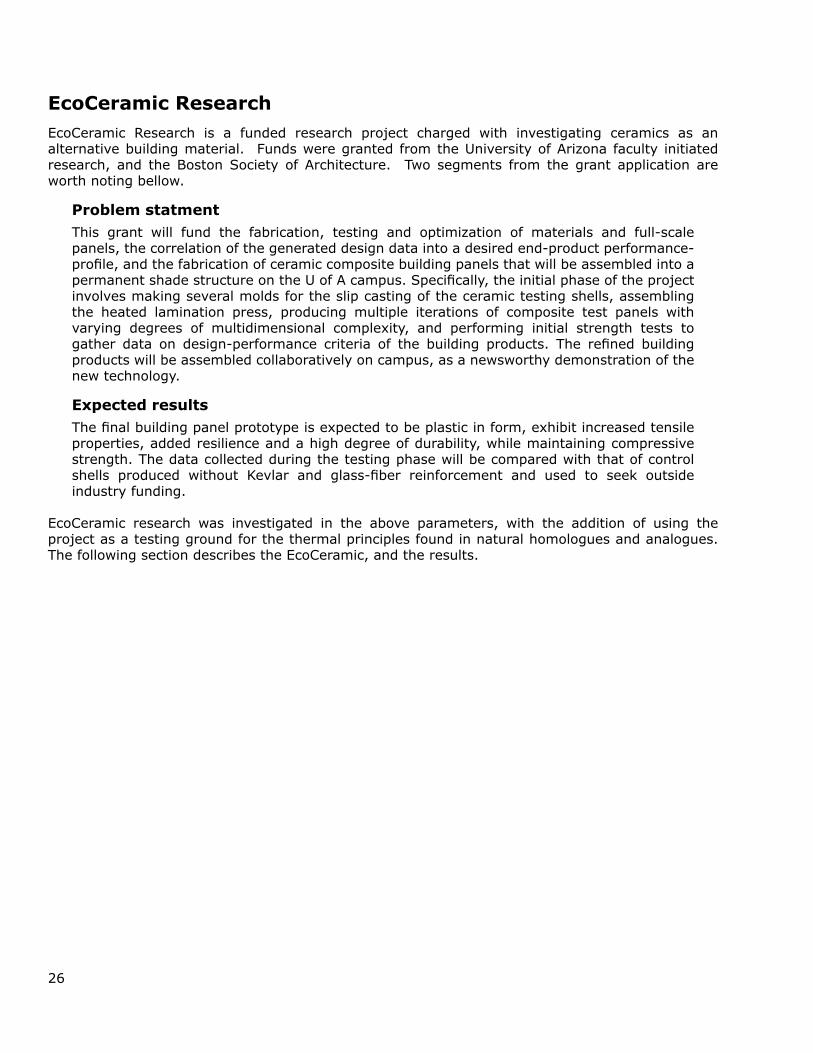
EcoCeramic ResearchEcoCeramic Research is a funded research project charged with investigating ceramics as an alternative building material. Funds were granted from the University of Arizona faculty initiated research, and the Boston Society of Architecture. Two segments from the grant application are worth noting bellow.
Problem statmentThis grant will fund the fabrication, testing and optimization of materials and full-scale panels, the correlation of the generated design data into a desired end-product performance-profile, and the fabrication of ceramic composite building panels that will be assembled into a permanent shade structure on the U of A campus. Specifically, the initial phase of the project involves making several molds for the slip casting of the ceramic testing shells, assembling the heated lamination press, producing multiple iterations of composite test panels with varying degrees of multidimensional complexity, and performing initial strength tests to gather data on design-performance criteria of the building products. The refined building products will be assembled collaboratively on campus, as a newsworthy demonstration of the new technology.
Expected resultsThe final building panel prototype is expected to be plastic in form, exhibit increased tensile properties, added resilience and a high degree of durability, while maintaining compressive strength. The data collected during the testing phase will be compared with that of control shells produced without Kevlar and glass-fiber reinforcement and used to seek outside industry funding.
EcoCeramic research was investigated in the above parameters, with the addition of using the project as a testing ground for the thermal principles found in natural homologues and analogues. The following section describes the EcoCeramic, and the results.
27
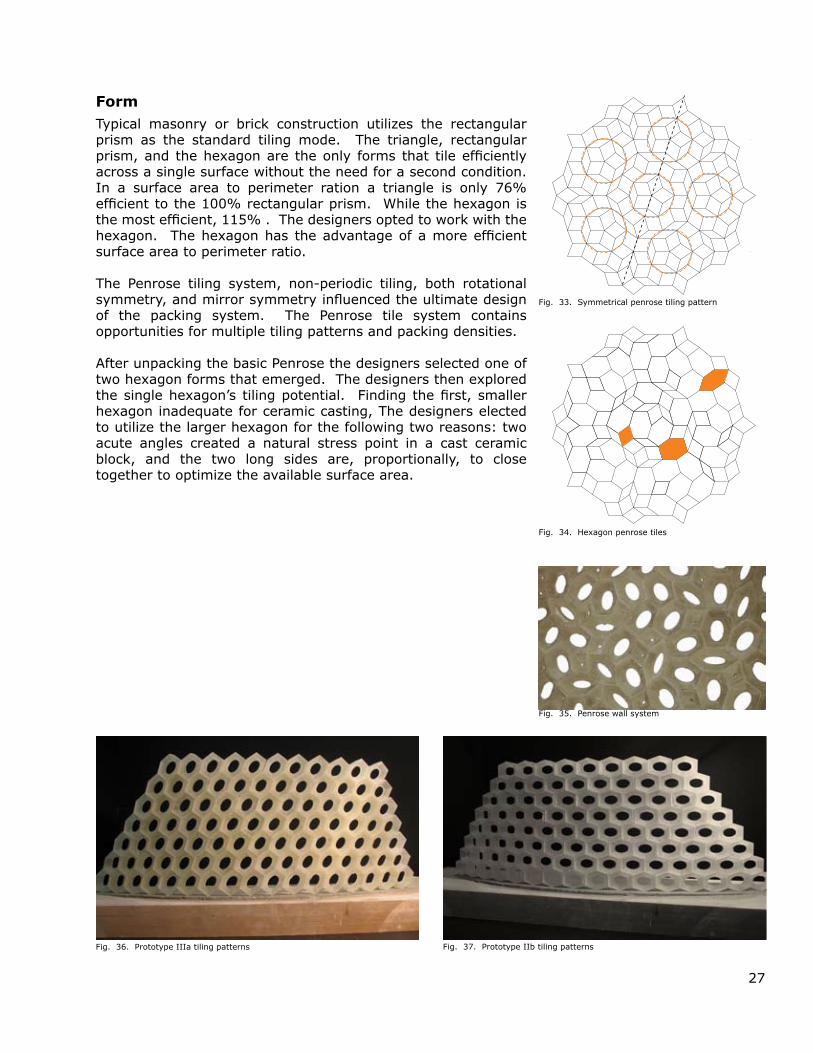
FormTypical masonry or brick construction utilizes the rectangular prism as the standard tiling mode. The triangle, rectangular prism, and the hexagon are the only forms that tile efficiently across a single surface without the need for a second condition. In a surface area to perimeter ration a triangle is only 76% efficient to the 100% rectangular prism. While the hexagon is the most efficient, 115% . The designers opted to work with the hexagon. The hexagon has the advantage of a more efficient surface area to perimeter ratio.
The Penrose tiling system, non-periodic tiling, both rotational symmetry, and mirror symmetry influenced the ultimate design of the packing system. The Penrose tile system contains opportunities for multiple tiling patterns and packing densities.
After unpacking the basic Penrose the designers selected one of two hexagon forms that emerged. The designers then explored the single hexagon’s tiling potential. Finding the first, smaller hexagon inadequate for ceramic casting, The designers elected to utilize the larger hexagon for the following two reasons: two acute angles created a natural stress point in a cast ceramic block, and the two long sides are, proportionally, to close together to optimize the available surface area.
Symmetrical penrose tiling patternFig. 33.
Hexagon penrose tilesFig. 34.
Penrose wall system Fig. 35.
Prototype IIIa tiling patterns Fig. 36. Prototype IIb tiling patternsFig. 37.

28
Fig. 38.

29
Two part rubber mold Fig. 39.
Cast Plastic tilesFig. 40.
Cast Plater Paris light studyFig. 41.
Hollow wall membrane, able to expand and contractFig. 42.
PrototypesThis prototype attempted to address increased surface area in a hexagonal tile pattern. Using Maya as a modeling platform, the skin was deformed to provide shading similarly to what is found in the barrel cacti. The designers took the digital file into MasterCAM and were able to CNC out the positive mold. The designers then took a rubber casting of both positive molds to create the negative production mold. The rubber allowed the production of both plastic and plaster prototypes. The plastic allowed for experimentation with color and less material for a tilling pattern. The plaster provided a wall surface that the designers could test light qualities and tiling patterns.
The designers also experimented with centrifugal cast rubber as a possible breathing wall. In this case expansion would decrease the surface area during the winter, and contraction would increase the surface area during the summer.
Through the process of creating this prototype the author was able to synthesize the design sequence into stages of digital creation, mold creation and production sequence. Latex rubber proved to be a quality production mold for both plaster and plastic casting.
30
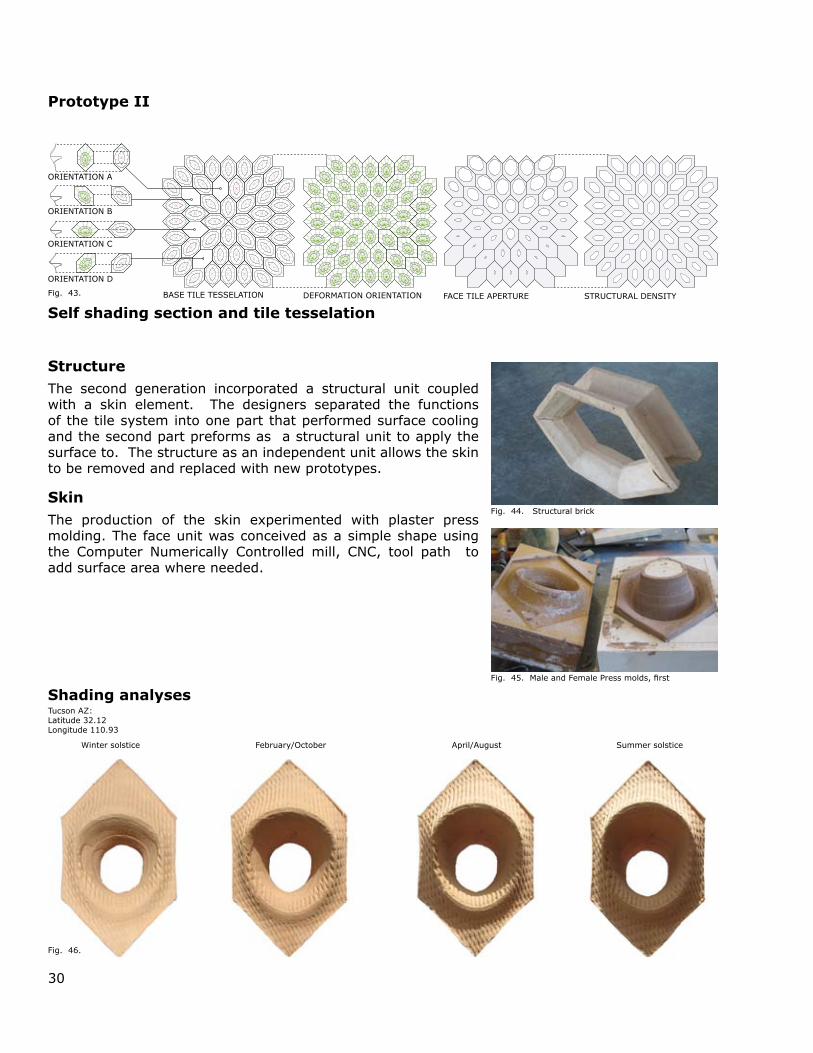
StructureThe second generation incorporated a structural unit coupled with a skin element. The designers separated the functions of the tile system into one part that performed surface cooling and the second part preforms as a structural unit to apply the surface to. The structure as an independent unit allows the skin to be removed and replaced with new prototypes.
SkinThe production of the skin experimented with plaster press molding. The face unit was conceived as a simple shape using the Computer Numerically Controlled mill, CNC, tool path to add surface area where needed.
Self shading section and tile tesselationDEFORMATION ORIENTATIONBASE TILE TESSELATION FACE TILE APERTURE STRUCTURAL DENSITY
ORIENTATION A
ORIENTATION B
ORIENTATION C
ORIENTATION D
Tucson AZ: Latitude 32.12Longitude 110.93
Shading analyses
Winter solstice February/October April/August Summer solstice
Fig. 43.
Prototype II
Structural brickFig. 44.
Male and Female Press molds, firstFig. 45.
Fig. 46.
31
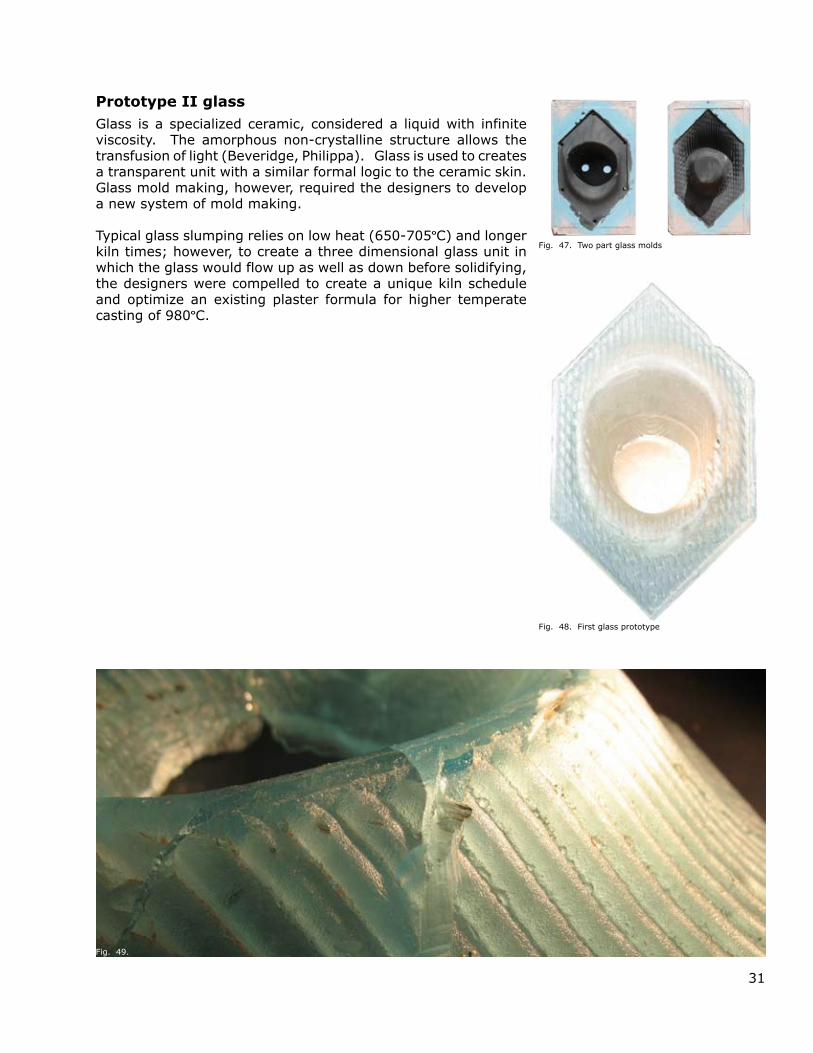
Prototype II glassGlass is a specialized ceramic, considered a liquid with infinite viscosity. The amorphous non-crystalline structure allows the transfusion of light (Beveridge, Philippa). Glass is used to creates a transparent unit with a similar formal logic to the ceramic skin. Glass mold making, however, required the designers to develop a new system of mold making.
Typical glass slumping relies on low heat (650-705ºC) and longer kiln times; however, to create a three dimensional glass unit in which the glass would flow up as well as down before solidifying, the designers were compelled to create a unique kiln schedule and optimize an existing plaster formula for higher temperate casting of 980ºC.
Two part glass moldsFig. 47.
First glass prototypeFig. 48.
Fig. 49.
32
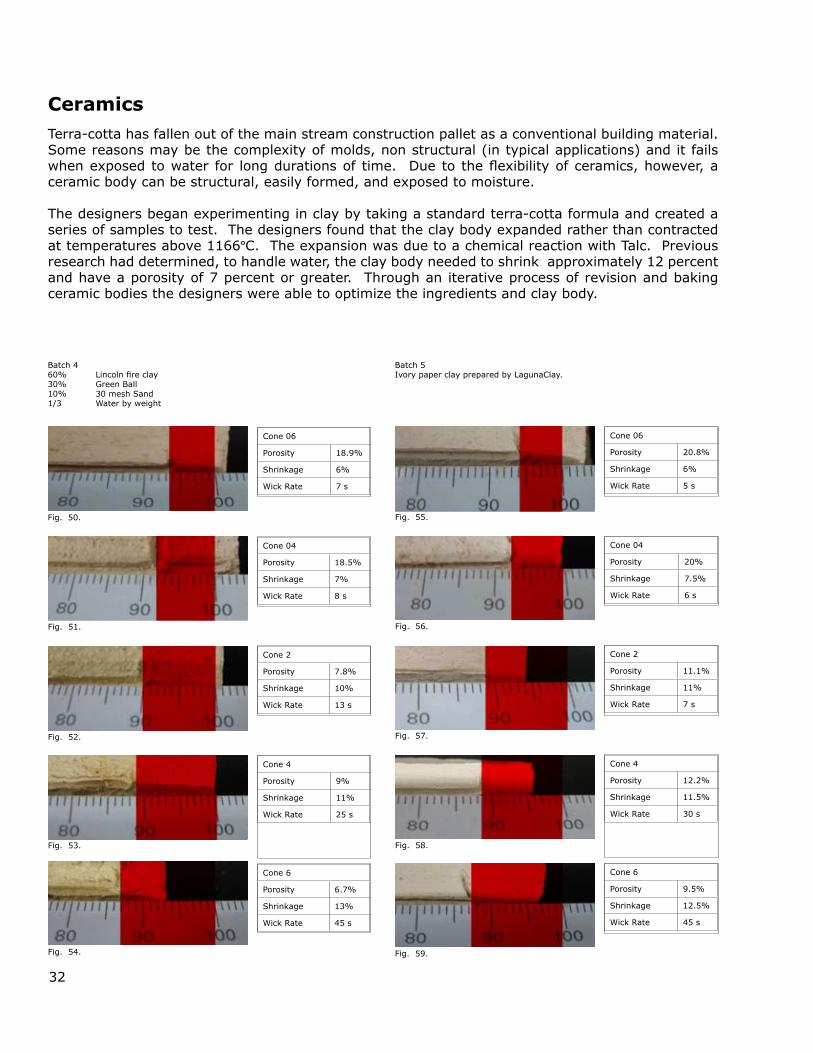
Cone 06
Porosity 18.9%
Shrinkage 6%
Wick Rate 7 s
Cone 04
Porosity 18.5%
Shrinkage 7%
Wick Rate 8 s
Cone 2
Porosity 7.8%
Shrinkage 10%
Wick Rate 13 s
Cone 4
Porosity 9%
Shrinkage 11%
Wick Rate 25 s
Cone 6
Porosity 6.7%
Shrinkage 13%
Wick Rate 45 s
Cone 06
Porosity 20.8%
Shrinkage 6%
Wick Rate 5 s
Cone 04
Porosity 20%
Shrinkage 7.5%
Wick Rate 6 s
Cone 2
Porosity 11.1%
Shrinkage 11%
Wick Rate 7 s
Cone 4
Porosity 12.2%
Shrinkage 11.5%
Wick Rate 30 s
Cone 6
Porosity 9.5%
Shrinkage 12.5%
Wick Rate 45 s
Batch 460% Lincoln fire clay30% Green Ball10% 30 mesh Sand1/3 Water by weight
Batch 5Ivory paper clay prepared by LagunaClay.
CeramicsTerra-cotta has fallen out of the main stream construction pallet as a conventional building material. Some reasons may be the complexity of molds, non structural (in typical applications) and it fails when exposed to water for long durations of time. Due to the flexibility of ceramics, however, a ceramic body can be structural, easily formed, and exposed to moisture.
The designers began experimenting in clay by taking a standard terra-cotta formula and created a series of samples to test. The designers found that the clay body expanded rather than contracted at temperatures above 1166ºC. The expansion was due to a chemical reaction with Talc. Previous research had determined, to handle water, the clay body needed to shrink approximately 12 percent and have a porosity of 7 percent or greater. Through an iterative process of revision and baking ceramic bodies the designers were able to optimize the ingredients and clay body.
Fig. 50.
Fig. 51.
Fig. 52.
Fig. 53.
Fig. 54.
Fig. 55.
Fig. 56.
Fig. 57.
Fig. 58.
Fig. 59.
33
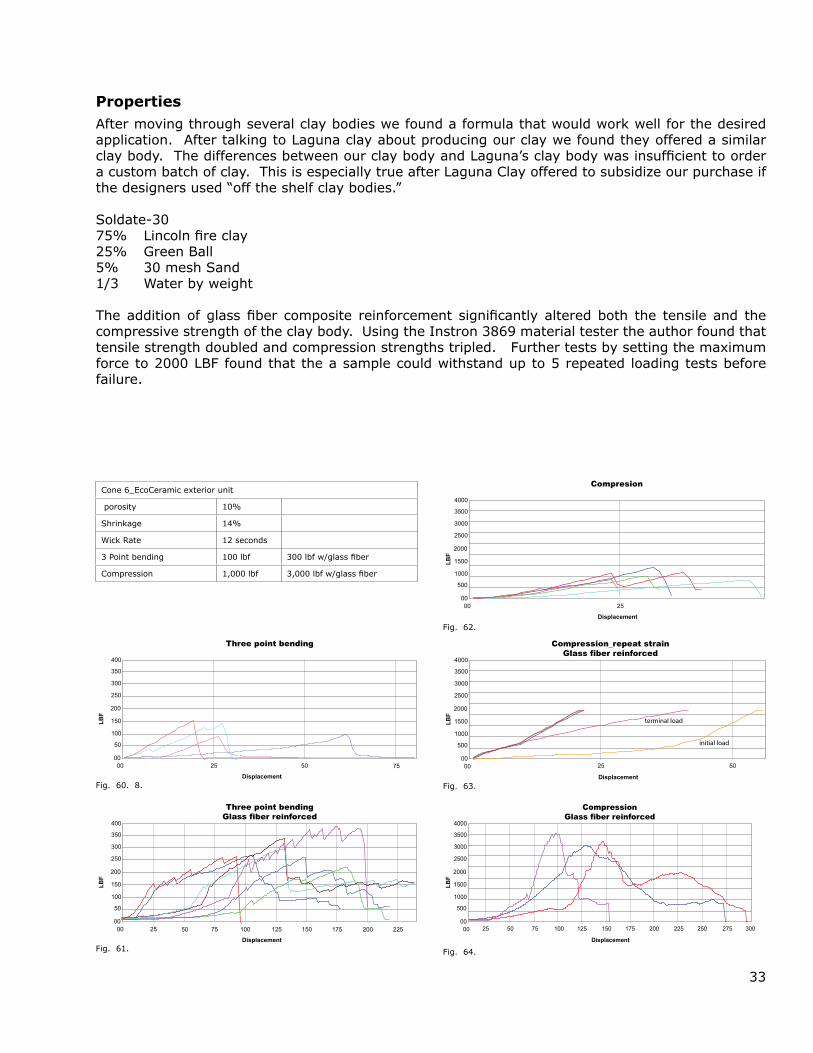
Cone 6_EcoCeramic exterior unit
porosity 10%
Shrinkage 14%
Wick Rate 12 seconds
3 Point bending 100 lbf 300 lbf w/glass fiber
Compression 1,000 lbf 3,000 lbf w/glass fiber
00
50
150
200
250
300
350
400
100
00 25 50 75
Three point bending
LBF
Displacement
00
50
150
200
250
300
350
400
100
00 25 225
Three point bendingGlass fiber reinforced
LBF
50 75 100 125 150 175 200
Displacement
00
500
1500
2000
2500
3000
3500
4000
1000
00 25
Compresion
LBF
Displacement
00
500
1500
2000
2500
3000
3500
4000
1000
00
Compression Glass fiber reinforced
LBF
300275250225200175150125100755025
Displacement
PropertiesAfter moving through several clay bodies we found a formula that would work well for the desired application. After talking to Laguna clay about producing our clay we found they offered a similar clay body. The differences between our clay body and Laguna’s clay body was insufficient to order a custom batch of clay. This is especially true after Laguna Clay offered to subsidize our purchase if the designers used “off the shelf clay bodies.”
Soldate-3075% Lincoln fire clay25% Green Ball5% 30 mesh Sand1/3 Water by weight
The addition of glass fiber composite reinforcement significantly altered both the tensile and the compressive strength of the clay body. Using the Instron 3869 material tester the author found that tensile strength doubled and compression strengths tripled. Further tests by setting the maximum force to 2000 LBF found that the a sample could withstand up to 5 repeated loading tests before failure.
00
500
1500
2000
2500
3000
3500
4000
1000
00
Compression_repeat strain Glass fiber reinforced
LBF
5025
initial load
terminal load
Displacement8.Fig. 60.
Fig. 61.
Fig. 62.
Fig. 63.
Fig. 64.
34
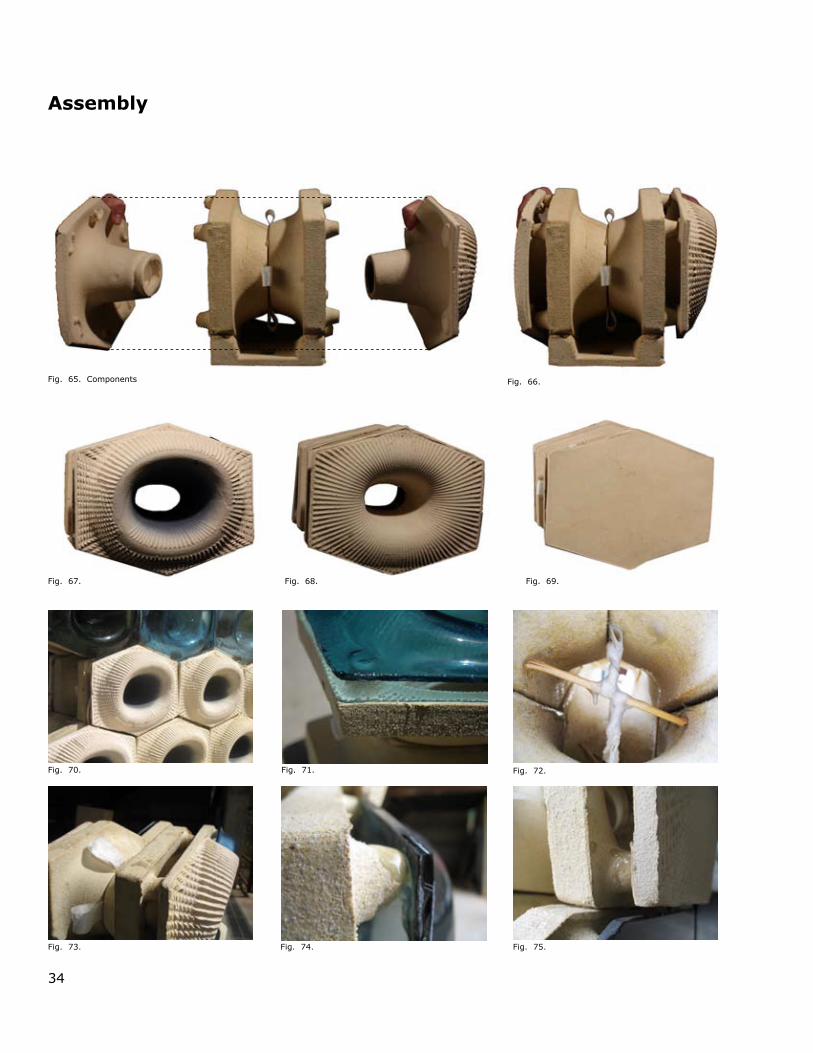
Assembly
ComponentsFig. 65. Fig. 66.
Fig. 67. Fig. 68. Fig. 69.
Fig. 70. Fig. 71. Fig. 72.
Fig. 73. Fig. 74. Fig. 75.
35
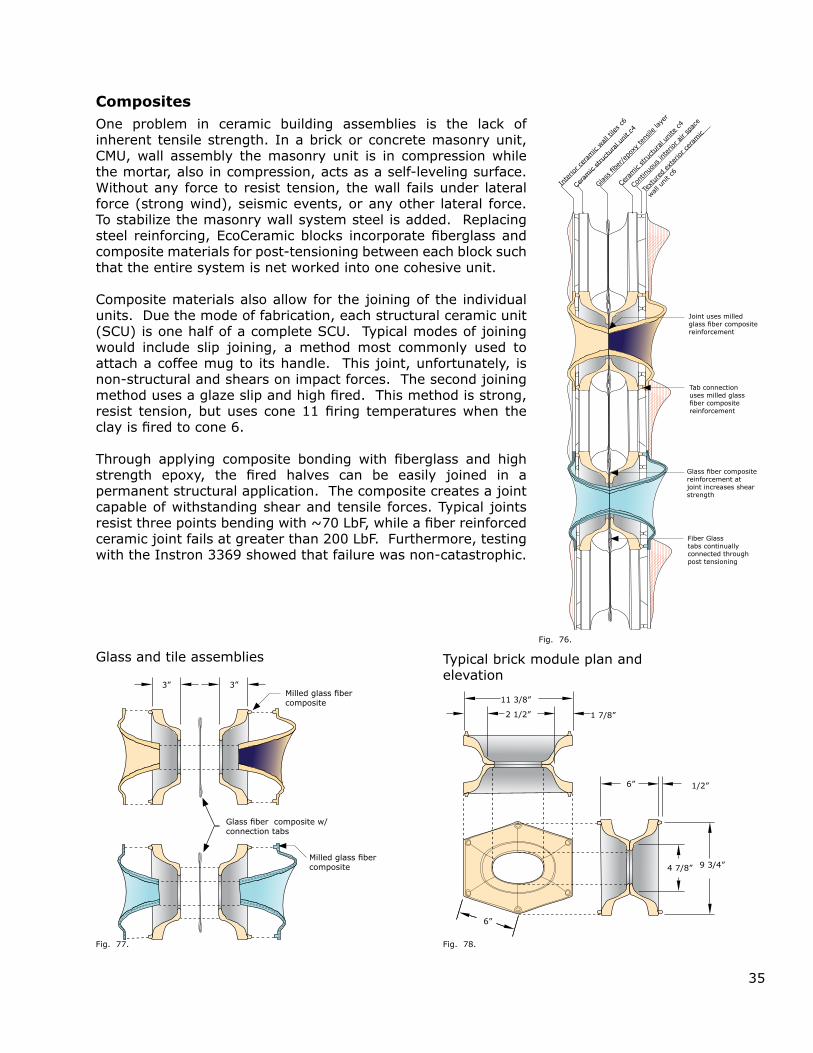
Tab connection uses milled glass fiber composite reinforcement
Joint uses milled glass fiber composite reinforcement
Glass fiber composite reinforcement at joint increases shear strength
Fiber Glass tabs continually connected through post tensioning
Interio
r cer
amic
wall t
iles c6
Cera
mic
stru
ctur
al unit c
4
Glass
fibe
r/ep
oxy tens
ile la
yer
Cera
mic
stru
ctur
al unite c4
Cont
inuo
us in
terio
r air
spac
e
Textur
ed exter
ior c
eram
ic
wall u
nit c
6
Typical brick module plan and elevation
2 1/2”
11 3/8”
1 7/8”
6” 1/2”
6”
4 7/8” 9 3/4”
CompositesOne problem in ceramic building assemblies is the lack of inherent tensile strength. In a brick or concrete masonry unit, CMU, wall assembly the masonry unit is in compression while the mortar, also in compression, acts as a self-leveling surface. Without any force to resist tension, the wall fails under lateral force (strong wind), seismic events, or any other lateral force. To stabilize the masonry wall system steel is added. Replacing steel reinforcing, EcoCeramic blocks incorporate fiberglass and composite materials for post-tensioning between each block such that the entire system is net worked into one cohesive unit.
Composite materials also allow for the joining of the individual units. Due the mode of fabrication, each structural ceramic unit (SCU) is one half of a complete SCU. Typical modes of joining would include slip joining, a method most commonly used to attach a coffee mug to its handle. This joint, unfortunately, is non-structural and shears on impact forces. The second joining method uses a glaze slip and high fired. This method is strong, resist tension, but uses cone 11 firing temperatures when the clay is fired to cone 6.
Through applying composite bonding with fiberglass and high strength epoxy, the fired halves can be easily joined in a permanent structural application. The composite creates a joint capable of withstanding shear and tensile forces. Typical joints resist three points bending with ~70 LbF, while a fiber reinforced ceramic joint fails at greater than 200 LbF. Furthermore, testing with the Instron 3369 showed that failure was non-catastrophic.
Glass and tile assemblies
Glass fiber composite w/connection tabs
Milled glass fiber composite
3” 3”
Fig. 76.
Fig. 77. Fig. 78.
Milled glass fiber composite

36
JiggeringFig. 79. Fig. 80.
Slip casting moldsFig. 81. Extrusion Fig. 82.
RAMpress moldsFig. 83.
Forming logicCeramics, like any material, has a set number of known fabrication techniques. Clay bodies are typically extruded, jiggered, slab formed, slip cast, or pressed. With each mode of fabrication comes limits, and benefits.
Extrusion is used to create liner ▪elliments.
Jiggered or spinning is used to create ▪symmetrical deep shapes.
Slab formation is used primarily for ▪planer units.
Slip casting is primaraly for asymmetrical ▪hollow units or units.
Pressing is used to create three ▪dimensional objects with material high density or structural objects.
Due to the complexity of the form and the quantity needed, pressing is the only viable option. Slip casting, the other known method, would shrink around the cone, preventing a smooth release and compromising the integrity of the unit.
Working with Catalina China Inc., the designers devised a method of mold making and a strategy for pressing the CSU and face tile. Essentially, both are a complicated plate, a single surface with three dimensional geometry in the xyz axis.
Pinch edgeFig. 84.
RAM PressFig. 85.
RAMpress Fig. 86. Drying racksFig. 87.
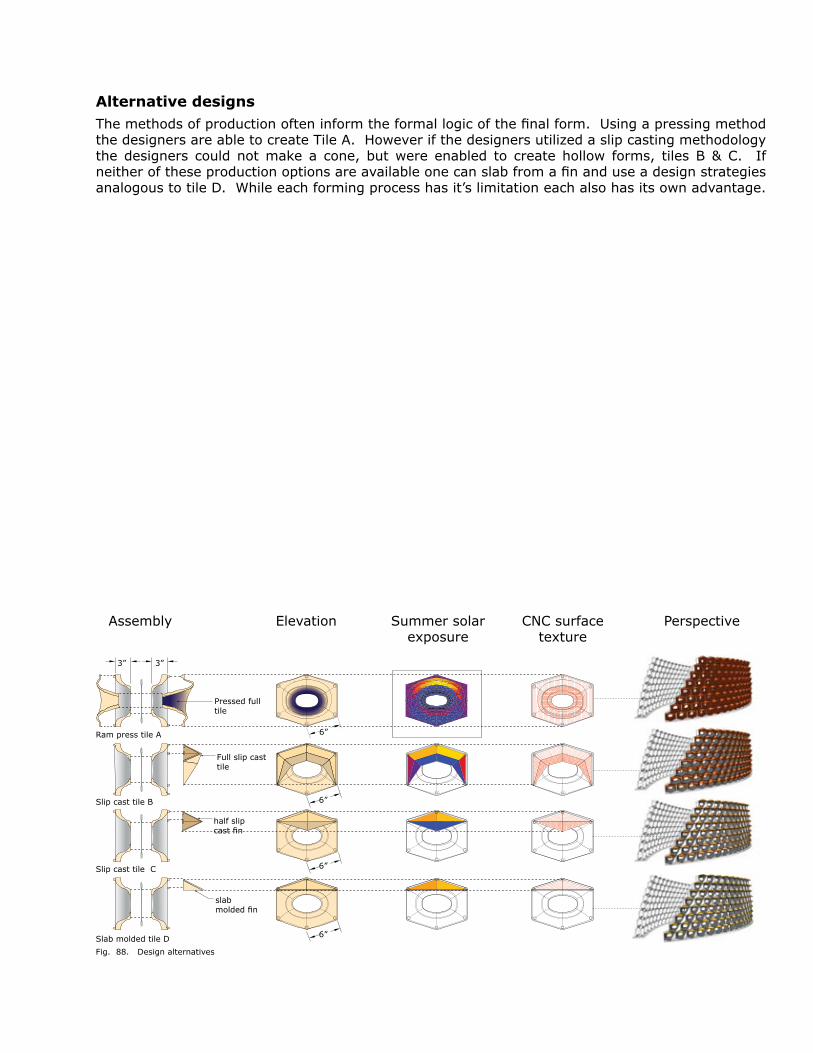
Summer solar exposure
3” 3”
6”
6”
6”
6”
Ram press tile A
Slip cast tile B
Slip cast tile C
Slab molded tile D
Pressed full tile
Full slip cast tile
half slip cast fin
slab molded fin
CNC surface texture
Assembly Elevation Perspective
Alternative designsThe methods of production often inform the formal logic of the final form. Using a pressing method the designers are able to create Tile A. However if the designers utilized a slip casting methodology the designers could not make a cone, but were enabled to create hollow forms, tiles B & C. If neither of these production options are available one can slab from a fin and use a design strategies analogous to tile D. While each forming process has it’s limitation each also has its own advantage.
Design alternativesFig. 88.
38
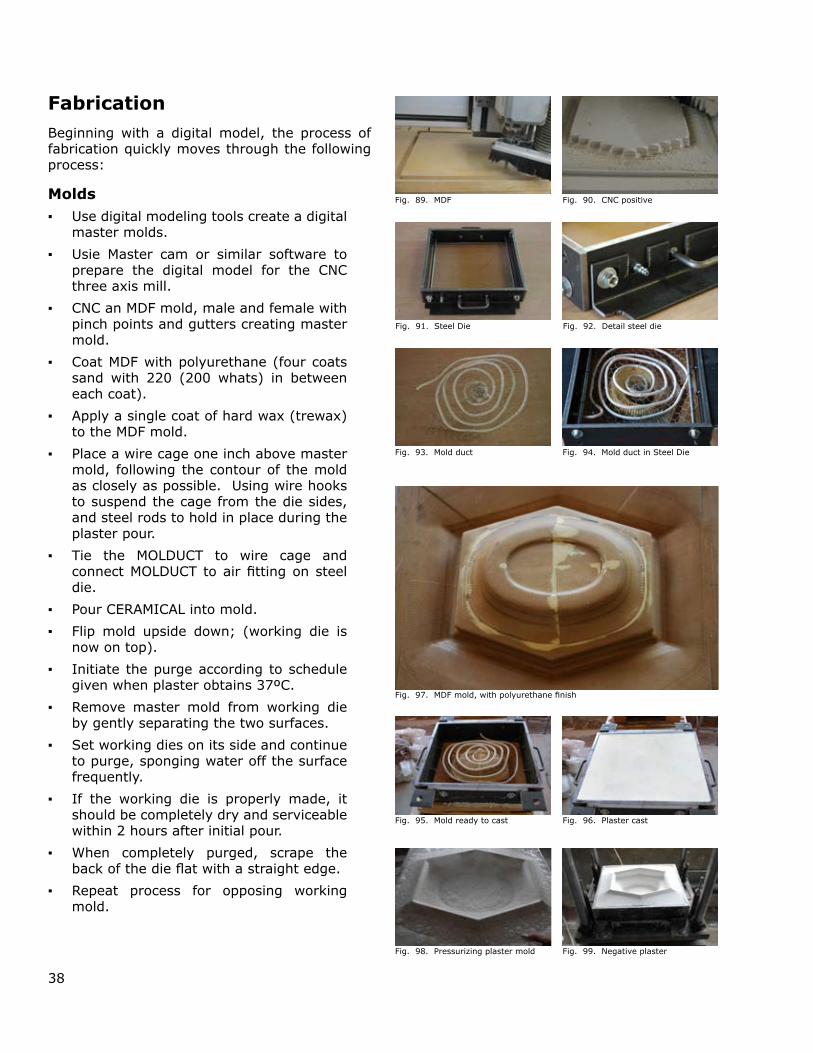
MDFFig. 89. CNC positiveFig. 90.
Steel DieFig. 91. Detail steel dieFig. 92.
Mold ductFig. 93. Mold duct in Steel DieFig. 94.
Mold ready to castFig. 95. Plaster castFig. 96.
MDF mold, with polyurethane finishFig. 97.
Pressurizing plaster moldFig. 98. Negative plaster Fig. 99.
FabricationBeginning with a digital model, the process of fabrication quickly moves through the following process:
MoldsUse digital modeling tools create a digital ▪master molds.
Usie Master cam or similar software to ▪prepare the digital model for the CNC three axis mill.
CNC an MDF mold, male and female with ▪pinch points and gutters creating master mold.
Coat MDF with polyurethane (four coats ▪sand with 220 (200 whats) in between each coat).
Apply a single coat of hard wax (trewax) ▪to the MDF mold.
Place a wire cage one inch above master ▪mold, following the contour of the mold as closely as possible. Using wire hooks to suspend the cage from the die sides, and steel rods to hold in place during the plaster pour.
Tie the MOLDUCT to wire cage and ▪connect MOLDUCT to air fitting on steel die.
Pour CERAMICAL into mold. ▪
Flip mold upside down; (working die is ▪now on top).
Initiate the purge according to schedule ▪given when plaster obtains 37ºC.
Remove master mold from working die ▪by gently separating the two surfaces.
Set working dies on its side and continue ▪to purge, sponging water off the surface frequently.
If the working die is properly made, it ▪should be completely dry and serviceable within 2 hours after initial pour.
When completely purged, scrape the ▪back of the die flat with a straight edge.
Repeat process for opposing working ▪mold.

39
MOLDUCT: air release
Male mold
Female mold
Mold registration
Wire mesh
MOLDUCT
Plaster production mold
MDF master mold
5/8” steel DIE
Male mold
Wire and MOLDUCT
Female mold
Unit forming cavity
MDF master mold
Wire and MOLDUCT
Plaster production mold
5/8” steel DIE
Production plaster cast
Production sequenceFig. 100.
PurgingPurging a plaster mold allows for greater strength, faster drying time and an on demand release of a clay unit. CeramiCAL was designed for both impact strength and to facilitate a purging process. Essentially the air pressure forces all water that is not bonded to the plaster out of the mold. Thus the placement of MolDuct in relation to the master mold is essential for a clean release of the ceramic unit.
Pressurizing negative working moldFig. 101.

40
PressingPre-determined clay charge made from ▪extruded blank is placed on the lower die.
Press is activated, bringing the two dies ▪into registration, dispersing the clay charge into the cavity of the unit.
Air is applied to the lower die, releasing ▪the clay from the lower die.
The dies are separated leaving the clay ▪unit in the top die.
The operator removes any flash from the ▪gutter in the top die.
The operator applies air to the upper die, ▪releasing the clay unit from the upper die. The unit then drops onto a board, or the operator’s hand.
The operator places the unit in a drying ▪rack, and then removes any excess water from the die.
Repeat process ▪
RAM Press Process
Male and female diesFig. 102.
Fig. 103.
Clay charge readyFig. 104. Pressing clayFig. 105. Unit formedFig. 106.

41
EcoCeramic Structural Unit (CSU)In the Emerging Material Technologies Ceramics Laboratory, one person can press 40 CSUs in an 8 hour day. If one had the facilities available at Catalina China Inc., a solitary worker would be capable of production 600 or 300 CSUs in a single day.
Production issuesProblems included warpege and deformation of the tiles edges. This caused an excess of manual labor. Solutions included firing the CSUs upside down to “even out” the warpege.
Issues with the firing process included a non-uniform ramp up and ramp down in the firing process. Further problems included a lack of air flow to evenly distribute the heat throughout the kiln. These problems manifested themselves in cracking, uneven firing, uneaven shrinkage, and explosions.
Solutions included altering the kiln rate from 148.9ºC per hour to 65.6ºC. This change limited nearly all cracking and warpage due to the firing process. The designers were not able to use forced convection, as none of the available kilns were built for production ceramic firing schedules.
EcoCeramic exterior unit (CEU)Utilizing the Emerging Material Technologies Ceramics Laboratory, one person can press 50 CEUs in an 8 hour day while in a production facility a solitary worker is capable of producing 550 units in a day.
Production issuesIssues in the drying included warpege and deformation of the tiles edges; drying edges would slump and take a non-planer final form.
Due to the uneven edges, each exterior face unit would only touch three of the six knobs on which to fasten to the structural unit. The consistent issue of a single raised corner indicates that part of the problem occurred before drying and firing in the removal of the CEU from the RAMPress. A even distribution air is needed in the male mold such that the unit and does not require prying the unit off by hand.
Drying unitsFig. 107.
kilnFig. 108.
Produced unitsFig. 109.
application of mason stainFig. 110.
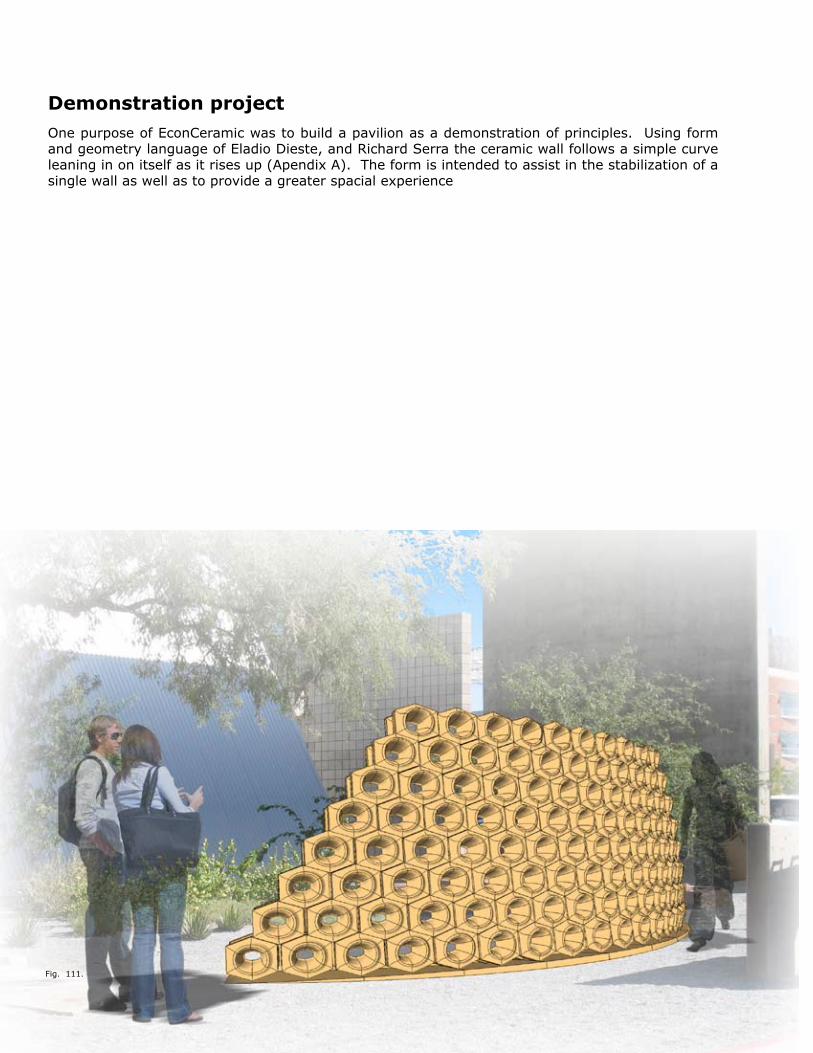
Demonstration projectOne purpose of EconCeramic was to build a pavilion as a demonstration of principles. Using form and geometry language of Eladio Dieste, and Richard Serra the ceramic wall follows a simple curve leaning in on itself as it rises up (Apendix A). The form is intended to assist in the stabilization of a single wall as well as to provide a greater spacial experience
Fig. 111.
43
00
01
02
0304
050607080910111213
24 23 22 21 20 19 18 17 16 15 14 13 12 11 10 09 08 07 06 05 04 03 02 01 00
2322
21 20 19 18 17 16 1514
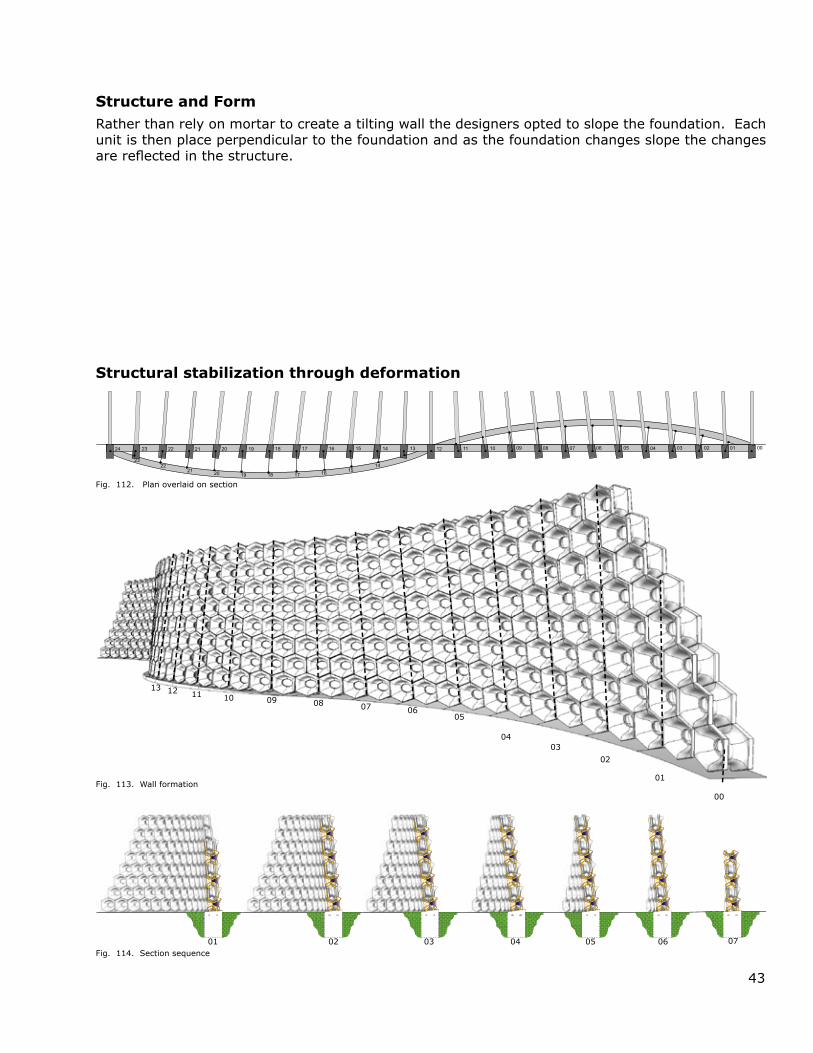
Structural stabilization through deformation
Plan overlaid on sectionFig. 112.
Structure and FormRather than rely on mortar to create a tilting wall the designers opted to slope the foundation. Each unit is then place perpendicular to the foundation and as the foundation changes slope the changes are reflected in the structure.
.01 .02 .03 .04 .05 .06 .0701 02 03 04 05 06 07
Wall formationFig. 113.
Section sequenceFig. 114.

44
Tucson AZ: Latitude 32.12Longitude 110.93
Shading analyses
Solar incidence
Winter solstice February/October April/August Summer solstice
Solar section
Solar analyses sequenceFig. 115.
45
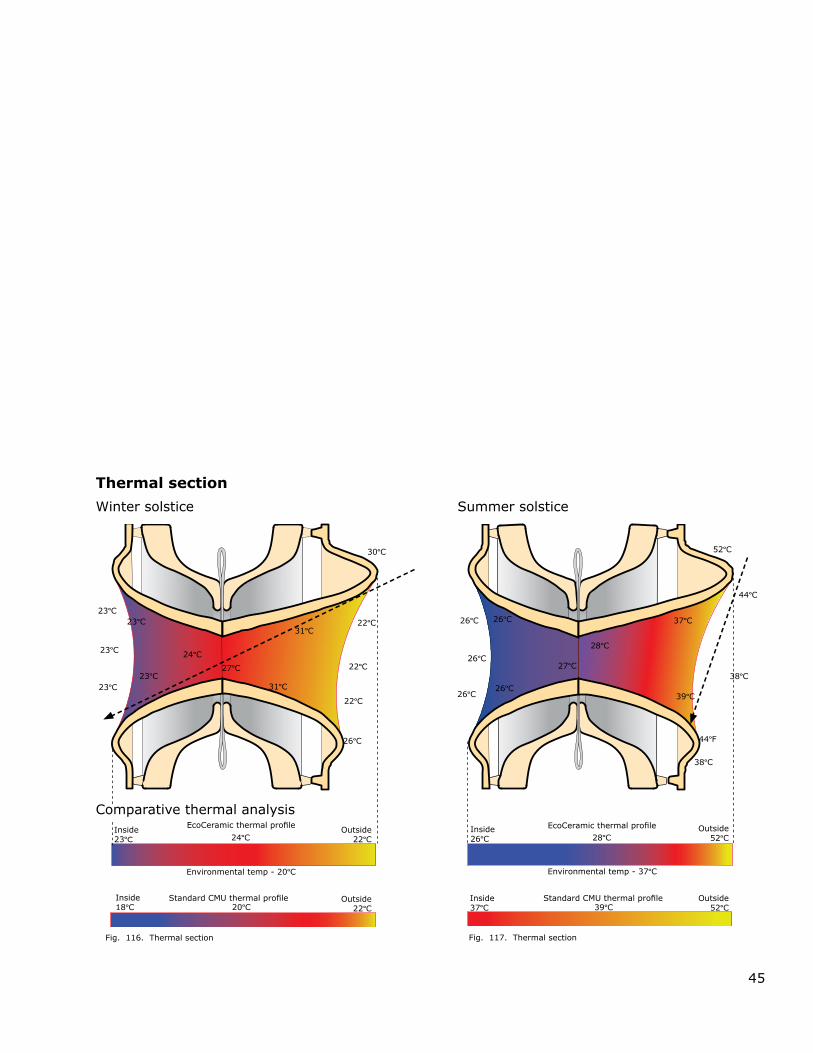
Thermal section
Winter solstice
EcoCeramic thermal profile
Standard CMU thermal profile
30ºC
22ºC
22ºC
26ºC
23ºC
23ºC
23ºC
24ºC
31ºC
31ºC
27ºC
Inside23ºC
Inside18ºC
Outside22ºC
Outside22ºC
Environmental temp - 20ºC
20ºC
24ºC
23ºC
23ºC
22ºC
Summer solstice
EcoCeramic thermal profile
Standard CMU thermal profile
Inside26ºC
Inside37ºC
Outside52ºC
Outside52ºC
Environmental temp - 37ºC
39ºC
28ºC
26ºC
26ºC
26ºC
26ºC
27ºC
28ºC
37ºC
39ºC
38ºC
52ºC
38ºC
44ºF
26ºC
44ºC
Comparative thermal analysis
Thermal sectionFig. 116. Thermal sectionFig. 117.
46
78ºF
100ºF
96ºF
92ºF
89ºF
86
83ºF
83ºF
83ºF80ºF
80ºF
80ºF
86ºF
89ºF
92ºF
96ºF
100ºF
100ºF
100ºF
100ºF
92ºF
96ºF
92ºF92ºF
92ºF 92ºF
92ºF
92ºF
92ºF92ºF
92ºF
92ºF
92ºF
92ºF
89ºF 89ºF
89ºF
89ºF
89ºF
89ºF
89ºF
86ºF
96ºF
96ºF
96ºF
96ºF
96ºF
96ºF
96ºF
96ºF96ºF
96ºF
100ºF100ºF
100ºF
100ºF
100ºF
100ºF
100ºF
100ºF
100ºF
.01
.02
.03.04
.05 .06 .07
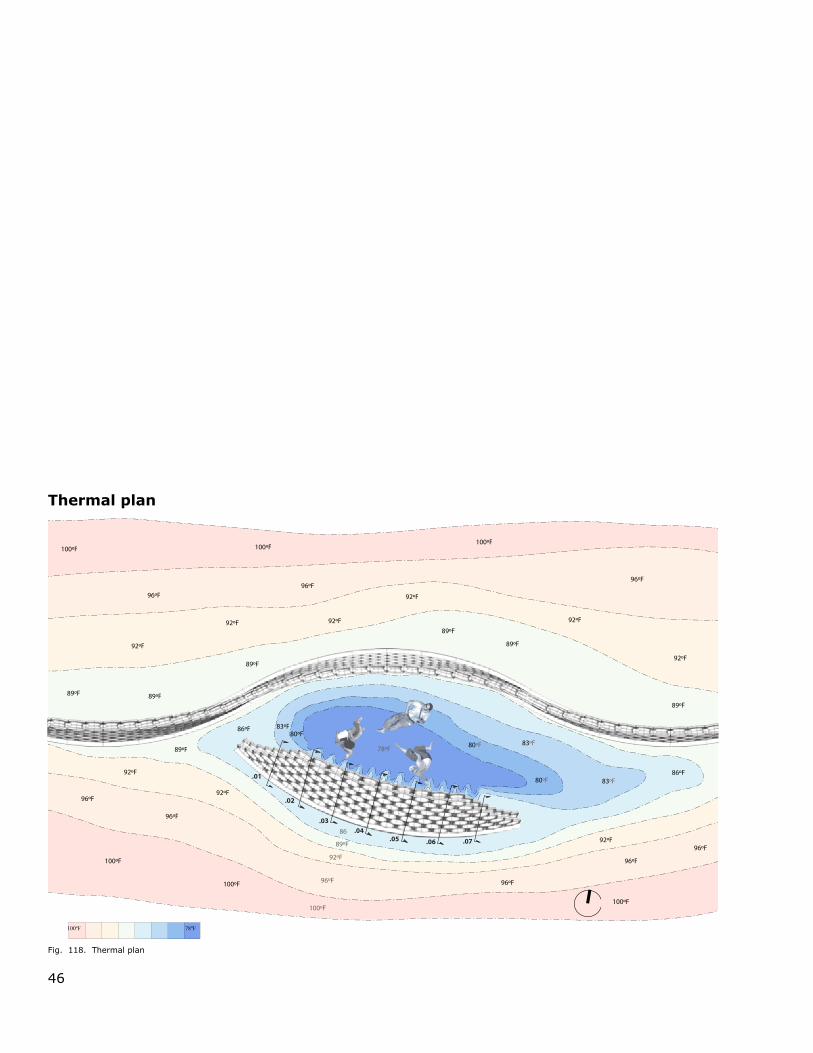
Thermal plan
78ºF
100ºF
96ºF
92ºF
89ºF
86
83ºF
83ºF
83ºF80ºF
80ºF
80ºF
86ºF
89ºF
92ºF
96ºF
100ºF
100ºF
100ºF
100ºF
92ºF
96ºF
92ºF92ºF
92ºF 92ºF
92ºF
92ºF
92ºF92ºF
92ºF
92ºF
92ºF
92ºF
89ºF 89ºF
89ºF
89ºF
89ºF
89ºF
89ºF
86ºF
96ºF
96ºF
96ºF
96ºF
96ºF
96ºF
96ºF
96ºF96ºF
96ºF
100ºF100ºF
100ºF
100ºF
100ºF
100ºF
100ºF
100ºF
100ºF
.01
.02
.03.04
.05 .06 .07
100ºF 78ºF
Thermal planFig. 118.

47
Thermal Tests

48
Thermal PrinciplesPrinciples found in nature; surface area, material thickness, color, shade and ventilation are abstracted and applied to a series of ceramic units to create a wall system capable of passively tempering the Sonoran Desert climate to within habitable temperatures, 23-30ºC.
Based on thermal experimentation the following principles are applied:
1) Smooth surface area for neutral ▪thermal gain/loss.
2) The surface of the tile is shaped ▪in conjunction with solar angles to maximize shading in the summer months and increase solar gain during the winter months.
3) Increasing the surface area through ▪the CNC tool path allows for radiant gain to dissipate back into the environment.
4) Increased surface area facing towards ▪the wall on interior surface, directs gains back into wall cavity.
5) Water soaks the tiles during the night ▪for evaporative day time cooling.
6) Tabs allow an air flow between the tile ▪and the structure.
7) Select tiles allow air to flow through ▪the wall, transporting moist and cool air inside.
8a) The tile (exposed to summer sun) is ▪left without glazing so that the light color may reflect most of the summer sun.
8b) The cone, which receives only winter ▪sunlight, is colored dark blue with mason stain warming the wall system.
9) Tabs also limit conduction thermal ▪transfer to the structural unit.
10) The hollow section can be filled with ▪fiber insulation.
11) The tile is thinnest in areas most ▪affected by summer sun, and thickest for regions most affected by winter sunlight.
Cone tapers to block summer solar access and allow winter solar access to thermal absorbing mason stain
cast glass tile
fiber glass tabs connected through continuous reenforcement
ceramic tile w/thermal absorbing stain
Interior Air space
ceramic face tile
Glass fiber tabs tensioned through anchor bolt
external air cooled by evaporation and shaded air zone
ceramic /fiber glass composite structural unit
Drip irrigation wets face tiles for evaporative cooling
sum
mer
sol
stic
e 81
ºSep
t 15
th 1
2:00
pm
Oct 15
th 1
2:00
pm
winter solstic
e
Insulation
Diagrammatic sectionFig. 119.
49
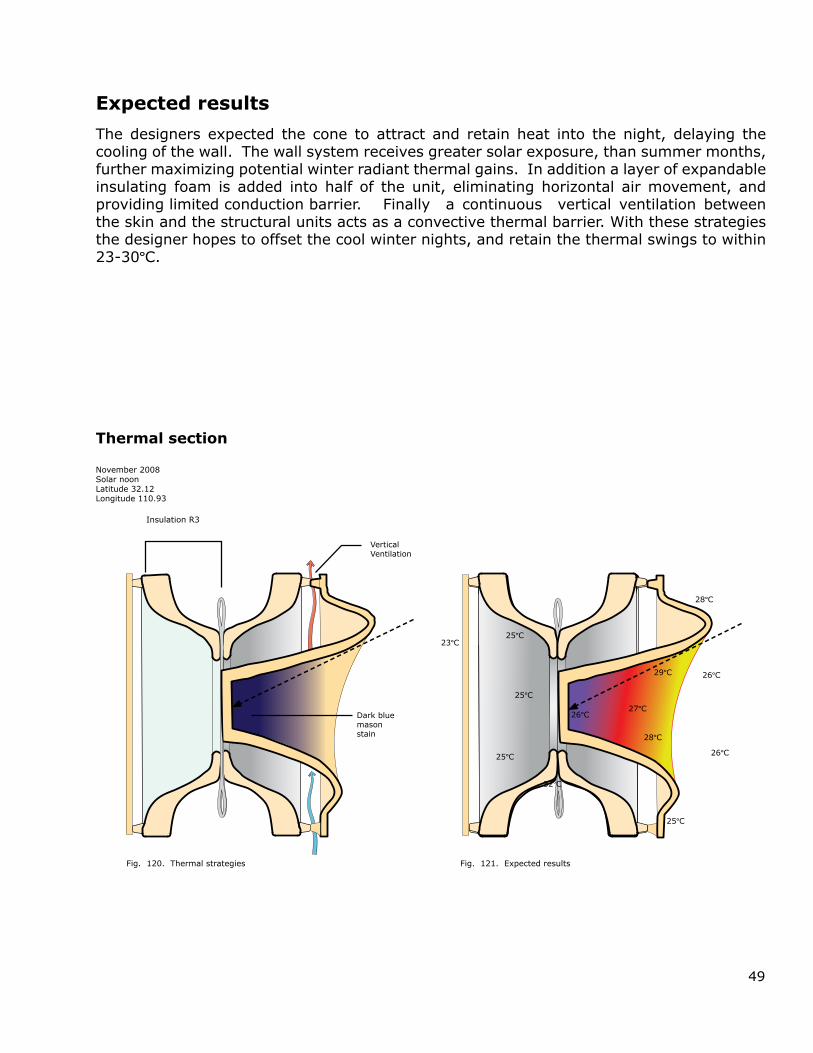
Expected results
The designers expected the cone to attract and retain heat into the night, delaying the cooling of the wall. The wall system receives greater solar exposure, than summer months, further maximizing potential winter radiant thermal gains. In addition a layer of expandable insulating foam is added into half of the unit, eliminating horizontal air movement, and providing limited conduction barrier. Finally a continuous vertical ventilation between the skin and the structural units acts as a convective thermal barrier. With these strategies the designer hopes to offset the cool winter nights, and retain the thermal swings to within 23-30ºC.
Thermal section
November 2008Solar noonLatitude 32.12Longitude 110.93
Thermal strategiesFig. 120. Expected resultsFig. 121.
Insulation R3
28ºC
25ºC
25ºC
25ºC
32ºC
27ºC
29ºC
26ºC
23ºC
Dark blue mason stain
Vertical Ventilation
28ºC
25ºC
26ºC
26ºC

50
MethodologyThe American Society for Testing and Materials International, ASTM, does not have a standard radiation thermal gain test procedure, rather one adapts the ASTM C1363, guarded hot box, by exposing the test surface to solar radiation. Unlike other tests, which wait for thermal equilibrium, this experiment requires a three day cycle, similar to field experimentation. In order to reduce weather related errors, the test series alternated between wall surface assemblies.
The testing chamber is one cubic meter in volume or 35.3 cubic feet. ▪
Floor dimensions are 1.3 meters wide by 1 meter deep. (~4’ x 3’) ▪
Five of the 6 sides are sheathed in 7.62 cm (3 inches) of homogenous polystyrene insulation ▪with an R-value of 12.
The combined material R-Value is 13.4 on five sides of the cube with a wall thickness of 12 ▪cm (4.75 inches).
Nine thermocouple data loggers record environmental, wall, and interior temperatures. ▪
Fig. 122.

51
051015
30
3540
455055
2025
0:00 6:00 12:00 18:00 0:00 6:00 12:00 18:00 0:00 6:00 12:00 18:00 0:00 6:00
Insulation wall test 01
Tem
p C
° & R
H%
B_Wall surfaceF_Ambient internalRelative Humidity
A_Radiation south side10-31-08 11-01-08 11-02-08 12-03-08
Time
AF B
Guarded Hot Box: test 01The interior maintained a 2ºC (4ºF) thermal difference at ▪the warmest point in the day with a thermal delay of 2 hours.
From approximately 15:00 to 9:00 the following day the ▪interior maintained a warmer temperature compared to the exterior.
The surface temperature consistently remained above ▪the ambient temperature.
The internal ambient temperature is closely linked to ▪the external environmental temperatures separated only through the thermal lag.
The test was conducted during cloudy and cold days, ▪consequently should be re-conducted for verification.
Guarded Hot BoxFig. 123.
Guarded Hot BoxFig. 124.
Guarded Hot BoxFig. 125.
52
051015
30
3540
455055
2025
0:00 6:00 12:00 18:00 0:00 6:00 12:00 18:00 0:00 6:00 12:00 18:00 0:00 6:00
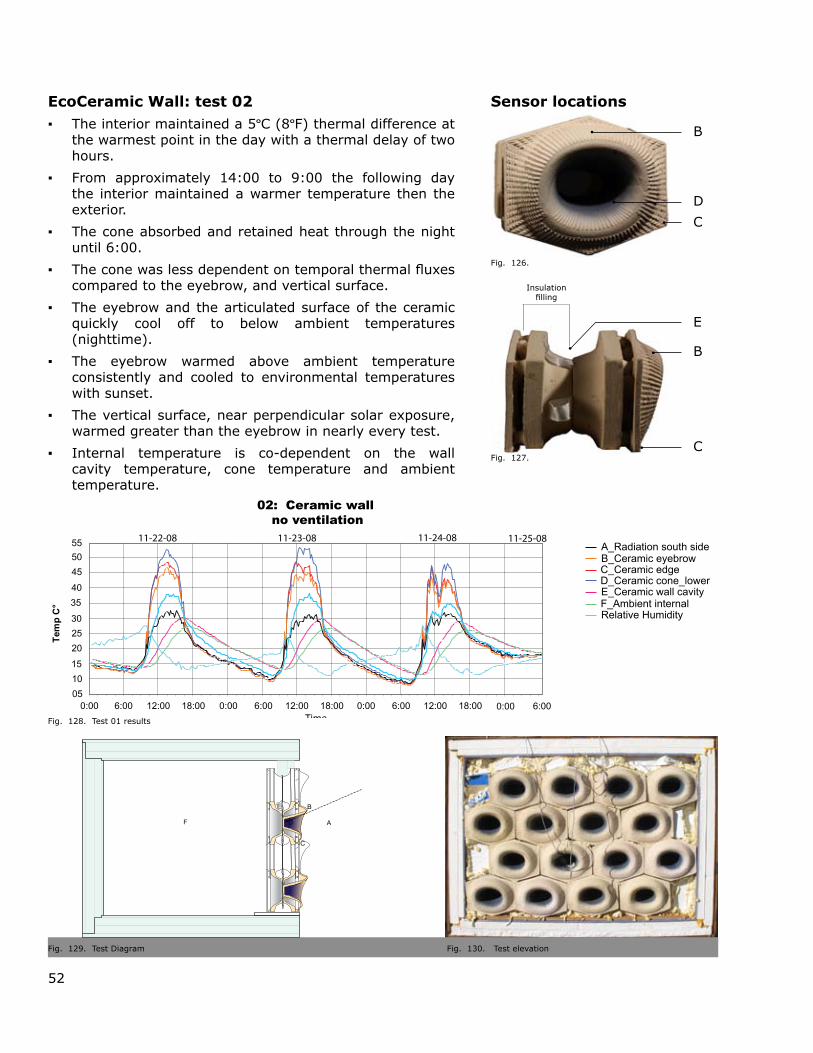
02: Ceramic wall no ventilation
Tem
p C
°
B_Ceramic eyebrowC_Ceramic edge
F_Ambient internalRelative Humidity
E_Ceramic wall cavityD_Ceramic cone_lower
A_Radiation south side11-22-08 11-23-08 11-24-08 11-25-08
Time
A
B
C
D
E
F
EcoCeramic Wall: test 02The interior maintained a 5 ▪ ºC (8ºF) thermal difference at the warmest point in the day with a thermal delay of two hours.
From approximately 14:00 to 9:00 the following day ▪the interior maintained a warmer temperature then the exterior.
The cone absorbed and retained heat through the night ▪until 6:00.
The cone was less dependent on temporal thermal fluxes ▪compared to the eyebrow, and vertical surface.
The eyebrow and the articulated surface of the ceramic ▪quickly cool off to below ambient temperatures (nighttime).
The eyebrow warmed above ambient temperature ▪consistently and cooled to environmental temperatures with sunset.
The vertical surface, near perpendicular solar exposure, ▪warmed greater than the eyebrow in nearly every test.
Internal temperature is co-dependent on the wall ▪cavity temperature, cone temperature and ambient temperature.
B
D
C
E
B
C
Insulation filling
Fig. 126.
Fig. 127.
Test 01 resultsFig. 128.
Test Diagram Fig. 129. Test elevationFig. 130.
Sensor locations
53
051015
30
3540
455055
2025
000816
40
4856
647280
2432
0:00 6:00 12:00 18:00 0:00 6:00 12:00 18:00 0:00 6:00 12:00 18:00 0:00 6:00
03: CMU wall
Tem
p C
°
RH
%
D_CMU cavity surfaceB_CMU surface
F_Ambient internalRelative Humidity
E_CMU cavity ambient
A_Radiation south side11-26-08 11-27-08 11-28-08 11-29-08
Time
AF E D B
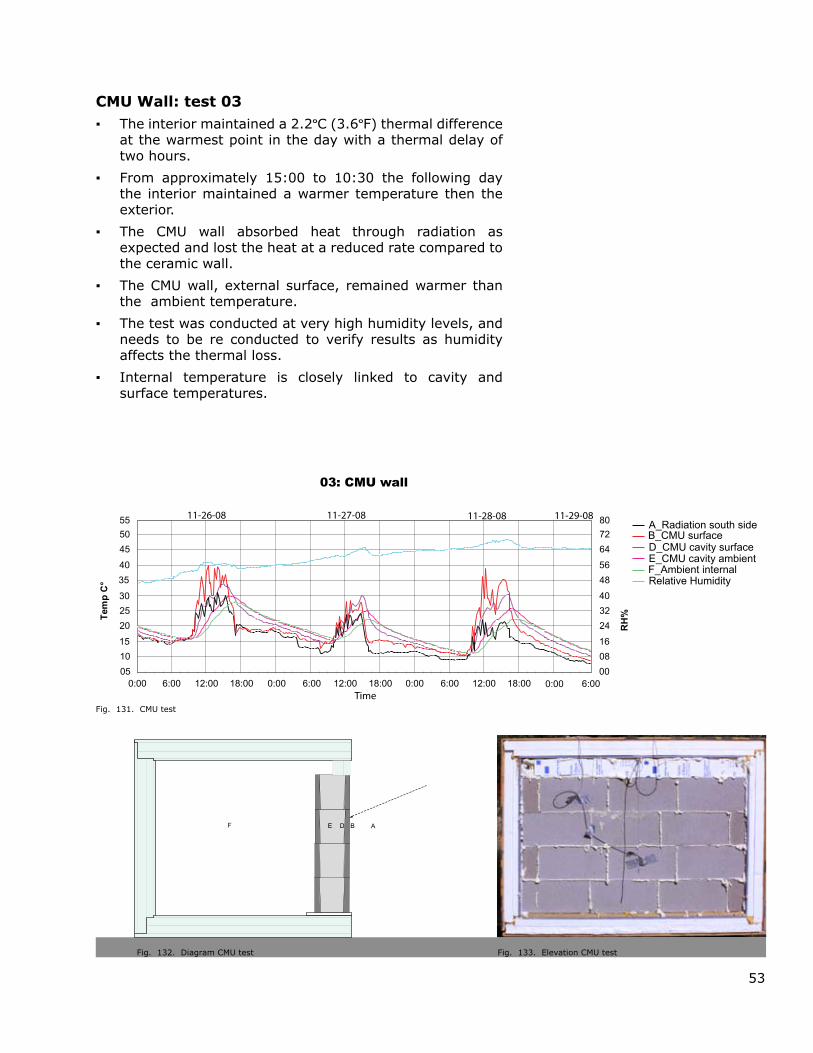
CMU Wall: test 03The interior maintained a 2.2 ▪ ºC (3.6ºF) thermal difference at the warmest point in the day with a thermal delay of two hours.
From approximately 15:00 to 10:30 the following day ▪the interior maintained a warmer temperature then the exterior.
The CMU wall absorbed heat through radiation as ▪expected and lost the heat at a reduced rate compared to the ceramic wall.
The CMU wall, external surface, remained warmer than ▪the ambient temperature.
The test was conducted at very high humidity levels, and ▪needs to be re conducted to verify results as humidity affects the thermal loss.
Internal temperature is closely linked to cavity and ▪surface temperatures.
CMU testFig. 131.
Diagram CMU testFig. 132. Elevation CMU testFig. 133.
54
051015
30
3540
455055
2025
000816
40
4856
647280
2432
0:00 6:00 12:00 18:00 0:00 6:00 12:00 18:00 0:00 6:00 12:00 0:00 6:00
04: Ceramic wall vertical ventilation
Tem
p C
°
RH
%B_Ceramic eyebrowC_Ceramic edge
F_Ambient internalRelative Humidity
E_Ceramic wall cavityD_Ceramic cone_lower
A_Radiation south side
Time
11-30-08 12-01-08 12-02-08 12-03-08
18:00
A
B
C
D
E
F
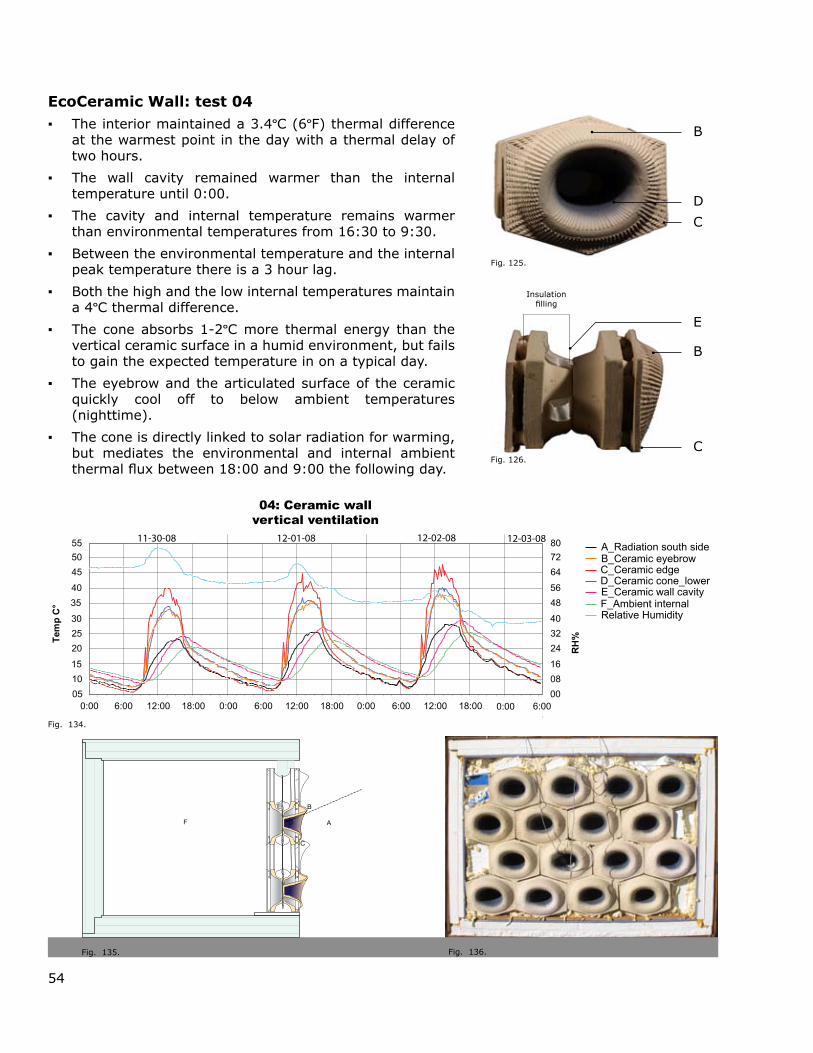
EcoCeramic Wall: test 04The interior maintained a 3.4 ▪ ºC (6ºF) thermal difference at the warmest point in the day with a thermal delay of two hours.
The wall cavity remained warmer than the internal ▪temperature until 0:00.
The cavity and internal temperature remains warmer ▪than environmental temperatures from 16:30 to 9:30.
Between the environmental temperature and the internal ▪peak temperature there is a 3 hour lag.
Both the high and the low internal temperatures maintain ▪a 4ºC thermal difference.
The cone absorbs 1-2 ▪ ºC more thermal energy than the vertical ceramic surface in a humid environment, but fails to gain the expected temperature in on a typical day.
The eyebrow and the articulated surface of the ceramic ▪quickly cool off to below ambient temperatures (nighttime).
The cone is directly linked to solar radiation for warming, ▪but mediates the environmental and internal ambient thermal flux between 18:00 and 9:00 the following day.
B
D
C
E
B
C
Insulation filling
Fig. 125.
Fig. 126.
Fig. 134.
Fig. 135. Fig. 136.

55
051015
30
3540
455055
2025
000816
40
4856
647280
2432
0:00 6:00 12:00 18:00 0:00 6:00 12:00 18:00 0:00 6:00 12:00 18:00 0:00 6:00
03: CMU wall
Tem
p C
°
RH
%
D_CMU cavity surfaceB_CMU surface
F_Ambient internalRelative Humidity
E_CMU cavity ambient
A_Radiation south side11-26-08 11-27-08 11-28-08 11-29-08
Time
AF E D B
CMU Wall: test 05Expecting results on Sunday morning ▪
CMU testFig. 137.
Diagram CMU testFig. 138. Elevation CMU testFig. 139.
Place
hol
der g
raph
ics

56
Thermal findingsThe EcoCeramic external surface consistently warmed above ambient temperatures, with the ▪highest recorded temperatures on the surfaces nearly perpendicular to the solar path.
The articulations, CNC tool path, allow the surface to quickly cool off to bellow ambient ▪temperatures with the loss of direct solar exposure.
The EcoCeramic wall system was able to reduce thermal swings by up to 5 ▪ ºC (8ºF) compared to the CMU wall which was only able to mitigate thermal swings by 2.2ºC (3.6ºF).
Variations in solar exposure delayed conduction through the EcoCeramic wall system. ▪
At 9:30 each day a spike of 8 ▪ ºC occurred over 15 minutes, it is not known what causes this thermal spike. The thermal spike was seen in three separate data loggers, and several points were not exposed to solar radiation.
Articulations seem to delay conductive thermal transfer through the wall system. ▪
If the cavity was filled with insulation a reduction in thermal transfer, and greater retention of ▪heat would be expected.
A vertical ventilation system that is operable, open for summer and closed in the winter, ▪would further help retain and release thermal gains.
26ºC
32ºC
32ºC24ºC
25ºC 40ºC
41ºC39ºC
36ºC
43ºC
30ºC
30ºC
24ºC
26ºC
25ºC
32ºC 32ºC
26ºC
31ºC
37ºC
37ºC29ºC
33ºC29ºC
34ºC
29ºC
28ºC
27ºC
27ºC
29ºC
40ºC
CMU actual thermal profile29ºC
CMU hypothesis thermal profile20ºC
Inside27ºC
Inside18ºC
Outside31ºC
Outside22ºC
EcoCeramic Actual thermal Profile32ºC
EcoCeramic hypothesis thermal profile39ºC
Inside24ºC
Inside37ºC
Outside30ºC
Outside52ºC
31ºC
Comparative thermal analysis
Data from test 03 at 15:00 hoursFig. 140. Data from test 04 at 15:00 hoursFig. 141.
57
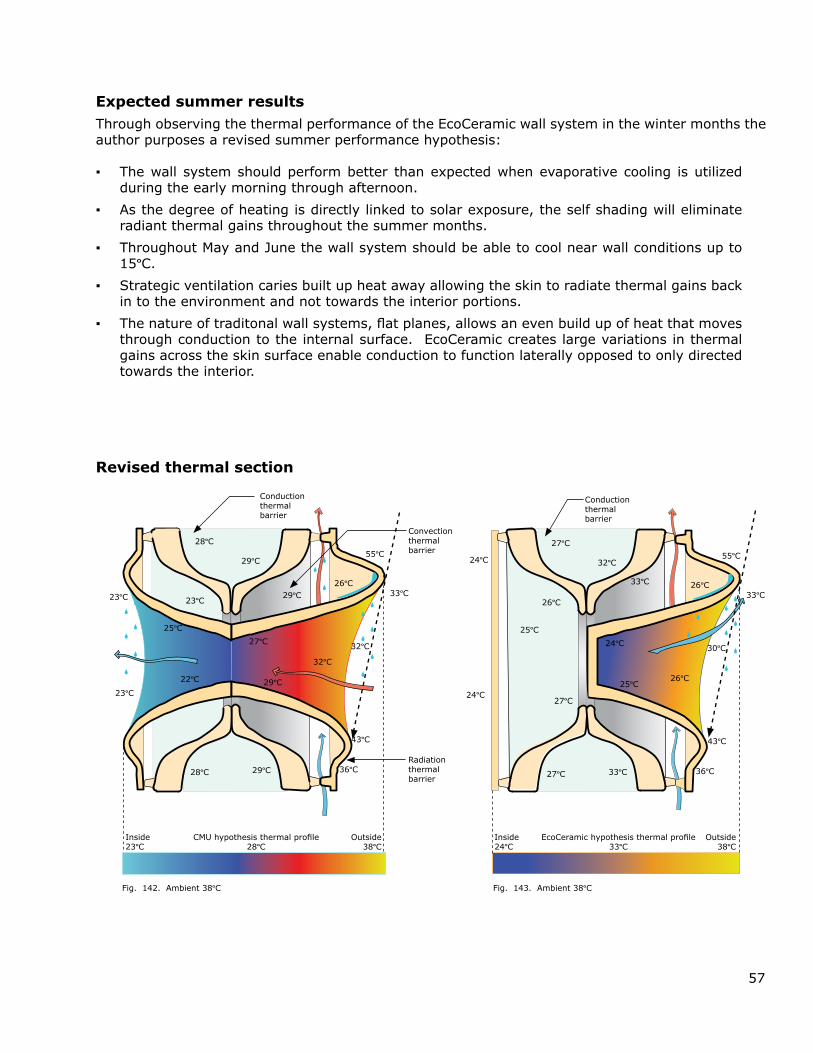
Ambient 38Fig. 142. ºC Ambient 38Fig. 143. ºC
CMU hypothesis thermal profile28ºC
Inside23ºC
Outside38ºC
EcoCeramic hypothesis thermal profile33ºC
Inside24ºC
Outside38ºC
26ºC
27ºC
32ºC24ºC
25ºC
24ºC
25ºC26ºC
36ºC
55ºC
33ºC
30ºC
24ºC27ºC
26ºC
27ºC 33ºC
33ºC
43ºC
Revised thermal section
26ºC
28ºC
29ºC
23ºC
25ºC
27ºC
29ºC
32ºC
36ºC
55ºC
33ºC
32ºC
23ºC
22ºC
23ºC
28ºC 29ºC
29ºC
43ºC
Expected summer resultsThrough observing the thermal performance of the EcoCeramic wall system in the winter months the author purposes a revised summer performance hypothesis:
The wall system should perform better than expected when evaporative cooling is utilized ▪during the early morning through afternoon.
As the degree of heating is directly linked to solar exposure, the self shading will eliminate ▪radiant thermal gains throughout the summer months.
Throughout May and June the wall system should be able to cool near wall conditions up to ▪15ºC.
Strategic ventilation caries built up heat away allowing the skin to radiate thermal gains back ▪in to the environment and not towards the interior portions.
The nature of traditonal wall systems, flat planes, allows an even build up of heat that moves ▪through conduction to the internal surface. EcoCeramic creates large variations in thermal gains across the skin surface enable conduction to function laterally opposed to only directed towards the interior.
Conduction thermal barrier
Convection thermal barrier
Radiation thermal barrier
Conduction thermal barrier
58
ApplicationsUsing existing technology, coupled with emerging fabrication techniques each production mold set cost between fifty and seventy five dollars to fabricate in materials, with the addition of time a new generation of molds could be as low as $750.00. The low cost, coupled with the fast turnaround, enables architects and designers to act intelligently. Unhindered by off the shelf products a responsive unique building skin can be fabricated uniquely for a project or climate. As seen in Koppen’s Climate map of the wold this climate hot and air encompasses much of the wold’s landmass.
Climate & PrinciplesThe climate and geographical location are the primary factors that influence these design strategies. A change in climate, and or a different geographical region would alter these design strategies. To break down the problem simply let us first assume uniform geography and changing climate conditions.
In a hot and humid climate:Increase the ventilation perpendicular ▪and parallel to wall surface to cool.
Increase shading near the wall surface. ▪
Use under fired or non-fired ceramics to ▪absorb moisture.
In a cold and arid climate:Increase in concave surface area to ▪absorb and retain heat.
Increase dark colors for solar absorption. ▪
Use surface topography to decrease ▪surface convection loss.
Select a nonporous ceramic body and fire ▪to a cone 11.
In a cold and humid climate:Implement dark colors to absorb heat. ▪
Concave surface typography to retain ▪heat.
Increase seasonal ventilation based off ▪humidity cycles.
Use under fired or non-fired ceramics to ▪absorb moisture.
Each region in the world brings with it unique geographical, cultural, and climate characteristics.
Project analysisWhile a structural module was design concurrently with the exterior unit the exterior unit does most of the thermal control. As such the designers hypothesize that one could simply apply the external unit to an existing building system or integrate it into new construction. As the immediate application of a post built process the design would alter in the length of the cone, and the perimeter of the hexagon. One could also exchange the hexagon unit for a rectangular unit that was in the same proportional language as the building.
Local post tensioning with glass fibers and epoxy is an ineffective method of joining from the standpoint of labor intensive. The author prepossess a search for alternative tension methods, such as a tape system wrapping units together, or taping the edges.
Due to the ease of rapid prototyping CMU proportions could be adapted and utilized by many in the construction industry.
Future studiesThis research was primarily focused on the ▪aspects of passive geometry controlling and directing thermal flows. Future iterations would study the desired and healthy thermal ranges and investigate if passive methods could achieve these thermal tolerances.
Variations of this research may include ▪prototyping and investigating varying forms of fabrication and formal responses to the thermal environment
Prototype a “typical” brick module based ▪off the 8 by 8 by 16 CMU with principles based off of natural Homologues and Analogues
The next step in this line of research lies ▪in active building skins. As the hornet is capable of exchanging heat for electricity and back again so could a building skin.
59
ConclusionsThe author found the following:
Radiation is the primary source of thermal gain in each 01. tested wall system.
The EcoCeramic wall system actively reduces surface 02. temperatures (through radiation) throughout the day and night.
Geometry of the object, and geometry of the surface 03. impact radiant thermal gains/losses.
Shaded vertical wall surface reduces radiant thermal 04. gains.
A wall system can be optimized for orientation and 05. climate conditions.
Passive architectural systems can temper the Sonoran 06. environmental temperatures
The strategic application of color, mason stain, coupled 07. with concave forms helps retain heat tempering the winter environmental temperature.
A wall system based on natural analogues and homologous 08. can alter environmental temperatures.
The EcoCeramic wall system was able to reduce winter ▪thermal swings when compared to the CMU wall.
Protection against thermal gains in Southern Arizona is 09. best when radiation, convection and lastly conductive thermal transfer are integrated into a wall system.
Separating the face tile from the structural unit allows 10. vertical ventilation to cool exterior surface reducing the thermal gain.
Evaporative cooling integrated into the ceramic is effective 11. at retaining a cool surface.
Use of Ecotect and similar programs can describe the 12. thermal environment.
Rapid prototyping methods are easily adapted into the 13. design of unique, computer generated ceramic molds.
Using existing production techniques allows for a rapid 14. production process.
Using earthenware clay bodies and rapid production 15. methods, production RAMpress, is an cost effective manufacturing process that is easily re-tooled for variable conditions.
Ventilation through wall cool cools interior.16.

60
Place
hol
der g
raph
ics
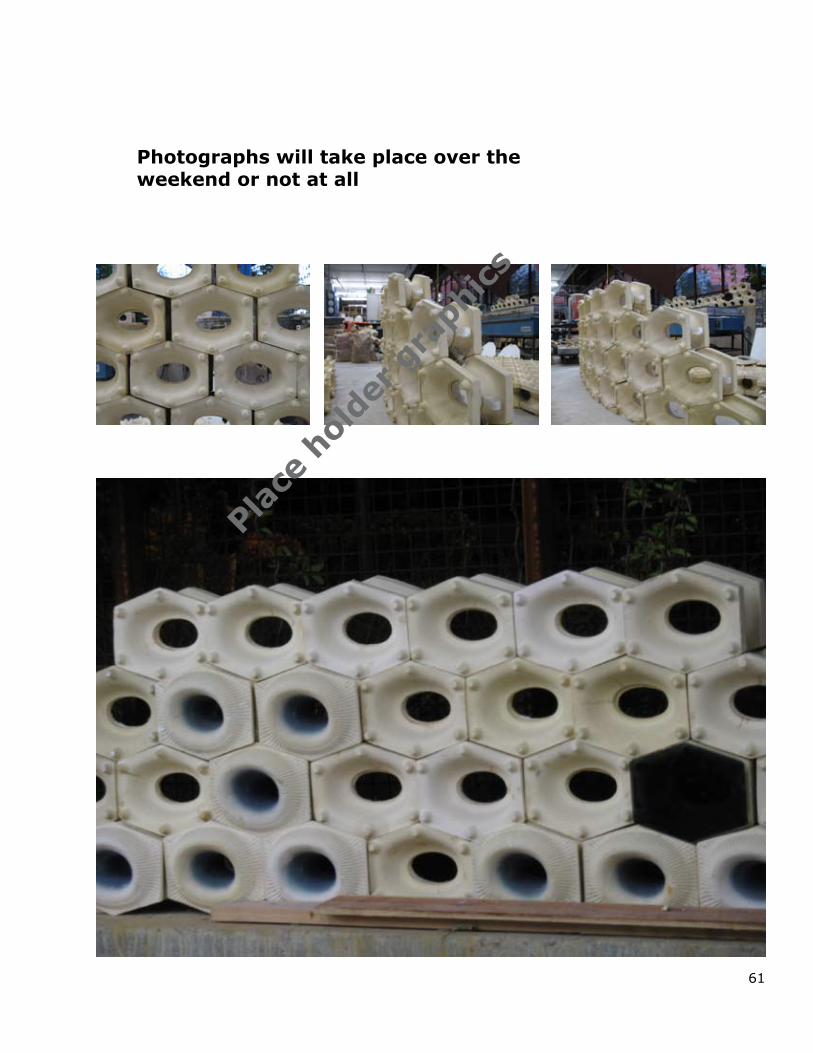
Photographs will take place over the weekend or not at all
61
Place
hol
der g
raph
ics
Photographs will take place over the weekend or not at all
62
Bibliography“Average Retail Price of Electricity to Ultimate
Customers by End-Use Sector, by State.” Energy Information Administration, www.eia.doe.gov, retrieved July 2008
Berman, A., Extending the Potential of Evaporative Cooling for Heat-Stress Relief. Journal of Dairy Science., 89, pp. 3817-3825, 2006.
Brebbia C.A. Design and Nature IV: Comparing Design in Nature with Science and Engineering. High Performance Masonry Wall systems: principles derived from natural analogue, by Jed Laver and others. UK: Wessex Institute of Technology, 2008.
“Comparative Climatic Data;” U.S., National Climatic Data Center, NOAA, 2001. www.ncdc.noaa.gov/oa/climate, Accessed September 2008.
Conrad, John W. Studio Ceramic Dictionary. San Diego: Falcon Company, Publishers, 1990.
Dieste, Eladio, Innovation in Structural Art. New York: Princeton Architectural Press, 2004.
Gibbs JG, DT Patten. “Plant temperatures and heat flux in a Sonoran desert Ecosystem”. Oecologia., 5, pp. 65-84, 1970.
Heinrich, B, and American Society of Zoologists. Insect thermoregulation. New York: Wiley, 1981.
Ishay, Jacob S., Sverdlov, Anna, Pertsis, Vitaly, Gavrilov, Yulia, & Steinberg, David,. “Light Modulates Electric Phenomena in Hornet Cuticle.” Photochemistry and Photobiology, 2004, 80: pg. 115–118.
Ishay, Jacob S., Goldstein, Orna., Rosenzweig, Eyal., Kalicharan, Dharamdajal., and Jongebloed, Willem L. “Hornets Yellow Cuticle Microstructure: A Photovoltaic System.” Physiological Chemistry and Physics and Medical NMR. v 29. 1997. pg. 71-93.
Korb, J. “Thermoregulation and ventilation of termite mounds.” Naturwissenschaften, 90(5), pp. 212-19, 2003.
Korb, J., and Linsenmair, K. E. “The effects of temperature on the architecture and distribution of Macrotermes bellicosus (Isoptera, Macrotermitinae) mounds in different habitats of a West African Guinea savanna,.” Insectes Sociaux, 45, pp. 51-65, 1998.
Korb, J., and Linsenmair, K. E. “Ventilation of termite mounds: new results require a new model.” Behavior Ecology, 11(5), pp. 486-94, 2000.
Korb, J., and Linsenmair, K. E. “Thermoregulation of termite mounds: what role does ambient tempera¬ture and metabolism of the colony play?” Insectes Sociaux 47(4), pp. 357-63, 2000.
Korb, J., and Linsenmair, K. E. “Ventilation of termite mounds: new results require a new model.” Behavior Ecology 11(5), pp. 486-94, 2000.
Comparative Climatic Data; U.S., National Climatic Data Center, NOAA, 2001. www.ncdc.noaa.gov/oa/climate Accessed July 2008.
Lewis, D. A., & Nobel, P. S. “Thermal energy exchange model and water loss of a barrel cactus, ferocactus acanthodes.” Plant Physiology., (60), pp. 609-16, 1977.
Laugier, Marc-Antoine. Essai sur l’architecture: Essays on Architecture. Translated by and Anni Herrmann. Los Angeles: Hennessey & Ingalls, 1977. 305pp
Malcolm Jr. Jones., History of Air Conditioning. Air Conditioning. Newsweek. Winter 1997 v130 n24-A p42(2). Retrieved February 2008. Accessed July 2008.
Moffett, Marian. A World History of Architecture. Boston: McGraw-Hill Companies, 4. Pgs. 431-2, 448-9
Nobel P. S., “Water relations and photosynthesis of a barrel cactus, ferocactus acanthodes, in the Colo¬rado Desert.” Oecologia., 27, pp. 117-33, 1977.
O’Gorman, James F. The Architecture of Frank Furness. Philadelphia: The Falcon Press, 1973.
Olgyay, Victor., Design with Climate: Bioclimatic approach to architectural regionalism. New Jersy: Princeton University Press, 1973.
63
Parmer, Cole “Emissivity of Specific Materials; U.S.” Chicago IL. www.coleparmer.com, Accessed September 2007.
“Potassium feldspar.” Encyclopædia Britannica. 2008. Encyclopædia Britannica Online. www.britannica.com Retrieved 01 Sep. 2008.
“Residential Energy Consumption Survey 2001” Department of Energy, www.eia.doe.gov/emeu/recs retrieved on October 20th 2008
Seeley, T., & Heinrich, B. “Regulation of temperature in the nests of social insects.” Journal of Compara¬tive Physiology A: Neuroethology, Sensory, Neural & Behavioral Physiology., 193(11) 159, 1981.
Skaife, S.H. African insect life. London: Country life books, 1979.
Smith, Stanley D., & Didden-Zopfy, Brigitte, & Nobel, Park S. “High-temperature responses of North Ameri¬can cacti.” Ecology., 65(2) pp. 643-51, 1984.
Solomon, N.B., “New Building systems Mimic Nature and return to a biocentric approach to design.” Architectural Record, 190(9) pp 173, 2002.
“Southern Arizona Temperature and Precipitation.” Arid Land Institute. University of Arizona
Sullivan, H. Louis,. Autobiography of an Idea. New York: American Institute of Architects, 1949. pg 188-97.
Tsui, E., Evolutionary architecture. Natures as a basis for design, New York: John wiley & Sons, 1999.
“Tucson Arizona Historic Temperatures.” National Oceanic Atmospheric Administration, www.nws.noaa.gov, retrieved April 2007.
Vitruvius, Marcus., The Ten Books on Architecture. Translated by Morris Hicky Morgan. New York: Dover Publications INC., 1960.
Watson, AN. “Preliminary study of the relation between thermal emissivity and plant temperatures.” Ohio Journal Science., 33, pp. 435-50, 1933.
Wright, Frank Lloyd. The Essential Frank Lloyd Wright: Critical Writings on Architecture. Canada: Princeton University Press, 2008.
64
Glossary1 law of Thermodynamics Conservation of energy; the change in the internal energy of a closed thermodynamic
system is equal to the sum of the amount of heat energy supplied to the system and the work done on the system.
2 law of Thermodynamics Entropy; the total entropy of any isolated thermodynamic system tends to increase over
time, approaching a maximum value.Annealing point: Also known as the tempering point, the point at which the internal strains in the glass are
eliminated by stabilizing the material over a period of time, 480-425ºC (900-800ºF.)ASTM: Clay body porosity: Weigh dry fired clay unit in grams then submerge fired unit in boiling water, for one hour and
let the unit sit for 8 hours. Then perform second measurement of unit weight. Porosity is calculated using the following equation: (Weight dry / weight saturated) *100 = Porosity
ASTM: compression: These tests should be conducted using the Instron 3369. Each sample should be exactly the same size, 1” by 1” diameter cylinders.
ASTM: Shrinkage: Use a mold and press uniform blocks of clay, scribe a 10 cm line in the surface, and allow the clay to fully dry. Length un-fired - Length fired = Shrinkage
ASTM: tension: Also known as three point bending, these tests are conducted using the Instron 3369 using the same sample size.
ASTM: Testing Environmental thermal exchange: Use half of the guarded hot box, ASTM C1363, and expose the wall section to the
environment. To offset the loss of variables of environmental exposure the test must occur over a three day period.
ASTM: Wick rate: Time how long it takes the ceramic to absorb a single drop of moisture on the surface: Time initial - Time final=Wick rate
Clay Batt: The clay from which the unit is pressed. The batt must have sufficient excess to form the unit and the pinch points.
Conduction The most significant means of heat transfer in a solid. On a microscopic scale, conduction occurs as hot, rapidly moving atoms and molecules interact, transferring some of their energy (heat) to these neighboring atoms.
Thermoelectricity The relationship between electrons, heat fluxes and electrical currents generating electricity through a material thermal difference.
Convection Generally the dominant form of heat transfer in liquids and gases (air). Die casing: The metal frame enclosing the plaster body of each die member. Die casings may be any
shape or cast and can be welded or bolted together. Diversification: The formation of crystalline structure in glass (cloudy glass) caused by holding the glass
at long and high temperatures. It can be avoided by cooling faster. Excess clay: That portion of the initial clay batt over and above the actual amount required to fill the
ware forming cavity and form the pressed piece. Fire polishing A thermal polish to the surface of glass occurring at approximately 675ºFFlash: The portion of clay batt outside of the ware forming cavity after pressing.Glass molds: Typically plaster or ceramic mold that forms a cavity for the glass.Initial heating: The initial and rapid warming of the kiln achieving the soak temperature. The temperature
must be higher than the strain point.

65
Kiln drying: Rapid drying of a mold inside the kiln. Most benefit arises when drying is added to the kiln schedule.
Gutters: The slope away from the pinch pointLiquidus Point at which a material is moves from solid to liquidMaster Die: The original die produced, by which all subsequent RAM die molds are made from requiring
both a male and female member. Parting line: A line on the plaster model determined by the modeler which separates the die into male
and female members.Permeability: The portion of plaster which permits the flow of air through the plaster die to release ware
from the face.Pinch point: The raised portions of the gutter area which act to restrict the flow of clay from the ware
forming area. Purging: The term used to describe the treatment given plaster dies shortly after they are cast,
whereby all excess water and solvable ingredients harmful to the permeability are expelled from the plaster dies by air pressure.
Quartz inversion: A thermal range that quartz inverts, expanding 2 percent and then contracts 2 percent. To avoid cracking, this cool down stage (575-600ºC) should be moved through very slowly.
R value The inverse of U. R value is measured in watts per meter squared in degrees kelvin. W/ (m² K)
Radiation The only form of heat transfer that can occur in the absence of a medium; thus, it is the only means of heat transfer through a vacuum.
RAM die: Two pressing elements. Each die is composed of two members: a male member and a female member. Each of these members consists of a plaster body with a metal die casing formed under air pressure.
Rapid cooling: The initial cool down from the working temperatures to the quartz inversion range. Slip joining Union of two non-fired ceramic pieces through the application of wet slip and pressing the
pieces together.Soak: A temperature hold that allows the glass to settle reducing the amount of air entrapment.Softening point: The temperature at which the glass quickly and visibly distorts under its own weight.Sprew Device for pouring glass through mold into negative cavityStrain point: From 800-500oF the glass passes through the strain point. Bellow 500oF the glass has
no stress. You don’t really define what it isThermal shock: Caused by rapid change of temperature in a short time period.Ware releasing unit: A permeable tubing which follows the contour of and just beneath the die face which allows
the admittance of air to the die face.Ware forming cavity: A cavity between the two opposing die members contoured for the formation of pressed
ware.Working temperatures: The thermal range at which glass begins to flow. Glass is a correlation between time and
temperature; increase either and the glass will become more fluid.U value Measures the rate of heat transfer through a building element over a given area, under
standardized conditions, 24 °C, at 50% humidity with no wind.
66
Material glossaryCERAMI-CAL® A low-consistency form of HYDROCAL Gypsum Cement formulated to produce a dense,
smooth-wearing die material for pressing clay-ware; 100 parts dry to 40 parts wet.Diatomaceous Earth A strengthening agentEdgar plastic kaolin (EPK): : Release agent mixed in small amounts into a plaster mold.Graphite powder: An additive to squeegee oil as the primary release agent in fusing and annealing glass.HYDROCAL®: A gypsum product offering higher strengths than typical plaster products. HYDROCAL® is
especially designed for thin sections, which require high green (early) strength to minimize breakage during removal from intricate latex molds. Dry strength 5,000 psi, dry impact strength 1,750 psi; 100 parts dry to 38 parts wet
HYDROPERM: Gypsum Cement used to produce permeable plaster molds for casting of many non-ferrous metals and alloys; 100 parts dry to 70 parts wet
HYDRO-STONE® : One of the hardest and strongest of all gypsum products, it is recommended for producing high-quality novelty and statuary castings requiring extremely hard surfaces. Dry strength 10,000 psi, dry impact strength 1,320 psi; 100 parts dry to 32 parts wet
Kiln wash: A water soluble release agent, applied in multiple coats to create a smooth, easy to release surface even at temperatures up to 1095 ºC
Medium Density Fiberboard (MDF): A composite wood product similar to particleboard made from wood waste fibers glued
together with resin, heat, and pressure MolDuct Ties: Used to attach the Molduct tubing to wire frameMolDuct Tubing: Special woven cotton tubing used in pressing dies for air passageways. Air, forced through
the tubing, forces the release of the pressed piece from the diesPottery plaster: USG® Pottery Plaster is industry-wide known for working reliability, productivity and
highly successful results. USG® Pottery Plaster is for all types of ceramic slip casting applications. Dry Strength - 2,400 psi; 100 parts dry to 70 parts wet.
Squeegee oil: Release agent; squeegee or pine oil mixed with graphite powder works well for fusing and annealing but does not perform at temperatures greater than 900oF. The graphite powder should be suspended in the solution.
ULTRACAL: Super-strength gypsum product recommended where extreme accuracy and greater surface hardness are required, as in duplicator models. ULTRACAL 30 has the lowest expansion of any rapid-setting gypsum cement available. Dry Strength - 6,000; 100 parts dry to 45 parts wet
wire mesh: Used to hold the Molduct off the mold

67
68
Figure list
Figure # pg
1.-2. Maps reproduced from USGS maps
13
3. Data from Arid Lands Institute: University of Arizona
14
4.-5. Image from Flicker.com 14
6.-7. Data from Department of Energy
15
8.-12. Photograph by author 18
13.-14. Image from Flicker.com 19
15.-16. Data from Korb J., and Linsenmair, K. E.
19
17.-19. Illustrations by author 19
20.-24. Photographs by author 20
25.-30. Photographs by author 21
31. Photograph by author 24
32. Photograph by Kelly Winn 27
33.-34 Illustrations by author 23
35-37. Photographs by Kelly Winn for EcoCeramic Research
27
38. Photograph by author for EcoCeramic Research
28
39.-42. Photographs by author for EcoCeramic Research
29
43. Original Diagram by Kelly Winn, edited by author for EcoCeramic Research
30
44.-46. Photographs by author for EcoCeramic Research
30
47. Photograph by author for EcoCeramic Research
31
48.-49. Photographs by Kelly Winn for EcoCeramic Research
31
50.-59 . Photographs by author for EcoCeramic Research
32
60.-64. Illustrations by author for EcoCeramic Research
33
65.-75. Photographs by author for EcoCeramic Research
34
76. Illustration by Kelly Winn for EcoCeramic Research
35
77.-78. Illustration by author for EcoCeramic Research in colaboration with Kelly Winn.
35
79.-82. Photographs by Kelly Winn Courtesy of Catalina China Inc
36
83.-84. Photographs by Author Courtesy of Catalina China Inc
36
85..-87. Photographs by Kelly Winn Courtesy of Catalina China Inc.
36
88. Illustration by Kelly Winn for EcoCeramic Research
37
89.-90. Photographs by author for EcoCeramic Research
38
91.-99. Photographs by Kelly Winn for EcoCeramic Research
38
100. Drawing by author for EcoCeramic Research
39
101. Photograph by Kelly Winnfor or EcoCeramic Research
39
102.-03. Photograph by Kelly Winn 40
104.-06. Photograph by Kelly Winn, edited by author.
40
107. Photograph by Kelly Winn 41
108.-09. Photograph by author 41
110. Photograph by Kelly Winn 42
111. Model by Kelly Winn, for EcoCeramic Research photograph and editing by author
42
112. Illustration by author for EcoCeramic Research
43
113.-14. Illustration by Kelly Winn for EcoCeramic Research
43
115. Illustration by Kelly Winn for EcoCeramic Research
46
116.-17. Illustration by author, for EcoCeramic Research in collaboration with Kelly Winn
47
118. Illustration by Kelly Winn for EcoCeramic Research in collaboration with author
48

69
119. Illustration by author for EcoCeramic Research in collaboration with Kelly Winn
50
120-21. Illustrations by author 51
122. Photograph by author 52
123-25. Illustrations by author 53
126.-30. Photographs by author 54
131.-33. Photographs by author 55
134.-35. Photograph by author 56
137.-38. Illustrations by author 57
139.-40. Illustrations by author 58
134. Photograph by author 68
135. Image from Seeley
136. Image from Ishay 70
137.-38 Photographs by author 70
139.-40. Images from Olgyay, p 16. 71
141. Image from Laugier 72
142.-43. Photographs by author 72
144. Image from Solomon 73
145. Image from Dieste 73
146.-47. Images from Serra 73
148.-49. Photographs by author, use courtesy of Christopher Domin research archive of Frank Lloyd Write’s work
73
150.-51. Illustrations by author 77
152. Data collected from Ortan firing standards
78
153. Data collected by author for the EcoCeramic Research
79
154. Data collected by author for the EcoCeramic Research
80
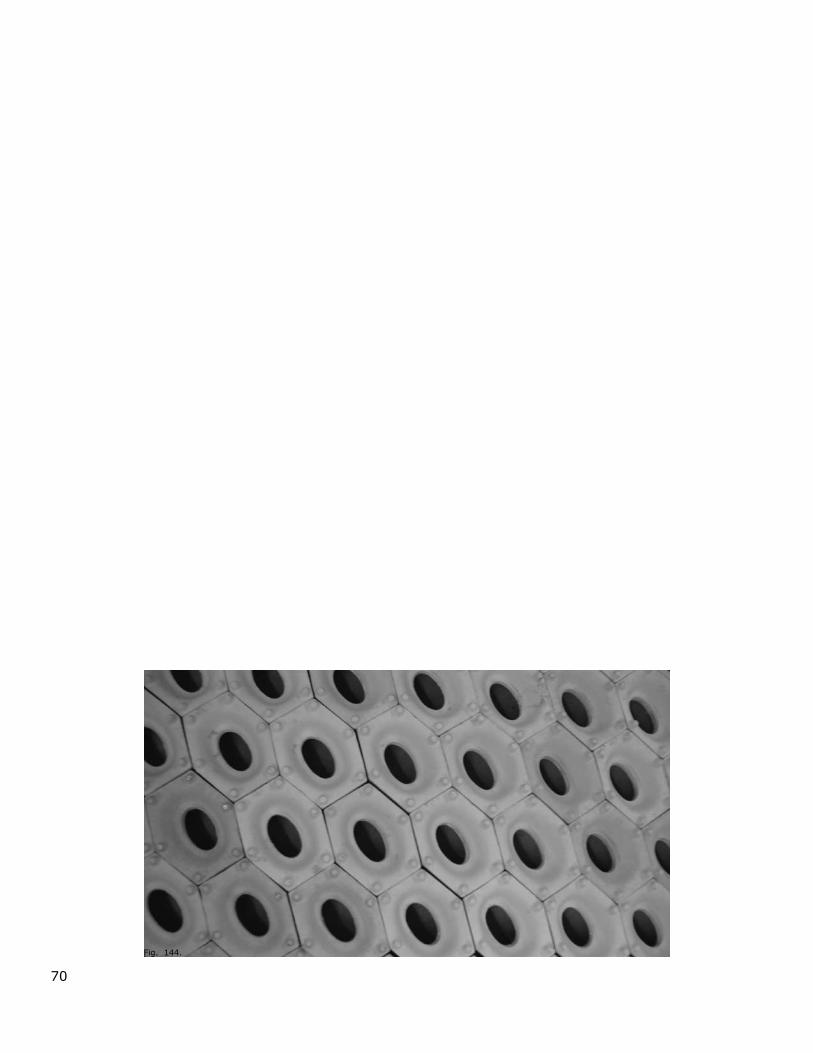
70
Fig. 144.
71
AppendicesBibliography 61.1. 4Hornets and Hive Structure 61.2. 6Homo Sapiens 61.3. 7Architectural case studies 61.4. 8Glossary 71.5. 0Material glossary 71.6. 2Appendix A 71.7. 3Appendix B 71.8. 7Appendix C 71.9. 8

72
Appendix A
Hornets and Hive StructureHornets were investigated through a literature review due to their unique ability to survive in nearly any climate while maintaining a constant body and hive temperature year around. The hive was looked at due to the packing efficiency of the hexagon unit, and the relationship between the hornet and the hive.
The researcher observed that The gaster contains type p and type n semiconductors ▪carrying a constant electric charge throughout the hornet.
Several hornet species are capable of exchanging built ▪up electric charge to a thermal response.
The hornet could move between heat and electricity ▪generation as needed.
The silk in the hornets nest provides storage for electrical ▪and thermal energy and is capable of transferring heat to electricity and visa versa.
The gaster due to the material can only absorb light 90º ▪
The hornet’s system acts as a battery, storing electricity ▪and converting it to heat, or when too hot converting heat to electricity, the system can generate between 20-40ºC.
The hexagon packing is the most energy efficient packing ▪structure.
The hive is capable of tempering environmental ▪temperatures and storing electricity.
Sources: Heinrich, Ishay, seeley
Applying these findings to architecture, the following possibilities emerge
Wall systems could exchange heat into electricity, and ▪back again.
A light weight structural skin could eliminate the need for ▪conventual insulation.
A wall systems could perform as a storage of both heat ▪and power for the occupants.
63 9
Time (h)
32302826242220
Tem
pera
ture
[°C
]
12 1815 21 24
Hornet Nests
343638
18
Air temperature in shade 2 cm above surface
Temperature in nest
Hornet comb (Seeley)Fig. 145.
gaster
Hornet temperature swings (Ishay)Fig. 146.
Bee’s honey combFig. 147.
P-N Junction causes continual flow of electricityFig. 148.

73
Homo Sapiens Humans are investigated for the stringent thermal conditions for optimal performance. The second reason is human comfort. What is comfort, how is it achieved, is it constant or dependent on exterior factors?
The researcher observed thatHumans use radiation for sixty percent of their thermal ▪exchange. Convection accounts for twenty five percent and conduction for fifteen percent.
Blood vessels regulate thermal flow to extremities, ▪stabilizing the core by nearly 600 percent contraction and expansion.
Secretion of sweat and hair regulate conduction and ▪convection.
Comfort often depends on climate, with direct and ▪indirect radiation the largest contributors to the sensation of comfort.
No single method is sufficient to optimize comfort levels ▪to modern standards.
Comfort levels depend on the individual and location but ▪generally range from 23-30ºC.
Sources: Berman, Olgyay ▪
Applying these findings to architecture, the following strategies emerge
Controlling and directing radiation is paramount to ▪personal comfort.
Utilization of shade to diffuse direct solar radiation ▪tempers the highest solar thermal gains.
A peripheral ventilation system capable of expansion and ▪contraction could mitigate convection thermal gain and loss.
Conduction should be considered as the last line of ▪defence in the building skin.
Earth’s Surface
Heat transported by
Short wave radiationMolecular thermal conduction
Convection
Evaporation
Absorption
Radiative pseudo conduction
Thermal conduction
Layer close to the surface
Long wave radiation
Reflection From ground
Reflection from sky
Solar radiation
Scattering
Reflection fromClouds
(Oglay)Fig. 149.
Thermal flux around humans (Oglay)Fig. 150.
Conduction
Convection
Radiation

74
Architectural case studies
Primitive HutShelter architecture, found in nature, is the most basic form of construction. The front piece to Marc-Antoine Laugier’s Essays on Architecture brought this architectural theory back into mainstream in 1755 AD. When Laugier referred to simplicity in architecture, he meant “the inherent quality of nature” (Laugier).
Marcus Vitruvius also wrote, “ All machinery is derived from nature... when our ancestors had seen that this was so, they took their models from nature, and by imitating them were led on by divine facts, until they perfected the contrivances which are serviceable to our life” (Vitruvius).
The primitive hut is the result of mankind’s desire to have shelter from heat, protection from rain, and avoiding dark subterranean locations. It is the basic relationship between man and the environment. In this way, architecture has roots in imitating nature for shelter.
Vitruvius further, delineated of the relationship between ornamentation, proportion and nature. Doric columns were derived from the foot print of a man, height and breast of a man, while Ionic columns were derived similarly from a woman’s body; the capitol of the Corinthian order came from the acanthus plant (Vitruvius). In Greek and Roman times, architecture was no longer simply about the imitation of nature, but proportionality and ornamentation found in nature.
Primitive Hut (photo from essays on Fig. 151. architecture
Corinthian column, Saint John’s Basilica Fig. 152. Rome
Antoio GaudiAntoio Gaudi re-examined the classical notions of proportion in nature and added the layer of structure. The column structure in his Sagrada Família imitates tree branching, while each column is buttressed like a tree trunk to optimize its strength. Gaudi also developed the parabolic arch in architecture, a system found everywhere in nature.
Sagrada FamíliaFig. 153.
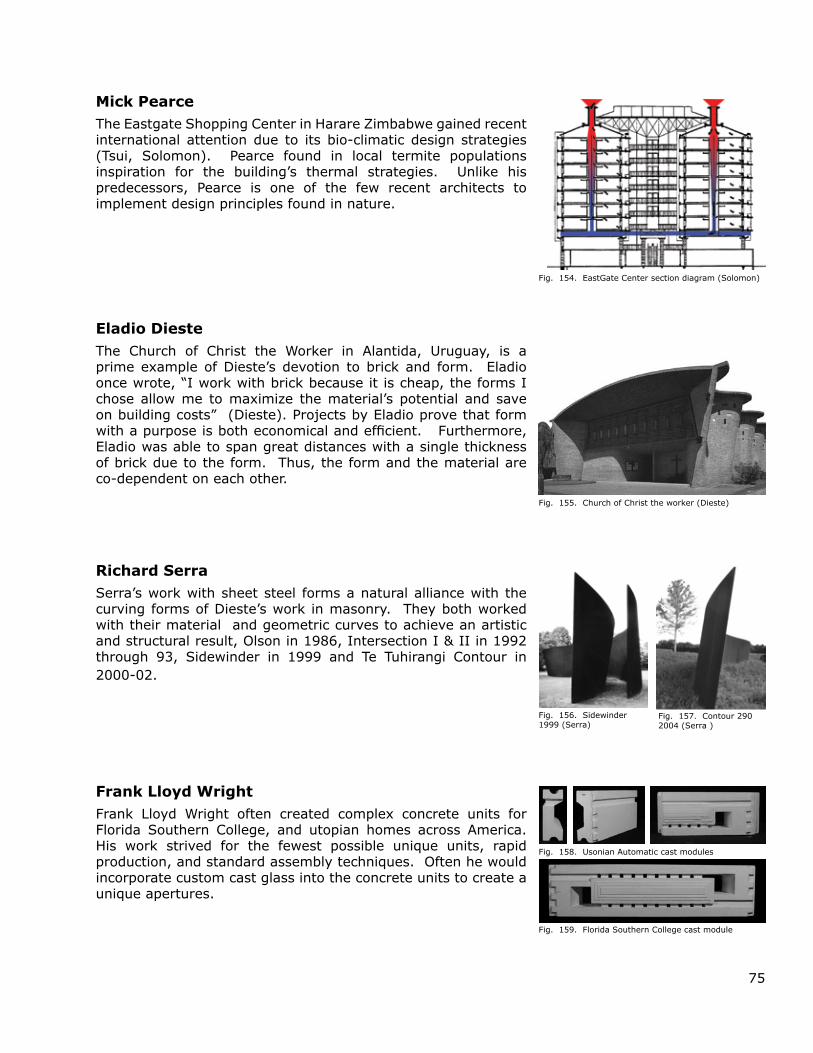
75
Mick PearceThe Eastgate Shopping Center in Harare Zimbabwe gained recent international attention due to its bio-climatic design strategies (Tsui, Solomon). Pearce found in local termite populations inspiration for the building’s thermal strategies. Unlike his predecessors, Pearce is one of the few recent architects to implement design principles found in nature.
Eladio DiesteThe Church of Christ the Worker in Alantida, Uruguay, is a prime example of Dieste’s devotion to brick and form. Eladio once wrote, “I work with brick because it is cheap, the forms I chose allow me to maximize the material’s potential and save on building costs” (Dieste). Projects by Eladio prove that form with a purpose is both economical and efficient. Furthermore, Eladio was able to span great distances with a single thickness of brick due to the form. Thus, the form and the material are co-dependent on each other.
Richard SerraSerra’s work with sheet steel forms a natural alliance with the curving forms of Dieste’s work in masonry. They both worked with their material and geometric curves to achieve an artistic and structural result, Olson in 1986, Intersection I & II in 1992 through 93, Sidewinder in 1999 and Te Tuhirangi Contour in 2000-02.
Frank Lloyd WrightFrank Lloyd Wright often created complex concrete units for Florida Southern College, and utopian homes across America. His work strived for the fewest possible unique units, rapid production, and standard assembly techniques. Often he would incorporate custom cast glass into the concrete units to create a unique apertures.
EastGate Center section diagram (Solomon)Fig. 154.
Church of Christ the worker (Dieste)Fig. 155.
Sidewinder Fig. 156. 1999 (Serra)
Contour 290 Fig. 157. 2004 (Serra )
Usonian Automatic cast modulesFig. 158.
Florida Southern College cast moduleFig. 159.
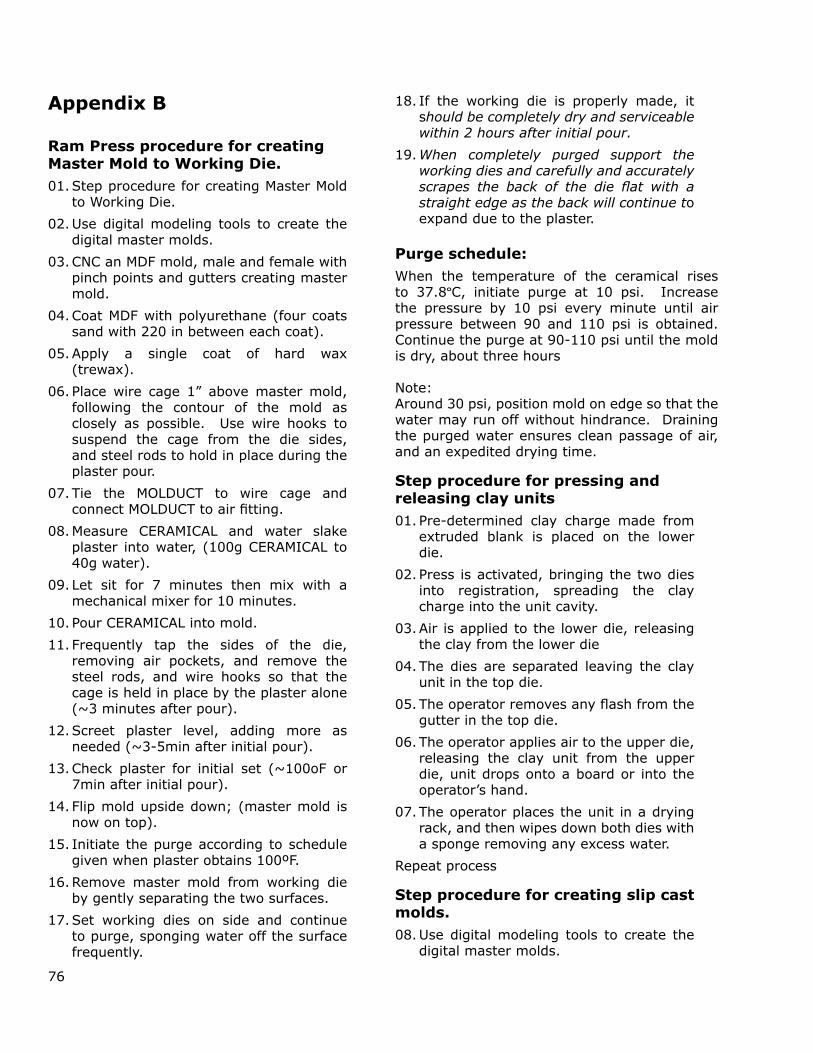
76
Appendix B
Ram Press procedure for creating Master Mold to Working Die.
Step procedure for creating Master Mold 01. to Working Die.
Use digital modeling tools to create the 02. digital master molds.
CNC an MDF mold, male and female with 03. pinch points and gutters creating master mold.
Coat MDF with polyurethane (four coats 04. sand with 220 in between each coat).
Apply a single coat of hard wax 05. (trewax).
Place wire cage 1” above master mold, 06. following the contour of the mold as closely as possible. Use wire hooks to suspend the cage from the die sides, and steel rods to hold in place during the plaster pour.
Tie the MOLDUCT to wire cage and 07. connect MOLDUCT to air fitting.
Measure CERAMICAL and water slake 08. plaster into water, (100g CERAMICAL to 40g water).
Let sit for 7 minutes then mix with a 09. mechanical mixer for 10 minutes.
Pour CERAMICAL into mold.10.
Frequently tap the sides of the die, 11. removing air pockets, and remove the steel rods, and wire hooks so that the cage is held in place by the plaster alone (~3 minutes after pour).
Screet plaster level, adding more as 12. needed (~3-5min after initial pour).
Check plaster for initial set (~100oF or 13. 7min after initial pour).
Flip mold upside down; (master mold is 14. now on top).
Initiate the purge according to schedule 15. given when plaster obtains 100ºF.
Remove master mold from working die 16. by gently separating the two surfaces.
Set working dies on side and continue 17. to purge, sponging water off the surface frequently.
If the working die is properly made, it 18. should be completely dry and serviceable within 2 hours after initial pour.
When completely purged support the 19. working dies and carefully and accurately scrapes the back of the die flat with a straight edge as the back will continue to expand due to the plaster.
Purge schedule: When the temperature of the ceramical rises to 37.8ºC, initiate purge at 10 psi. Increase the pressure by 10 psi every minute until air pressure between 90 and 110 psi is obtained. Continue the purge at 90-110 psi until the mold is dry, about three hours
Note: Around 30 psi, position mold on edge so that the water may run off without hindrance. Draining the purged water ensures clean passage of air, and an expedited drying time.
Step procedure for pressing and releasing clay units
Pre-determined clay charge made from 01. extruded blank is placed on the lower die.
Press is activated, bringing the two dies 02. into registration, spreading the clay charge into the unit cavity.
Air is applied to the lower die, releasing 03. the clay from the lower die
The dies are separated leaving the clay 04. unit in the top die.
The operator removes any flash from the 05. gutter in the top die.
The operator applies air to the upper die, 06. releasing the clay unit from the upper die, unit drops onto a board or into the operator’s hand.
The operator places the unit in a drying 07. rack, and then wipes down both dies with a sponge removing any excess water.
Repeat process
Step procedure for creating slip cast molds.
Use digital modeling tools to create the 08. digital master molds.

77
CNC the mold into MDF.09.
Coat the MDF master mold with 4 coats 10. of polyurethane sanding in between each coat.
Wax mold using a hard wax, release 11. agent.
Construct a box around the mold fully 12. enclosing the master mold (also coated with polyurethane).
Measure 4 parts pottery plaster to 3 13. parts water.
Slake plaster into the water, let sit for 4 14. minutes.
Mix the plaster and water using a 15. rotary mixer for 4-6 minutes depending on environmental temperature. (Hot environments require a decreased mixing time).
Pour plaster into mold, tamping the air 16. bubbles out.
After 5-24 hours (depending on the 17. geometry), remove the master mold.
Let the plaster dry for 3-4 days before 18. moving to next step.
Step procedure for casting with slip cast
If using a two part mold, fasten both 01. parts together with tie down cables.
Check that the mold has sufficient 02. ventilation for pouring slip.
Fill mold cavity with slip and let sit for 03. 20-30 minutes (actual time is dependent on plaster thickness and surface area to be covered).
Flip mold upside down and drain excess 04. slip out..
Leave mold upside down for 24 hours05.
Remove ceramic unit from mold.06.
Clean mold and re-apply release agent. 07.
Repeat process.08.
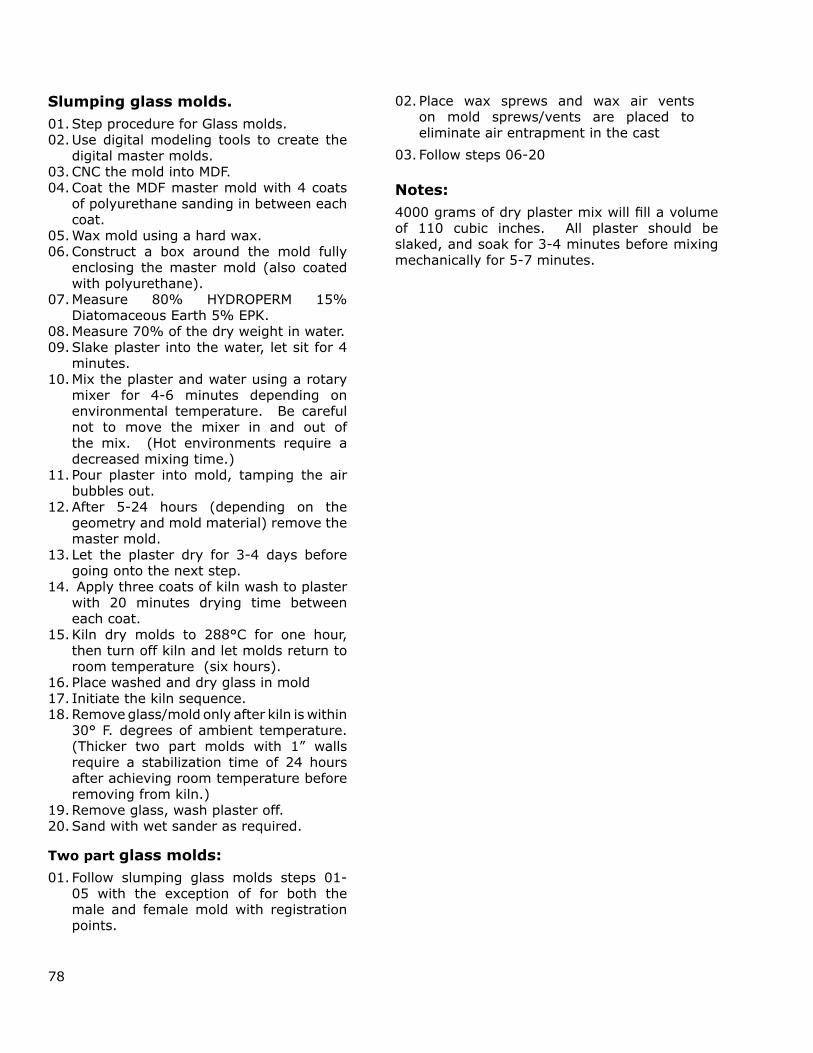
78
Slumping glass molds.Step procedure for Glass molds.01. Use digital modeling tools to create the 02. digital master molds.CNC the mold into MDF.03. Coat the MDF master mold with 4 coats 04. of polyurethane sanding in between each coat.Wax mold using a hard wax. 05. Construct a box around the mold fully 06. enclosing the master mold (also coated with polyurethane).Measure 80% HYDROPERM 15% 07. Diatomaceous Earth 5% EPK.Measure 70% of the dry weight in water.08. Slake plaster into the water, let sit for 4 09. minutes.Mix the plaster and water using a rotary 10. mixer for 4-6 minutes depending on environmental temperature. Be careful not to move the mixer in and out of the mix. (Hot environments require a decreased mixing time.)Pour plaster into mold, tamping the air 11. bubbles out.After 5-24 hours (depending on the 12. geometry and mold material) remove the master mold.Let the plaster dry for 3-4 days before 13. going onto the next step. Apply three coats of kiln wash to plaster 14. with 20 minutes drying time between each coat.Kiln dry molds to 288°C for one hour, 15. then turn off kiln and let molds return to room temperature (six hours).Place washed and dry glass in mold16. Initiate the kiln sequence.17. Remove glass/mold only after kiln is within 18. 30° F. degrees of ambient temperature. (Thicker two part molds with 1” walls require a stabilization time of 24 hours after achieving room temperature before removing from kiln.)Remove glass, wash plaster off.19. Sand with wet sander as required.20.
Two part glass molds:Follow slumping glass molds steps 01-01. 05 with the exception of for both the male and female mold with registration points.
Place wax sprews and wax air vents 02. on mold sprews/vents are placed to eliminate air entrapment in the cast
Follow steps 06-2003.
Notes:4000 grams of dry plaster mix will fill a volume of 110 cubic inches. All plaster should be slaked, and soak for 3-4 minutes before mixing mechanically for 5-7 minutes.
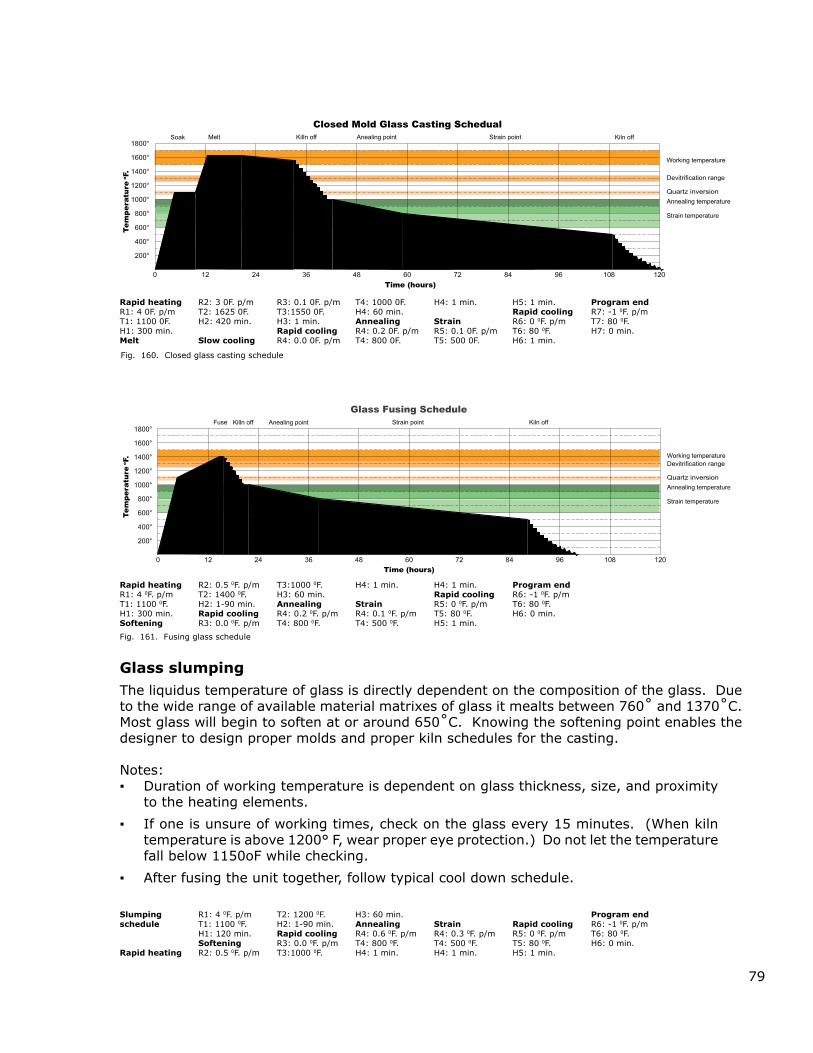
79
Working temperatureDevitrification range
Quartz inversion Annealing temperature
Strain temperature
Fuse Killn off Anealing point Strain point Kiln off
Glass Fusing Schedule
Time (hours)
Tem
pera
ture
oF.
Rapid heatingR1: 4 0F. p/mT1: 1100 0F.H1: 300 min.Softening
R2: 0.5 0F. p/mT2: 1400 0F.H2: 1-90 min.Rapid coolingR3: 0.0 0F. p/m
T3:1000 0F.H3: 60 min.AnnealingR4: 0.2 0F. p/mT4: 800 0F.
H4: 1 min.
StrainR4: 0.1 0F. p/mT4: 500 0F.
H4: 1 min.Rapid coolingR5: 0 0F. p/mT5: 80 0F.H5: 1 min.
Program endR6: -1 0F. p/mT6: 80 0F.H6: 0 min.
Working temperature
Devitrification range
Quartz inversion Annealing temperature
Strain temperature
Soak Melt Killn off Anealing point Strain point Kiln off
Time (hours)
Tem
pera
ture
oF.
Closed Mold Glass Casting Schedual
Rapid heatingR1: 4 0F. p/mT1: 1100 0F.H1: 300 min.Melt
R2: 3 0F. p/mT2: 1625 0F.H2: 420 min.
Slow cooling
R3: 0.1 0F. p/mT3:1550 0F.H3: 1 min.Rapid coolingR4: 0.0 0F. p/m
T4: 1000 0F.H4: 60 min.AnnealingR4: 0.2 0F. p/mT4: 800 0F.
H4: 1 min.
StrainR5: 0.1 0F. p/mT5: 500 0F.
H5: 1 min.Rapid coolingR6: 0 0F. p/mT6: 80 0F.H6: 1 min.
Program endR7: -1 0F. p/mT7: 80 0F.H7: 0 min.
Glass slumpingThe liquidus temperature of glass is directly dependent on the composition of the glass. Due to the wide range of available material matrixes of glass it mealts between 760˚ and 1370˚C. Most glass will begin to soften at or around 650˚C. Knowing the softening point enables the designer to design proper molds and proper kiln schedules for the casting.
Notes:Duration of working temperature is dependent on glass thickness, size, and proximity ▪to the heating elements.
If one is unsure of working times, check on the glass every 15 minutes. (When kiln ▪temperature is above 1200° F, wear proper eye protection.) Do not let the temperature fall below 1150oF while checking.
After fusing the unit together, follow typical cool down schedule. ▪
Slumping schedule
Rapid heating
R1: 4 0F. p/mT1: 1100 0F.H1: 120 min.SofteningR2: 0.5 0F. p/m
T2: 1200 0F.H2: 1-90 min.Rapid coolingR3: 0.0 0F. p/mT3:1000 0F.
H3: 60 min.AnnealingR4: 0.6 0F. p/mT4: 800 0F.H4: 1 min.
StrainR4: 0.3 0F. p/mT4: 500 0F.H4: 1 min.
Rapid coolingR5: 0 0F. p/mT5: 80 0F.H5: 1 min.
Program endR6: -1 0F. p/mT6: 80 0F.H6: 0 min.
Closed glass casting scheduleFig. 160.
Fusing glass scheduleFig. 161.
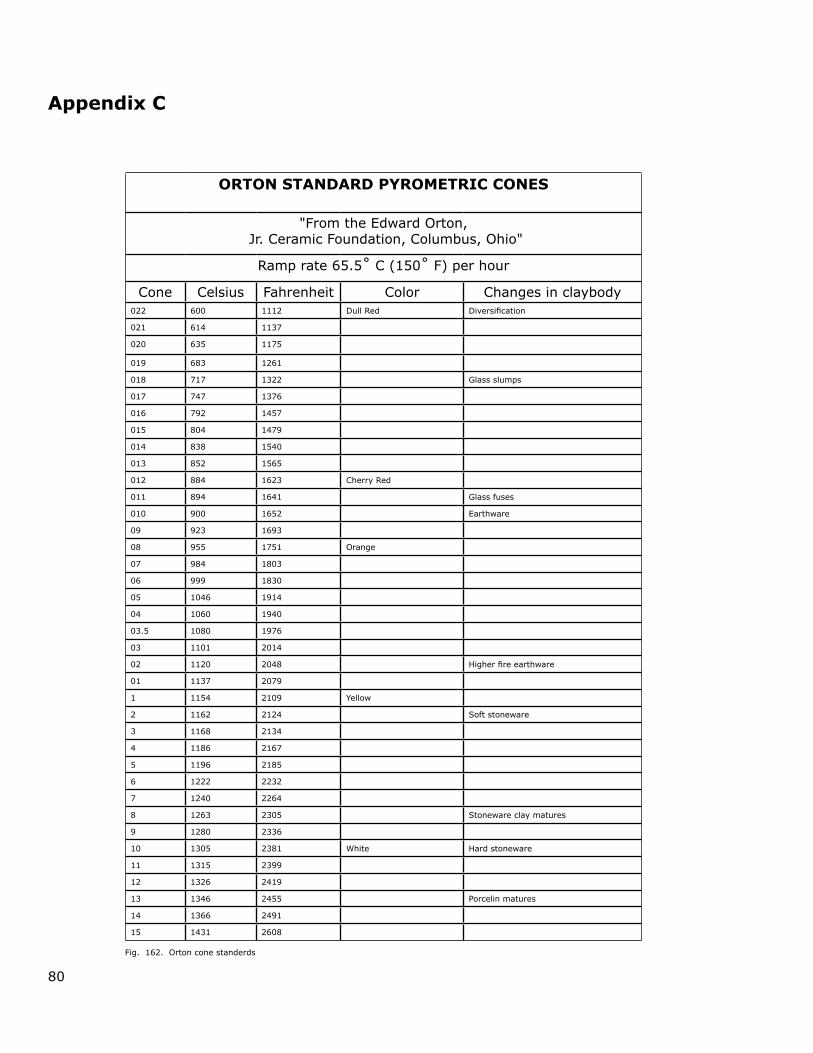
80
Appendix C
ORTON STANDARD PYROMETRIC CONES
"From the Edward Orton, Jr. Ceramic Foundation, Columbus, Ohio"
Ramp rate 65.5˚ C (150˚ F) per hour
Cone Celsius Fahrenheit Color Changes in claybody022 600 1112 Dull Red Diversification
021 614 1137
020 635 1175
019 683 1261
018 717 1322 Glass slumps
017 747 1376
016 792 1457
015 804 1479
014 838 1540
013 852 1565
012 884 1623 Cherry Red
011 894 1641 Glass fuses
010 900 1652 Earthware
09 923 1693
08 955 1751 Orange
07 984 1803
06 999 1830
05 1046 1914
04 1060 1940
03.5 1080 1976
03 1101 2014
02 1120 2048 Higher fire earthware
01 1137 2079
1 1154 2109 Yellow
2 1162 2124 Soft stoneware
3 1168 2134
4 1186 2167
5 1196 2185
6 1222 2232
7 1240 2264
8 1263 2305 Stoneware clay matures
9 1280 2336
10 1305 2381 White Hard stoneware
11 1315 2399
12 1326 2419
13 1346 2455 Porcelin matures
14 1366 2491
15 1431 2608
Orton cone standerdsFig. 162.
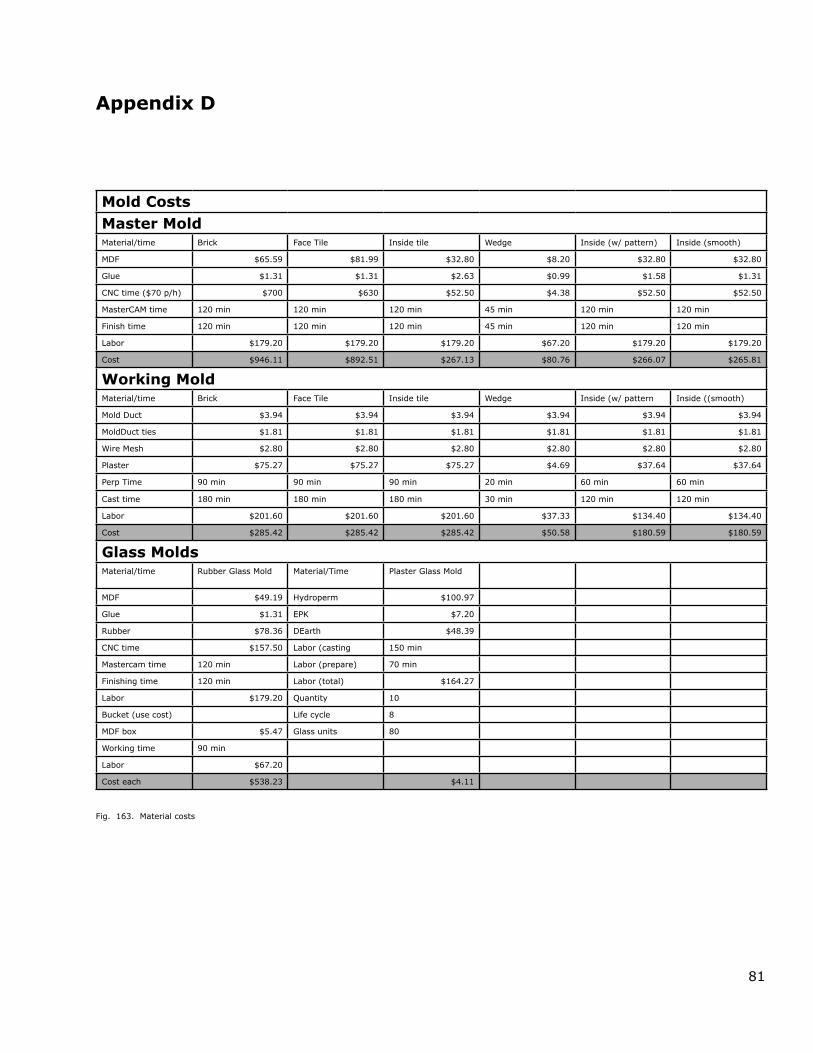
81
Appendix D
Mold CostsMaster MoldMaterial/time Brick Face Tile Inside tile Wedge Inside (w/ pattern) Inside (smooth)
MDF $65.59 $81.99 $32.80 $8.20 $32.80 $32.80
Glue $1.31 $1.31 $2.63 $0.99 $1.58 $1.31
CNC time ($70 p/h) $700 $630 $52.50 $4.38 $52.50 $52.50
MasterCAM time 120 min 120 min 120 min 45 min 120 min 120 min
Finish time 120 min 120 min 120 min 45 min 120 min 120 min
Labor $179.20 $179.20 $179.20 $67.20 $179.20 $179.20
Cost $946.11 $892.51 $267.13 $80.76 $266.07 $265.81
Working MoldMaterial/time Brick Face Tile Inside tile Wedge Inside (w/ pattern Inside ((smooth)
Mold Duct $3.94 $3.94 $3.94 $3.94 $3.94 $3.94
MoldDuct ties $1.81 $1.81 $1.81 $1.81 $1.81 $1.81
Wire Mesh $2.80 $2.80 $2.80 $2.80 $2.80 $2.80
Plaster $75.27 $75.27 $75.27 $4.69 $37.64 $37.64
Perp Time 90 min 90 min 90 min 20 min 60 min 60 min
Cast time 180 min 180 min 180 min 30 min 120 min 120 min
Labor $201.60 $201.60 $201.60 $37.33 $134.40 $134.40
Cost $285.42 $285.42 $285.42 $50.58 $180.59 $180.59
Glass MoldsMaterial/time Rubber Glass Mold Material/Time Plaster Glass Mold
MDF $49.19 Hydroperm $100.97
Glue $1.31 EPK $7.20
Rubber $78.36 DEarth $48.39
CNC time $157.50 Labor (casting 150 min
Mastercam time 120 min Labor (prepare) 70 min
Finishing time 120 min Labor (total) $164.27
Labor $179.20 Quantity 10
Bucket (use cost) Life cycle 8
MDF box $5.47 Glass units 80
Working time 90 min
Labor $67.20
Cost each $538.23 $4.11
Material costsFig. 163.
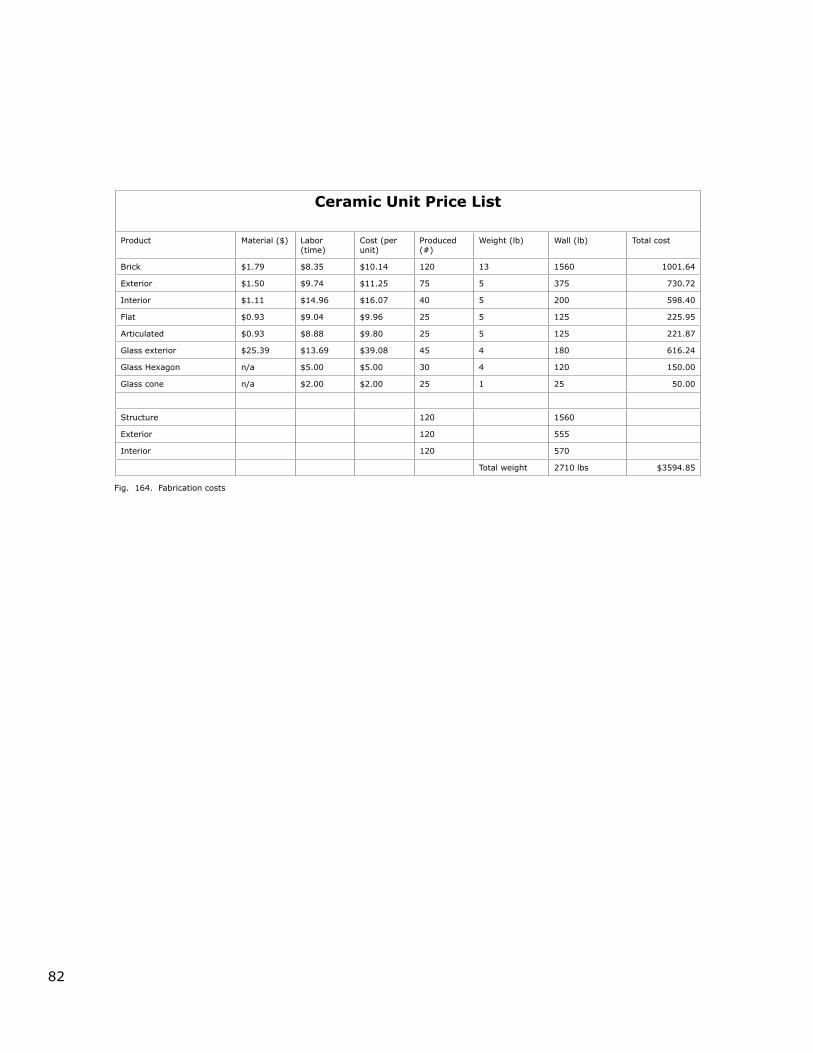
82
Ceramic Unit Price List
Product Material ($) Labor (time)
Cost (per unit)
Produced (#)
Weight (lb) Wall (lb) Total cost
Brick $1.79 $8.35 $10.14 120 13 1560 1001.64
Exterior $1.50 $9.74 $11.25 75 5 375 730.72
Interior $1.11 $14.96 $16.07 40 5 200 598.40
Flat $0.93 $9.04 $9.96 25 5 125 225.95
Articulated $0.93 $8.88 $9.80 25 5 125 221.87
Glass exterior $25.39 $13.69 $39.08 45 4 180 616.24
Glass Hexagon n/a $5.00 $5.00 30 4 120 150.00
Glass cone n/a $2.00 $2.00 25 1 25 50.00
Structure 120 1560
Exterior 120 555
Interior 120 570
Total weight 2710 lbs $3594.85
Fabrication costsFig. 164.