
HIGH-PERFORMANCE BRIDGE SYSTEMS FOR LIFELINE CORRIDORS...
110
HIGH-PERFORMANCE BRIDGE SYSTEMS FOR LIFELINE CORRIDORS IN THE PACIFIC NORTHWEST PROJECT REPORT by Marc O. Eberhard John F. Stanton Hung V. Tran Max T. Stephens Dawn E Lehman Charles W. Roeder University of Washington André R. Barbosa David Trejo Tim Link Drew Nielson Vandad Manzarei Oregon State University for Pacific Northwest Transportation Consortium (PacTrans) USDOT University Transportation Center for Federal Region 10 University of Washington More Hall 112, Box 352700 Seattle, WA 98195-2700
Transcript of HIGH-PERFORMANCE BRIDGE SYSTEMS FOR LIFELINE CORRIDORS...

HIGH-PERFORMANCE BRIDGE SYSTEMS FOR
LIFELINE CORRIDORS IN THE PACIFIC
NORTHWEST
PROJECT REPORT
by
Marc O. Eberhard
John F. Stanton
Hung V. Tran
Max T. Stephens
Dawn E Lehman
Charles W. Roeder
University of Washington
André R. Barbosa
David Trejo
Tim Link
Drew Nielson
Vandad Manzarei
Oregon State University
for
Pacific Northwest Transportation Consortium (PacTrans)
USDOT University Transportation Center for Federal Region 10
University of Washington
More Hall 112, Box 352700
Seattle, WA 98195-2700

i
DISCLAIMER
The contents of this report reflect the views of the authors, who are responsible for the
facts and the accuracy of the information presented herein. This document is disseminated under
the sponsorship of the U.S. Department of Transportation’s University Transportation Centers
Program, in the interest of information exchange. The Pacific Northwest Transportation
Consortium and the U.S. Government assumes no liability for the contents or use thereof.
Technical Report Documentation Page 1. Report No.
2013-MI-UW-0045 2. Government Accession No.
01497974 3. Recipient’s Catalog No.
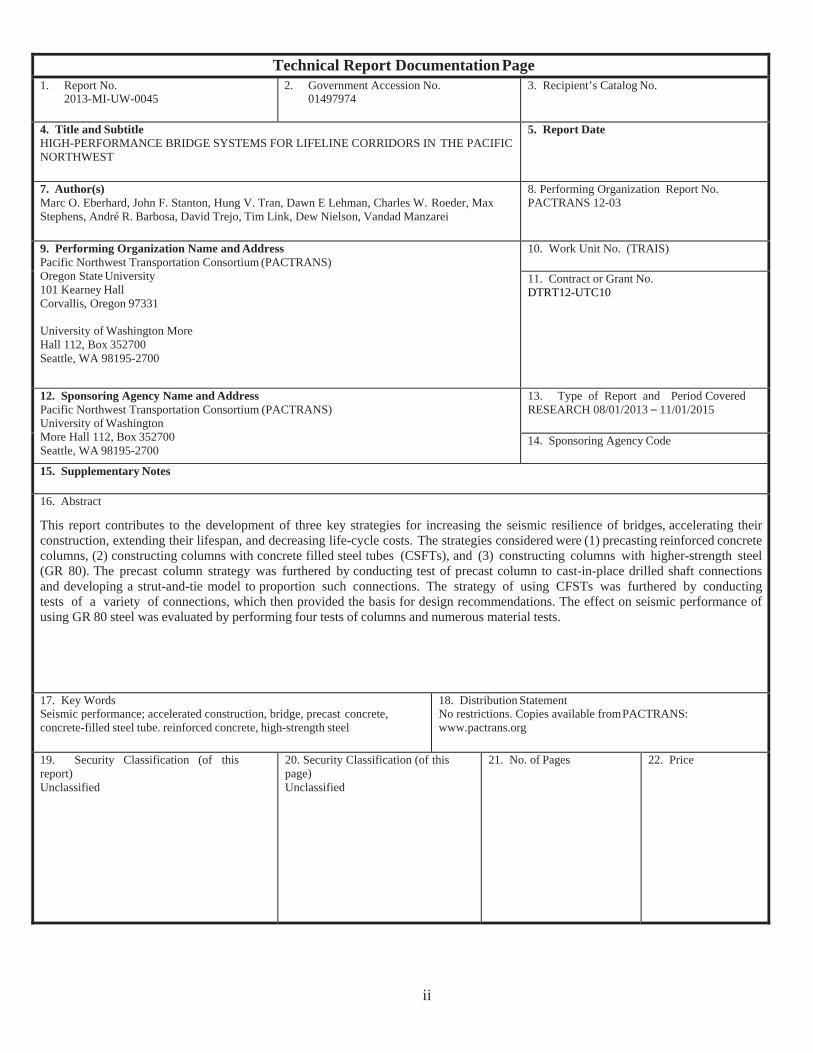
4. Title and Subtitle HIGH-PERFORMANCE BRIDGE SYSTEMS FOR LIFELINE CORRIDORS IN THE PACIFIC NORTHWEST
5. Report Date
7. Author(s) Marc O. Eberhard, John F. Stanton, Hung V. Tran, Dawn E Lehman, Charles W. Roeder, Max Stephens, André R. Barbosa, David Trejo, Tim Link, Dew Nielson, Vandad Manzarei
8. Performing Organization Report No. PACTRANS 12-03
9. Performing Organization Name and Address Pacific Northwest Transportation Consortium (PACTRANS) Oregon State University 101 Kearney Hall Corvallis, Oregon 97331
University of Washington More Hall 112, Box 352700 Seattle, WA 98195-2700
10. Work Unit No. (TRAIS)
11. Contract or Grant No. DTRT12-UTC10
12. Sponsoring Agency Name and Address Pacific Northwest Transportation Consortium (PACTRANS) University of Washington More Hall 112, Box 352700 Seattle, WA 98195-2700
13. Type of Report and Period Covered RESEARCH 08/01/2013 – 11/01/2015
14. Sponsoring Agency Code
15. Supplementary Notes
16. Abstract
This report contributes to the development of three key strategies for increasing the seismic resilience of bridges, accelerating their construction, extending their lifespan, and decreasing life-cycle costs. The strategies considered were (1) precasting reinforced concrete columns, (2) constructing columns with concrete filled steel tubes (CSFTs), and (3) constructing columns with higher-strength steel (GR 80). The precast column strategy was furthered by conducting test of precast column to cast-in-place drilled shaft connections and developing a strut-and-tie model to proportion such connections. The strategy of using CFSTs was furthered by conductingtests of a variety of connections, which then provided the basis for design recommendations. The effect on seismic performance of using GR 80 steel was evaluated by performing four tests of columns and numerous material tests.
17. Key Words Seismic performance; accelerated construction, bridge, precast concrete, concrete-filled steel tube. reinforced concrete, high-strength steel
18. Distribution Statement No restrictions. Copies available from PACTRANS: www.pactrans.org
19. Security Classification (of this report) Unclassified
20. Security Classification (of this page) Unclassified
21. No. of Pages 22. Price
ii

iii
EXECUTIVE SUMMARY
In current practice, nearly all bents (intermediate supports) are constructed of cast-in-
place reinforced concrete and conventional reinforcing steel. Such bridges have served the
Pacific Northwest (PNW) well in the past, but they need to be improved to meet current
performance expectations. New strategies are needed to increase seismic resilience of bridges,
accelerate their construction, and extend their lifespan (durability). This report contributes to the
development of three key strategies for meeting these challenges, which would all lead to
reduced life-cycle costs.
Precast Columns Supported by Drilled Shafts
A new type of connection between a precast concrete column and a drilled shaft has been
developed for Accelerated Bridge Construction (ABC). The connection described in this report
(Chapter 2) can be built quickly and allows generous placement tolerances. Three quasi-static
large-scale tests of connections between a precast bridge column and a drilled shaft were
performed to investigate the seismic performance of this connection.
The geometry of the test specimens was based on the minimum practical difference
between the diameters of the shaft and the column, and so represented the most critical case. The
performance of the system was investigated up to a drift ratio of 10%. The experimental results
show that, if adequate confining steel is included in the splice zone, the plastic hinging
mechanism forms in the column, without incurring damage in the splice zone or shaft. If the
confinement is insufficient, the strength of the splice zone deteriorates rapidly with cyclic
loading.

iv
Concrete Filled Steel Tubes
Concrete filled steel tubes (CFSTs) are composite elements which consist of a steel tube
with concrete infill, and offer an efficient alternative to conventional reinforced concrete
construction, including rapid construction and reduced material and labor costs. However, the
use of CFSTs in the US is limited in-part due to a lack of standard connection details.
This report focuses on the development of practical connections for CFSTs for use in
moderate and high seismic regions with a specific emphasis on connections to precast concrete
components. Two types of connections are being investigated, including column-to-foundation
and column-to-cap beam connections. Extensive numerical parameter studies and experimental
work resulted in straight forward design and corresponding expressions for a column-to-
foundation connection in which the steel tube is embedded into the foundation concrete.
Development of the column-to-cap beam connection is more recent and is discussed in-
depth here. This connection offers many unique design considerations including congested joint
reinforcing and limits on geometry associated with the integration of precast super-structure
components. Three categories of the CFST column-to-cap beam connection are being evaluated;
an embedded connection similar to the proposed foundation connection, a connection in which
headed reinforcing bars are welded to the inside of the steel tube and extended into the cap beam,
and a traditional jacket RC connection in which a short independent cage of transverse and
longitudinal column reinforcing extends from the steel tube into the cap beam (Chapter 4). All
connections were developed and evaluated for use with precast bent caps for the optimization of
accelerated bridge construction. Numerical and experimental results indicate that the proposed
connection types can achieve adequate strength and ductility when subjected to extreme lateral
loading. Design equations are provided in Chapter 5.
v
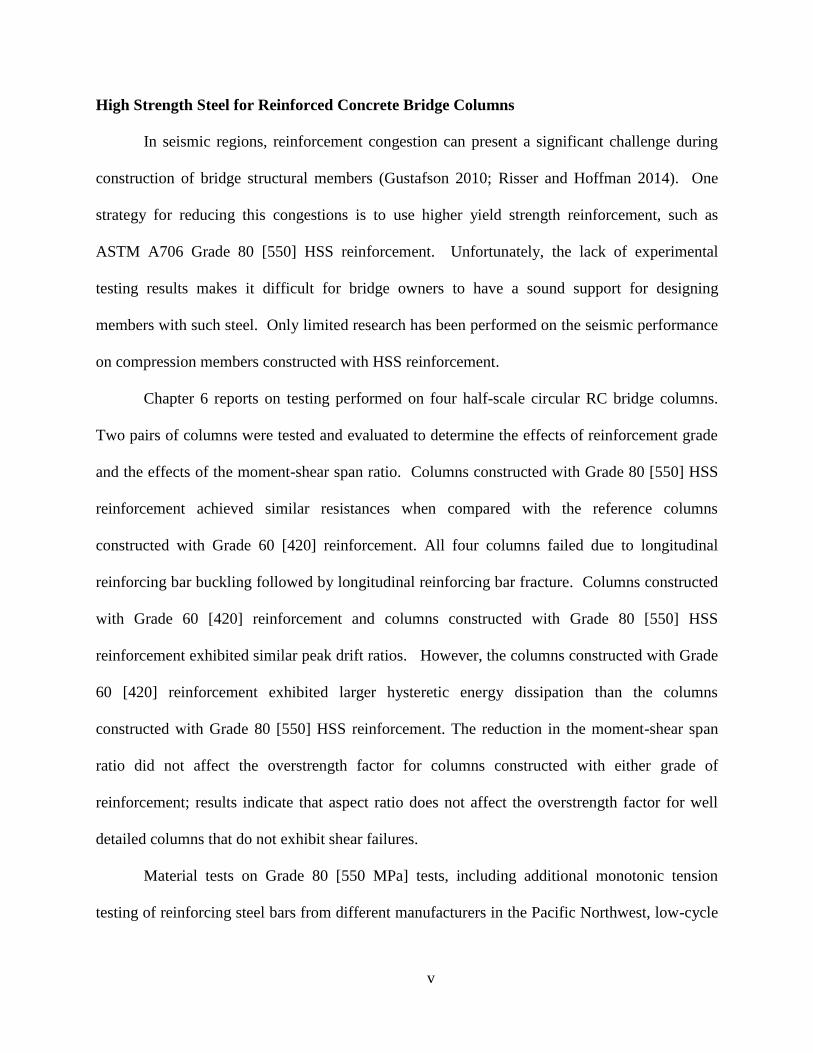
High Strength Steel for Reinforced Concrete Bridge Columns
In seismic regions, reinforcement congestion can present a significant challenge during
construction of bridge structural members (Gustafson 2010; Risser and Hoffman 2014). One
strategy for reducing this congestions is to use higher yield strength reinforcement, such as
ASTM A706 Grade 80 [550] HSS reinforcement. Unfortunately, the lack of experimental
testing results makes it difficult for bridge owners to have a sound support for designing
members with such steel. Only limited research has been performed on the seismic performance
on compression members constructed with HSS reinforcement.
Chapter 6 reports on testing performed on four half-scale circular RC bridge columns.
Two pairs of columns were tested and evaluated to determine the effects of reinforcement grade
and the effects of the moment-shear span ratio. Columns constructed with Grade 80 [550] HSS
reinforcement achieved similar resistances when compared with the reference columns
constructed with Grade 60 [420] reinforcement. All four columns failed due to longitudinal
reinforcing bar buckling followed by longitudinal reinforcing bar fracture. Columns constructed
with Grade 60 [420] reinforcement and columns constructed with Grade 80 [550] HSS
reinforcement exhibited similar peak drift ratios. However, the columns constructed with Grade
60 [420] reinforcement exhibited larger hysteretic energy dissipation than the columns
constructed with Grade 80 [550] HSS reinforcement. The reduction in the moment-shear span
ratio did not affect the overstrength factor for columns constructed with either grade of
reinforcement; results indicate that aspect ratio does not affect the overstrength factor for well
detailed columns that do not exhibit shear failures.
Material tests on Grade 80 [550 MPa] tests, including additional monotonic tension
testing of reinforcing steel bars from different manufacturers in the Pacific Northwest, low-cycle

vi
fatigue testing of A615 and A706 Grade 80 [550 MPa] HSS reinforcement, and shear friction
tests were also performed. These results results will be made available in a follow-up
publication submitted to Oregon Department of Transportation in December 2015.
The results in this study present a promising step towards implementation of Grade 80
[550] HSS reinforcement in the design and construction of RC columns, within the bounds of the
variables used in is testing program. Other parameters outside of the range studied in this paper
should be evaluated. Those could include larger longitudinal reinforcement ratios, larger axial
load ratios, and higher concrete strengths.

TABLE OF CONTENTS
CHAPTER 1. INTRODUCTION.................................................................... 1
CHAPTER 2. EXPERIMENTS ON CONNECTIONS BETWEEN
PRECAST CONCRETE COLUMNS AND DRILLED SHAFTS ....... 3
2.1 Introduction .............................................................................................. 3
2.2 Concept .................................................................................................... 4
2.3 Quasi-Static Tests .................................................................................... 5
2.4 Specimens ................................................................................................ 6
2.5 Test Protocol ............................................................................................ 9
2.6 Sub-Assembly Response ........................................................................ 10
2.7 Conclusions from Testing ...................................................................... 14
CHAPTER 3 STRUT-AND-TIE MODEL FOR CONNECTIONS
BETWEEN PRECAST CONCRETE COLUMNS AND DRILLED
SHAFTS.............................................................................................. 16
3.1 Introduction ............................................................................................ 16
3.2 Forces Acting on the Boundary of the Transition Region ..................... 16
3.3 Strut-and Tie Model formulation ........................................................... 19
3.3.1 Free-Body Diagram Before Failure ............................................... 19
3.3.2 Strut-and-Tie Model ...................................................................... 22
3.4 Verification of Strut-and Tie Model ...................................................... 24
3.4.1 Compression Failure ...................................................................... 24
3.4.2 Tension Failure .............................................................................. 24
3.4.3 Anchorage Failure ......................................................................... 24
3.4.4 Lap Splice Failure .......................................................................... 25
3.4.5 Prying Failure ................................................................................ 26
3.4.6 Verification of Proposed Strut-and-Tie Model .............................. 27
CHAPTER 4. EXPERIMENTS AND ANALYSES OF CONCRETE
FILLED STEEL TUBE CONNECTIONS ......................................... 34

4.1 INTRODUCTION ................................................................................. 34
4.2 CFST COLUMN-TO-FOUNDATION CONNECTION ...................... 35
4.2.1 Experimental Behavior .................................................................. 37
4.2.2 Design Expressions........................................................................ 39
4.3 CFST COLUMN-TO-CAP BEAM CONNECTION ............................ 39
4.3.1 Specimen Design ........................................................................... 42
4.3.2 Numerical Analysis ....................................................................... 46
4.3.3 Experiments ................................................................................... 48
CHAPTER 5. DESIGN EXPRESSIONS FOR CFST CONNECTIONS ...... 52
5.1 MATERIALS ......................................................................................... 52
5.1.1 Grout .............................................................................................. 53
5.1.2 Fiber Reinforcing ........................................................................... 53
5.1.3 Corrugated Metal Duct .................................................................. 53
5.1.4 Reinforcement ............................................................................... 54
5.1.5 CFST Tube Steel ........................................................................... 54
5.2 EMBEDDED RING CONNECTION.................................................... 54
5.2.1 Annular Ring ................................................................................. 55
5.2.2 Embedment Depth ......................................................................... 55
5.2.3 Punching Shear .............................................................................. 56
5.2.4 Cap Beam Flexural Reinforcing .................................................... 56
5.2.5 Joint Region Shear Reinforcing ..................................................... 57
5.2.6 Joint Region Horizontal Stirrups ................................................... 58
5.3 WELDED DOWEL CONNECTION .................................................... 58
5.3.1 Annular Ring ................................................................................. 59
5.3.2 Length Dowels Extend into the Cap Beam and Column ............... 59
5.3.3 Vertical and Horizontal Joint Region Reinforcing ........................ 60
5.3.4 Soffit Fill Depth ............................................................................. 61
5.3.5 Dowel De-bonded Length ............................................................. 61
5.3.6 Dowel-to-Steel Tube Welds .......................................................... 62
5.3.7 Use of Spiral or Hoop Reinforcement in the Joint Region ............ 63
5.4 CONCLUSIONS AND FUTURE WORK ............................................ 63

CHAPTER 6. SEISMIC PERFORMANCE OF HIGH-STRENGTH
STEEL RC BRIDGE COLUMNS ...................................................... 65
6.1 INTRODUCTION ................................................................................. 65
6.2 EXPERIMENTAL PLAN ..................................................................... 67
6.2.1 Construction Sequence .................................................................. 70
6.2.2 Instrumentation .............................................................................. 70
6.2.3 Test Setup and Testing Procedure ................................................. 73
6.3 TEST RESULTS AND DISCUSSION ................................................. 76
6.3.1 Steel Reinforcement Strains .......................................................... 76
6.3.2 Column Capacity ........................................................................... 78
6.3.3 Column Ductility ........................................................................... 81
6.3.4 Energy Dissipation ........................................................................ 83
6.3.5 Damage Progression ...................................................................... 84
6.4 CONCLUSIONS.................................................................................... 86
CHAPTER 7. COMPARISON OF STRATEGIES ....................................... 89

1
CHAPTER 1
INTRODUCTION
The geometry, details and materials of newt bridges in seismic regions have changed
little since the mid-1970s, when ductile details were first introduced into bridge engineering
practice. Nearly all bents (intermediate supports) are constructed of cast-in-place reinforced
concrete and conventional reinforcing steel. Such bridges have served the Pacific Northwest
(PNW) well in the past, but to meet current performance expectations, new structural systems are
needed to improve:
Seismic Resilience. Improving seismic performance increases the safety of the
travelling public, both by reducing the possibility of collapse and also, by allowing
emergency vehicles to use the structure immediately following an earthquake.
Speed of Construction. Reducing the onsite construction time further reduces the
indirect costs of bridge construction. It also improves safety by reducing the amount
of time that workers will be exposed to traffic hazards.
Durability. The replacement of bridges can be costly and disruptive, so it is
important that bridges last as long as possible.
To help address these challenges, the research described in this report furthers three
strategies for improving the economy and performance of bridges located in the Pacific
Northwest.
Precast Columns and Beams. Precasting columns and cross-beams can accelerate the
construction process onsite by moving time-consuming operations offsite. Previous
research has considered the development of connections between precast column and

2
cross-beams (Pang et al., 2009), as well as precast columns and cast-in-place footings
(Haraldsson et al., 2013). To provide a solution for bridges supported by deep
foundation, this report describes three tests of connections between precast columns
and drilled shafts (Chapter 2), and the development of a strut-and-tie model to
proportion that connection (Chapter 3).
Concrete Filled Steel Tubes. Concrete filled steel tubes (CFSTs) are composite
elements which consist of a steel tube with concrete infill. These elements offer an
efficient alternative to conventional reinforced concrete construction including rapid
construction and reduced material and labor costs. However, the use of CFSTs in the
US is limited in-part due to a lack of standard connection details. This report focuses
on the development of practical connections for CFSTs for use in moderate and high
seismic regions with a specific emphasis on connections to precast concrete
components. Two types of connections are being investigated, including column-to-
foundation and column-to-cap beam connections. Test of such connections are
described in Chapter 4, and the design expressions are provided in Chapter 5.
High-Performance Reinforcement. The availability of higher-strength reinforcing
steel provides the opportunity to reduce construction costs and reinforcement
congestion, which is a key concern in modern construction. Chapter 6 presents the
results of a testing program developed to assess the performance of circular
reinforced concrete (RC) bridge columns constructed with ASTM A706 Grade 80
[550] high-strength steel (HSS) reinforcement.
The strategies are compared with conventional cast-in-place construction in Chapter 7.

3
CHAPTER 2
EXPERIMENTS ON CONNECTIONS BETWEEN PRECAST CONCRETE
COLUMNS AND DRILLED SHAFTS
2.1 INTRODUCTION
The use of cast-in-place columns in bridge construction requires long on-site construction
times and large labor requirements in the field. Cast-in-place construction activities are
particularly disruptive in situations in which they exacerbate traffic congestion (e.g., urban
areas).
One strategy for reducing on-site construction time, field labor requirements, and traffic
delays is to precast bridge elements offsite and assemble them together onsite. This strategy is
already widely applied for bridge girders. In some cases, full bridges have been constructed off
site and moved to the bridge site, but this strategy can only be used when the appropriate staging
and transportation conditions existing. Usually, precasting in bridge bents is limited to the
columns and beams. To facilitate fabrication, transportation and erection convenience, the
connections are usually made at the top and bottoms of the columns. This strategy facilititates
construction, but it can be challenging in seismically hazardous areas, because the ends of
columns have high seismic demands.
Haraldsson et al. (2013) described the development of a “socket” connection between a
precast column and cast-in-place footing. This chapter describes the concept, and seismic
performance of the connection between a precast column and drilled shaft, and provides
recommendations to ensure desirable performance.

4
2.2 CONCEPT
The “wet” socket connection concept was proposed by Haraldsson et al. (2013) to
connect a precast column with a cast-in-place spread footing. In that connection, the bottom of
the precast column is roughened where it will be embedded in the cast-in-place spread footing.
The ends of the longitudinal column reinforcement is terminated with mechanical anchors
instead of using the more conventional detail of bending the longitudinal bars outwards into the
foundation.
Deep foundations are often needed in many soft-soil conditions, so in this research, the
socket concept has been adapted to connections between a precast column and cast-in-place
drilled shaft. The construction sequence is shown in Figure 2.1. Construction SequenceOnce the
shaft has been excavated, the shaft reinforcing cage is placed, and concrete is cast until reach the
bottom level of the transition (Step 1). The precast column is then positioned and braced (Step
2), and the transition is cast (Step 3). Finally, the cap beam is constructed to connect with the
columns (Step 4).
In this new connection, the precast column is intentionally roughened (as was done by
Haraldsson et al. 2013) where it is embedded in the cast-in-placed enlarged drilled shaft. The
transition region needs to be strong enough to develop the flexural strength of column. To make
the transition region as short as possible, mechanical anchors are used for column bars to reduce
the development length of longitudinal reinforcement in the transition region (Fig. 2.2).

5
Figure 2.1. Construction Sequence
2.3 QUASI-STATIC TESTS
Three column-drilled shaft connection specimens (DS-1, DS-2, and DS-3) were tested at
the University of Washington to evaluate the seismic performance of the connection, and to
provide data with which to calibrate a design methodology. The test specimens were designed
according to the AASHTO Load Resistant Factor Design 2009, AASHTO Guide Specifications
for LRFD Seismic Design 2009, and WSDOT Bridge Design Manual (2012) with the exception
of the spirals in the transition region.

6
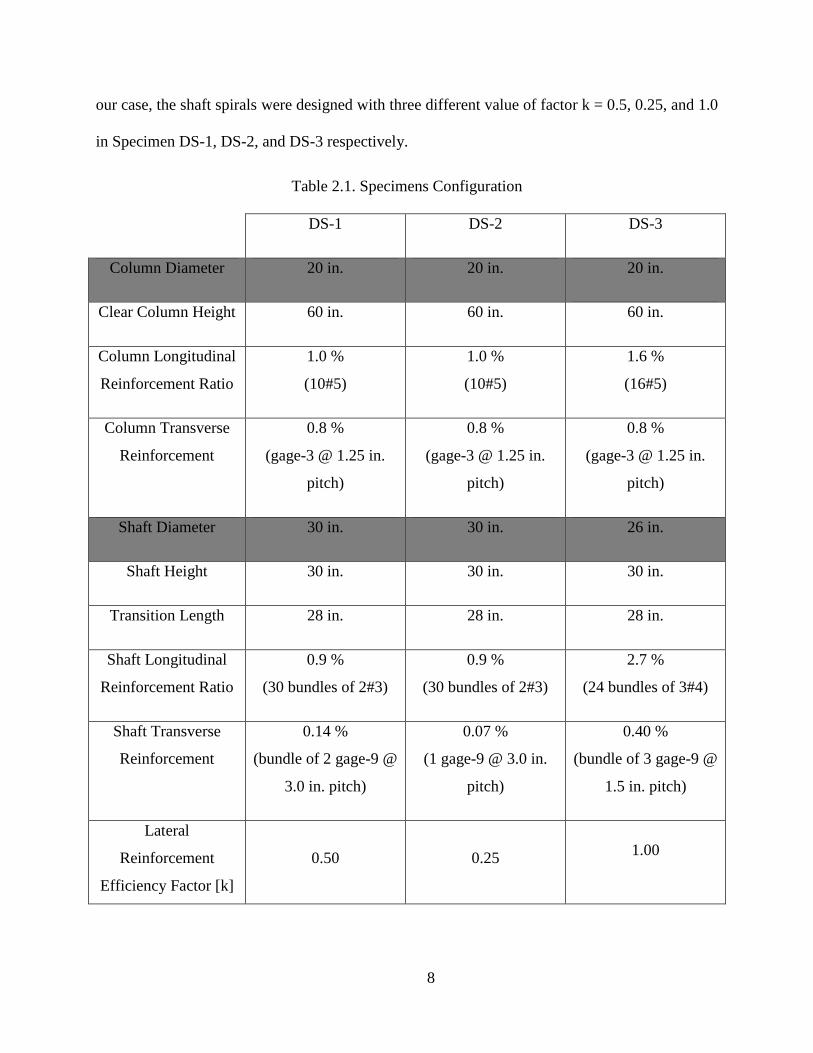
2.4 SPECIMENS
The test specimens key dimensions
and reinforcement are shown in
Table 2.1. The only difference
between Specimen DS-1 and
Specimen DS-2 was that the
amount of spiral in the column-to-
shaft transition region was reduced
by half in DS-2. The test specimen
dimension and reinforcement in
Specimen DS-1 and DS-2 were
scaled (1/3.6) from a real
prototype, and Specimen DS-3 had
more column and shaft
reinforcement, but with a smaller shaft diameter.
The embedded length of the column in the drilled shaft (28 in.) was based on the scaled-
down non-contact lap splice length of the shaft prototype according to WSDOT BDM (proposed
by McLean et al. (1997)), given as
𝑙𝑛𝑠 = 𝑙𝑠 + 𝑒
where:
𝑙𝑛𝑠 = length of noncontact lap splice.
𝑙𝑠 = lap splice length required by AASHTO LRFD 5.11.5.3 or
Figure 2.2. Column-to-Shaft Connection Concept

7
𝑙𝑠 = 1.7𝑙𝑑 (for a Class C lap splice) where 𝑙𝑑 is the longer development length of
either column or shaft bars. In our case, mechanical anchors were used only for
column bars, so the development length is controlled by shaft bars.
𝑒 = distance between the shaft and column longitudinal reinforcement.
The shaft longitudinal reinforcement was designed to form a plastic hinge in the column.
Therefore, the yield moment of the shaft had to be larger than the moment at the base of the shaft
due to the over-strength moment and shear from the column above.
The shaft spirals were designed based on the non-contact lap splices behavior, but using
different value of efficiency factor. McLean et al. (1997) proposed a formula to determine spiral
spacing as:
𝑠𝑡𝑟 =2𝜋𝐴𝑠𝑝𝑓𝑦𝑡𝑟𝑙𝑠
𝐴𝑙𝑓𝑢𝑙
where,
𝐴𝑡𝑟 = area of shaft transverse reinforcement or spiral (in.2)
𝐴𝑙 = total area of longitudinal column reinforcement (in.2)
𝑓𝑦𝑡 = specified minimum yield strength of shaft transverse reinforcement (ksi)
𝑓𝑢𝑙 = specified minimum tensile strength of column longitudinal reinforcement
(ksi), 90 ksi for A615 and 80 ksi for A706
𝑙𝑠 = Class C tension lap splice length of the column longitudinal reinforcement (in.)
𝑠𝑡𝑟 = spacing of shaft transverse reinforcement (in.)
WSDOT BDM adjusts this formula by adding to the divisor a factor, k, representing the ratio of
column tensile reinforcement to total column reinforcement at the nominal resistance. This factor
is to be determined from column moment-curvature analysis or, as a default, taken as k = 0.5. In
8
our case, the shaft spirals were designed with three different value of factor k = 0.5, 0.25, and 1.0
in Specimen DS-1, DS-2, and DS-3 respectively.
Table 2.1. Specimens Configuration
DS-1 DS-2 DS-3
Column Diameter 20 in. 20 in. 20 in.
Clear Column Height 60 in. 60 in. 60 in.
Column Longitudinal
Reinforcement Ratio
1.0 %
(10#5)
1.0 %
(10#5)
1.6 %
(16#5)
Column Transverse
Reinforcement
0.8 %
(gage-3 @ 1.25 in.
pitch)
0.8 %
(gage-3 @ 1.25 in.
pitch)
0.8 %
(gage-3 @ 1.25 in.
pitch)
Shaft Diameter 30 in. 30 in. 26 in.
Shaft Height 30 in. 30 in. 30 in.
Transition Length 28 in. 28 in. 28 in.
Shaft Longitudinal
Reinforcement Ratio
0.9 %
(30 bundles of 2#3)
0.9 %
(30 bundles of 2#3)
2.7 %
(24 bundles of 3#4)
Shaft Transverse
Reinforcement
0.14 %
(bundle of 2 gage-9 @
3.0 in. pitch)
0.07 %
(1 gage-9 @ 3.0 in.
pitch)
0.40 %
(bundle of 3 gage-9 @
1.5 in. pitch)
Lateral
Reinforcement
Efficiency Factor [k]
0.50 0.25 1.00
9
WSDOT BDM requires three turns of wire at the end to terminate the spiral. Thus, 6, 3,
and 9 turns of spiral were placed at the top of the transition in Specimen DS-1, DS-2, and DS-3
respectively.
The bottom of the shaft connected with a cast-in-place footing to attach the specimen to
the testing rig. The longitudinal bars of the drilled shaft were hooked at the bottom mat of
footing.
2.5 TEST PROTOCOL
The specimens were placed in a self-reacting rig as shown in Fig. 2.3. First, an axial load
of 159k was applied in the column to represent the un-factored dead load. This axial load was
kept constant until the end of testing. Later, the specimen was subjected to horizontal
displacement. The displacement history was the same as in previous test by Pang et al. (2008),
Haraldsson et al. (2011), and Janes et al. (2011). This displacement history was a modification of
a loading history for precast structural walls recommended in NEHRP (Building Seismic Safety
Council). The testing stopped when nearly all of the column bars or shaft spirals fractured.

10
Figure 2.3. Test Setup
2.6 SUB-ASSEMBLY RESPONSE
Fig. 2.4 shows the moment vs. drift ratio response of the test specimens DS-1, DS-2, and
DS-3. Under cyclic loading, in both specimens DS-1 and DS-3, failure occurred by plastic
hinging in the column while the connection region in the foundation remained generally
undamaged. However, in Specimen DS-2, failure occurred in the connection region after some
cracks had first occurred in the column, as shown in Fig. 2.5.

11
Figure 2.4. Moment-Drift Ratio Response
In all cases, the yield moment occurred at about 1.5%-2.0% drift ratio. The moment
capacity dropped below 80% of the peak value at 7%-8% drift ratio. The responses of Specimens
DS-1 and DS-3 were very ductile. The similarity between the peak strengths in specimens DS-1
was expected because the column were nominally identical previous column-to-spread footing
tests (Haraldsson et al. (2011)) and the specimen strength was controlled by the column
response.

12
Under cyclic loading, the strain gauge attached in the shaft spirals in all three specimens
showed that the horizontal strain distributions in the transition spirals were not uniform. The
horizontal strains were largest in the upper part of the transition, and almost zero at the bottom of
the transition during cyclic testing. In specimens DS-1 and DS-3, the horizontal strains at the top
of the transition passed the yielding point. All shaft spirals fractured in Specimen DS-2 after
testing. The specimens response proved that the three turn of spirals at the top of the transition,
which is not considered in designing, had a great contribution to the horozontal resistance of the
connection.
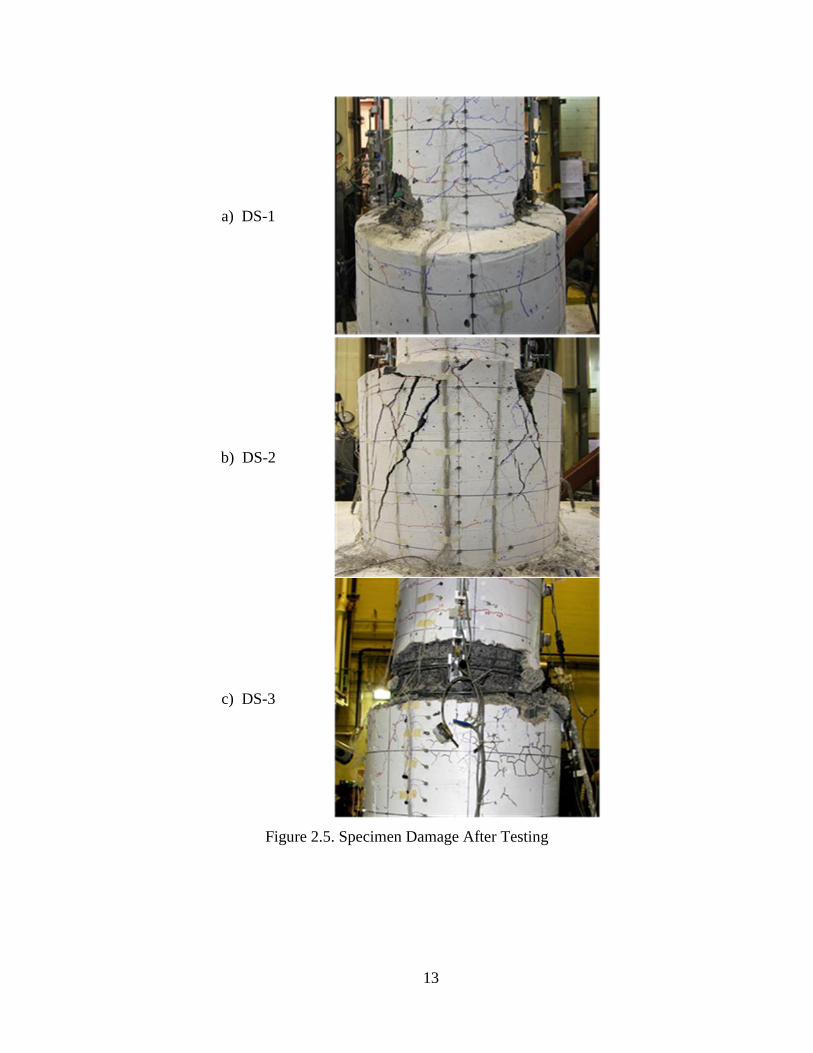
For each of the specimens, the damage to the connection after testing ais shown in Fig.
2.5. In Specimens DS-1 and DS-3, plastic hinges formed in the column and the mode of failure
were column failure as desired. The shaft just had some cracking and damage of the concrete
cover at the top of the shaft, but almost strains measured in longitudinal and transverse
reinforcement were smaller than yielding point.
However, the plastic hinge did not form in the column in Specimen DS-2. No obvious
concrete spalling occured in the column during the cyclic test. The system was damaged by
prying failure happened in the shaft. The strain measured in the longitudinal reinforcement
proved that there was no bonding failure during testing as predicted in designing.
13
a) DS-1
b) DS-2
c) DS-3
Figure 2.5. Specimen Damage After Testing

14
2.7 CONCLUSIONS FROM TESTING
A new type of connection between a precast concrete column and a oversize drilled shaft
using “wet” socket connection has been developed. This connection system has many advantage
of rapid construction, and performes well in high seismic regions.
From the results obtained in three tests performed in the University of Washington, the
following conclusions and recommendations can be drawn:
The proposed amount of confinement reinforcement required for the column-to-shaft
connection protects the shaft and causes failure to occur by plastic hinging of the
precast column, as desired. The test specimens had the smallest possible shaft/column
diameter ratio, and the shortest possible embedment length, so this conclusion can
hold for all permissible shaft and column combinations.
The confinement reinforcement of the shaft should satisfy the WSDOT equation
mentioned above. However, the factor k should be used as an efficiency factor instead
of a factor representing the ratio of column tensile reinforcement to total column
reinforcement.
The three turns of spiral at the top of the transition region, which is not calculate in
design equation, provides extra resistance. They were the first fractured spiral turn in
Specimen DS-2, and yielded in both Specimen DS-1 and DS-3. These amount of
spiral are equivalent as the efficiency factor k = 1.5, 0.75, and 1.5 in Specimens DS-1,
DS-2, and DS-3 respectively. Therefore, it suggests that the spirals at the top of the
transition region should be designed with a efficiency factor k > 1.5
The horizontal strain distributions in the transition region is largest at the top and
almost zero at the bottom of the transition. Therefore, it will be more efficient if more

15
spirals are placed in the upper part and less spirals are placed in the lower part. The
spiral strain at the middle of the transition length was nearly yielding in Specimen
DS-1 (designed with k = 0.5), but was equal as about 50% of yielding strain in
Specimen DS-3 (designed with k = 1.0). Thus, it suggests that the spirals should be
designed with a efficiency factor k = 1.0 for the upper part, and k = 0.5 for the lower
part of the transition to ensure that all spiral will be in elastic region.
Prying failure of the concrete shell surrounding the precast column will occur if
inadequate confinement reinforcement is provided.
If the external steel tube were used, it might provide some of the benefits of
additional spiral, and force the failure back into the column.
Mechanical anchor heads are needed at the ends of the column longitudinal
reinforcement to ensure hinging in the column without anchorage failure, especially if
the large bar system
16
CHAPTER 3
STRUT-AND-TIE MODEL FOR CONNECTIONS BETWEEN PRECAST
CONCRETE COLUMNS AND DRILLED SHAFTS
3.1 INTRODUCTION
In this chapter a strut-and-tie model is developed to proportion the transverse
reinforcement for the transition region between the column and the drilled shaft.
First, the forces acting at the connection boundaries for the seismic loading are estimated
(Section 3.2). This estimate is done using sectional analysis of the elements that adjoin the
transition region, namely the column and the shaft. These sectional analyses allow the designer
to identify the longitudinal force resultants and their locations within the cross-sections.
Next, a strut-and-tie model of the transition region is developed to resist the forces from
the sectional analyses acting at the boundaries (Section 3.3). The elements of the strut-and-tie
model transfer the forces internally between their points of application on the boundary. The
computed forces in model elements are evaluated by comparing them with values derived from
the experiments (Section 3.4), and the lateral capacity of the system is evaluated in terms of the
capacities of the struts and ties.
3.2 FORCES ACTING ON THE BOUNDARY OF THE TRANSITION
REGION
To use a strut-and-tie model, it is necessary to estimate the force resultants and their
locations at the model boundaries. These forces are shown schematically in Figure 3.1.

17
Figure 3.1. Forces Acting at the Boundary of the Column-Shaft Connection.
XTc
R1
F4 Tsh1
Tc
Ts
Cc
V
Cs
V
XCc
XCs XTs
L

18
To determine the appropriate values of the flexural tension and compression resultant
forces, and their locations forces at the boundaries of the transition regions, moment-curvature
analyses were performed for both the column and shaft cross-sections. At high drift ratios, a
plastic hinge may form at the bottom of the column, if some other element has not failed before.
Hung (2015) found that the moments and the steel strains predicted by the cross-sectional
analysis were close to those measured in the laboratory tests, so they were judged to be
sufficiently accurate to predict the forces at the boundaries of the strut-and-tie model.
For example, the calculated moment-curvature relationships for the columns are shown in
Figure 3.2. The flexural strengths predicted by the analyses and measured values are listed in
Table 3.1. For specimens DS-1 and DS-2 the moments predicted by both analyses give values
within 2-4% of the measured peak moment. These results suggest that the differences in the
longitudinal reinforcement properties did not greatly affect the flexural strength of the column.
Both analyses resulted in the ultimate flexural strength occurring at a curvature of 0.0065 rad/in.
Figure 3.2. Moment-Curvature Analyses of Columns
0 0.005 0.01 0.0150
500
1000
1500
2000
2500
3000
3500
4000
4500
5000
curvature (1/in.)
mo
me
nt (k
-in
)
Measured properties - DS1 & DS2
AASHTO properties - DS1 & DS2
Measured properties - DS3
AASHTO properties - DS3

19
Table 3.1. Comparison of Peak Column Moments
Specimen Moment
calculated using
expected
properties
[kip-in.]
Moment
calculated using
measured
properties
[kip-in.]
Measured
moment
[kip-in.]
Ratio of
measured to
predicted moment
using measured
properties
DS1 3315 3530 3476 0.98
DS2 3315 3530 3393 0.96
DS3 4423 4165 3622 0.87
3.3 STRUT-AND TIE MODEL FORMULATION
In the previous section, it was shown that sectional analysis can be used to establish the
forces and their locations acting at the boundary of the column-shaft connection. At a given
curvature and moment, the predicted values agree with the measured ones. In this section,
transfer of these forces through the transition region is investigated. A strut-and-tie model is
proposed and compared with measured data in the next section.
3.3.1 Free-Body Diagram Before Failure
As discussed in Chapter 5, Specimen DS-2 failed in the transition region. The damage
levels for Specimen DS-2 just before and after the measured lateral load resistance decreased
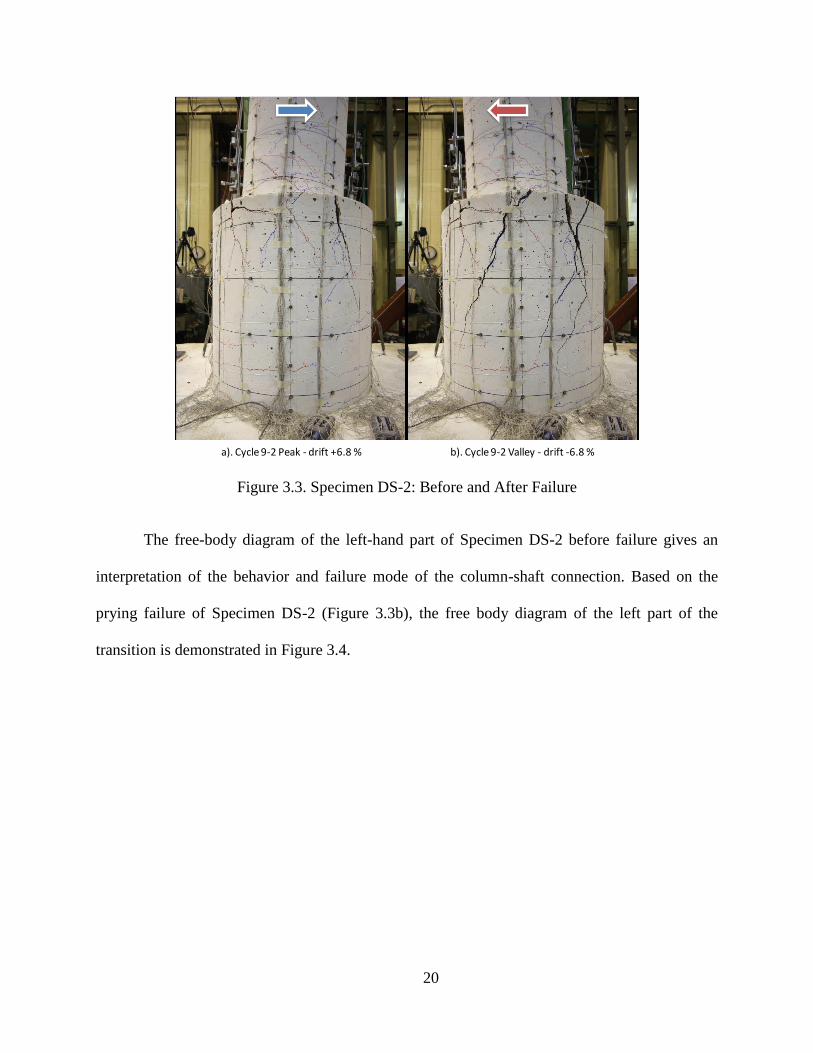
below 80% of the maximum resistance obtained earlier in the test is shown in Figure 3.3. The
behavior of this specimen was characterized by the opening of large vertical and diagonal cracks
in the transition, and followed subsequently by fracture of the spirals.
20
Figure 3.3. Specimen DS-2: Before and After Failure
The free-body diagram of the left-hand part of Specimen DS-2 before failure gives an
interpretation of the behavior and failure mode of the column-shaft connection. Based on the
prying failure of Specimen DS-2 (Figure 3.3b), the free body diagram of the left part of the
transition is demonstrated in Figure 3.4.
a). Cycle 9-2 Peak - drift +6.8 % b). Cycle 9-2 Valley - drift -6.8 %

21
Figure 3.4. Free-Body Diagram – DS-2
As shown in the free body diagram, the applied forces include compressive resultant
force of column and shaft (𝑪𝒄 and 𝑪𝒔 respectively), shear forces, 𝑽, at the top and bottom, and
spirals tensile forces (marked as green arrow) distributed along diagonal cracks with resultant at
𝑻𝒔𝒑. The diagonal face includes both column and shaft part. The spirals tensile force was acting
at the shaft part .Because the column diameter was smaller than shaft diameter, normally, 𝑪𝒄 was
larger than 𝑪𝒔. For equilibrium, force 𝑭, which has vertical part is equal to 𝑪𝒄 − 𝑪𝒔 and
horizontal part is equal to 𝑻𝒔𝒑,is needed at the column part of the diagonal face.
Cc
V
V
Cs
Tsp
F

22
3.3.2 Strut-and-Tie Model
Based on the forces acting at the boundary region and free-body diagram, the force
transferred from the column to the shaft is represented by a proposed strut-and-tie model as
shown in Figure 3.5.
The boundary conditions for the strut-and-tie model were determined as follows:
The column tension force 𝑻𝒄 was represented by a tie element. The location (𝑿𝑻𝒄)
and magnitude of this tie was equal to the column tensile resultant force’s location
and magnitude that were estimated from the moment-curvature analysis of the
column section.
Similarly, the locations of nodes E and F were identified at the calculated locations of
the column and shaft compression resultant force respectively using moment and
force equilibrium requirement.
The shaft tension force 𝑻𝒔 was represented by a tie element, which is located (𝑿𝑻𝒔) at the
shaft tensile resultant force estimated from the moment-curvature analysis of the shaft
section.
The internal elements of the model were determined as follows:
The elevation of node A was assumed to be at the end of column headed bars.
The transition transverse reinforcement was represented by tie BC. This tie was
placed horizontally at the location of the transition transverse resultant force. In the
analysis model, this location is determined based on the strain data attached on the
transverse reinforcement. In the design model, it is determined based on the assumed
parabolic strain distribution of the transverse reinforcement assumption which will be
discussed more in the design model section.

23
Struts CE and DF were identified based on equilibrium considerations of nodes E and F.
Node B and C were placed at the intersection between tie BC and Ts, EC respectively
Strut AB represented the lap splice force transfer mechanism between column and
shaft reinforcement. This strut is not a real strut in the transition region. It was the
resultant force of all compressive struts transferred from column to shaft
reinforcement which were uniformly distributed inside the peripheral hoops or
spirals. Strut AB was also needed to maintain equilibrium at nodes A and B.
To maintain equilibrium at node A, strut AD was established.
Node D was placed at the intersection between struts DF and AD.
Strut CD was located to maintain equilibrium at nodes C and D.
Figure 3.5. Proposed Strut-and-Tie Model.
XTc
R1
Tsh1
Tc
Ts
Cc
V
Cs
V
XCc
XCs XTs
L
A
BC
D
E
F

24
3.4 VERIFICATION OF STRUT-AND TIE MODEL
The key transition failure modes and the lateral-load capacity of the system are evaluated
in terms of the capacities of the proposed struts and ties in this section. Hung (2015) provides
more details about the calculated and measured capacities.
3.4.1 Compression Failure
The system investigated here is the connection between a column and an enlarged shaft.
Thus, the compressive stress in the column is larger than in the shaft. Therefore, in general, the
compression failure will not happen in the transition.
3.4.2 Tension Failure
A tension failure is developed in the column when the hinge forms in the column and the
column longitudinal reinforcement is subjected to large inelastic strain. This is the desired mode
of failure of the column-shaft connection. In the strut-and-tie model, this mode of failure is
represented when the column tensile resultant force Tc is more than the tensile resultant force
estimated from the moment-curvature analysis.
3.4.3 Anchorage Failure
In order to obtain a satisfactory performance of the column-shaft connection, it is
essential that the column longitudinal reinforcement is sufficiently anchored into the transition. If
an anchorage failure of column reinforcement occurs, a tensile failure cannot and the desired
response mode of a column flexural above the shaft cannot be achieved. Since it is desirable to
form a plastic hinge in the column and the shaft reinforcement remains elastic, high inelastic
strains with opposite sign are typically developed in the column reinforcing bars. In the

25
investigated column-shaft connection, the ends of the longitudinal column reinforcement were
terminated with rebar end anchors. Thus, the anchorage failure is not likely to happen.
3.4.4 Lap Splice Failure
The lap splice failure occurs if the confining pressure is not sufficient to prevent splitting
of concrete between the column and shaft longitudinal reinforcement, so the column tension
force may not be transferred to the shaft reinforcement by bond or shear friction across the
precast-c.i.p interface. Thus, the transition will fail before the column reaches its flexural
strength. Specimen DS-2 was designed with a small amount of transition spiral, which was
expected to induce lap splice failure. However, the test result showed that even when some of the
spirals were broken, the tension force in the shaft reinforcement did not change (Figure 3.6). It
suggests that the splice failure can be prevented by a minimum requirement of transverse
reinforcement.

26
Figure 3.6. Spiral Fracture Point (Specimen DS-2)
3.4.5 Prying Failure
The prying failure occurs if the transverse reinforcement is not sufficient as shown in
Specimen DS-2 (Figure 3.3b). In contrast with the lap splice failure, the prying failure occurs
even when the tension force still can transferred from column to shaft reinforcement. This is
because only the spirals at the top part of the transition were activated in the prying behavior.
When the top spirals were broken, the lower spirals were activated. This mode of failure is
similar to the zip behavior as the two rows of teeth are separated if the slider moves down.
Therefore, if the transverse reinforcement is uniformly distributed in the transition, the prying
failure still can happen. This mode of failure is represented in the proposed strut-and-tie model
when the force in tie element BC exceeds its strength.
87,400 87,450 87,500 87,550 87,600-2
0
2
4
6
8
10
12x 10
-3
X: 87526
Y: 0.004432
Data point
Str
ain
(in
./in
.)
Spiral strain - Top
Shaft bar strain - Bottom - North
yielding strain
spiral fracture
DS2

27
3.4.6 Verification of Proposed Strut-and-Tie Model
As shown above, the compression failure, anchorage failure, and lap splice failure did not
occur in the three test specimens. The tension failure (or flexural failure) happened in specimens
DS-1 and DS-3 and prying failure happened in Specimen DS-2. The criterion used to evaluate
the proposed strut-and-tie model was the magnitude of tie force BC agree with the resultant force
of spirals in the test results of the three specimens.
First, the tensile force in the spirals were calculated based on strain calculated by using
the horizontal displacement of the shaft as follows:
Under cyclic excitation, the shape of the shaft deformation was assumed as an ellipse
shape as shown in Figure 3.7. Assuming that the semi-minor axis, b, is equal to the
radius of the shaft spiral, R. The semi-major axis, a, is measured as a half of the
distance between the North and South LED marker of Optotrak.
The perimeter of the ellipse is calculated using Ramanujan’s formula as follows:
𝑝 ≈ 𝜋 [3(𝑎 + 𝑏) − √(3𝑎 + 𝑏)(𝑎 + 3𝑏)] (6-1)
The average strain of spiral is calculated as:
𝜖𝑠𝑝 =
Δ𝐿
𝐿=
𝑝 − 2𝜋𝑅
2𝜋𝑅 (6-2)

28
Figure 3.7. Section of Column-Shaft Connection Before and After Deformation
The comparison of spiral strain measured by the above method and the strains measured
by electrical strain gauges at some points are shown in Figure 3.8 and Figure 3.9 for specimens
DS-1 and DS-2. In those figures, the “calculated strain” refers to the strains calculated with the
motion capture system (Optotrak) deformation data. It indicates that the strains measured by the
above method are in good agreement with the strain gauge data.
b
a
rr
R
COLUMN
SHAFT
LED marker
LED
mar
ker
NorthSouth
Shaft spiral
Undeformed Deformed

29
Figure 3.8. Comparison of Calculated and Measured Spiral Strains – DS-1
Figure 3.9. Comparison of Calculated and Measured Spiral Strain – DS-2
-10 -8 -6 -4 -2 0 2 4 6 8 10-0.5
0
0.5
1
1.5
2
2.5DS1
Drift (%)
spiral /
yie
ld
Calculated - TOP
Measured - TOP
Calculated - MID
Measured - MID
-10 -8 -6 -4 -2 0 2 4 6 8 10-0.5
0
0.5
1
1.5
2
2.5DS2
Drift (%)
spiral /
yie
ld
Calculated - TOP
Measured - TOP
Calculated - MID
Measured - MID

30
The stresses and tensile force of shaft spirals were calculated using the stress-strain
relationship which measured in a tension test. The values of spiral force, which were calculated
using strain calculated from the Optotrak data are assumed to be the measured value, since they
gave a better strain distribution along the connection in comparison with using strain gauge data.
The comparison of the measured and calculated value of the spiral resultant force Tsp
using the proposed strut-and-tie model were shown in Figure 3.10 and Figure 3.11 for specimens
DS-1 and DS-2. The difference between the measured and calculated Tsp in specimens DS-1
and DS-2 represents the contribution of shaft concrete tensile strength. In Specimen DS-3, when
the shaft diameter was reduced, the calculated values were close to the measured values.
Figure 3.10. Spiral Resultant Force vs. Drift – DS-1
-5 -4 -3 -2 -1 0 1 2 3 4 50
10
20
30
40
50
60
70
80
90
100
Drift (%)
Tsp (
kip
s)
DS1 - Spiral Resultant force vs. Drift
Tsp - Measured
Tsp - Calculated

31
Figure 3.11. Spiral Resultant Force vs. Drift – DS-2
Specimens DS-1 and DS-3 failed because of column bars fracture after a hinge formed in
the column and the column moment strength reduced dramatically. Specimen DS-2 failed
because the top shaft spirals fractured before a hinge formed in the column. Therefore, to
determine the mode of failure of the column-shaft connection, the ratio of column moment to
column ultimate moment (i.e. moment strength which is the maximum moment measured in
specimen DS-1 and DS-3. In Specimen DS-2, moment strength is taken the same as in Specimen
DS-1 since they have the same design and material) 𝑴𝒄/𝑴𝒄,𝒖𝒍𝒕 should be compared with the
ratio of spiral resultant force to spiral ultimate force 𝑻𝒔𝒑/𝑻𝒔𝒑,𝒖𝒍𝒕. If the ratio 𝑴𝒄/𝑴𝒄,𝒖𝒍𝒕 reaches 1
first, the system fails in column. In contrast, if the ratio 𝑻𝒔𝒑/𝑻𝒔𝒑,𝒖𝒍𝒕 reaches 1 first, the system
fails in the transition. Since it is desirable to form a plastic hinge in the column when the shaft
reinforcement remains elastic, the ratio 𝑻𝒔𝒑/𝑻𝒔𝒑,𝒖𝒍𝒕 is replaced by the ratio 𝑻𝒔𝒑/𝑻𝒔𝒑,𝒚𝒊𝒆𝒍𝒅 where,
𝑻𝒔𝒑,𝒚𝒊𝒆𝒍𝒅 is the spiral resultant force when the strain of the top spiral turn reaches yielding strain.
-5 -4 -3 -2 -1 0 1 2 3 4 50
10
20
30
40
50
60
70
80
90
100
Drift (%)
Tsp (
kip
s)
DS2 - Spiral Resultant force vs. Drift
Tsp - Measured
Tsp - Calculated

32
The relationship between ratio 𝑴𝒄/𝑴𝒄,𝒖𝒍𝒕 and ratio 𝑻𝒔𝒑/𝑻𝒔𝒑,𝒚𝒊𝒆𝒍𝒅 for both measured and
calculated values are shown in Figure 3.12, Figure 3-13, Figure 3-14 for specimens DS-1 and
DS-2, and DS-3 respectively. It indicates that the predicted values of strut-and-tie model were in
good agreement with the measured values, and it could determine the mode of failure of all tests.
However, it also can be seen that even the hinge formed in the column in specimens DS-1 and
DS-3, the ratio 𝑻𝒔𝒑/𝑻𝒔𝒑,𝒚𝒊𝒆𝒍𝒅 also more than 1. It suggests that the amount of spiral designed for
these tests were still not enough to keep the transition spirals remain elastic.
Figure 3.12. Spiral Resultant Force vs. Column Moment – DS-1
-1 -0.8 -0.6 -0.4 -0.2 0 0.2 0.4 0.6 0.8 10
0.2
0.4
0.6
0.8
1
1.2
1.4
1.6
1.8
2
Mc/Mcult
Tsp/T
sp y
ield
DS1 - Spiral Resultant Force vs. Column Moment
Measured
Calculated

33
Figure 3-13. Spiral Resultant Force vs. Column Moment – DS-2
Figure 3-14. Spiral Resultant Force vs. Column Moment – DS-3
-1 -0.8 -0.6 -0.4 -0.2 0 0.2 0.4 0.6 0.8 10
0.2
0.4
0.6
0.8
1
1.2
1.4
1.6
1.8
2
Mc/Mcult
Tsp/T
sp y
ield
DS2 - Spiral Resultant Force vs. Column Moment
Measured
Calculated
-1 -0.8 -0.6 -0.4 -0.2 0 0.2 0.4 0.6 0.8 10
0.2
0.4
0.6
0.8
1
1.2
1.4
1.6
1.8
2
Mc/Mcult
Tsp/T
sp y
ield
DS3 - Spiral Resultant Force vs. Column Moment
Measured
Calculated

34
CHAPTER 4
EXPERIMENTS AND ANALYSES OF CONCRETE FILLED STEEL TUBE
CONNECTIONS
4.1 INTRODUCTION
Concrete filled steel tubes (CFSTs) are composite structural elements which provide
large strength and stiffness while permitting accelerated bridge construction (ABC). The steel
tube serves as formwork and reinforcement to the concrete fill, negating the need for reinforcing
cages, shoring, and temporary formwork. In relation to ABC, the placement of the concrete fill
may be further enhanced using self-consolidating concrete (SCC), so that concrete vibration is
not required.
The steel tube is placed at the optimal location to resist bending forces, thereby
maximizing strength and stiffness while minimizing weight and material requirements. In
addition, the steel tube provides optimal confinement and much greater shear strength than spiral
reinforcement, which is typically used for circular reinforced concrete columns. In addition, the
concrete fill restrains local tube buckling, supports compressive stress demands, and offers large
stiffness to meet functionality seismic performance objectives and non-seismic load
requirements. Shear stress transfer must occur between the steel tube and concrete fill to ensure
full composite action, which increases efficiency, resistance, and ductility, all of which are
desirable properties for seismic design (Roeder et al. 1999; Roeder et al. 2009; Roeder et al.
2010; Lehman and Roeder, 2012; Brown et al. 2013).
Although CFSTs offer many advantages in rapid construction and improved structural
performance, connections between CFSTs are often different and more complex than those used

35
in steel or reinforced concrete construction due to the composite nature of CFSTs. Prior
numerical and experimental research resulted in straight forward design and corresponding
expressions for an embedded column-to-foundation connection (Lehman and Roeder, 2012).
Results from that research are presented briefly here. The primary focus of this paper is the
development and experimental investigation of robust CFST column-to-cap beam connections
capable of sustaining cyclic lateral loads while minimizing damage and degradation. The study
focus is on precast bent caps, since this benefits ABC, and practical design expressions are
developed for these connections based upon the experimental research.
4.2 CFST COLUMN-TO-FOUNDATION CONNECTION
A foundation connection in which the steel tube is embedded into the foundation concrete
has previously been developed, and is illustrated in Fig. 4.1 (Kingsly, 2005; Chronister, 2007;
Williams, 2006; Lee, 2011; Lehman and Roeder, 2012). This connection is capable of
transferring the plastic moment capacity of the CFST, and can provide large lateral deformation
capacities when appropriately designed as is illustrated by hysteresis in Fig. 4.2. The connection
employs an annular ring which is welded to the base of the steel tube, and projects both inside
and outside of the steel tube to provide anchorage and efficient shear and moment transfer to the
surrounding concrete and reinforcement, as is illustrated by the compression struts in Fig. 4.1a.
There are no internal shear connectors, dowels, or reinforcing bars penetrating from the tube into
the foundation; the force transfer is solely accomplished by the anchorage provided by the tube.
The foundation is designed to normal depth, design loads, and flexural reinforcement.
Two methods for constructing the foundation connection have been developed and
experimentally evaluated; a monolithic method in which the steel tube and annular ring are
temporarily supported in the foundation concrete and the foundation and CFST column are cast

36
simultaneously and a grouted method in which the construction of foundation and CFST column
are isolated (illustrated in Fig. 4.1b). The second method achieves the objectives of ABC by
separating the construction of the foundation from the construction of the CFST column. Using
this method, the footing is cast with a recess formed by a light weight corrugated pipe with an
inner diameter slightly larger than the outer diameter of the annular ring as shown in Fig. 4.1b.
The tube and ring are placed into the void after the foundation is cast, and the recess between the
tube and corrugated pipe is filled with high strength fiber reinforced grout to anchor the column
into the foundation. The fiber reinforced grout used in the connection should be non-shrinkage
according to ASTM C 1107, and should meet durability requirements according to ASTM C666
and ASTM C1012. These requirements are specified in NCHRP Report 681 for emulative
grouted connections in precast construction (Restrepo et al. 2011).
Detailed information regarding the grout and fiber properties as well as mixing and
construction procedures are provided in reference material (Kingsly, 2005; Chronister, 2007;
Williams, 2006; Lee, 2011). For both options, the steel tube is filled with low shrinkage self-
consolidating concrete to complete the CFST column, and no vibration is required (Lehman and
Roeder, 2012).
Figure 4.1. CFST Column-to-Foundation Connection
37
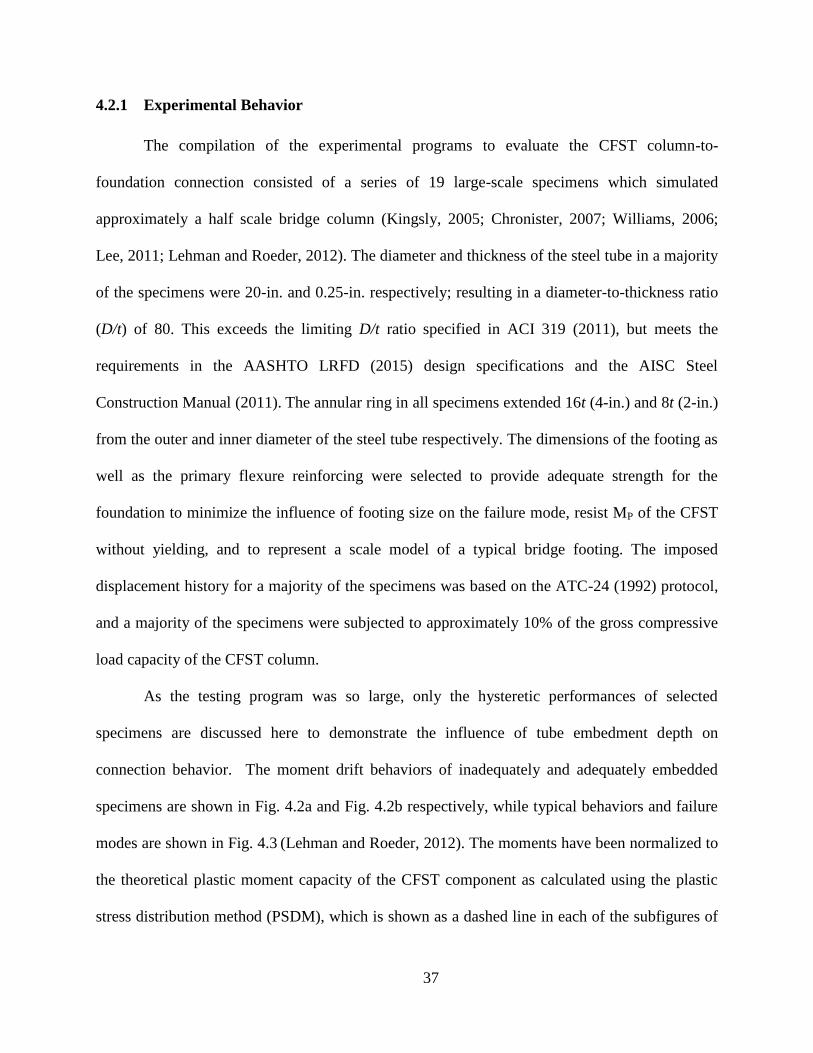
4.2.1 Experimental Behavior
The compilation of the experimental programs to evaluate the CFST column-to-
foundation connection consisted of a series of 19 large-scale specimens which simulated
approximately a half scale bridge column (Kingsly, 2005; Chronister, 2007; Williams, 2006;
Lee, 2011; Lehman and Roeder, 2012). The diameter and thickness of the steel tube in a majority
of the specimens were 20-in. and 0.25-in. respectively; resulting in a diameter-to-thickness ratio
(D/t) of 80. This exceeds the limiting D/t ratio specified in ACI 319 (2011), but meets the
requirements in the AASHTO LRFD (2015) design specifications and the AISC Steel
Construction Manual (2011). The annular ring in all specimens extended 16t (4-in.) and 8t (2-in.)
from the outer and inner diameter of the steel tube respectively. The dimensions of the footing as
well as the primary flexure reinforcing were selected to provide adequate strength for the
foundation to minimize the influence of footing size on the failure mode, resist MP of the CFST
without yielding, and to represent a scale model of a typical bridge footing. The imposed
displacement history for a majority of the specimens was based on the ATC-24 (1992) protocol,
and a majority of the specimens were subjected to approximately 10% of the gross compressive
load capacity of the CFST column.
As the testing program was so large, only the hysteretic performances of selected
specimens are discussed here to demonstrate the influence of tube embedment depth on
connection behavior. The moment drift behaviors of inadequately and adequately embedded
specimens are shown in Fig. 4.2a and Fig. 4.2b respectively, while typical behaviors and failure
modes are shown in Fig. 4.3 (Lehman and Roeder, 2012). The moments have been normalized to
the theoretical plastic moment capacity of the CFST component as calculated using the plastic
stress distribution method (PSDM), which is shown as a dashed line in each of the subfigures of

38
Fig. 4.2. This method is illustrated in reference material (AASHTO, 2015). In summary, the
ductility of inadequately embedded connections was ultimately limited by foundation damage
due to a conical pullout of the CFST from the foundation, as shown in Fig. 4.3a. In general, the
failure mode of adequately embedded connections was characterized by ductile tearing of the
steel tube which initiated as a result of local tube buckling as is illustrated in Fig. 4.3c.
Furthermore, adequately embedded specimens exhibited a minimal decrease in resistance as a
result of severe local buckling which generally initiated at around 4% drift, and had virtually no
foundation damage at the end of testing as is shown in Fig. 4.3b. The drift levels achieved by the
adequately embedded specimens at failure are significantly larger than those observed from
similar size reinforced concrete pier and column base connections (Kingsly, 2005; Chronister,
2007; Williams, 2006; Lee, 2011; Lehman and Roeder, 2012).
Figure 4.2. Typical Moment-Drift Response from Adequately and Inadequately Embedded
Specimens6

39
Figure 4.3. Photos of Foundation Connection Behavior6
4.2.2 Design Expressions
The experimental results were used to develop design expressions for a CFST column-to-
foundation connection capable of transferring the full moment capacity of the CFST.
Specifically, expressions were developed to dimension and detail the annular ring, determine the
required embedment depth of the tube to eliminate the conical pullout failure mode, and to
determine the required depth of concrete below to the tube to prevent concrete punching failure.
These expressions are not discussed here for brevity; however detailed explanations are available
in reference material (Lehman and Roeder, 2012).
4.3 CFST COLUMN-TO-CAP BEAM CONNECTION
While the numerical and experimental analyses conducted on the CFST foundation
connection resulted in design expressions to support the use of CFST columns in highway
bridges, full realization of the system requires the development of a range of cap beam
connections. This connection offers unique challenges including congested joint reinforcing and
limits on the width and height of the cap beam, which are parameters that have not been
previously evaluated. Furthermore, the optimization of ABC requires exploring connections
which are compatible with precast superstructure elements. To achieve these objectives, the
continuing phase of this research is focused on the development robust CFST cap beam

40
connections capable of sustaining cyclic lateral load demands while mitigating damage and
degradation.
The proposed CFST column-to-cap beam connections are illustrated in Fig. 4.4. There
are three connection types: (1) embedded ring connections (Fig. 4.1a), (2) welded dowel
connections (Fig. 4.1b), and (3) reinforced concrete connections (Fig. 4.3c). This provides a suite
of connections for designers, each option offering advantages as the project may require.
Figure 4.4. Proposed CFST Column-to-Precast Cap Beam Connections. (a) Embedded Ring
Connection (ER), (b) Welded Dowel Connection (WD), and (c) Reinforced Concrete Connection
(RC)
Fig. 4.4a shows a full strength embedded ring connection (herein referred to as ER); this
connection is similar to the embedded flange column-to-foundation connection evaluated in
previous research (Lehman and Roeder, 2012). The connection uses a grouted connection detail,
with a void cast into a precast cap beam. A circular ring is welded to the steel tube to provide
anchorage and transfer stress to the concrete and reinforcing in the cap beam. The flange extends
a distance 8 times the thickness of the tube (8t) both inside and outside of the tube. The external
projection of 8t is smaller than previous recommendations for the embedded foundation
connection (Lehman and Roeder, 2012). The precast cap beam is placed onto the column after

41
the column is set, and the recess between the tube and corrugated pipe is filled with high strength
fiber reinforced grout.
The connections illustrated in Fig. 4.4b – Fig. 4.4d utilize T-headed reinforcing dowels
that extend from the CFST column into the cap beam to provide axial, moment, and shear
transfer. These connections can be integrated into precast elements using a void similar to that
described for the grouted CFST connection as shown in Fig. 4.4b – Fig. 4.4d.
Fig. 4.4b shows a welded dowel connection (herein referred to as WD). The WD
connection utilizes headed dowels to resist the flexural demand. The shear transfer to the tube is
accomplished by welding the dowels to the steel tube using a flare bevel groove weld as
illustrated in Fig. 4.5. The dowels are developed into the cap beam using a high-strength, fiber-
reinforced grouted connection. Welding the dowel directly to the tube, as opposed to embedding
the dowel directly into the connection maximizes the moment capacity of the dowel connection.
A soffit fill depth is included between the steel tube and cap beam. An annular ring with an outer
diameter of D+8t is welded to the exterior of the steel tube to increase compressive bearing area
on the soffit fill. As illustrated in Fig. 4.4b, the dowels can be de-bonded in the column-to-cap
beam interface region to increase the deformation capacity of the connection.
Figure 4.5. Flare Bevel Groove Weld Between Longitudinal Dowel and Steel Tube

42
Fig. 4.4c shows a reinforced concrete connection (referred to as RC connection) in which
a short independent cage for both transverse and longitudinal reinforcing extends from the CFST
column into the cap beam, and cover is provided between the reinforcing cage and steel tube
within the column. A gap is left between the steel tube and cap beam to help focus the plastic
hinging location between the CFST component and the cap beam (Stephens et al. 2015).
4.3.1 Specimen Design
Eight large scale specimens were designed to experimentally evaluate the performance of
the proposed connections under constant axial and reversed cyclic lateral loading. Two sets of
specimens were designed and constructed; one set to evaluate the performance for loading in the
transverse direction of the bridge, and one set to evaluate performance for loading in the
longitudinal direction of the bridge. Specimen geometries are illustrated in Fig. 4.6 and Fig. 4.7
for loading in the transverse and longitudinal directions respectively, while specimen cross
sections in the connection region are illustrated in Fig. 4.8.
Figure 4.6. Transverse Study Region and Scaled Specimen Geometry.

43
Figure 4.7. Longitudinal Study Region and Scaled Specimen Geometry
Four 20-in. diameter and one 24-in. diameter CFSTs were selected to evaluate the
performance of the proposed connections for loading in the transverse direction (resulting in
scale factors of 48% and 57%, respectively), while two 25.75-in. CFST and one 24-in. diameter
CFST were selected to evaluate performance for loading in the longitudinal direction (resulting
in scale factors of 61% and 57%, respectively). All tubes had a thickness of 0.25-in, resulting in
D/t ratios of 80, 96, and 103 for the 20-in, 24-in, and 25.75-in. tubes, respectively. Specimen
nomenclature used here refers to the connection type, as illustrated in Fig. 4, followed by the D/t
ratio, and a letter to denote the direction of loading (T for transverse and L for longitudinal), i.e.,
ER96T describes an embedded connection with D/t = 96 for loading in the transverse direction
of the bridge.
All of the specimens were constructed using pre-cast cap beams cast with a recess formed
by light-gauge corrugated metal pipe, and the columns were grouted into place using high
strength fiber reinforced grout. The specimens were cantilever columns anchored into a cap
beam as illustrated in Fig. 4.6 and Fig. 4.7. Specimen cross sections in the connection region are

44
illustrated in Fig. 4.8. Joint shear reinforcing in the welded dowel and reinforced concrete
connection specimens was scaled from a prototype bridge and checked against the California
Department of Transportation Seismic Design Criteria (2013), while vertical shear reinforcing in
the joint region of the cap beam for the ER connection was designed according to
recommendations provided in reference material4. Flexural reinforcement in the cap beam was
designed to resist 1.2 times the theoretical flexural strength of the CFST columns.
Figure 4.8. Column Cross Sections in Connection Region
4.3.1.1 Embedded Ring (ER) Connection
Two transverse and two longitudinal specimens were designed to evaluate the
performance of the proposed ER CFST column-to-cap beam connection. The specimens were
designed: (1) to investigate the performance for smaller cap beam widths than had previously
been evaluated for the embedded foundation connection, (2) to evaluate a smaller exterior
annular ring projection of 8t (in contrast to 16t that had been used on the prior foundation
connections studied), (3) to evaluate the influence of using API or ASTM grade tube steel, (4) to
compare a straight seam and spirally welded tube, and (5) to evaluate the performance for
loading in the transverse and longitudinal direction of the bridge.
Specimen ER80T was designed with embedment depth of 18-in. (0.9D), and utilized a
61-ksi ASTM A1018 spiral welded steel tube with an annular ring with a 2-in. projection both
inside and outside of the tube. Specimens ER96T and ER96L were embedded 20-in (0.83D) into
the cap beam (note the lesser relative embedment depth was possible because of the lower steel

45
strength), and both utilized a 53-ksi API 5L X-42 grade straight seam tube with an annular ring
that projected 51-mm (2-in.) inside and outside of the tube. Specimen ER103L was embedded
20.25-in. (0.8D) into the cap beam, and utilized a 69.3-ksi ASTM A1018 spiral welded steel tube
with an annular ring with a projection of 2-in. inside and outside of the tube.
4.3.1.2 Welded Dowel (WD) Connection
Three specimens were designed using the welded dowel connection detail: one specimen
with fully bonded bars (WD80T1), and two specimens with bars de-bonded along the length
(WD80T2 and WD103L). In all cases, the longitudinal reinforcing in the connection region was
selected with a target longitudinal reinforcing ratio of 3%, resulting in eight evenly distributed
No. 9 bars in WD80T1 and WD80T2 and ten evenly distributed No. 11 bars in WD103L as
illustrated in Fig. 4.8. The bars in all welded dowel specimens were embedded 12db into the cap
beam per ACI 318 requirements for the development of headed reinforcing bars (ACI, 2011),
and 24db into the CFST column. The bars were welded to the inside of the steel tubes using flare
bevel groove welds formed by requirements of AWS D1.4 designed to exceed Fub, where Fub is
the ultimate steel strength of the reinforcing bars. All of the specimens used flanges that
projected 2-in. from the exterior of the steel tube and a 1-in. thick soffit fill, which extended
below the surface of the cap beam. Specimen WD103L also included transverse No. 5 hoops
with the intention of providing additional confinement to the soffit fill and joint region. PVC
pipe was used to de-bond the longitudinal reinforcing bars in specimens WD80T2 and WD103L
for lengths of 22-in. and 24-in., respectively. The de-bonded lengths were calculated using a
moment-curvature analysis to achieve a connection rotation demand of 10% drift prior to
fracture of the longitudinal reinforcing.
46
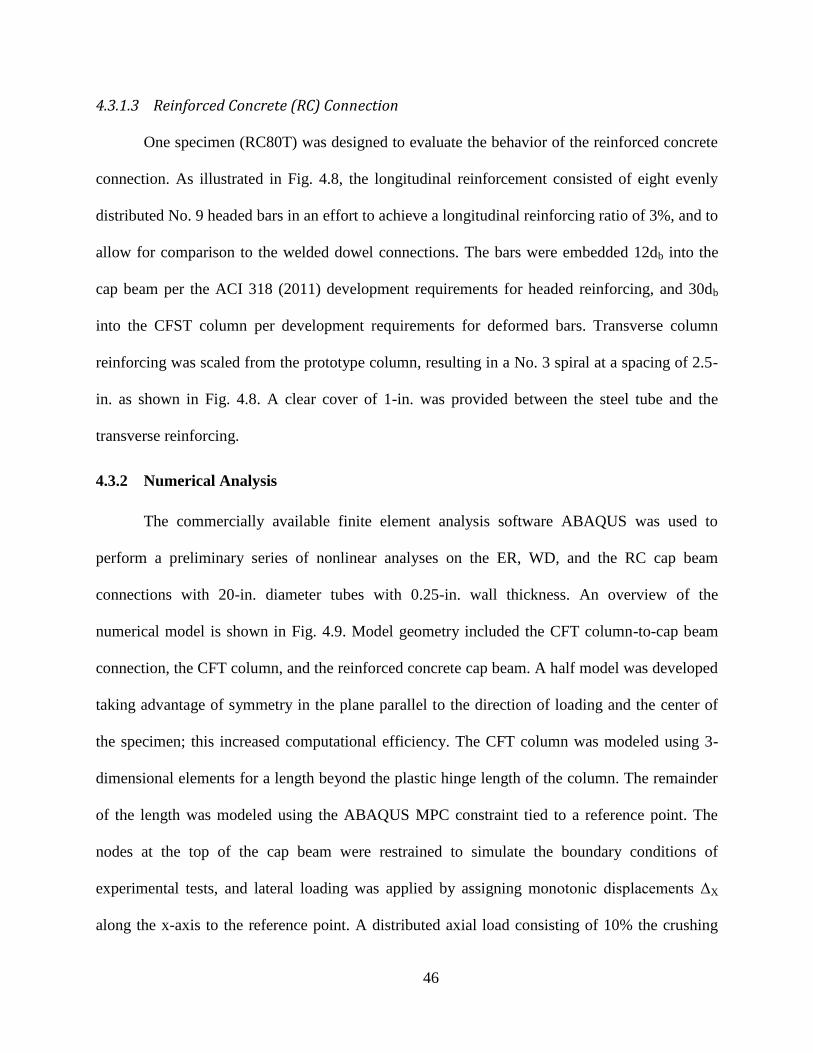
4.3.1.3 Reinforced Concrete (RC) Connection
One specimen (RC80T) was designed to evaluate the behavior of the reinforced concrete
connection. As illustrated in Fig. 4.8, the longitudinal reinforcement consisted of eight evenly
distributed No. 9 headed bars in an effort to achieve a longitudinal reinforcing ratio of 3%, and to
allow for comparison to the welded dowel connections. The bars were embedded 12db into the
cap beam per the ACI 318 (2011) development requirements for headed reinforcing, and 30db
into the CFST column per development requirements for deformed bars. Transverse column
reinforcing was scaled from the prototype column, resulting in a No. 3 spiral at a spacing of 2.5-
in. as shown in Fig. 4.8. A clear cover of 1-in. was provided between the steel tube and the
transverse reinforcing.
4.3.2 Numerical Analysis
The commercially available finite element analysis software ABAQUS was used to
perform a preliminary series of nonlinear analyses on the ER, WD, and the RC cap beam
connections with 20-in. diameter tubes with 0.25-in. wall thickness. An overview of the
numerical model is shown in Fig. 4.9. Model geometry included the CFT column-to-cap beam
connection, the CFT column, and the reinforced concrete cap beam. A half model was developed
taking advantage of symmetry in the plane parallel to the direction of loading and the center of
the specimen; this increased computational efficiency. The CFT column was modeled using 3-
dimensional elements for a length beyond the plastic hinge length of the column. The remainder
of the length was modeled using the ABAQUS MPC constraint tied to a reference point. The
nodes at the top of the cap beam were restrained to simulate the boundary conditions of
experimental tests, and lateral loading was applied by assigning monotonic displacements ΔX
along the x-axis to the reference point. A distributed axial load consisting of 10% the crushing

47
load of the CFT was applied to the bottom of the concrete and steel tube using the pressure load
option in ABAQUS.
Figure 4.9. (a) Numerical Model Overview, (b) ER Connection, (c) WD Connection, and (d) RC
Connection.
Four-node shell elements with reduced integration (ABAQUS element type S4R), 2-node
truss elements (ABAQUS element type T3D2), 2-node beam elements (ABAQUS element type
B31), and 8-node solid elements with reduced integration (ABAQUS element type C3D8R) were
used to model steel tube, cap beam reinforcing steel, connection reinforcing steel (for WRC,
WRCUB, and EMBRC), and concrete elements, respectively. Gap elements were used at every
nodal point that was geometrically common the steel tube and concrete fill elements to simulate
bond stress between the concrete by combining the confining contact stress with a coefficient of
friction to develop shear stresses at the interface; penetration of the concrete element by the steel
element was prevented. The reinforcing steel and concrete components in the cap beam were
spatially assembled, and interactive constraint relationships were defined using the ABAQUS
Embedded constraint to perfectly embed the cap beam reinforcement in the cap beam concrete.

48
4.3.2.1 Connection Type
Moment-drift relationships for the differing connection types are plotted in Fig. 4.10a,
while inelastic deformations at 10% drift are plotted in Fig. 4.10b. The moments have been
normalized to the plastic moment capacity of the CFT calculated using the PSDM to allow for
comparison. The plastic strain for all connection types was isolated to the connection region with
limited inelastic deformation in the cap beam. Although the yielding mechanism in the WD and
RC connections was characterized by inelastic deformation in the column reinforcing, these
connections did not achieve the plastic moment capacity of the CFT due to lower effective
longitudinal reinforcing ratios. Additionally, the RC connection did not provide as much strength
as the WD connections due to a smaller moment arm.
Figure 4.10. (a) Numerical Moment-Drift Behaviors and (b) Accumulated Plastic Concrete
Strain at 10% Drift for the Proposed Connection Types
4.3.3 Experiments
The proposed connection types were experimentally evaluated in the structural testing lab
at the University of Washington (Stephens et al. 2015). Specimen geometry was consistent with
that defined in Fig. 4.6 and Fig. 4.7. The specimens were tested using a self-reacting test frame
with a horizontal actuator to apply the lateral load and a Baldwin Universal Testing Machine
(UTM) to apply a constant vertical lateral load as shown in Fig. 4.11.
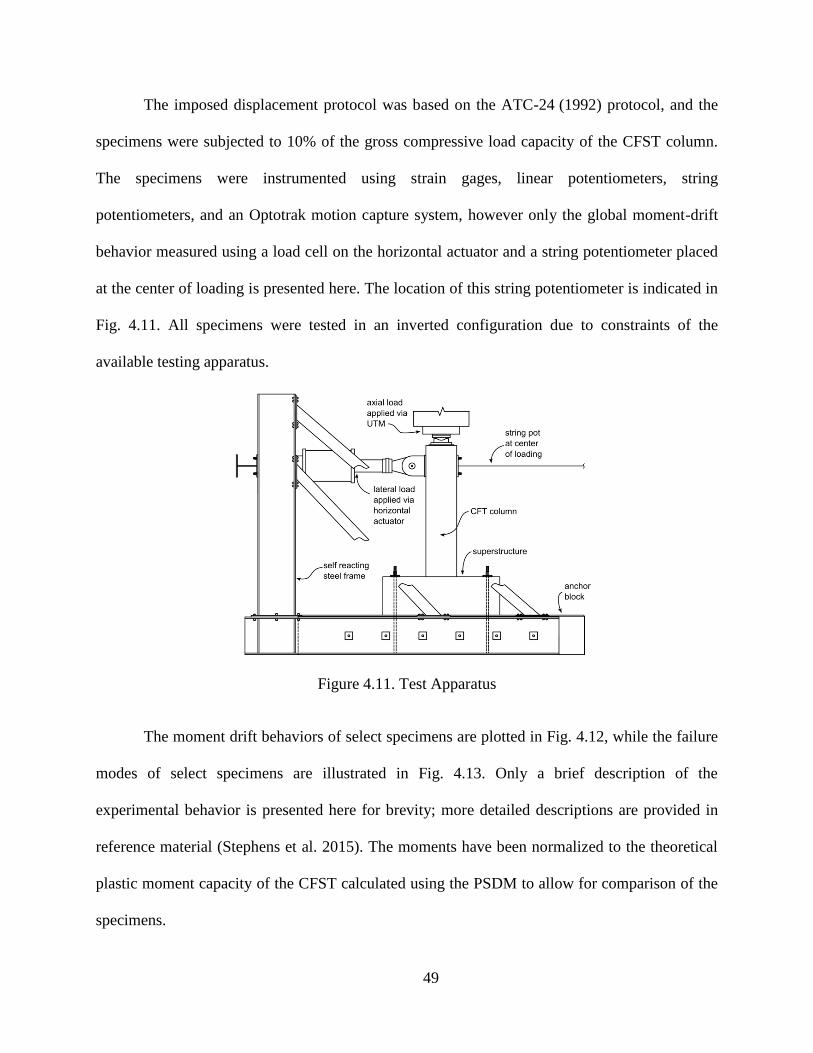
49
The imposed displacement protocol was based on the ATC-24 (1992) protocol, and the
specimens were subjected to 10% of the gross compressive load capacity of the CFST column.
The specimens were instrumented using strain gages, linear potentiometers, string
potentiometers, and an Optotrak motion capture system, however only the global moment-drift
behavior measured using a load cell on the horizontal actuator and a string potentiometer placed
at the center of loading is presented here. The location of this string potentiometer is indicated in
Fig. 4.11. All specimens were tested in an inverted configuration due to constraints of the
available testing apparatus.
Figure 4.11. Test Apparatus
The moment drift behaviors of select specimens are plotted in Fig. 4.12, while the failure
modes of select specimens are illustrated in Fig. 4.13. Only a brief description of the
experimental behavior is presented here for brevity; more detailed descriptions are provided in
reference material (Stephens et al. 2015). The moments have been normalized to the theoretical
plastic moment capacity of the CFST calculated using the PSDM to allow for comparison of the
specimens.
50
The ER connections exhibited larger stiffness and comparable strength to the WD
connections. The larger stiffness of the embedded connection specimens is a result of the
location of the tube as well as the confinement of the concrete fill. The comparable strengths are
a result of the fact that the ER and WD connections had similar effective reinforcing ratios and
moment arms. The RC connection developed significantly less resistance than the RC or WD
connections due to a significantly smaller moment arm. The failure mode of all the ER
connections was characterized by ductile tearing of the steel tube near the CFST column-to-cap
beam interface as illustrated in Fig. 4.13a. These connections exhibited local buckling near this
interface at drift ratios ranging from 3%-4%, however this did not influence the lateral load
carrying capacity of the CFST column. In general, the welded dowel connections exhibited large
ductility, however the failure modes of WD80T1 and WD80T2 was ultimately characterized by
cap beam failure as illustrated in Fig. 4.13b. WD103L was cycled to 12% drift with no decrease
in resistance or damage to the superstructure. The final state of specimen WD103L is illustrated
in Fig. 4.13c. No bar buckling and only limited soffit crushing was observed in this specimen, as
the transverse hoops in the joint region provided confinement. Note that transverse hoops were
not included in the WD80T1 and WD80T2 specimens. The failure mode of the EDC connection
was characterized by bar fracture and soffit crushing as illustrated in Fig. 4.13d, as six out of the
eight connection bars fractured during cycling from 10% to 12% drift, and limited cap beam
damage was observed.

51
Figure 4.12. Experimental Moment-Drift Behaviors
Figure 4.13. Final State of Select Specimens
52
CHAPTER 5
DESIGN EXPRESSIONS FOR CFST CONNECTIONS
The experimental results and observations from the CFST tests were used to develop
practical engineering expressions for the proposed CFST column-to-cap beam connections. The
connection should be designed as one of the following options:
1. An embedded CFST connection (ER connection) in which the CFST column is
embedded into the cap beam as illustrated in Fig. 4.4a and Fig. 5.1.
2. A welded dowel connection (WD connection) in which a ring of partially deboned
vertical headed reinforcing bars are welded inside the CFST column and extend into the
cap beam as illustrated in Fig. 4.4b and Fig. 5.4.
3. A grouted dowel connection (RC connection) in which a ring of headed reinforcing bars
is developed into the steel tube and extend into the cap beam.
Each of these options can be employed using cast-in-place (CIP) or precast super-
structure cap beam. For precast construction, a void must be included in the precast elements
through use of a corrugated pipe, which meets the specifications outlined below. The following
sections summarize design expressions for the ER and WD connection types. Design of the RC
connection is very similar to that of a jacked reinforced concrete column, and has thus been
omitted here. Additional information on design can be found in reference material (Stephens et
al. 2015).
5.1 MATERIALS
Materials for the specified connections shall conform to the Caltrans standards (2013),
with several specific provisions included in this section.

53
5.1.1 Grout
When precast components are used, the fiber-reinforced grout consisting of prepackaged,
cementitious grout and meeting ASTM C-1107 for grades A, B, and C non-shrink grout is used.
The grout conforms to several additional performance requirements including compressive
strength, compatibility, constructability, and durability. The 28-day grout strength f’g must
exceed f’c of the surrounding concrete components. Grout using metallic formulations shall not
be permitted, and grout shall be free of chlorides. No additives should be added to pre-packaged
grout. These requirements ensure the grout has properties that provide adequate strength and
longevity. These requirements adapted from recommendations provided in NCHRP Report 651
(Restrepo et al. 2011).
5.1.2 Fiber Reinforcing
Macro polypropylene fiber with a minimum volume of 0.2% is included to provide crack
resistance and bounding characteristics between the tube and corrugated metal duct. Test results
to date have not evaluated the use of alternative fibers such as steel fibers.
5.1.3 Corrugated Metal Duct
Corrugated metal ducts are used to provide voids in precast components. The ducts are
galvanized steel according to ASTM A653. Duct diameter is selected based on construction
tolerances. Plastic ducts should not be used as the purpose of the ducts it to be a bond crack
arrestor, act as confinement and provide shear transfer from the grout to the outer concrete. The
use of corrugated metal ducts for grouted connections is supported by this research as well as a
wealth of seismic precast connection data (Lehman and Roeder, 2012; Restrepo et al. 2011).

54
5.1.4 Reinforcement
Reinforcing in the connection region shall conform to ASTM A706 Gr. 60 (or Gr. 80 if
allowed) requirements for weldable reinforcing. ASTM A706 places restrictions on the chemical
composition of reinforcing bars to enhance welding properties.
5.1.5 CFST Tube Steel
Steel tubes may either be straight seam or spiral welded and must conform to either
ASTM 1018 or API 5L requirements. Spiral welded tubes must be welded using a double
submerged arc welding process, and weld metal properties must match properties of the base
metal and meet minimum toughness requirements of AISC demand critical welds13
.
Selection of tube material designation (ASTM 1018 or API 5L) plays a role in the
ductility of the full strength embedded CFT connection. API 5L grade steel has more strict
requirements regarding chemical composition than ASTM 1018 steel, and can therefore provide
additional ductility for both spiral welded and straight seam tubes (Stephens et al. 2015).
5.2 EMBEDDED RING CONNECTION
The embedded ring connection utilizes a CFST fully embedded into the cap beam. The
CFST pier or column controls the strength and ductility of this connection type, not the cap beam
or other superstructure components. The precast cap is placed on the column after the concrete
fill is set, and the recess between the tube and corrugated pipe is filled with high strength fiber
reinforced grout as shown in Fig. 5.1.

55
Figure 5.1. Embedded Ring Connection
5.2.1 Annular Ring
The annular ring is welded to tube using complete joint penetration welds or fillet welds
on both the inside and outside of the column designed to transfer the full strength of the tube to
provide anchorage and stress transfer. The ring is made of steel of the same thickness and similar
yield stress as the steel tube. The ring extends into and out from the tube 8 times the tube
thickness to provide adequate anchorage as shown in Fig. 5.1.
5.2.2 Embedment Depth
The required embedment depth, Le, of the CFST was determined using a conical pullout
model discussed in detail in reference material (Stephens et al. 2015). The required embedment
depth to eliminate the potential for cap beam failure is given in Equation 5.1 as:
𝐿𝑒 ≥ √𝐷𝑜
2
4+
𝐷𝑡𝐹𝑢,𝑠𝑡
6√𝑓′𝑐,𝑐𝑎𝑝
−𝐷𝑜
2 (𝑝𝑠𝑖) [5.1]
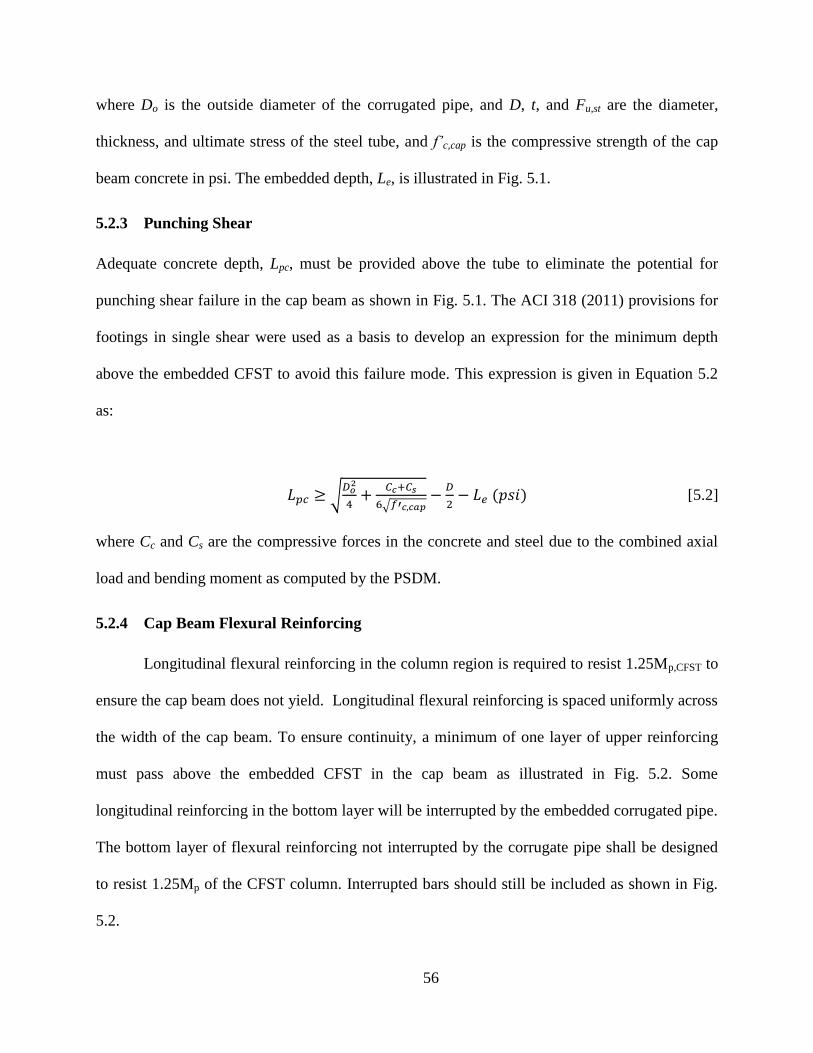
56
where Do is the outside diameter of the corrugated pipe, and D, t, and Fu,st are the diameter,
thickness, and ultimate stress of the steel tube, and f’c,cap is the compressive strength of the cap
beam concrete in psi. The embedded depth, Le, is illustrated in Fig. 5.1.
5.2.3 Punching Shear
Adequate concrete depth, Lpc, must be provided above the tube to eliminate the potential for
punching shear failure in the cap beam as shown in Fig. 5.1. The ACI 318 (2011) provisions for
footings in single shear were used as a basis to develop an expression for the minimum depth
above the embedded CFST to avoid this failure mode. This expression is given in Equation 5.2
as:
𝐿𝑝𝑐 ≥ √𝐷𝑜
2
4+
𝐶𝑐+𝐶𝑠
6√𝑓′𝑐,𝑐𝑎𝑝−
𝐷
2− 𝐿𝑒 (𝑝𝑠𝑖) [5.2]
where Cc and Cs are the compressive forces in the concrete and steel due to the combined axial
load and bending moment as computed by the PSDM.
5.2.4 Cap Beam Flexural Reinforcing
Longitudinal flexural reinforcing in the column region is required to resist 1.25Mp,CFST to
ensure the cap beam does not yield. Longitudinal flexural reinforcing is spaced uniformly across
the width of the cap beam. To ensure continuity, a minimum of one layer of upper reinforcing
must pass above the embedded CFST in the cap beam as illustrated in Fig. 5.2. Some
longitudinal reinforcing in the bottom layer will be interrupted by the embedded corrugated pipe.
The bottom layer of flexural reinforcing not interrupted by the corrugate pipe shall be designed
to resist 1.25Mp of the CFST column. Interrupted bars should still be included as shown in Fig.
5.2.

57
5.2.5 Joint Region Shear Reinforcing
Vertical reinforcing, Asjv, shall be included in the joint region according to Equation 5.3,
where Ast is the total area of the steel tube embedded into the cap beam, and Asjv is the total area
of vertical reinforcing required within a distance Le from the outer diameter of the corrugated
pipe when a precast cap beam is used. Derivation of this equation is given in reference material
(Stephens et al. 2015).
𝐴𝑠𝑗𝑣
= 0.65𝐴𝑠𝑡 [5.3]
Vertical stirrups or ties are distributed uniformly within a distance D/2+LE extending
from the column centerline as shown in Fig. 5.3a. These stirrups can be used to meet other
requirements documented elsewhere including shear in the bent cap.
Figure 5.2. Cap Beam Details for Embedded Connection
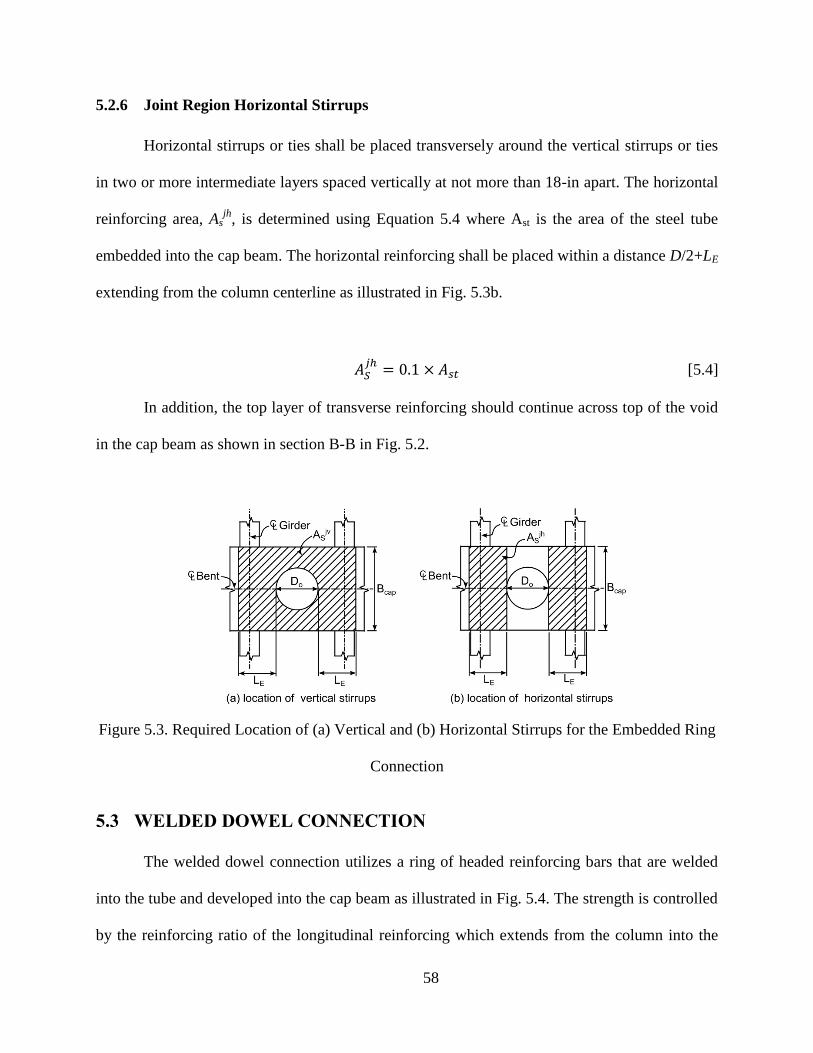
58
5.2.6 Joint Region Horizontal Stirrups
Horizontal stirrups or ties shall be placed transversely around the vertical stirrups or ties
in two or more intermediate layers spaced vertically at not more than 18-in apart. The horizontal
reinforcing area, Asjh
, is determined using Equation 5.4 where Ast is the area of the steel tube
embedded into the cap beam. The horizontal reinforcing shall be placed within a distance D/2+LE
extending from the column centerline as illustrated in Fig. 5.3b.
𝐴𝑆𝑗ℎ
= 0.1 × 𝐴𝑠𝑡 [5.4]
In addition, the top layer of transverse reinforcing should continue across top of the void
in the cap beam as shown in section B-B in Fig. 5.2.
Figure 5.3. Required Location of (a) Vertical and (b) Horizontal Stirrups for the Embedded Ring
Connection
5.3 WELDED DOWEL CONNECTION
The welded dowel connection utilizes a ring of headed reinforcing bars that are welded
into the tube and developed into the cap beam as illustrated in Fig. 5.4. The strength is controlled
by the reinforcing ratio of the longitudinal reinforcing which extends from the column into the

59
cap beam. The welded detail is designed to carry the full strength of the reinforcing bar. The
advantage of this connection is a shorter embedment length into the CFST column and a
maximized moment arm. Design of this connection shall conform to requirements in the Caltrans
standards (Caltrans, 2013), with several specific provisions included below.
Figure 5.4. Welded Dowel Connection
5.3.1 Annular Ring
The annular ring is welded to end of the steel tube to provide a larger area to transfer
compressive stress from the steel tube into the soffit fill. In this connection the ring does not
transfer tensile stresses but does provide some compressive force transfer. The ring is made from
steel of the same thickness and yield strength as the steel tube. The ring projects outside of the
steel tube a distance 8 times the thickness of the steel tube as illustrated in Fig. 5.4.
5.3.2 Length Dowels Extend into the Cap Beam and Column
The headed reinforcing extends into the cap beam to fully develop the longitudinal
dowels while also eliminating the potential for a conical pullout failure. The headed dowels must
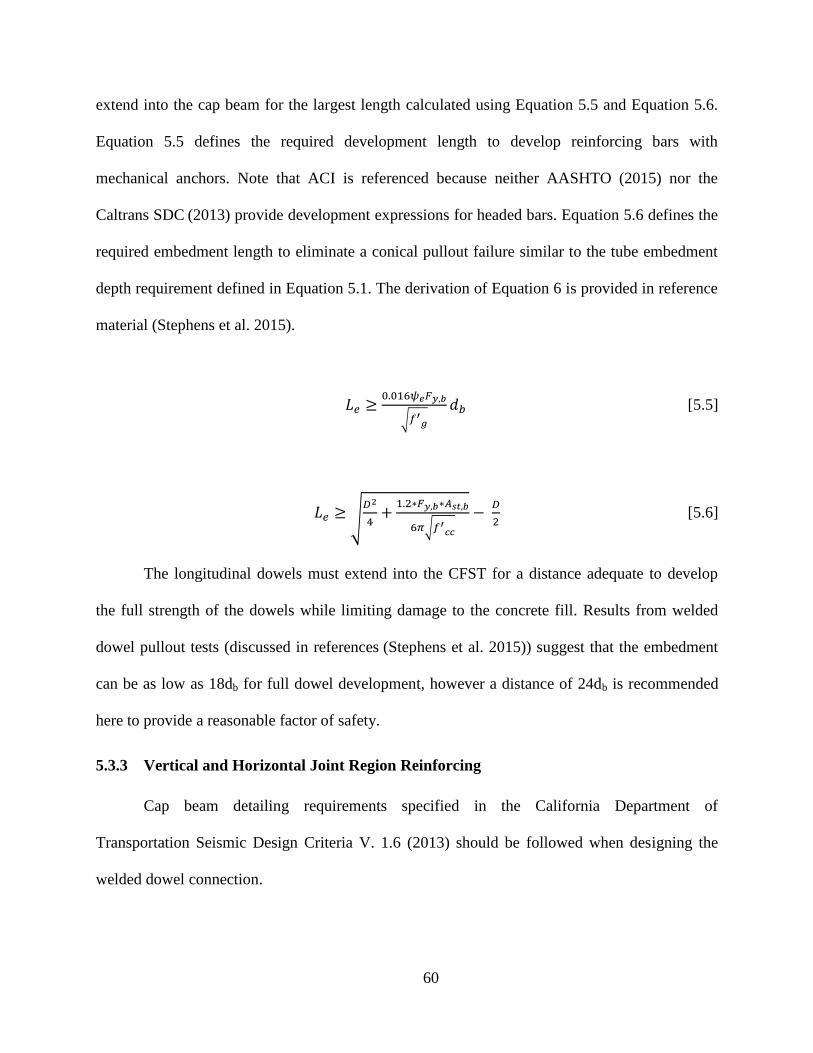
60
extend into the cap beam for the largest length calculated using Equation 5.5 and Equation 5.6.
Equation 5.5 defines the required development length to develop reinforcing bars with
mechanical anchors. Note that ACI is referenced because neither AASHTO (2015) nor the
Caltrans SDC (2013) provide development expressions for headed bars. Equation 5.6 defines the
required embedment length to eliminate a conical pullout failure similar to the tube embedment
depth requirement defined in Equation 5.1. The derivation of Equation 6 is provided in reference
material (Stephens et al. 2015).
𝐿𝑒 ≥0.016𝜓𝑒𝐹𝑦,𝑏
√𝑓′𝑔
𝑑𝑏 [5.5]
𝐿𝑒 ≥ √𝐷2
4+
1.2∗𝐹𝑦,𝑏∗𝐴𝑠𝑡,𝑏
6𝜋√𝑓′𝑐𝑐
− 𝐷
2 [5.6]
The longitudinal dowels must extend into the CFST for a distance adequate to develop
the full strength of the dowels while limiting damage to the concrete fill. Results from welded
dowel pullout tests (discussed in references (Stephens et al. 2015)) suggest that the embedment
can be as low as 18db for full dowel development, however a distance of 24db is recommended
here to provide a reasonable factor of safety.
5.3.3 Vertical and Horizontal Joint Region Reinforcing
Cap beam detailing requirements specified in the California Department of
Transportation Seismic Design Criteria V. 1.6 (2013) should be followed when designing the
welded dowel connection.

61
5.3.4 Soffit Fill Depth
The soffit fill depth, Ls, is calculated according to Equation 5.7 to ensure that the annular
ring does not come in to contact with the bottom of the cap beam at the maximum expected drift
angle, θu where D is the outer diameter of the annular ring. This depth is illustrated in Fig. 5.4.
𝐿𝑠 ≥ sin (𝜃𝑢) (𝐷
2+ 8𝑡) [5.7]
5.3.5 Dowel De-bonded Length
Longitudinal dowels should be de-bonded from the concrete in the connection region
with the intent of increasing connection ductility. The required de-bonded length to achieve a
pre-determined connection rotation, θu, prior to bar fracture is calculated using Equation 5.8 or
5.9, where ϕu is a curvature limit corresponding to a maximum steel strain as obtained from a
moment-curvature analysis. Half of the de-bonded length extends into the cap beam, and half of
the de-bonded length extends into the CFST column as illustrated in Fig. 5.5.
𝐿𝑑𝑏 =𝜃𝑢
𝜙𝑢 [5.8]
𝐿𝑑𝑏 =tan 𝜃(𝐷−𝑡−𝑑𝑏/2)
0.7𝜀𝑢 [5.9]
Equation 5.9 is a simplified method for estimating the required de-bonded length of the
longitudinal reinforcing to achieve a pre-determined drift ratio prior to bar fracture. Although
this method does not require a moment curvature analysis, it results in larger de-bonded lengths
than those calculated using a moment-curvature analysis, as required in Equation 5.8.

62
Figure 5.5. Welded Dowel Connection Debonding Dimensions
5.3.6 Dowel-to-Steel Tube Welds
Longitudinal dowels are welded to the inside of the steel tube using flare bevel groove
welds on both sides of the dowels, as illustrated in Fig. 4.5. The required weld lengths to develop
the rupture capacity of the longitudinal dowels are specified in Equation 5.10 and are based on
typical weld limit states for flare bevel groove welds where Ab is the area of the longitudinal
dowel, Fy,b is the yield strength of the longitudinal dowel, and FEXX is the tensile strength of the
weld metal. Equation 5.10a is based on failure of the weld metal, Equation 5.10b is based on
yielding of the tube steel, and Equation 5.10c is based on rupture of the tube steel. A strength
reduction factor of 0.9 has been included for yielding limit states in Equations 5.10a and 5.10b,
while a strength reduction factor of 0.75 has been included based on a tube steel rupture limit
state in Equation 5.10c.
𝐿𝑤 ≥5.6𝐴𝑏𝐹𝑦,𝑏
𝐹𝐸𝑋𝑋𝑑𝑏 [5.10a]

63
𝐿𝑤 ≥0.83𝐴𝑏𝐹𝑦,𝑏
𝐹𝑦,𝑠𝑡𝑡 [5.10b]
𝐿𝑤 ≥1.11𝐴𝑏𝐹𝑦,𝑏
𝐹𝑢,𝑠𝑡𝑡 [5.10c]
5.3.7 Use of Spiral or Hoop Reinforcement in the Joint Region
Transverse reinforcing in the form of spiral or individual hoops should be included
around the longitudinal dowels which extend into the cap beam according to requirements in the
California Department of Transportation Seismic Design Criteria V. 1.6. At least one hoop
should be placed in the soffit fill depth if individual hoops are used as shown in Fig. 5.4. This
reinforcing acts to confine the grout in the joint region and limit buckling of the longitudinal
dowels16
.
5.4 CONCLUSIONS AND FUTURE WORK
An embedded CFST column-to-foundation connection in which the steel tube is grouted
into the foundation concrete was briefly introduced. Experimental research showed that this
connection is capable of transferring the plastic moment capacity of the CFST column while
limiting damage to the foundation. The experiments provided valuable information and resulted
in straight forward and practical design expressions for an embedded foundation connection.
Several new CFST column-to-cap beam connections were proposed and experimentally
studied using increasing cyclic deformations. These connections included (1) an embedded ring
connection in which an annular ring is welded to the top of the steel tube and embedded into the
cap beam (2) a welded dowel connection in which a ring of headed dowels is welded to the
inside of the steel tube and developed into the cap beam, and (3) an reinforced concrete
connection in which a traditional reinforcing cage consisting of a ring of headed dowels with

64
transverse reinforcing is developed into the CFST column and cap beam. All of the connections
were demonstrated using a grouted connection detail, which can be integrated with precast cap
beam components for ABC. A series of large scale specimens were tested to evaluate the
behavior of the different connection types. The experimental results suggest that all of the
connection types can achieve strength and ductility objectives within the unique constraints of a
precast cap beam, and practical engineering expressions were developed for the proposed
connections.
Additional research should be conducted to further refine the design expressions, and
evaluate the behavior of the connections for a much wider range of parameters. An evaluation of
possible repair methods would be beneficial to demonstrate the advantages of using CFSTs in
highway bridge construction. Thus four primary areas of future work are recommended:
1) Utilize the detailed finite element models developed for the initial connection evaluation
to conduct extensive parameter studies on the proposed connections.
2) Evaluate repair strategies for columns which have been moderately damaged following
lateral load events.
3) Develop additional connections such that CFSTs are more versatile for bridge
construction; specifically a CFST-to-pile connection is needed.
4) CFSTs should have larger torsional strength and deformability relative to RC columns. A
research program aimed at evaluating the response of CFST columns and connections
subjected to combined torsional, shear, flexure and axial loading is needed. In addition
this program should develop a connection capable of transferring torsion to the
superstructure for skewed bridges.

65
CHAPTER 6
SEISMIC PERFORMANCE OF HIGH-STRENGTH STEEL RC BRIDGE
COLUMNS
This chapter presents results of a testing program developed to assess the performance of
circular reinforced concrete (RC) bridge columns constructed with ASTM A706 Grade 80 [550]
high-strength steel (HSS) reinforcement. Two pairs of columns were subjected (four columns in
total). to lateral cyclic loading to determine the effects of steel reinforcement grade and of
moment-shear span ratio on column performance. All four columns were designed to have
similar nominal bending moment capacities, even though each pair consisted of one column
constructed with Grade 80 [550] HSS reinforcement and a control column constructed with
Grade 60 [420] reinforcement. The first pair had a moment-shear span ratio of six (6) while the
second pair had a moment-shear span ratio of three (3). Results indicate that even though
columns constructed with Grade 80 [550] reinforcement exhibited lower hysteretic energy
dissipation than the control columns, the columns constructed with HSS reinforcement achieved
similar resistance, similar peak lateral displacements, and similar curvature ductility values when
compared with the control columns constructed with Grade 60 [420] reinforcement. Results also
indicate that, independently of the steel grade, as the moment-shear span ratio decreases, the
maximum drift ratio decreases, even though the displacement ductility increased.
6.1 INTRODUCTION
In seismic regions, reinforcement congestion can present a significant challenge during
construction of bridge structural members (Gustafson 2010; Risser and Hoffman 2014). Since
the use of higher yield strength reinforcing steels could reduce reinforcement congestion, in

66
2012, the American Association of State Highway and Transportation Officials (AASHTO) and
several US State Highway Agencies (SHAs) allowed the use of Grade 80 [550] reinforcement for
designing and constructing all bridge structural members except compression members designed
to form a plastic hinges, such as bridge columns. Even though the 7th Edition of AASHTO
LRFD Bridge Design Specifications (AASHTO 2014, section 5.4.3.3), allows State Highway
Agencies (SHA) to approve the use of Grade 80 reinforcement, the lack of experimental testing
results makes it difficult for SHAs to have a sound support for their decisions. The main reasons
for the restrictions placed on the use of this type of high-strength steel (HSS) reinforcement are
due to the lack of experimental data on columns constructed with ASTM A706 Grade 80 [550]
HSS reinforcement, and due to the known fact that increasing yield strength typically results in
decreased material strain ductility. In addition, designers are reluctant to specify Grade 80 [550]
HSS reinforcement in projects because it can currently only be used in certain bridge structural
members and potential errors in placement could arise, i.e., placing Grade 60 [420]
reinforcement where Grade 80 [550] reinforcement is required or vice-versa.
Even with the potential benefits of HSS reinforcement identified almost 40 years ago
(Gustafson 2010), limited research has been performed on the seismic performance on
compression members constructed with HSS reinforcement. Review of the literature (e.g.
Rautenberg et al. 2010) and of the PEER column database (Berry and Eberhard 2008) indicates
that limited tests have been performed using Grade 80 [550] HSS reinforcement. Furthermore,
research addressing the effects of moment-shear span ratio on the performance of columns using
HSS reinforcement was found through studies with conventional reinforcing steel grades. For
example, Priestley and Park (1987) performed a large set of column tests with different cross-
section shapes, and their testing results indicated that the ductility of short columns, with an
67
aspect ratio of 2, was larger than that of the columns with an aspect ratio of 4, leading to the
conclusion that displacement ductility capacity decreases as the aspect ratio of the column
increases. Lehman et al. (2004) evaluated the seismic performance of ten (10) RC columns with
four different aspect ratios. The experimental results reported by Lehman et al. (2004) indicated
that as the aspect ratio increased (i) the yield drift ratio increased, (ii) the drift ratio when initial
spalling occurred increased, and (iii) the drift ratio level when reinforcing bar buckling and
fracture occurred also increased. Additionally, the results from Lehman et al. (2004) indicated
that as the aspect ratio increased the maximum lateral displacement increased and the lateral
force capacity decreased. The literature review performed indicates that different authors reached
similar conclusions with respect to the effects of moment-shear span ratio on column structural
performance. However, it should be noted that these similar conclusions were reached for a wide
range of scales, shapes, and reinforcement type and amount.
This chapter reports on testing performed on four half-scale circular RC bridge columns.
Two pairs of columns were tested and evaluated to determine the effects of reinforcement grade
and the effects of the moment-shear span ratio.
6.2 EXPERIMENTAL PLAN
The experimental research plan is shown in Figure 6.1. The first pair of columns,
denoted G60 and G80, had a moment-shear span ratio equal to six (6). The second pair of
columns, denoted G60-s and G80-s, had a moment-shear span ratio equal to three (3). Figure 6.1
also shows the cross-sections and column dimensions. The column test height, H, is equal to 12
feet (3.66 m) for the first pair of columns (G60 and G80) and equal to 6 feet (1.83 m) for the
second pair of columns (G60-s and G80-s). All columns tested were 2-feet (0.61 m) in diameter,
which correspond to half-scale specimens of a typical 4-foot (1.22 m) diameter column built in

68
the western US, including California (Schoettler et al. 2012), Oregon, and Washington as well as
in Japan (Kawashima et al. 2009). The column height, diameter, clear cover, and maximum size
aggregate (MSA) were scaled while all other dimensions were designed/spaced according to
applicable code requirements. The total weight of test specimens, including the RC load stub and
footing, was 10.45 tons (9.48 metric tonnes) for the taller columns and 9.04 tons (8.20 metric
tonnes) for the shorter columns.
(a) (b) (c)
Figure 6.1 Specimen Geometry of: (a) Columns G60 & G80 and (b) Columns G60-s & G80-s;
(c) Column Cross-Section Detailing.
Columns G60 and G60-s were designed with a longitudinal reinforcement ratio of =
2.19 percent corresponding to 22 #6 (22 ø19 mm) Grade 60 [420] reinforcing bars. Columns G80
and G80-s have a longitudinal reinforcement ratio of = 1.58 percent corresponding to 16 #6
(16 ø19 mm) Grade 80 [550] HSS reinforcing bars. Figure 6.2 illustrates the stress-strain plots
for three Grade 60 and three Grade 80 reinforcement bar specimens. Columns G80 and G80-s
l
l

69
were designed to provide approximately the same moment capacity as columns G60 and G60-s,
but were constructed with Grade 80 [550] reinforcement. Note that the increase in the ratio of
nominal yield strength does not perfectly match the decrease in the ratio of the number of
longitudinal reinforcing bars. The increase in nominal yield strength ratio was 1.33 (80/60) and
the decrease in the number of longitudinal bars was 1.38 (22/16). All four columns have the
same spiral pitch of 2.50 inches (63.5 mm) and have 1.25 inches (31.8mm) of clear cover. The
spiral reinforcement bar size is #3 (ø10 mm) for all columns. The pitch and bar size corresponds
to a transverse reinforcement ratio of = 0.82 percent. The column transverse and longitudinal
reinforcement were extended into the footing as required by Oregon Department of
Transportation Bridge Design and Drafting Manual (ODOT, 2012) and AASHTO applicable
code requirements. The concrete mixture contained a ⅜-inch (9.5 mm) (MSA). The concrete
mixture was also proportioned to be pumpable and had a minimum required slump of 5 inches
(127 mm). The reported concrete unit weight was 142 lb/ft3 (22.5 kN/m
3). Concrete strengths
listed in Table 1 are obtained from concrete cylinder testing performed during the day of column
testing. At least 3 samples were tested for each type of test for each column.
t
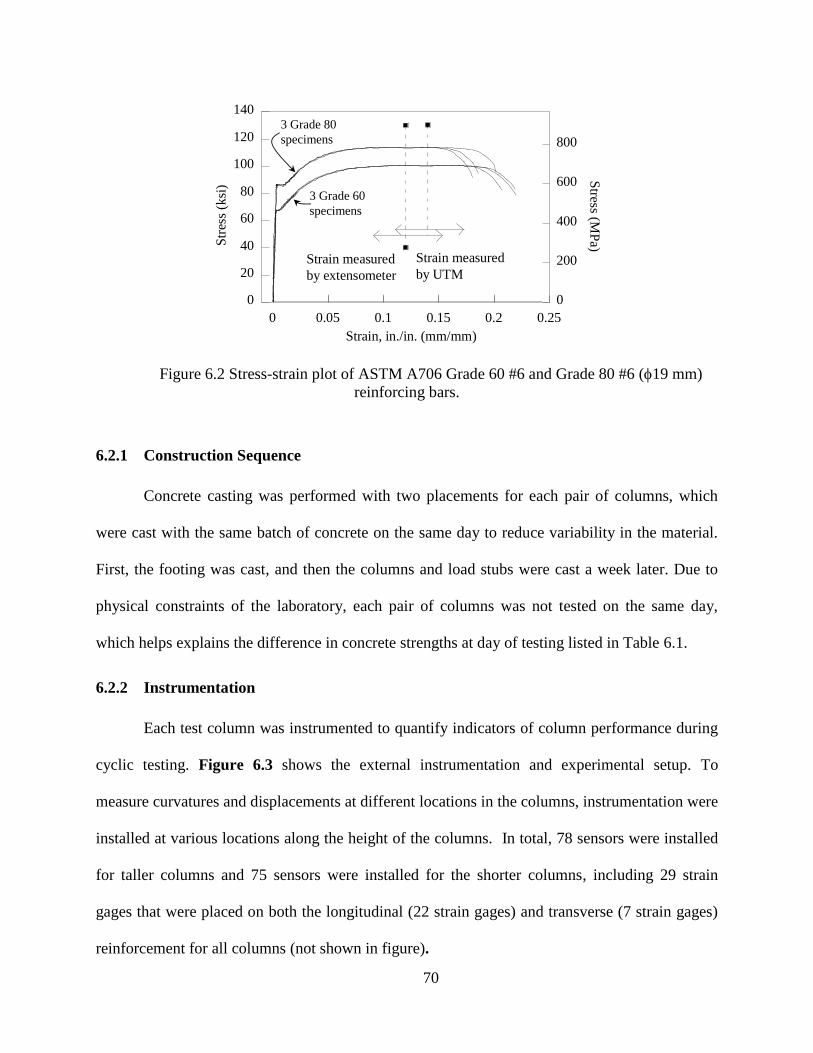
70
Figure 6.2 Stress-strain plot of ASTM A706 Grade 60 #6 and Grade 80 #6 (19 mm)
reinforcing bars.
6.2.1 Construction Sequence
Concrete casting was performed with two placements for each pair of columns, which
were cast with the same batch of concrete on the same day to reduce variability in the material.
First, the footing was cast, and then the columns and load stubs were cast a week later. Due to
physical constraints of the laboratory, each pair of columns was not tested on the same day,
which helps explains the difference in concrete strengths at day of testing listed in Table 6.1.
6.2.2 Instrumentation
Each test column was instrumented to quantify indicators of column performance during
cyclic testing. Figure 6.3 shows the external instrumentation and experimental setup. To
measure curvatures and displacements at different locations in the columns, instrumentation were
installed at various locations along the height of the columns. In total, 78 sensors were installed
for taller columns and 75 sensors were installed for the shorter columns, including 29 strain
gages that were placed on both the longitudinal (22 strain gages) and transverse (7 strain gages)
reinforcement for all columns (not shown in figure).
0
20
40
60
80
100
120
140
0 0.05 0.1 0.15 0.2 0.25
0
200
400
600
800
Str
ess
(ksi
)
Strain, in./in. (mm/mm)
Stress (M
Pa)Strain measured
by UTMStrain measured
by extensometer
0
20
40
60
80
100
120
140
0 0.05 0.1 0.15 0.2 0.25
0
200
400
600
800
Str
ess
(ksi
)
Strain, in./in. (mm/mm)
Stress (M
Pa)
Strain measured
by UTMStrain measured
by extensometer
3 Grade 80
specimens
3 Grade 60
specimens

71
Two ⅜-inch (9.5 mm) diameter threaded rods were cast with the concrete column at four
different elevations for columns G60-s and G80-s and five different elevations for columns G60
and G80 (elevations are shown in Figure 6.3(b) and Figure 6.3 (a), respectively). Aluminum
angles were attached to the threaded rods. At least sixteen string potentiometers, labeled B in
Figure 6.3, (two on each aluminum angle) were attached to the aluminum angles to obtain
measurements to determine the column curvatures. Figure 6.3 also shows the locations of the
string potentiometers and additional instrumentation for columns G60-s and G80-s. Note that the
locations of the bottom three levels are identical for columns G60 and G80. A load cell within
the actuator, labeled G in Figure 6.3a and 6.3b, was used to measure the applied horizontal load
and one string potentiometer, labeled A in Figure 6.3a and 6.3b, was used to measure the tip
displacement. Details on additional instrumentation can be found in Trejo et al. (2014).

72
(a)
(b)
Figure 6.3 External Instrumentation for Columns: (a) G-60 & G-80, and (b) G60-s &
G80-s (NTS – not to scale).

73
6.2.3 Test Setup and Testing Procedure
Test setup initiated with stressing the column footing to the strong floor. For the second
pair of columns (G60-s and G80-s) a RC spacer block was placed between the bottom of the
column footing and the strong floor. The hydraulic actuator was then bolted to the RC load stub
and the axial load system was assembled. The axial load was applied with a hydraulic jack
located between the top of the load stub and a steel reaction beam. The steel reaction beam (6-
feet [1.83 m] W12x152) was connected to the column footing using prestressing threaded rods.
A concave plate and convex nut were used at the base to allow for rotation of the prestressing
rod. The top load transfer beam was supported on a large diameter hydraulic hollow jack and
load cell, which aligned the axial load with the specimen as it deformed. In addition to the large
diameter hydraulic jack, a pneumatic nitrogen accumulator was placed in series with the jack to
reduce variations of the pressure in the hydraulic system and applied axial load. The applied
axial load was 90 kips (400 kN), corresponding to five percent of the nominal axial capacity of
the column in compression.
Table 6.2 lists the testing protocol and Figure 6.4 shows the profile in terms of drift ratio
versus the number of cycles. Horizontal loading consisted of pushing and pulling the column (in
the north-south direction) to predetermined drift ratio levels. Each drift ratio level consisted of
three cycles (six peaks): each cycle started at zero displacement, was then displaced in the
positive direction towards the positive peak (North), was then displaced in the negative direction
towards the negative peak (South), and was then returned back to zero displacement. This
process was repeated three times for each predetermined drift ratio level. Both pairs of columns
were tested to the same drift ratio levels. Thus, to achieve the same drift ratios the tip

74
displacements of the second pair of columns (G60-s and G80-s) were half of the tip
displacements of the first pair of columns (G60 and G80).
Table 6.2 Loading profile of columns G60, G80, G60-s, and G80-s.
Drift ratio
cycle, %
Number
of cycles
Loading rate, in/s (mm/s)
G60 & G80 G60-s & G80-s
0.1 3 0.01 (0.25) 0.005 (0.13)
0.2 3 0.01 (0.25) 0.005 (0.13)
0.3 3 0.01 (0.25) 0.005 (0.13)
0.5 3 0.01 (0.25) 0.005 (0.13)
0.7 3 0.01 (0.25) 0.005 (0.13)
0.9 3 0.02 (0.51) 0.01 (0.25)
1.7 3 0.04 (1.0) 0.02 (0.51)
2.6 3 0.08 (2.0) 0.04 (1.0)
3.5 3 0.08 (2.0) 0.04 (1.0)
4.3 3 0.08 (2.0) 0.04 (1.0)
5.2 3 0.08 (2.0) 0.04 (1.0)
6.1 3 0.08 (2.0) 0.04 (1.0)
6.9 3 0.16 (4.1) 0.08 (2.0)

75
Figure 6.4 Loading Profile of Columns G60, G80, G60-s, and G80-s.
Table 6.3 summarizes the tensile testing performed on the reinforcing steel bars. Details on the
material testing results can be found in Trejo et al. (2014) and can be provided by the
corresponding author upon request. The material properties of the concrete and steel
reinforcement used, several material tests were performed. Concrete material testing included
compressive strength tests (ASTM C39), splitting tensile strength tests (ASTM C496), modulus-
of-elasticity tests (ASTM C469), and modulus-of-rupture tests (ASTM C78). Concrete samples
were made and cured following ASTM C31 specifications. The reinforcement characteristics
were obtained from tension tests performed using a 110-kip (489 kN) universal testing machine
following ASTM E8, E83, and A370 specifications.
Table 6.3 Summary of tensile testing results for the reinforcing steel bar
Bar size Grade, ksi
(MPa)
Yield point*
(0.2% offset) Tensile strength Ultimate strain
Elong. % in
8 inch
(203 mm) Stress, ksi
(MPa)
Strain,
in./in.
(mm/mm)
Stress, ksi
(MPa)
Strain,
in./in.
(mm/mm)
Stress, ksi
(MPa)
Strain,
in./in.
(mm/mm)
#3
(#10M)
Gr. 60
(420)
72.8
(502) 0.0045
102.1
(704) 0.1185
73.2
(505) 0.1571 15
#5
(#16M)
Gr. 60
(420)
66.7
(460) 0.0046
93.7
(646) 0.1310
71.8
(495) 0.1982 17
#6
(#19M)
Gr. 60
(420)
67.2
(463) 0.0043
100.1
(690) 0.1402
81.5
(562) 0.2155 16
-0.08
-0.06
-0.04
-0.02
0
0.02
0.04
0.06
0.08
0 5 10 15 20 25 30 35 40D
rift
rati
o, D/H
Number of Cycles

76
#3
(#10M)
Gr. 80
(550)
85.6
(590) 0.0055
120.5
(831) 0.0947
85.2
(588) 0.1378 13
#5
(#16M)
Gr. 80
(550)
86.2
(594) 0.0051
114.3
(788) 0.1066
86.8
(598) 0.1555 14
#6
(#19M)
Gr. 80
(550)
86.1
(593) 0.0048
114.0
(786) 0.1225
93.9
(647) 0.1893 15
* The yield point is defined as intersection of the 0.2 percent offset line and stress-strain curve
6.3 TEST RESULTS AND DISCUSSION
Test results of the two pairs of columns (G60 and G80, G60-s and G80-s) were compared
to determine the effects of the steel reinforcement grade and the effect of moment-shear span
ratio on column performance. Steel reinforcement strains, column capacity, column ductility, and
energy dissipation are compared in this paper. It is worth noting that all four columns exhibited
flexural failure, in which longitudinal reinforcing bar buckling followed by longitudinal
reinforcing bar fracture was the main mode of failure. Failure of the columns was defined at the
point when the first longitudinal reinforcing bar facture occurred. Observations of column
damage progression and post-failure column performance are also discussed.
6.3.1 Steel Reinforcement Strains
The drift at which the first longitudinal reinforcing bar yielded in the columns is
presented in this paragraph. The longitudinal reinforcement in column G60-s initially yielded at a
drift ratio of 0.69 percent (-0.50 inches, -13 mm) and was measured at a location at 12 inches
(305 mm) from the base of the column (level 4). The longitudinal reinforcement in column G80-
s initially yielded at a tip displacement of -0.56 inches (-14 mm), which corresponds to a drift
ratio of 0.78 percent. This value was recorded at a distance 6 inches (152 mm) above the base of
the column (level 3). The longitudinal reinforcement in column G60 initially yielded at a tip
displacement of 1.44 inches (36.6 mm), which corresponds to a drift ratio of 1.00 percent. This
occurred during the approach to the first peak of the 1.7 percent drift ratio cycle at the base of the

77
column (level 2). Also at level 2, the longitudinal reinforcement in column G80 initially yielded
during the 1.7 percent drift ratio cycle, at 1.58 inches (40.1mm) of displacement corresponding
to 1.1 percent drift ratio. When comparing columns G80-s and G80, column G80 exhibited two
more drift ratio cycles prior to the longitudinal reinforcement yielding. This result was similar to
the difference between columns G60 and G60-s. Results indicate that as the yield strength of the
reinforcing steel was increased the drift ratio at which yielding occurred also increased. For both
moment-shear span ratios, the increase in the drift at which first yield was observed is equal to
10%. As the moment-shear span ratio is increased the yield drift also increases. This increase
was similar for both the control (Grade 60) columns and the Grade 80 [550] HSS columns.
Inelastic strains in the longitudinal reinforcement of plastic hinges reach peak values at the
column ends, and penetrate into the footing. As the tensile stress in the reinforcement is
transferred to the footing, through bond stresses along the reinforcement, the strain
incompatibility between the reinforcement and surrounding concrete in the footing results in
bond-slip. Bond-slip develops along most of the anchorage length of the bar into the footing.
Assuming that the reinforcement is well anchored, the bond-slip can be estimated based on the
accumulation of strains in the reinforcement, and therefore estimated by integrating the tension
reinforcement strain profile. While strain penetration also occurs in the steel and concrete when
in compression, it is minimal and often disregarded. Strain penetration can be estimated by
integrating the tension reinforcement strain profile below the base of the column. Thus, towards
understanding the effects of steel grade and moment-shear span ratio on the strain penetration,
the measurements of the strains at level 1 (inside the footing) are presented next. At strain gage
level 1 (inside the footing), column G60 initially yielded on the 2.6 percent drift ratio cycle while
column G60-s initially yielded on the 1.7 percent drift ratio cycle. The longitudinal

78
reinforcement in column G80-s yielded at 0.78 percent drift ratio and the longitudinal reinforcing
bars in column G80 never yielded in the footing. Test data show that the columns constructed
with Grade 80 [550] HSS reinforcement exhibited the maximum strains in the longitudinal
reinforcement further above the base of the column when compared to the columns constructed
with Grade 60 [420] reinforcement.
6.3.2 Column Capacity
Table 6.4 summarizes the results of testing in terms of columns forces and overstrength
factors. Column forces reported include maximum column shear force and maximum tested
moment capacity. It is worth noting that the column shear forces have been computed from
applied forces accounting for geometry effects of the applied axial. Table 6.4 also lists two
overstrength factors. First, the static nominal overstrength factor, defined as the ratio of the
tested moment capacity to the nominal moment capacity. Second, the static plastic overstrength
factor is presented, which corresponds to the ratio of the tested moment capacity to the plastic
moment capacity obtained using measured material properties. Both nominal and plastic moment
capacities are computed using Response 2000. The plastic overstrength factors are obtained
following the AASHTO Guide Specifications LRFD Seismic Bridge Design (2011). Columns
G60/G60-s and columns G80/G80-s have static nominal overstrength values of 1.36 and 1.28,
respectively. This indicates that: (i) columns constructed with Grade 80 reinforcement develop
smaller overstrength factors due to the presence of smaller reinforcement ratios, and (ii) the
moment-shear span ratio does not significantly affect the computed overstrength factor. The
reported values for the plastic overstrength factor are 1.28/1.27 and 1.20/1.22 for columns
G60/G60-s and G80/G80-s, respectively. The values for the Grade 80 columns are all lower than
the values achieved by Grade 60 columns. However, it should be noted that these values are

79
slightly larger than the AASHTO value of 1.2 that also considers other phenomena not simulated
in these tests, such as other sources of kinematic overstrength, dynamic amplification, and
rheological effects, which would suggest that the value of 1.2 may conservatively underestimate
the true capacity. Therefore, based on these testing results, it is suggested that the AASHTO
value of 1.2 remain unchanged for columns constructed with HSS reinforcement.
Table 6.4 Columns G60, G80, G60-s, and G80-s Capacities and Overstrength Factors.
Column
Maximum
shear
force
kip
(kN)
Nominal
moment
capacity, Mn
kip-ft
(kN-m)
Plastic
moment
capacity, Mp
kip-ft
(kN-m)
Tested
moment
capacity, MT
kip-ft
(kN-m)
Static
nominal
overstrength
factor,
λ1 = MT/Mn
Static
plastic
overstrength
factor,
λ2 = MT/MP
G60 47.9
(213)
463
(628)
493
(665)
631
(856) 1.36
1.28
G80 43.1
(192)
448
(607)
480
(651)
572
(776) 1.28
1.20
G60-s 100.4
(446.6)
463
(628)
495
(671)
629
(853) 1.36
1.27
G80-s 92.0
(409.2)
448
(608)
469.2
(636)
575
(780) 1.28
1.22
dynamic amplification and kinematic overstrength factors not considered due to quasi-
static nature of testing
Figures 6.5a and 6.5b show the shear force versus drift ratio of columns G60 and G80
and of columns G60-s and G80-s, respectively, up to the first longitudinal reinforcement fracture.
It can be seen that there are slight differences in the peak strength capacity. The difference in the
maximum shear force was expected because the nominal moment capacities of the columns were
different since the increase in yield strength of the longitudinal reinforcement did not match
exactly the reduction in the area of the longitudinal reinforcement. It can be seen that the overall
shape of the hysteretic loops are similar, but the columns reinforced with Grade 60 reinforcement
exhibited slightly larger shear forces, as well as slightly stiffer initial loading and unloading
curves, resulting in greater energy dissipation compared to the Grade 80 columns.

80
(a) (b)
Figure 6.5 Shear Force versus Drift Ratio of Columns: (a) G60 & G80, and (b) G60-s &
G80-s.
Figures 6.6a and 6.6b show the shear force versus drift ratio up to the first fracture of
longitudinal reinforcement for columns G60 and G60-s and for columns G80 and G80-s,
respectively. These figures indicate that the shear force in the shorter columns (G60-s and G80-s)
are approximately twice the shear force of the taller columns (G60 and G80). This is expected
due to the shorter columns having half the moment-shear span ratio of the taller columns.
However, the taller columns (G60 and G80) exhibited larger drift ratios prior to failure when
compared to the shorter columns (G60-s and G80-s). It is also worth noting that the shorter
columns are also considerably stiffer than the taller columns.
(a) (b)
Figure 6.6 Shear Force Versus Drift Ratio: (a) G60 & G60-s (b) G80 & G80-s.
-120
-80
-40
0
40
80
120
-0.08 -0.06 -0.04 -0.02 0 0.02 0.04 0.06 0.08
G80-2s
G60-2s
-400
-200
0
200
400
Shea
r fo
rce,
V,
kip
s
Drift ratio, /H
Shea
r forc
e, V, k
N
G60-s
G80-s
-60
-40
-20
0
20
40
60
-0.08 -0.06 -0.04 -0.02 0 0.02 0.04 0.06 0.08
G60G80
-200
-100
0
100
200
Shea
r fo
rce,
V,
kip
s
Drift ratio, /H
Shea
r forc
e, V, k
N
-60
-40
-20
0
20
40
60
-0.08 -0.06 -0.04 -0.02 0 0.02 0.04 0.06 0.08
G60G80
-200
-100
0
100
200
Shea
r fo
rce,
V,
kip
s
Drift ratio, /H
Shea
r forc
e, V, k
N
-120
-80
-40
0
40
80
120
-0.08 -0.06 -0.04 -0.02 0 0.02 0.04 0.06 0.08
G60G60-s
-400
-200
0
200
400
Shea
r fo
rce,
V,
kip
s
Drift ratio, /H
Shea
r forc
e, V, k
N
-120
-80
-40
0
40
80
120
-0.08 -0.06 -0.04 -0.02 0 0.02 0.04 0.06 0.08
G80G80-s
-400
-200
0
200
400
Shea
r fo
rce,
V,
kip
s
Drift ratio, /H
Shea
r forc
e, V, k
N

81
Finally, it should be noted that all four columns were well detailed. Thus, for the tested
aspect ratios and shear forces were not expected to cause column failure, even for the relatively
short columns with a moment-shear span ratio of 3. However, these results may not be extended
to columns with larger longitudinal reinforcement ratios or larger axial load rations, as undesired
compression failure of the core may govern the failure. Future testing addressing the last two
points are needed before generalization of the results shown above is possible.
6.3.3 Column Ductility
Column ductility is defined here for both displacement and curvature. Displacement
ductility is computed as the ratio of the maximum absolute tip displacement to the tip
displacement at a reference yield displacement of the column. The reference yield of the column
is defined herein in two ways: (i) based on the definition of reference yield curvature by Priestley
et al. (2007), which is summarized below for completeness of this paper; and (ii) and based on
the curvature distribution at a point when first yield of the column longitudinal reinforcement
was measured in the longitudinal strain gages attached to the reinforcing bars.
Table 6.5 provides a summary of the displacement and curvature ductility values. The
displacement ductility demand values based on the reference yield by Priestley et al. (2007) are
larger for columns G60/G60-s when compared to the columns G80/G80-s. This is mainly due to
larger nominal yield values used in estimation of the yield curvature in Equation 1, and to a
smaller extent to the larger estimate of the strain penetration used in Equation 3. Nonetheless,
similar peak drift ratios were achieved for both taller and shorted pairs of columns. Column G60-
s exhibited significantly larger curvature ductility values at the curvature instrumentation levels
1, 3 and 4 when compared to column G80-s. However, column G80-s exhibited a significantly
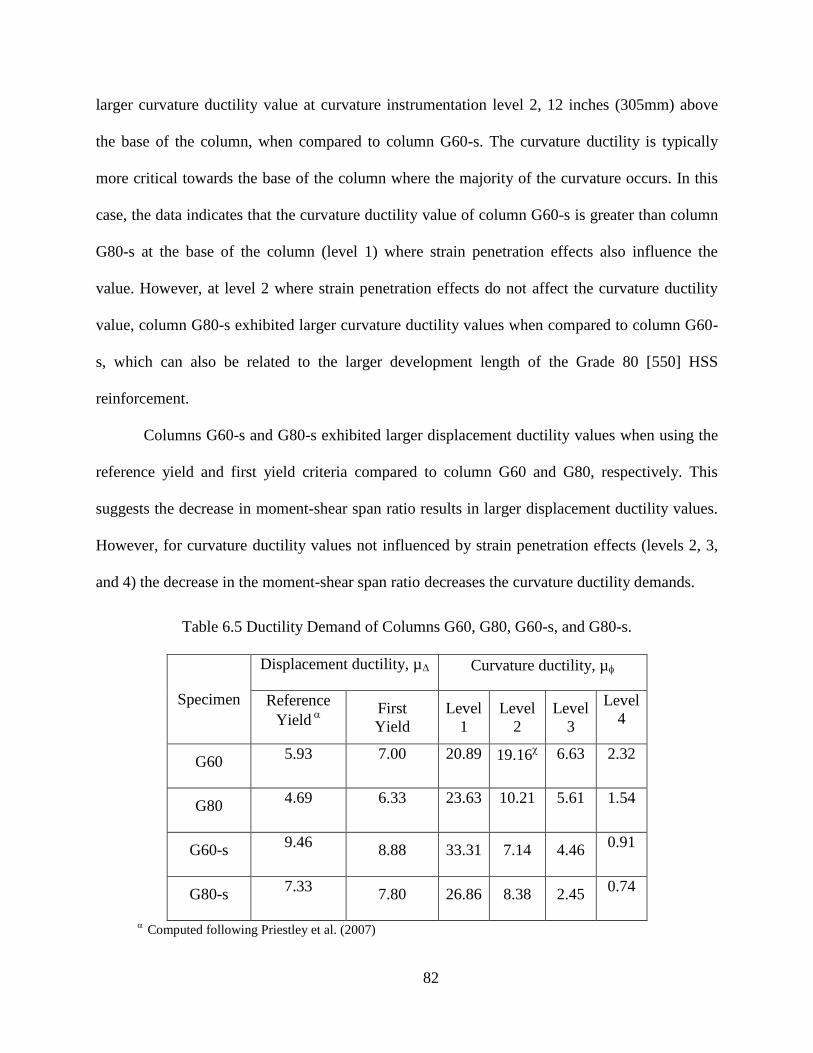
82
larger curvature ductility value at curvature instrumentation level 2, 12 inches (305mm) above
the base of the column, when compared to column G60-s. The curvature ductility is typically
more critical towards the base of the column where the majority of the curvature occurs. In this
case, the data indicates that the curvature ductility value of column G60-s is greater than column
G80-s at the base of the column (level 1) where strain penetration effects also influence the
value. However, at level 2 where strain penetration effects do not affect the curvature ductility
value, column G80-s exhibited larger curvature ductility values when compared to column G60-
s, which can also be related to the larger development length of the Grade 80 [550] HSS
reinforcement.
Columns G60-s and G80-s exhibited larger displacement ductility values when using the
reference yield and first yield criteria compared to column G60 and G80, respectively. This
suggests the decrease in moment-shear span ratio results in larger displacement ductility values.
However, for curvature ductility values not influenced by strain penetration effects (levels 2, 3,
and 4) the decrease in the moment-shear span ratio decreases the curvature ductility demands.
Table 6.5 Ductility Demand of Columns G60, G80, G60-s, and G80-s.
Specimen
Displacement ductility, µΔ Curvature ductility, µ
Reference
Yield
First
Yield
Level
1
Level
2
Level
3
Level
4
G60 5.93 7.00 20.89 19.16
6.63 2.32
G80 4.69 6.33 23.63 10.21 5.61 1.54
G60-s 9.46
8.88 33.31 7.14 4.46 0.91
G80-s 7.33
7.80 26.86 8.38 2.45 0.74
Computed following Priestley et al. (2007)

83
This large value is believed to have occurred due to the excessive deep spalling on the south
side of the column reducing the compressive resistance of the column resulting in larger
curvature in this region. It should also be noted this value occurred on the final peak of the
10.00-inch (254mm) displacement cycle shortly prior to column failure.
6.3.4 Energy Dissipation
The energy dissipated by each column was determined by numerical integration using the
Simpson rule on the applied force over displacement hysteretic loops for each displacement
cycle. The hysteretic energy dissipated, , is given by:
hE F d (1)
where F is the applied horizontal actuator force and is the displacement measured at the
same elevation as the applied force F .
Figure 6.7 shows the cumulative energy dissipated up to the first reinforcing bar fracture
for the four columns. The shorter columns (G60-s and G80-s) exhibited greater energy
dissipation when compared with the taller columns (G60 and G80) prior to the failure drift ratio
cycle. This is due to the increase in column stiffness of the shorter columns which resulted in a
greater area within the hysteretic loops. The results indicate that a reduction in the moment-shear
span ratio results in an increase in energy dissipation capacity after the longitudinal
reinforcement has yielded for columns constructed with either Grade 60 [420] or Grade 80 [550]
HSS reinforcement. This is believed to be mainly due to the increase in column stiffness.
However, it should be noted that the columns with a larger moment-shear span ratio (columns
G60 and G80) exhibited larger drift ratios prior to failure, which resulted in an overall increase in
energy dissipation capacity at column failure when compared with columns with a smaller
moment-shear span ratio (columns G60-s and G80-s).
hE

84
Figure 6.7 Cumulative Energy Dissipation of Columns G60, G80, G60-s, and G80-s.
6.3.5 Damage Progression
The damage progression was similar for all four columns. Damage concentrated near the
base of the column, where plastic hinges developed. However, concrete cracks extended
throughout the full length of the columns. As shown in Figure 6.8, in all columns, concrete
spalling, longitudinal reinforcing bar buckling, and longitudinal reinforcing bar fracture occurred
within one column diameter (2 feet or 0.61m) from the base. In the region within one column
diameter, flexural cracks were observed for columns G60 and G80 (see Figures 6.8a and 6.8b)
while flexure and shear (diagonal) cracks were observed for columns G60-s and G80-s (see
Figures 6.8e and 6.8f). Concrete spalling extended further up in the columns with larger
moment-to-shear span ratios, and furthest up in column G60. First longitudinal bar fracture
occurred after initiation of bar buckling. Necking of the reinforcement was not observed (see
Figure 6.8c), which indicates that the longitudinal bar fractures were due to low-cycle fatigue
(Mander et al. 1994, Rodriguez et al. 1999). In general, spiral reinforcement did not yield before
first longitudinal bar fracture. However, longitudinal reinforcing bar buckling displaced the
spiral reinforcement in column G60 (Figure 6.8a), G80 (Figure 6.8b), and G80-s (Figure 6.8f),
0
100
200
300
400
500
600
700
0 0.01 0.02 0.03 0.04 0.05 0.06 0.07
G60-s
G80-s
G60
G80
0
200
400
600
800
Cum
ula
tiv
e ener
gy d
issi
pate
d,
kip
-ft
Drift ratio cycle, /H
Cum
ulativ
e en
ergy d
issipated
, kN
-m

85
thereby increasing the spiral spacing. Initially, bar buckling was observed in the radial direction.
However, bar buckling was also observed in the circumferential direction due to concrete
crushing of the core near the spiral reinforcing. This bar buckling mode of failure spanned across
multiple spirals. In columns G60 and G80, cracking of the footing was observed post testing on
the top face of the footing (Figure 6.8d). This is indicative of cone pull out due to strain
penetration.
Figure 6.8 (a) Column G60 North Face Post Test, (b) Column G80 North face after first
longitudinal bar fracture, (c) Detail of first bar fracture of column G80, (d) Footing crack post
test of column G80, (e) Column G60-s post test, (f) Column G80-s post test.
(a)
(e) (f)
(b)
(c) (d)

86
6.4 CONCLUSIONS
The American Society for Testing and Materials (ASTM) currently has a specification for
low alloy reinforcing steel (ASTM A706) with a nominal yield strength of 60 ksi (420 MPa) and
80 ksi (550 MPa). However, the American Association of State Highway and Transportation
Officials (AASHTO) and specifications for select State Highway Agencies (SHAs) do not allow
the use of Grade 80 [550] HSS reinforcement in reinforced concrete compression members
designed to form a plastic hinge. This limitation is due to lack of information on the material
characteristics of ASTM A706 Grade 80 [550] reinforcement and due to a lack of test data on the
cyclic performance of plastic hinges in compression members. The use of Grade 80 [550] HSS
reinforcement in RC bridge columns has the potential to reduce reinforcement quantities, reduce
reinforcement congestion, and improve constructability, thus making the construction of new
bridges more economical. However, limited research has been performed to validate the use of
Grade 80 [550] HSS reinforcement, especially in compression members that may develop plastic
hinges.
The research presented assessed the performance of two pairs of columns which were
subjected to lateral cyclic testing. Each pair consisting of one column constructed with Grade 60
[420] reinforcement and the other constructed with Grade 80 [550] HSS reinforcement. Both
pairs of columns were designed to have similar moment capacities, but had different moment-
shear span ratios. Columns constructed with Grade 80 [550] HSS reinforcement were designed to
have similar moment capacity as the columns constructed with Grade 60 [420] reinforcement.
This was achieved by reducing the number of longitudinal reinforcing bars proportionally to the
increase in nominal yield strength.
The main conclusions that can be drawn from these test results are:
87
1. Columns constructed with Grade 80 [550] HSS reinforcement achieved similar
resistances when compared with the reference columns constructed with Grade 60 [420]
reinforcement. Note that the columns constructed with Grade 80 [550] HSS
reinforcement had approximately 75% the amount of longitudinal reinforcement of the
columns constructed with Grade 60 [420] reinforcement;
2. All four columns failed due to longitudinal reinforcing bar buckling followed by
longitudinal reinforcing bar fracture. This indicates the mode of failure was flexural. It
should be noted that all of the columns were very well confined to prevent shear failure
and other undesired modes of brittle failure;
3. Columns constructed with Grade 60 [420] reinforcement and columns constructed with
Grade 80 [550] HSS reinforcement exhibited similar peak drift ratios. Displacement
ductility values were larger than four (4.0) for all columns;
4. Columns constructed with Grade 60 [420] reinforcement typically exhibited larger
curvature ductility values;
5. The columns constructed with Grade 60 [420] reinforcement exhibited larger hysteretic
energy dissipation than the columns constructed with Grade 80 [550] HSS reinforcement.
However, energy dissipation is primarily a function of the amount of longitudinal
reinforcement and column stiffness rather than a function of the reinforcement grade;
6. Columns constructed with Grade 80 [550] HSS reinforcement tested in this research
exhibited lower overstrength factors than columns constructed with Grade 60 [420]
reinforcement; this observation is related to two factors: (i) material overstrength is
smaller for Grade 80 reinforcing steel, and (ii) column constructed using the HSS
reinforcement had smaller reinforcement ratios.

88
7. The reduction in the moment-shear span ratio did not affect the overstrength factor for
columns constructed with either grade of reinforcement; results indicate that aspect ratio
does not affect the overstrength factor for well detailed columns that do not exhibit shear
failures.
8. The effects of the moment-shear span ratio were similar for columns constructed with
Grade 60 [420] reinforcement and columns constructed with Grade 80 [550] HSS
reinforcement. The decrease in the moment-shear span ratio resulted in larger curvature
ductility values at the base of the column where the effects of strain penetration affects
the curvature values and smaller curvature ductility values at higher elevations where the
effects of strain penetration do not affect the curvature;
9. Damage progression was similar for all columns. Concrete spalling, longitudinal bar
buckling, and bar fractures, concentrated at the base of the column, within a distance of
one column diameter from the base;
10. The post-failure performance of column G80-s constructed with Grade 80 [550] HSS
reinforcement exhibited similar to superior performance compared to column G60-s,
which was constructed with Grade 60 [420] reinforcement, since the G80-s column was
able to achieve one more peak (half a cycle) before the sixth bar fractured.
The results in this study present a promising step towards implementation of Grade 80
[550] HSS reinforcement in the design and construction of RC columns, within the bounds of the
variables used in is testing program. Other parameters outside of the range studied in this paper
should be evaluated. Those could include larger longitudinal reinforcement ratios, larger axial
load ratios, and higher concrete strengths.

89
CHAPTER 7
COMPARISON OF STRATEGIES
Previous chapters discuss in detail the characteristics of three strategies for increasing
seismic resilience, accelerating onsite construction and improving durability of bridge bents.
Chapters 2 and 3 discuss the use of precast columns and beams, in combination with cast-in-
place drilled shafts. Chapters 4 and 5 discuss the use of concrete-filled steel tubes. Chapters 6
discusses the used of higher-strength reinforcement in reinforced concrete bridge columns.
This chapter compares the most salient characteristics of three strategies with those of
conventional cast-in-place, reinforced concrete construction. These characteristics are
summarized in tables 7.1 to 7.4. The systems are:
Conventional Construction (CC)
Precast Concrete columns and beams (PC)
Concrete Filled Steel Tubes (CFST)
High Strength Reinforcement (HSR)
The seismic resiliency of these systems are compared in Table 7.1. All the systems are
expected to provide life safety by preventing collapse in the design earthquake. Thus the
significant differences among the systems is their abilities to withstand larger earthquakes (e.g.
MCE or even larger) and in the extent of expected damage and loss of function. None of the
systems as designed have provision for active re-centering, so they should be expected to lead to
similar residual displacements.
The CFST system has exceptional axial, shear, and flexural capacity, which makes it
advantageous for short columns (i.e. at the bottom of freeway ramps) or for bridges with large
eccentric truck loadings that induce large overturning moments. These enhanced properties result

90
from the optimal placement of the steel on the exterior face of the column, as well as the
confinement and reduced cracking of the interior concrete. The steel tube acts to confine the
concrete fill, which in turn provides large axial stiffness for functionality performance objectives.
The CFST connections evaluated in this report can sustain large deformations and
provide large resistance when subjected to lateral loads. When the ER connection is employed,
tube buckling tends to develop at 3% to 4% drift near the column-to-foundation and column-to-
cap beam interfaces, however this buckling does not result in a decrease in load carrying
capacity. Further, drifts exceeding 8% can be developed before tube tearing develops in the
buckled region. The WD connection also provides large strength and deformation capacity. The
reinforcing ratio in the connection region can be designed to exceed the plastic capacity of the
CFST column, and the dowels can be debonded to increase ductility. Deformation capacities
exceeding 12% drift were observed in the experiments.
Despite the advantages of CFST components and the connections presented here, note
that the large effective reinforcing ratio of the CFST components (and inherent large flexural
capacity) can make it difficult to capacity design elements to develop the capacity of the column
during seismic events. This is of particular concern when using the ER connection where the
CFST steel extends into the cap beam.
The durability of the three concrete systems (CC, PC and HSR) depend mostly on the
quality of the concrete used and its ability to resist shrinkage and other cracking. In that regard,
the PC system is likely to be slightly more durable than CC and HSR systems, because of higher
level of quality control in the production plant than the construction site. HSR likely leads to
less reinforcement (to reduce cost), which implies slightly reduced resistance to shrinkage, but
shrinkage is rarely a design concern in reinforced concrete columns.

91
The durability of the CFST system depends on the protective coating (or the existence of
additional sacrificial steel thickness), and on the details adjacent to the connections where ingress
of water is most likely. Galvanized steel tubes can also be used in extreme environments where
corrosion may be of particular concern. It should be noted that numerous bridge columns have
already been encased in steel shells as a retrofit measure.

92
Table 7.1. Comparison of Seismic Resiliency
Strategy Considerations
Conventional
Construction
Life safety is ensured by contemporary codes, but damage to concrete
and reinforcement is likely in the plastic hinge region. Repair of low
damage can be achieved using epoxy injection.
In larger earthquakes, repair of bar buckling or fracture can be
expensive and delay the return of the bridge to service.
No provision for active re-centering, so residual displacements
depend on the particular ground motion.
Precast Cast
Columns and
Beams
Same as CC if geometry and details are the same.
The precast system can be modified to contain pre-tensioning, which
has been shown to greatly reduce residual deformations.
Concrete Filled
Steel Tubes
Potentially higher drift capacity than CC.
Smaller diameters than comparable RC columns.
More versatile than precast columns (i.e. easy to vary diameter and
length)
High-shear, moment, and axial capacity, which is particularly
attractive for columns with large eccentric truck loads or short
columns.
Can be difficult to capacity design super-structure components to
resist the plastic capacity of the CFST column
High-Strength
Column
Reinforcement
Same as CC, but
Bar buckling might occur earlier if the bars were substantially
smaller. However, using the same bar sizes and for nominally equal
bending moment capacities, bar buckling would likely develop at
similar drifts.

93
Table 7.2. Comparison of Speed of Construction
Strategy Considerations
Conventional
Construction
Construction Sequence: cast foundation, form column, column steel,
cast column, shore and form cap beam, cap beam steel, cast cap
beam.
Precast Cast
Columns and
Beams
Construction Sequence: place PC column, cast foundation, place cap
beam, grout cap beam.
Concrete Filled
Steel Tubes
Construction Sequence: cast foundation with opening for column,
place column tube, cast column concrete, (grout opening in
foundation), place pc cap beam, concrete/grout cap beam connection.
Note that it is important to keep the structural steel and reinforcing
bar trades separate during construction.
High-Strength
Column
Reinforcement
Construction Sequence: same as for CC,
Reduced congestion makes highly-reinforced sections easier to build
and reduces construction costs relative to CC.
Life cycle costs are difficult to estimate, and will vary significantly depending on whether
earthquake repair costs are to be included (i.e., whether an earthquake occurs). In Table 7.4,
earthquake repair costs are not included. The life cycle costs also depend on contractor
familiarity with the different structural systems, because contractors typically price in any
uncertainty associated with new systems.
The material costs for the HSR systems are likely to slightly smaller than for the CC
system, but in most bridges, labor costs are more important. It is likely that the reduced
congestion will somewhat reduce the labor costs of HSR, in comparison with CC. For the PC

94
and CFST systems, the material costs may be higher than for CC, but the labor costs are
expected to be lower once contractors are familiar with the systems and can gain a time
advantage. The CFST system uses a relatively high steel percentage (about 4%, compared with a
total of approximately 2% in CC) and tube steel is more expensive than rebar steel per unit
weight, however, the tube serves as permanent formwork and avoids the forming costs. More
importantly, the PC and CFST systems provide the benefit of reducing the indirect costs
associated with construction traffic congestion.
Table 7.3. Comparison of Durability
Strategy Considerations
Conventional
Construction
Potential for cracking caused by shrinkage and other events.
Precast Cast
Columns and
Beams
Same as CC.
Some increase in quality control in plant
Adding pre-tensioning reduces cracking potential.
Concrete Filled
Steel Tubes
Depends on protective coating (e.g. paint) for durability
High-Strength
Column
Reinforcement
Crack potential may be slightly worse if less reinforcement is used.
Would not likely be an important consideration for columns that are
subjected to compressive axial load.
Reduced bar congestion improves concrete vibration and reduces
potential voids and other defects that can affect durability

95
Table 7.4. Comparison of Life Cycle Cost
Strategy Considerations
Conventional
Construction
Initial cost only, if no earthquake.
Precast Cast
Columns and
Beams
Potentially lower initial cost (faster on-site construction).
No repair maintenance costs if no earthquake..
Concrete Filled
Steel Tubes
High material cost for steel tube.
No column reinforcing cage cost
No column formwork cost
High-Strength
Column
Reinforcement
Life-cycle cost may be slightly lower, mainly since the reinforcement
cost may be slightly lower.
Easier construction due to fewer bar congestions in joints and lap-
splices may also reduce initial costs.
.

96
REFERENCES
AASHTO (2009). “LRFD Bridge Design Specifications” 4th ed., American Association of State
Highway and Transportation Officials, Washington, DC.
AASHTO (2011). AASHTO Guide Specifications for LRFD Seismic Bridge Design. 2nd ed.
American Association of State Highway and Transportation Officials, Washington, D.C..
AASHTO (2012). AASHTO LRFD BRIDGE DESIGN SPECIFICATIONS, Customary U.S.
Units. American Association of State Highway and Transportation Officials, Washington,
D.C.
AASHTO (2014). AASHTO LRFD BRIDGE DESIGN SPECIFICATIONS, Customary U.S.
Units. American Association of State Highway and Transportation Officials, Washington,
D.C.
AASHTO (2015) “AASHTO LRFD Bridge Design Specification,” American Association of
State Highway and Transportation Officials, Washington, D.C.
ACI 318 (2011). “Building Code Requirements for Structural Concrete”. American Concrete
Institute, Farmington Hills, MI.
AISC (2011). Steel Construction Manual. American Institute of Steel Construction, Chicago, IL,
14 edition.
ASTM A1035 / A1035M-14 (2014), Standard Specification for Deformed and Plain, Low-
Carbon, Chromium, Steel Bars for Concrete Reinforcement, ASTM International, West
Conshohocken, PA, www.astm.org
ASTM A370-14 (2014), Standard Test Methods and Definitions for Mechanical Testing of Steel
Products, ASTM International, West Conshohocken, PA, www.astm.org
ASTM A615 / A615M-14 (2014), Standard Specification for Deformed and Plain Carbon-Steel
Bars for Concrete Reinforcement, ASTM International, West Conshohocken, PA,
www.astm.org
ASTM A706 / A706M-14 (2014), Standard Specification for Deformed and Plain Low-Alloy
Steel Bars for Concrete Reinforcement, ASTM International, West Conshohocken, PA,
www.astm.org
ASTM C31 / C31M-12 (2012), Standard Practice for Making and Curing Concrete Test
Specimens in the Field, ASTM International, West Conshohocken, PA, www.astm.org

97
ASTM C39 / C39M-14a (2014), Standard Test Method for Compressive Strength of Cylindrical
Concrete Specimens, ASTM International, West Conshohocken, PA, 2014,
www.astm.org
ASTM C469 / C469M-14 (2014), Standard Test Method for Static Modulus of Elasticity and
Poisson’s Ratio of Concrete in Compression, ASTM International, West Conshohocken,
PA, 2014, www.astm.org
ASTM C496 / C496M-11 (2004), Standard Test Method for Splitting Tensile Strength of
Cylindrical Concrete Specimens, ASTM International, West Conshohocken, PA,
www.astm.org
ASTM C78 / C78M-10e1 (2010), Standard Test Method for Flexural Strength of Concrete
(Using Simple Beam with Third-Point Loading), ASTM International, West
Conshohocken, PA, www.astm.org
ASTM E8 / E8M-13a (2013), Standard Test Methods for Tension Testing of Metallic Materials,
ASTM International, West Conshohocken, PA, www.astm.org
ASTM E83-10a (2010), Standard Practice for Verification and Classification of Extensometer
Systems, ASTM International, West Conshohocken, PA, www.astm.org
ATC-24 (1992). “Guidelines for Testing Steel Components”. Applied Technology Council,
Redwood City, CA.
Berry, M. P., and Eberhard, M.O. (2005). “Practical Performance Model for Bar Buckling.”
ASCE Journal of Structural Engineering, 131(7):1060-70.
Berry, M. P., and Eberhard, M.O. (2008). “Performance Modeling Strategies for Modern
Reinforced Concrete Bridge Columns”. PEER Report 2007/07. Pacific Earthquake
Engineering Research Center.
Brown, N.K., Kowalsky, M., and Nau, James. (2013). Strain Limits for Concrete Filled Steel
Tubes in AASHTO Seismic Provisions. North Carolina State University. Report Number
FHWA-AK-RD-13-05.
Building Seismic Safety Council for the FEMA. (2004) “NEHRP Recommended Provisions for
Seismic Regulations and for New Buildings and Other Structures (FEMA 450) 2003
Ed.,” Washington D.C.
Caltrans, (2013). “Seismic Design Criteria Version 1.6,” California Department of
Transportation.

98
Chronister, A. (2007). “Experimental Investigation of High Strength Concrete Filled Steel Tubes
in Embedded Column Base Foundation Connections.” Unpublished data , University of
Washington, Seattle, WA.
Concrete Reinforcing Steel Institute. (2001). “Evaluation of Reinforcing Bars in Old Reinforced
Concrete Structures”. Engineering Data Report 48.
Gustafson, D.P. (2010). “Raising the Grade.” Concrete International 32 (04): 59–62.
Haraldsson, O. (2011). “Spread Footing Socket Connections for Precast Columns.” Master’s
Thesis, University of Washington, Seattle, WA.
Haraldsson, O.S., Janes, T.M., Eberhard, M.O., and Stanton, J.F. (2013). “Seismic Resistance of
Socket Connection between Footing and Precast Column.” Journal of Bridge
Engineering, ASCE, Sept-Oct, pp. 910-919.
Janes, T. (2011). “Precast Column Socket Connections for Thin Spread Footings.” Master’s
Thesis, University of Washington, Seattle, WA.
Kawashima, K., Sasaki, T., Kajiwara, K., Ukon, H., Unjoh, S., Sakai, J., Kosa, K., Takahashi,
Y., Yabe, M., and Matsuzaki, H. (2009). “Shake table experiment on RC bridge columns
using E-Defense.” Proc. 41st Panel on Wind and Seismic Effects, UJNR, Public Works
Research Institute, Tsukuba Science City, Japan.
Kingsley, A. (2005). “Experimental and Analytical Investigation of Embedded Column Base
Connections for Concrete Filled High Strength Steel Tubes.” a thesis submitted in partial
fulfillment of Master of Science in Civil Engineering, University of Washington, Seattle,
WA.
Lee, J. (2011) “Experimental investigation of Embedded Connections for Concrete Filled Tube
Column Connection to Combined Axial-Flexural Loading,” a thesis submitted in partial
fulfillment of the degree of Master of Science in Cicil Engineering, University of
Washington, Seattle, WA.
Lehman, D., Moehle, J., Mahin, S., Calderone, A., and Henry, L. (2004). “Experimental
Evaluation of the Seismic Performance of Reinforced Concrete Bridge Columns.” ASCE
Journal of Structural Engineering 130 (6): 869–79.
Lehman, D.E. and Roeder, C.W. (2012) Foundation Connection for Circular Concrete Filled
Tubes, Journal of Constructional Steel Research, Vol. 78, November 2012, pgs. 212-25,
Elsevier.

99
Li, Y.A., Huang, Y.T., and Hwang, S.J. (2014). “Seismic Response of Reinforced Concrete
Short Columns Failed in Shear.” ACI Structural Journal 111 (1-6).
Mander, J., Panthaki, F., and Kasalanati, A. (1994). “Low‐Cycle Fatigue Behavior of
Reinforcing Steel.” Journal of Materials in Civil Engineering 6 (4): 453–68.
McLean, D.I. and Smith C.L. (1997), “Noncontact Lab Splices in Bridge Column-Shaft
Connections,” Washington State Department of Transportation Report WA-RD 417.1,
Olympia, Washington, July.
Montejo, L., Kowalsky, M., and Hassan, T. (2009). Seismic Behavior of Flexural Dominated
Reinforced Concrete Bridge Columns at Low Temperatures, Journal of Cold Regions
Engineering, Vol. 23, pp. 18-42.
ODOT (2012). “Oregon Department of Transportation Bridge Design and Drafting Manual,” rev.
August 2012. Oregon Department of Transportation, 2012, URL:
http://www.oregon.gov/odot/hwy/bridge/Pages/standards_manuals.aspx#Bridge_Design_
&_Drafting_Manual (accessed Dec. 4, 2012)
Pang, J.B.K., Steuck, K.P., Cohagen, L.S., Eberhard, M.O. and Stanton, J.F. (2008), “Rapidly
Constructible Large-Bar Precast Bridge-Bent Connection,” Washington State Department
of Transportation Draft Report, WA-RD 684.2, Olympia, Washington, October, 184 pp.
Pham, T.P., and Li, B. (2014). “Seismic Performance of Reinforced Concrete Columns with
Plain Longitudinal Reinforcing Bars.” ACI Structural Journal 111 (3): 561–72.
Priestley, M.J.N., Calvi, G.M., and Kowalski, M.J. (2007). “Displacement-based Seismic Design
of Structures.” IUSS Press, Pavia, Italy
Rautenberg, J.M., Pujol, S., and Lepage, A. (2010). “Cyclic Response of Concrete Columns
Reinforced with High-Strength Steel.” 9th US National and 10th Canadian Conference on
Earthquake Engineering, Including Papers from the 4th International Tsunami
Symposium 3. Accessed May 29, http://nees.org/resources/679/download/2010EQConf-
000996.PDF.
Restrepo, J. I., Tobolski, M.J., and Matsumoto, E.E. (2011). Development of a Precast Bent Cap
System for Seismic Regions. NCHRP Report 681.
Rice, P., and Gustafson, D. (1976). “Grade 80 [550] Reinforcing Bars and ACI 318-71.” ACI
Journal Proceedings 73 (4): 199–206.

100
Risser, R., and Hoffman, M. (2014). “Turning Billets into Bars.” Concrete Construction.
Accessed May 29, 2014. http://www.concreteconstruction.net/rebar/turning-billets-into-
bars.aspx.
Rodriguez, M., Botero, J., and Villa, J. (1999). “Cyclic Stress-Strain Behavior of Reinforcing
Steel Including Effect of Buckling.” Journal of Structural Engineering 125 (6): 605–12.
Roeder, C.W., Cameron, B., and Brown, C.B., (1999) Composite action in concrete filled tubes,
Structural Engineering, ASCE, Vol 125, No. 5, May 1999, pp. 477-84.
Roeder, C.W, Lehman, D.E., and Thody, R. (2009) Composite Action in CFST Components
and Connections, AISC Engineering Journal, AISC, Vol 46, No. 4, pp. 229-42.
Roeder, C.W., Lehman, D.E., and Bishop, E. (2010). Strength and Stiffness of Circular Concrete
Filled Tubes, ASCE Journal of Structural Engineering, Vol 135, No. 12, pgs 1545-53,
Reston, VA.
Schoettler, M., Restrepo, J.I., Guerrini, G, Duck, D.E., Carrea, F. (2012), “A Full-Scale, Single-
Column Bridge Bent Tested by Shake-Table Excitation.”, Center for Civil and
Engineering Earthquake Research, Department of Civil Engineering/258, University of
Nevada, Reno, Accessed May 29, 2014. https://nees.org/resources/6868.
Stephens, M.T., Lehman, D.E, and Roeder, C.W. (2015). Concrete-Filled Tube Bridge Pier
Connections for Accelerated Bridge Construction. Technical Report CA15-2417,
California Department of Transportation.
Tran, H.V. (2015). “Drilled Shaft Socket Connections for Precast Columns in Seismic Regions.”
PhD Thesis, University of Washington, Seattle, WA.
Trejo, D., Barbosa, A.R., and Link, T. (2014). “Seismic Performance of Circular Reinforced
Concrete Bridge Columns Constructed with Grade 80 [550] Reinforcement.” Research
SRS 500-610, Report No. FHWA-OR-RD-15-02. Oregon State University. URL:
http://www.oregon.gov/ODOT/TD/TP_RES/docs/Reports/2014/14RS0500_610_Seismic
ReportFinal.pdf (accessed Nov. 4, 2014)
WSDOT BDM (2012). “Bridge Design Manual (LRFD)”, Washington State Department of
Transportation, Olympia, Washington, August.
Yeh, I.C. (2006). “Generalization of Strength versus Water–cementitious Ratio Relationship to
Age.” Cement and Concrete Research 36 (10): 1865–73.
doi:10.1016/j.cemconres.2006.05.013.