High Mobility of Vesicles Supports Continuous Exocytosis at a Ribbon Synapse
11
Current Biology, Vol. 14, 173–183, February 3, 2004, 2004 Elsevier Science Ltd. All rights reserved. DOI 10.1016/j.cub.2003.12.053 High Mobility of Vesicles Supports Continuous Exocytosis at a Ribbon Synapse mation in the cochlea. At the active zone, they contain an osmiophilic structure called the ribbon, or dense body, to which large numbers of vesicles attach by short Matthew Holt, 1,2,4 Anne Cooke, 1,4 Andreas Neef, 1,3,4 and Leon Lagnado 1, * 1 Medical Research Council Laboratory of Molecular Biology filaments [1–4]. The voltage signals that control neuro- Hills Road transmitter release from ribbon synapses are graded Cambridge CB2 2QH with the intensity of the stimulus and maintained ac- United Kingdom cording to the duration of the stimulus [5]. These main- tained signals stimulate a continuous cycle of exo- cytosis and endocytosis in retinal photoreceptors and Summary bipolar cells [6–8], as well as cochlear hair cells [9, 10]. Ribbons are not found at conventional synapses releas- Background: Most synapses release neurotransmitter ing transmitter in response to action potentials. as transient pulses, but ribbon synapses of sensory neu- The fact that the ribbon holds vesicles immediately rons support continuous exocytosis in response to behind docking sites at the active zone suggests that maintained stimulation. We have investigated how the it acts as a store of vesicles for exocytosis [2, 13]. The movement and retrieval of vesicles might contribute to most direct evidence for this idea comes from the work continuous exocytosis at the ribbon synapse of retinal of Zenisek et al. [14], who used total internal reflection bipolar cells. fluorescence microscopy (TIRF) to image individual ves- Results: Using a combination of total internal reflection icles in the synaptic terminal of retinal bipolar cells. Their fluorescence microscopy and fluorescence recovery results demonstrate that active zones of exocytosis co- after photobleaching, we found that the great majority incide with structures that hold vesicles behind the of vesicles within 50–120 nm of the plasma membrane plasma membrane until stimulation causes the transfer move in a random fashion with an effective diffusion of these vesicles to the plasma membrane. These struc- coefficient of 1.5 10 2 m 2 s 1 . Using confocal mi- tures were suggested to be ribbons holding vesicles “in croscopy, we found that vesicles are similarly mobile reserve” behind the active zone [14]. The idea that vesi- across the whole terminal and that this motion is not cle clustering and mobilization are different at ribbon altered by calcium influx or the actin cytoskeleton. We synapses than at conventional synapses is also sup- calculated that the cytoplasmic reservoir of 300,000 ported by the observation that ribbon synapses lack vesicles would generate about 900 vesicle collisions/s synapsins, vesicle-associated proteins that bind to the against ribbons and 28,000 collisions/s against the sur- actin cytoskeleton [15, 16]. Conventional synapses are face membrane. The efficient resupply of vesicles to rich in synapsin I, which is thought to cause clustering ribbons was confirmed by electron microscopy. A 1 min of the reserve pool of vesicles behind the active zone depolarization, releasing 500–1000 vesicles/s, caused a [17, 18]. 70% reduction in the number of vesicles docked at the To understand how ribbon synapses are able to sup- active zone without reducing the number of vesicles port continuous exocytosis, one must understand the attached to ribbons or remote areas of the plasma mem- process of supplying vesicles to ribbons and plasma brane. These sites were not repopulated by retrieved membrane and the factors that might affect vesicle clus- vesicles because 80–90% of the recycled membrane tering. We have investigated these questions at the rib- was taken up into cisternae that pinched off from the bon synapse of retinal bipolar cells by using TIRF to surface. monitor vesicle movements within 50–120 nm of the Conclusions: These results indicate that the random plasma membrane [14, 19] and confocal microscopy to motion of cytoplasmic vesicles provides an efficient monitor movements over distances of microns. Using supply to the ribbon and plasma membrane and allows electron microscopy, we also investigated the routes of the maintenance of high rates of exocytosis without an membrane retrieval during maintained stimulation and equally rapid recycling of vesicles. The selective deple- the source of vesicles replenishing ribbons and active tion of vesicles docked under ribbons suggests that the zones. The results indicate that the random motion of transfer of vesicles to the active zone limits the rate of vesicles is sufficient to maintain the supply of vesicles exocytosis during maintained stimulation. to ribbons and plasma membrane during continuous exocytosis. These results stand in stark contrast to ob- Introduction servations made at conventional synapses, where the motion of synaptic vesicles is greatly restricted [20, 21]. Ribbon synapses of sensory neurons begin the transfer of both visual information in the retina and auditory infor- Results *Correspondence: [email protected] 2 Present address: Neurobiology Division, Max-Planck-Institute for Synaptic Vesicles Close to the Plasma Biophysical Chemistry, D37077 Go ¨ ttingen, Germany. Membrane Were Highly Mobile 3 Present address: Institu ¨ t fu ¨ r Biologische Informationsverarbeitung To label vesicles in the synaptic terminal of bipolar cells, Forschungszentrum Ju ¨ lich, D52425 Ju ¨ lich, Germany. 4 These authors contributed equally to this work. we applied FM1-43 during a depolarizing stimulus last-
-
Upload
matthew-holt -
Category
Documents
-
view
212 -
download
0
Transcript of High Mobility of Vesicles Supports Continuous Exocytosis at a Ribbon Synapse
Current Biology, Vol. 14, 173–183, February 3, 2004, 2004 Elsevier Science Ltd. All rights reserved. DOI 10.1016/j .cub.2003.12.053
High Mobility of Vesicles SupportsContinuous Exocytosis at a Ribbon Synapse
mation in the cochlea. At the active zone, they containan osmiophilic structure called the ribbon, or densebody, to which large numbers of vesicles attach by short
Matthew Holt,1,2,4 Anne Cooke,1,4 Andreas Neef,1,3,4
and Leon Lagnado1,*1Medical Research CouncilLaboratory of Molecular Biology filaments [1–4]. The voltage signals that control neuro-Hills Road transmitter release from ribbon synapses are gradedCambridge CB2 2QH with the intensity of the stimulus and maintained ac-United Kingdom cording to the duration of the stimulus [5]. These main-
tained signals stimulate a continuous cycle of exo-cytosis and endocytosis in retinal photoreceptors and
Summary bipolar cells [6–8], as well as cochlear hair cells [9, 10].Ribbons are not found at conventional synapses releas-
Background: Most synapses release neurotransmitter ing transmitter in response to action potentials.as transient pulses, but ribbon synapses of sensory neu- The fact that the ribbon holds vesicles immediatelyrons support continuous exocytosis in response to behind docking sites at the active zone suggests thatmaintained stimulation. We have investigated how the it acts as a store of vesicles for exocytosis [2, 13]. Themovement and retrieval of vesicles might contribute to most direct evidence for this idea comes from the workcontinuous exocytosis at the ribbon synapse of retinal of Zenisek et al. [14], who used total internal reflectionbipolar cells. fluorescence microscopy (TIRF) to image individual ves-Results: Using a combination of total internal reflection icles in the synaptic terminal of retinal bipolar cells. Theirfluorescence microscopy and fluorescence recovery results demonstrate that active zones of exocytosis co-after photobleaching, we found that the great majority incide with structures that hold vesicles behind theof vesicles within 50–120 nm of the plasma membrane plasma membrane until stimulation causes the transfermove in a random fashion with an effective diffusion of these vesicles to the plasma membrane. These struc-coefficient of �1.5 � 10�2 �m2 s�1. Using confocal mi- tures were suggested to be ribbons holding vesicles “incroscopy, we found that vesicles are similarly mobile reserve” behind the active zone [14]. The idea that vesi-across the whole terminal and that this motion is not cle clustering and mobilization are different at ribbonaltered by calcium influx or the actin cytoskeleton. We synapses than at conventional synapses is also sup-calculated that the cytoplasmic reservoir of �300,000 ported by the observation that ribbon synapses lackvesicles would generate about 900 vesicle collisions/s synapsins, vesicle-associated proteins that bind to theagainst ribbons and 28,000 collisions/s against the sur- actin cytoskeleton [15, 16]. Conventional synapses areface membrane. The efficient resupply of vesicles to rich in synapsin I, which is thought to cause clusteringribbons was confirmed by electron microscopy. A 1 min of the reserve pool of vesicles behind the active zonedepolarization, releasing 500–1000 vesicles/s, caused a [17, 18].70% reduction in the number of vesicles docked at the To understand how ribbon synapses are able to sup-active zone without reducing the number of vesicles port continuous exocytosis, one must understand theattached to ribbons or remote areas of the plasma mem- process of supplying vesicles to ribbons and plasmabrane. These sites were not repopulated by retrieved membrane and the factors that might affect vesicle clus-vesicles because 80–90% of the recycled membrane tering. We have investigated these questions at the rib-was taken up into cisternae that pinched off from the bon synapse of retinal bipolar cells by using TIRF tosurface. monitor vesicle movements within 50–120 nm of theConclusions: These results indicate that the random plasma membrane [14, 19] and confocal microscopy tomotion of cytoplasmic vesicles provides an efficient monitor movements over distances of microns. Usingsupply to the ribbon and plasma membrane and allows electron microscopy, we also investigated the routes ofthe maintenance of high rates of exocytosis without an membrane retrieval during maintained stimulation andequally rapid recycling of vesicles. The selective deple- the source of vesicles replenishing ribbons and activetion of vesicles docked under ribbons suggests that the zones. The results indicate that the random motion oftransfer of vesicles to the active zone limits the rate of vesicles is sufficient to maintain the supply of vesiclesexocytosis during maintained stimulation. to ribbons and plasma membrane during continuous
exocytosis. These results stand in stark contrast to ob-Introduction servations made at conventional synapses, where the
motion of synaptic vesicles is greatly restricted [20, 21].Ribbon synapses of sensory neurons begin the transferof both visual information in the retina and auditory infor-
Results*Correspondence: [email protected] Present address: Neurobiology Division, Max-Planck-Institute for Synaptic Vesicles Close to the PlasmaBiophysical Chemistry, D37077 Gottingen, Germany.
Membrane Were Highly Mobile3 Present address: Institut fur Biologische InformationsverarbeitungTo label vesicles in the synaptic terminal of bipolar cells,Forschungszentrum Julich, D52425 Julich, Germany.
4 These authors contributed equally to this work. we applied FM1-43 during a depolarizing stimulus last-

Current Biology174
Figure 1. Synaptic Vesicles Close to the Plasma Membrane Were Highly Mobile
(A) A sequence of five consecutive TIRF images obtained with an integration time of 126 ms. The white arrow shows a vesicle that appearsin a similar position in frames b and c and then disappears. The red arrow shows a vesicle that appears in a similar position in frames a andb before disappearing. Images were obtained in 0 Ca2�. The scale bar represents 10 �m.(B) A second sequence of five frames from the same terminal. The red arrow shows a vesicle visible in a similar position in frames a and b.The green arrow marks two spots that were consistently bright, although the fluorescence also fluctuated (see also [A]). These appeared tobe sites where vesicles preferentially approached the membrane. The full sequence of images is shown in Movie 1.(C) The decay in the autocorrelation function, C(t), as a function of the time delay, t (black line). The graph shows results for the terminalillustrated in A and B. The gray line is a fit of Equation 1 with D � 4 � 10�2 �m2/s.(D) Autocorrelation function from a second terminal. The decay is faster and fitted with a greater diffusion coefficient, D � 7 � 10�2 �m2/s.
ing 5 s and then washed it off. We expected this brief quence. An analogy can be drawn with FluorescenceCorrelation Spectroscopy (FCS), which allows the diffu-stimulus to load 1%–2% of the vesicles in the terminal
[8, 19]. Using TIRF, we observed individual vesicles sion coefficient of fluorescent molecules travelingthrough a small excitation volume to be estimated fromwithin about 100 nm of the plasma membrane as fluores-the temporal correlation of the fluorescence signal fromcent puncta with an intensity profile similar to the point-that volume [22]. Taking into account both temporal andspread function of the microscope [14, 19]. Examplesspatial components of our recorded image sequences,are shown in Figures 1A and 1B, which are two se-we therefore derived the autocorrelation function, C(t),quences of images obtained from the same footprint atfor puncta diffusing freely in the evanescent field (seeframe intervals of 126 ms. Many vesicles were mobileSupplemental Data). The resulting expression isand moved in and out of the evanescent field in direc-
tions both normal and parallel to the plane of the mem-C(t) � C0 �
C1
1 � Dt/�2 �(1 � 2Ret)w[i(Ret)1/2] � 2�Ret� �
1/2
� (1)brane (Movie 1, in the Supplemental Data available withthis article online).
Visual inspection of the movies suggested that most where D is the effective diffusion coefficient, � is thevesicles within about 150 nm of the plasma membrane standard deviation of the 2D Gaussian profile describingmoved in a random fashion. To assess this idea, we the point-spread function of the microscope (155 nm),investigated the correlations in image sequences. The and Re � D/d2, where d is the length-constant for decayarrows in Figures 1A and 1B show examples of individual of the evanescent field. The two examples in Figure 1Cpuncta that were visible for two or more frames at show that this expression provides an adequate de-roughly the same x-y location before disappearing. Of scription of the measured autocorrelation with valuescourse, the faster the vesicles move, the less likely and of D � 4 � 10�2 �m2/s and 7 � 10�2 �m2/s. The average
value of D in six cells was 3 2 � 10�2 �m2/s.shorter-lived are such correlations in an image se-

Vesicle Mobility at a Ribbon Synapse175
The estimate of D provided by the autocorrelationfunction is likely to be a lower limit for the effectivediffusion coefficient of “free” vesicles because it doesnot differentiate between vesicles in the cytoplasm andthose that are attached to the plasma membrane andribbons [29]. A small proportion of the fluorescentpuncta did indeed appear to be “captured” at the plasmamembrane (Figure 1 and Movie 1). The mean lifetime ofthese captured vesicles has been measured as about4 s [14], which is considerably longer than the decay inthe autocorrelation function (Figure 1C). The contribu-tion of tethered vesicles to the time-dependent part ofthe correlation signal is therefore likely to have beenrelatively small.
Using TIRF-FRAP to Estimate the Mobilityof Synaptic VesiclesTo further assess the speed of vesicle movement in theregion close to the plasma membrane, we used FRAPin conjunction with TIRF imaging. Figure 2A shows anexample experiment in which two brief periods of photo-bleaching were applied (the full sequence is shown inMovie 2). The first bleach caused an almost completedisappearance of fluorescence (Figure 2A, compare im-ages a and b), and recovery occurred within about 15 s(Figure 2A, image d). The mean fluorescence over thefootprint is shown in Figure 2B. The first bleach reducedthe steady-state level of fluorescence by about 43%,indicating the existence of immobile sources of fluores-cence. Comparing images a and c (Figure 2A) indicatesthat this immobile fluorescence originated from twosources: large stationary structures, probably corre-sponding to large endocytic compartments taking upFM1-43 [23], and residual FM1-43 in the plasma mem-brane or on the surface of the coverslip. When regionsof the coverslip free of cells were imaged, FM1-43attached to the surface bleached very rapidly, probably Figure 2. Measuring Synaptic Vesicle Mobility with TIRF-FRAPbecause the surface of the coverslip experienced the (A) Images from a typical TIRF-FRAP experiment. The scale barevanescent field at maximum intensity. It therefore represents 10 �m.seems likely that the sag in the fluorescence level at the (B) The mean intensity over the footprint in the experiment illustrated
in (A). Letters mark the timing of the corresponding images. Thebeginning of the observation period reflects bleaching ofbleach reduced the fluorescence by 80% (images a and b), afterFM1-43 on the coverslip surface and plasma membrane.which vesicles reappeared in the footprint (c and d). Recovery fromWe confirmed that most of the remaining fluorescencethe first bleach occurred with � 5.7 s, to a level equivalent to 57%
was mobile by applying a second, identical bleach, after of the prebleach value. Recovery from the second bleach occurredwhich 76% recovery was achieved in 10 s. Photobleach- with � 5 s, and recovery was equivalent to 76% of the prebleaching of synaptic vesicles during observation periods was fluorescence. In this example, the effects of Ca2� on vesicle mobility
were tested via application of 50 mM K�/2.5 mM Ca2� over thenot significant because fluorescence levels reached aperiod indicated by the lower bar.steady-state after both bleaches. We obtained a good(C) TIRF-FRAP results could be described by a simple model imple-empirical description of the time course of recovery bymented in Virtual Cell and described in the Supplemental Data.
using exponential functions. In five cells maintained in Experimental results (black trace) from the second bleach in (A).0 Ca2�, the fluorescence over the footprint recovered Using a diffusion coefficient of D � 9 � 10�3 �m2/s, the model (graywith a time constant that averaged 4.3 1.8 s. trace) predicts the time course of the bleach (inset), as well as
recovery from the bleach.Previous work has shown that Ca2� can acceleratethe processes supplying vesicles for fast exocytosis inbipolar cells [24]. To test whether this might be attributedto greater mobility of vesicles during Ca2� influx, we cence during depolarization in Ca2� had an average �
5.7 2.5 s. Therefore, Ca2� influx did not significantlydepolarized bipolar cells in 50 mM K�/2.5 mM Ca2� afterthey had recovered from the first bleach. In the example affect vesicle mobility.
We also estimated the effective diffusion coefficientshown in Figure 2A, fluorescence recovery after the firstbleach (in 0 Ca2�) was described by a time constant of of vesicles by using the Virtual Cell modeling environ-
ment to estimate the FRAP experiments [25] (the model6.7 s, whereas recovery from the second bleach (in Ca2�)occurred with � 5 s. In five cells, recovery of fluores- is described in the Supplemental Data). The continuous

Current Biology176
line in Figure 2C shows that this model adequately de- periphery of the terminal nor Ca2� influx significantlyaffected the motion of vesicles.scribed fluorescence recovery after photobleaching.
The estimated mean value of D was 9 4 � 10�3 �m2/s.A simpler way to estimate D from the time course of
Collision of Vesicles with the Synaptic Ribbonfluorescence recovery is to use the expression D �and Plasma Membranew2/2, which relates the diffusion coefficient of a speciesCan the random motion of vesicles at this synapse ac-moving in 1D to the time constant of equilibration acrosscount for the transfer of vesicles to sites of exocytosis?a distance w. Taking w as three length-constants of theTo address this question, we needed to obtain estimatesevanescent field (3 � 120 nm), we estimated D to befor the concentration of vesicles in the terminal, theabout 1.3 � 10�2 �m2/s. FRAP measurements, therefore,number of ribbons at the surface membrane, and theprovided an estimate of D about one third to one halfdimensions of the ribbons. We measured these and re-that obtained by measuring the autocorrelation function.lated quantities by using electron microscopy.A Reservoir of Hundreds of Thousandsof Synaptic VesiclesSynaptic Vesicles Were MobileThe great majority of synaptic vesicles were not associ-across the Whole Terminalated with ribbons but appeared to be free within theMeasurements of vesicle mobility over larger regions ofcytoplasm. The density of these “free” vesicles variedthe synaptic terminal were made via confocal micros-across the terminal. We defined three regions, illustratedcopy and FRAP. For these experiments, the whole ofin Figures 5A and 5B: an outer zone, extending up tothe cycling vesicle pool was loaded via application of0.5 �m from the surface membrane; an inner zone, withFM1-43 during 6 min of continuous stimulation [7]. Fig-internal boundary 1.8 �m from the surface, and a centralure 3A shows images obtained from an experiment inzone. In three terminals at rest, the density of vesicleswhich FM1-43 was bleached in approximately half thewas 524 84 �m�3 in the outer zone, 472 75 �m�3terminal. Fluorescence recovery in this area reachedin the inner zone, and 212 69 �m�3 in the central zone.equilibrium in 18.4 s, and fluorescence in the unbleachedThe density of vesicles in the central zone was lowerarea was lost with similar kinetics (Figure 3B). The redis-because mitochondria occupied a large fraction of thistribution of fluorescence across this terminal is shownvolume (Figure 5A). The exclusion of vesicles from thein Figure 3C. Before the bleach, the fluorescence wascentral region of the terminal explains why compart-higher in the periphery compared to the center, re-ments loaded with FM1-43 tended to be most denseflecting the exclusion of vesicles from the center of thein the outer margins of the terminal, as shown by theterminal by mitochondria (Figure 5 and below). Immedi-fluorescence images in Figures 3 and 4.ately after the bleach there was a steep fluorescence
We used these densities to calculate the total numbergradient (Figure 3, trace b), and this relaxed over a periodof vesicles in an average terminal after having imagedof tens of seconds (Figure 3, traces c–e). Fluorescentthe three-dimensional shape of the terminal by serialvesicles were therefore mobile throughout the terminal;sectioning with a confocal microscope. Figure 5F showsthat is, over distances of about 10–12 �m. In eight cells,top and side elevations of a terminal in which endocyticequilibration across the whole terminal occurred with acompartments had been labeled with FM1-43; it wastime constant of 19.9 5.9 s.shaped roughly as a sphere with a flat base. Approximat-ing the average terminal as a sphere with a diameter of11 �m, we calculated that it would contain about 230,000The Actin Cytoskeleton Did Not
Affect Vesicle Mobility free vesicles within 1.8 �m of the plasma membraneand a further 50,000 vesicles through the rest of itsStimulation of depolarizing bipolar cells over periods of
minutes leads to the growth of a dense actin network volume.The Number and Shape of Ribbonsthat extends about 2 �m from the plasma membrane
[23, 26]. Figure 3 shows that this is also the region of the Ribbons from resting and stimulated cells are shown inFigures 6A and 6B. The average density of ribbons atterminal with the most intense FM1-43 staining. Might
vesicles tend to congregate in the periphery of the termi- the surface membrane was 0.1 0.13 �m�2, after cor-rection for the fact that about 31% of a ribbon is con-nal because they are less mobile in this region? To test
this idea, we made FRAP measurements in small zones tained in a single section 90 nm thick [27, 28] (see Sup-plemental Data). The average terminal has a capacitance(approximately 1.6 �m2), either directly adjacent to the
plasma membrane or in the center of the terminal (Figure of about 3.1 pF, which converts to a surface area of 390�m2, so the total number of ribbons at the surface of a4A). When these measurements were made in the ab-
sence of external Ca2�, the mean time constant of recov- terminal averaged 39.In single sections that were 90 nm thick, the ribbonsery was 18.8 7.2 s in the periphery (n � 5) and 14.5
6.1 s in the center of the cell (n � 5). When these mea- resembled the spherical dense bodies of saccular haircells [29]. We made two simple shape measurementssurements were made during stimulation in 50 mM K�/
2.5 mM Ca2�, the time constants were 13.5 2.5 s in from sections where the ribbon could be seen: the heightof the ribbon above the plasma membrane (230 14the periphery (n � 4) and 8.76 3.9 s in the center (n �
5), respectively. There was no significant difference in nm, n � 16 ribbons) and the width at its widest point(200 11 nm; Figure 6C). The “average” outline of athe rates of recovery under any of these conditions (Stu-
dent’s two-tailed t test, significance set at P � 0.05). ribbon in a single section was therefore closer to anellipse than a circle (Figure 6E). The surface area ofWe conclude that neither the actin cytoskeleton in the

Vesicle Mobility at a Ribbon Synapse177
Figure 3. Vesicles Were Mobile throughoutthe Synaptic Terminal
(A) A series of confocal fluorescence imagesillustrating a typical confocal FRAP experi-ment. The entire pool of vesicles was loadedwith FM1-43 by stimulation for 6 min in thepresence of FM1-43 (image a; see Experi-mental Procedures). Approximately half ofthe terminal was bleached (image b). Imagesc, d, and e were obtained 10, 20, and 60 s afterthe bleach. The scale bar represents 10 �m.(B) The total fluorescence in the bleachedarea, unbleached area, and whole terminalduring the course of the experiment illus-trated in (A). Results are normalized to theresting fluorescence of the whole terminal.The letters mark the timing of the images in(A). Fluorescence recovery in the bleachedarea could be described by a single exponen-tial curve (red line) with � 18.4 s.(C) Line profiles showing the distribution offluorescence across the terminal were ob-tained from the images in (A) (the regionshown by the red box in image b was used).The fluorescence gradient that exists imme-diately after bleaching (b) gradually recoversto mirror the profile measured before thebleach. The higher fluorescence in the pe-riphery reflects the higher density of vesicles.
the ribbon was calculated as 0.138 �m2, but the area �m2 of the dense-body surface (n � 43) and 62 vesiclesattached to a ribbon. The number of vesicles dockedcovered by vesicles associated with ribbons was larger
(0.4 �m2) because vesicles attach to ribbons via fila- under the ribbon was estimated to be 18, obtained bymultiplying the average vesicle density by the area castments (Supplemental Data).
Vesicles Attached to Ribbons by the ribbon on the plasma membrane. Detailed de-scriptions of all these calculations are provided in theThese were grouped into two types: “docked” vesicles
touched the plasma membrane, and “reserve” vesicles Supplemental Data. We therefore estimate that an aver-age terminal with 39 ribbons at the surface would con-were attached to the portion of the ribbon projecting
into the cytoplasm (Figures 6C and 6E). Docked vesicles tain a total of about 2400 reserve vesicles and 700 vesi-cles docked under the ribbons. Vesicles associated withwere considered to be associated with the ribbon if they
were within 150 nm of the point where the longitudinal ribbons at the surface membrane therefore constitutedonly 1% of all vesicles in the terminal.axis of the ribbon apposed the plasma membrane. To
estimate the density of these vesicle populations, we cut Vesicle CollisionsIf the synaptic ribbon has a surface area A and vesicles insections normal to the plane of the plasma membrane
through a central region of a dense body, where vesicles the vicinity are at a concentration of C, then the averagenumber of vesicles expected to collide with the ribbonwere packed closely enough to appear to be in a contig-
uous line forming a “halo” around the ribbon (examples per second will be approximately 2AC · �D/� (Supple-mental Data). Similarly, the number of collisions thatare shown in Figures 6A and 6B). We estimated an aver-
age packing density of 440 28 reserve vesicles per vesicles make per unit area of the plasma membrane will

Current Biology178
Figure 4. Vesicles in Different Regions of the Cell Were EquallyMobile
(A) The mobility of vesicles in the peripheral regions of the terminalwas tested by bleaching of the small region shown by the greensquare (approximately 1.6 �m2). The image a shows the terminalimmediately before bleaching, whereas images b and c were ob-tained 2 s and 4 s after bleaching. Maintaining the cell in 0 Ca2�
blocked exocytosis. The scale bar represents 10 �m.(B) Averaged results from experiments of the type shown in (A).There was no significant difference in the time constants of fluores-cence recovery after the periphery or the center was bleached, eitherin 0 Ca2� or 50 mM K�/2.5 mM Ca2�. Quantifying all experiments asthe ratio between the fluorescence in the bleached area (e.g., greenbox in image b) and an equivalent area that was not bleached (e.g.,yellow box in image b) compensated for dye loss during experimentscarried out in the presence of Ca2� influx.
Figure 5. A Large Reservoir of Synaptic Vesicles Was Present inbe 2C · �D/�. The electron-microscopic measurements the Terminalindicate that the ribbon area A � 0.3 �m2, including (A) An electron micrograph showing a single section from the termi-
nal of an isolated cell.tethers, and C � 524 �m�3. Using D � 1.5 � 10�2 �m2/s(B) Dividing the cytoplasm of the terminal into three zones, as shown,as a mean of the estimates obtained from the autocorre-allowed the distribution of synaptic vesicles to be assessed.lation function (Figure 1) and TIRF-FRAP (Figure 2), we(C and D) A magnified image of a region taken from the section inexpect about 22 collisions /s against a single ribbon and(A) shows how all circular clear-core structures in (A) were marked
860 collisions against the 39 ribbons. We also calculate (red circles in [D]). A clear-core structure was counted as a vesiclethat there will be 72 vesicle collisions per square micron if it had a diameter less than 75 nm (see Supplemental Data).
(E) Vesicle numbers plotted as a function of the volume in whichof the surface membrane (a total of 28,000 collisions/sthey were counted for each of the three zones in (B). The resultsover the whole terminal). In comparison, continuous ex-have been fitted by straight lines, the gradients of which give theocytosis can occur at rates of 500–1000 vesicles/s, withvesicle density per unit volume.30%–40% of vesicles fusing outside active zones [14].(F) The shape of a terminal was assessed from a 3D reconstruction
These results indicate that the random motion of vesi- of a terminal loaded with FM1-43. The left and middle panels showcles in the bipolar cell terminal may be sufficient to top and side elevations. The right panel shows an idealized terminal
as a sphere with a diameter of 11 �m.support continuous exocytosis while preventing deple-tion of the ribbon or docking sites on the plasma mem-brane.
6B. The stimulus was a 1 min exposure to 50 mM K�
and 2.5 mM Ca2�, after which simultaneously removingDepletion of Docked Vesicles without Depletionof the Ribbon Ca2� and applying ice-cold fixative stopped the vesicle
cycle within seconds. Depolarization for 1 min is ex-To investigate how efficiently vesicle pools in the termi-nal were maintained during continuous exocytosis, we pected to release 30,000–60,000 vesicles [7, 8], or 10–20
times the number associated with synaptic ribbons.investigated the ultrastructural changes associated withmaintained stimulation. A comparison of ribbons from To assess the effects of this stimulus, we began by
counting the number of vesicles docked under a ribbonresting and stimulated cells is shown in Figures 6A and

Vesicle Mobility at a Ribbon Synapse179
Figure 6. Stimulation Altered the Ultra Struc-ture of the Ribbon and Surrounding Area
(A) A synaptic ribbon at the surface mem-brane of an unstimulated terminal. Clear-corevesicles (sv) surround the cytoplasmic faceof the synaptic ribbon (sr) and are alsoattached to the plasma membrane immedi-ately below. Glycogen granules appear asdenser particles, slightly smaller than ves-icles.(B) A synaptic ribbon (sr) at the surface mem-brane of a terminal stimulated for 1 min. Thearrowhead shows an “omega-shape,” typicalof exocytic/endocytic sites. Tubular invagi-nations of the plasma membrane occur at themargins of the active zone, and cisternae oc-cur within the cytoplasm (arrows). Note thatsmall vesicles (sv) still surround the synapticribbon.(C) Vesicles that were attached to the cyto-plasmic face of the synaptic ribbon (white)and docked underneath the dense body onthe plasma membrane (red) were counted.The height and the width of the synaptic rib-bon were measured as shown by the arrows.(D) A ribbon-associated vesicle containingferritin is shown (arrowhead). Again, cister-nae, infoldings, and other large internal mem-brane compartments (arrows) are colocalizedwith the synaptic ribbon.(E) Idealized diagram of a surface ribbonshowing attached (white) and docked (black)vesicles surrounding a synaptic ribbon (gray).
(F) Cisternae, infoldings, and large internal membrane compartments associated with ribbons were endocytic because they were labeled withferritin taken up during stimulation (visible as small electron-dense particles, arrows).
in single sections. Our definition of “docked” was rela- tially trafficked into the readily releasable pool ratherthan the reserve pool [30, 31]. Endocytosis during main-tively strict: no discernible space between the vesicle
membrane and plasma membrane. By this criterion, tained stimulation was investigated by electron micros-copy, with cationic ferritin labeling the plasma mem-there were four docked vesicles in the sections from
unstimulated cells shown in Figures 6A and 6C and one brane [32, 33]. Ferritin was only present on the surfaceof unstimulated cells (Figure 7A) but was widely takenvesicle in the sections from stimulated cells in Figures
6B and 6F. The number of docked vesicles counted in up into internal compartments in response to Ca2� influx,as shown by the examples in Figures 6D, 6F, and 7B–7H.single sections averaged 4.3 0.7 at rest (n � 14 rib-
bons), but after 1 min stimulation it was reduced to Many of these membrane compartments were relativelylarge and appeared close to the surface membrane,1.2 0.2 (n � 10). Next, we counted the reserve pool
of vesicles. The number of vesicles attached to the cyto- especially in regions around synaptic ribbons (Figures6B, 6D, and 6F). Deep invaginations of the surface mem-plasmic face of the ribbon in a single section averaged
12.5 0.7 at rest (n � 14 ribbons) and 11.5 1.0 after brane were also labeled (Figure 7H), strongly suggestingthat cisternae were formed by direct uptake of these1 min of continuous exocytosis (n � 10). A stimulus
releasing 10–20 times the number of vesicles attached to large chunks of membrane.Cationic ferritin was also taken up into small compart-ribbons did not, therefore, deplete the ribbon (compare
Figures 6A and 6B). The number of vesicles docked to ments the size of vesicles (Figures 7E and 7F). Thesevesicles may have originated from the “omega” shapes,the plasma membrane at sites remote from ribbons was
also unaffected. At distances greater than 750 nm from or “pits,” that formed on the plasma membrane (Figures6B and 7G). The micrographs in Figures 6 and 7, there-the center of a ribbon, the density of docked vesicles
was 0.97 0.06 �m�2 in resting terminals (n � 3) and fore, suggest that retrieval of surface membrane intosmall vesicles occurred in parallel with bulk uptake into1.1 0.13 �m�2 in stimulated terminals (n � 3). Stimula-
tion for 1 min therefore caused the selective depletion larger cisternal compartments.To assess the relative amounts of endocytosis intoof vesicles docked under ribbons.
small vesicles and large cisternae, we quantified thelabeling of these two compartments for three completeVesicle Recycling Was Relatively Slow
Is the random motion of vesicles in the cytoplasm the sections taken from the center of a synaptic terminal.The entire 28.00 �m3 volume of cytoplasm was foundonly process supplying vesicles to the synaptic ribbon?
An alternative possibility might be that ribbons are re- to contain 117 labeled vesicles and 125 labeled cister-nae of varying shape and size. The total amount of endo-plenished by newly retrieved vesicles. At hippocampal
boutons, for instance, recycled vesicles are preferen- cytosed membrane (7.94 �m2) was equivalent to 60%
Current Biology180
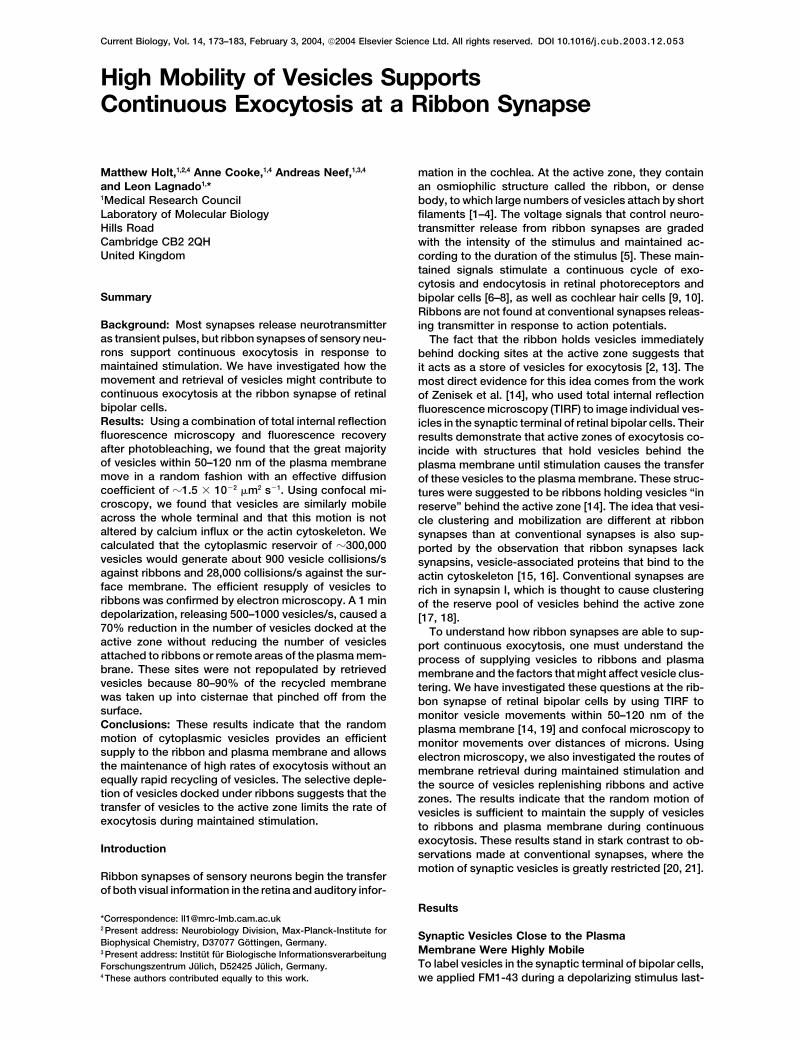
Might recycled vesicles be preferentially located atribbons? A survey of 15 surface ribbons in terminalsstimulated in the presence of cationic ferritin only pro-vided one example of a labeled vesicle, out of a total of255. In comparison, 117 labeled vesicles were observedin a cytoplasmic volume expected to contain about11,200 vesicles (if one assumed a mean density of 400vesicles �m�3). The density of recycled vesicles at rib-bons (�0.5%) was therefore comparable to the densityin the cytoplasm (�1%). We conclude that ribbons aremost likely to be supplied by the rapid motion of vesiclesfree in the cytoplasm rather than by the rapid local recy-cling close to the active zone.
Discussion
We have found that the great majority of the �300,000vesicles in depolarizing bipolar cells from the goldfishmove with an effective diffusion coefficient of about1.5 � 10�2 �m2/s and that this degree of mobility hasthe potential to maintain an efficient supply of vesiclesto the ribbon and plasma membrane during continuousexocytosis. We also found that the rate of vesicle recy-cling lagged behind vesicle release during a 1 min depo-larization but that there was no significant depletion ofvesicles attached to ribbons or regions of the plasmamembrane remote from ribbons. We therefore proposethat the cytoplasmic pool of mobile vesicles supportscontinuous exocytosis from the synaptic terminal of bi-
Figure 7. Labeling of Endocytic Compartments with Cationic Fer-polar cells by allowing the rapid replenishment of theritinribbon and plasma membrane without equally rapid re-
(A) The surface of an unstimulated terminal exposed to cationiccycling of vesicles. The selective depletion of vesiclesferritin. The marker was restricted to the plasma membrane.docked under ribbons suggests that the rate-limiting(B) The surface of a terminal stimulated for 1 min in the presence
of cationic ferritin, which also appears within internal compartments step during continuous exocytosis was the transfer of(arrows). vesicles from the ribbon to docking sites at the active(C and D) Further examples of internal compartments loaded with zone.ferritin. These are similar to cisternae formed in the absence offerritin (arrows).(E and F) Small vesicles were also labeled with ferritin (arrows). Some Continuous Exocytosis at a Ribbon Synapsevesicles were even in the central zone containing mitochondria (m) A model of the events involved in continuous exocytosisafter 1 min stimulation. is shown in Figure 8. The starting point is the idea that(G) Pits at the surface membrane labeled with ferritin (arrows).
continuous exocytosis occurs predominantly at ribbons(H) Large invaginations that were still connected to the surfacerather than other areas of the plasma membrane. Themembrane were also labeled with ferritin. The two arrowheads indi-
cate what may be budding vesicles. The arrow shows an endocytic imaging of single vesicle fusion events via TIRF supportscompartment that is no longer attached to the surface membrane. this idea. These occur predominantly at “preferred” sur-
face membrane sites with a density of 0.1 �m�2, verysimilar to the density of ribbons measured in this studyof the surface area of the three sections (13.17 �m2), a
figure in line with FM1-43 measurements indicating that [14, 34]. The second aspect of this model is the ideathat vesicles arriving at the active zone originate from thethe equivalent of about 60% of the resting surface mem-
brane is retrieved during a 1 min stimulation in 50 mM ribbon rather than the cytoplasmic reservoir. Vesiclesattached to the ribbon are much closer to the activeK�/2.5 mM Ca2� [7]. Cationic ferritin, therefore, labeled
endocytic compartments, including vesicles, with an ef- zone than vesicles in the cytoplasm, and the structureof the ribbon indicates that the great majority of vesiclesficiency similar to that of FM1-43. Using an average
vesicle diameter of 46 nm, we calculated the total mem- approaching the active zone will collide with the densebody before reaching the docking sites below (Figurebrane area of the vesicular component to be 0.78 �m2.
We found the surface area of cisternae by measuring 6). Direct support for the idea that the ribbon suppliesthe active zone comes from the imaging of single vesi-their perimeters and multiplying by 0.126 �m, the effec-
tive thickness of the section, giving an area of 7.17 �m2. cles via TIRF; these experiments indicate the existenceof a structure that specifically holds vesicles just behindThus, only about 10% of membrane retrieved during a
1 min stimulation appeared as small vesicles; the rate the active zone before their transfer to the plasma mem-brane [14, 34]. The selective depletion of the vesicleof vesicle recycling lagged behind vesicle release and
those vesicles that were reformed did not appear pool docked under ribbons suggests that this transferprocess becomes rate limiting during maintained stimu-docked to the active zone (Figure 7).

Vesicle Mobility at a Ribbon Synapse181
ted as indicating that the rate-limiting step for the overallvesicle cycle was the formation of new synaptic vesiclesfrom cisternae. In the present study, we probably onlyobserved depletion of vesicles docked under ribbonsbecause we used a 30-fold shorter stimulus that re-leased only 10%–20% of the total number of vesiclesin the terminal. The two sets of observations might bereconciled if continuous exocytosis, driven by depolar-ization to 0 mV, were initially maintained by the largereservoir of cytoplasmic vesicles, which then graduallydepleted over periods of tens of minutes. However, itseems unlikely that depletion of cytoplasmic vesicleswill ever limit the rate of exocytosis in response to physi-ological stimuli. Depolarization to 0 mV causes maximalactivation of the calcium current at ribbon synapsesFigure 8. Continuous Exocytosis at the Ribbon Synapse of Bipolarand drives exocytosis much more strongly than normalCellsstimuli, which do not depolarize the membrane beyondThere is a large reservoir of vesicles free in the cytoplasm (grayabout �30 mV [42, 43]. For instance, Burrone and Lag-circles) and smaller numbers of vesicles are attached to ribbons
(green circles) or docked under ribbons (red circles). Black arrows nado [44] found that depolarization to �10 mV stimu-pointing toward the plasma membrane show vesicle translocations lated exocytosis in bipolar cells 8–50 times more rapidlyinvolved in exocytosis. Orange arrows pointing away from the mem- than depolarizations to physiological potentials.brane show membrane recycling into two compartments: small vesi-cles and large cisternae. Dashed arrows show slower processes.During prolonged stimulation, the predominant mode of endocytosis
Vesicle Mobilityis bulk retrieval into cisternae. Resupply of vesicles to docking sitesThe high mobility of synaptic vesicles in the bipolar cellat the active zone is not fast enough to prevent depletion of docked
vesicles. stands in stark contrast to the highly restrained vesiclesobserved at the frog neuromuscular junction [20] andin cultured hippocampal neurons [21]. The restrictedmovement of vesicles at these synapses may be thelation (Figure 8, broken black arrow). The minimum timeresult of the vesicles being tethered to the actin cy-it takes for vesicle transfer and fusion at the active zonetoskeleton via the vesicle-associated protein synapsin.is about 250 ms [14].At these synapses, the cluster of vesicles behind theAt the neuromuscular junction and hippocampal bou-active zone can be disrupted by the introduction of anti-tons, the rapidly releasable pool (RRP) is refilled by fastbodies or peptides directed against synapsin [17, 44]localized recycling of vesicles [30, 35]. Endocytosis wasor by deletion of the synapsin gene [18]. These maneu-also efficient at the ribbon synapse of bipolar cells, butvers also result in pronounced synaptic depression dur-only 10%–20% of vesicles reformed within 1 min; theseing maintained stimulation. However, the great majoritywere mobile over distances of several microns andof ribbon synapses lack synapsins [15, 16], and themixed in with the large cytoplasmic reservoir of vesiclestransgenic expression of synapsin at the ribbon synapse(Figure 8, solid orange arrows). The majority of the re-of mouse photoreceptors did not alter the physiologytrieved membrane was in the form of large cisternae,of neurotransmitter release [45]. We did not observeoriginating from deep invaginations of the surface mem-any significant change in vesicle mobility in responsebrane. Tubular invaginations of the surface membraneto calcium influx or after maintained stimulation knownhave also been observed at the ribbon synapse of sac-to cause pronounced growth of the actin network (Figurecular hair cells [29, 36], as well as a variety of non-4; [23, 26]). Furthermore, disruption of the actin cytoskel-ribbon synapses [35, 37, 38]. Large cisternae were rareeton in the synaptic terminal of bipolar cells does notin resting terminals, suggesting that these compart-alter the properties of exocytosis or endocytosis, norments are a temporary structure during the recycling ofdoes it alter the processes that refill the RRP [23]. Thevesicles (Figure 8, broken orange arrow; see also [33]).mechanisms of vesicle clustering and mobilization atAn important aspect of the model in Figure 8, therefore,“ribbon” synapses therefore differ fundamentally fromis the idea that the large reservoir of cytoplasmic vesi-those in conventional synapses, allowing the support ofcles acts as a “buffer” between the exocytic and endo-continuous exocytosis during maintained stimulation.cytic limbs of the vesicle cycle and thus allows high
rates of transmitter release to be maintained withoutequally rapid reformation of small vesicles. Ribbon syn-
Experimental Proceduresapses of photoreceptors and hair cells also contain alarge reservoir of vesicles [2, 39–41], suggesting that Isolation and Stimulation of Depolarizing Bipolar Cells
Depolarizing bipolar cells were acutely dissociated from the retinaethis is a common design feature of neurons transmittingof goldfish via methods previously described [7]. Normal Ringer’smaintained signals.solution contained the following (in mM): 120 NaCl; 2.5 KCl; 1 MgCl2;At the ribbon synapse of frog saccular hair cells, a 302.5 CaCl2; 10 glucose; 10 HEPES (pH 7.3) 280 mOsm/Kg�1. For themin depolarization to 0 mV caused widespread deple-stimulation of vesicle cycling, cells were depolarized in Ringer’s
tion of vesicles, including those docked at the active solution containing 50 mM KCl, prepared by isoosmotic replacementzone, those attached to the dense body, and those free of NaCl. Preparing 0 Ca2� solutions that omitted CaCl2 and contained
1 mM EGTA prevented exocytosis during experiments.in the cytoplasm [29]. These observations were interpre-
Current Biology182
TIRFM microscopy and Jorg Enderlein for stimulating discussions on mobil-ity measurements.Cells were pulse-labeled with FM1-43 by local superfusion for 5 s
in 50 mM K�/2.5 mM Ca2� solution containing 15 �M of the dye. A5 s stimulus labels about 1%–2% of the total vesicle population [8]. Received: November 6, 2003Washing cells for 60 min in Ca2�-free Ringer’s solution subsequently Revised: December 4, 2003removed dye bound to the plasma membrane. TIRF was performed Accepted: December 4, 2003with an inverted microscope (Zeiss Axiovert S100TV) modified for Published: February 3, 2004evanescent-field epi-illumination (see Supplemental Data). ForFRAP measurements, the illumination intensity was altered with a Referencesfilter wheel, and the mean fluorescence of the terminal footprint wasmeasured with IPLab software. Diffusion coefficients were esti- 1. Kidd, M. (1962). Electron microscopy of the inner plexiform layermated via Fluorescence Correlation Spectroscopy (FCS) and Virtual of the retina in the cat and the pigeon. J. Anat. 96, 179–187.Cell modeling, described in detail in the Supplemental Data. 2. Gray, E.G., and Pease, H.L. (1971). On understanding the organi-
sation of the retinal receptor synapses. Brain Res. 35, 1–15.3. Lenzi, D., and von Gersdorff, H. (2001). Structure suggests func-Confocal Microscopy
Confocal microscopy was carried out with a Bio-Rad Radiance 2000 tion: the case for synaptic ribbons as exocytotic nanomachines.Bioessays 23, 831–840.scanhead (Bio-Rad) mounted on a Nikon TE300 inverted microscope
(Nikon) with a 60� Nikon PlanApo oil objective lens (NA 1.4). For 4. Lagnado, L. (2003). Ribbon synapses. Curr. Biol. 13, R631.5. Dowling, J.E. (1987). The Retina: An Approachable Part of thethe minimization of FM1-43 uptake by bulk membrane retrieval,
which occurs in the first minute of stimulation [23], bipolar cells Brain (Cambridge, MA: Harvard University Press).6. Rieke, F., and Schwartz, E.A. (1994). A cGMP-gated current canwere first depolarized in 50 mM K�/2.5 mM Ca2� for 3 min. The total
pool of recycling synaptic vesicles was then labeled by the addition control exocytosis at cone synapses. Neuron 13, 863–873.7. Lagnado, L., Gomis, A., and Job, C. (1996). Continuous vesicleof 10 �M FM1-43 to the external solution for 6 min (see Figure 4A).
After loading vesicles with FM1-43, cells were washed in 0 Ca2� cycling in the synaptic terminal of retinal bipolar cells. Neuron17, 957–967.solution to remove excess dye from the plasma membrane while
preventing exocytosis. FM1-43 was excited with the 488 nm line of 8. Rouze, N.C., and Schwartz, E.A. (1998). Continuous and tran-sient vesicle cycling at a ribbon synapse. J. Neurosci. 18, 8614–the argon ion laser with the emission being collected through a 500
nm long-pass filter. Results are expressed as the mean SEM. 8624.9. Moser, T., and Beutner, D. (2000). Kinetics of exocytosis andStatistical significance was tested with a Student’s two-tailed t test
of independent variables. Significance was set at P � 0.05. endocytosis at the cochlear inner hair cell afferent synapse ofthe mouse. Proc. Natl. Acad. Sci. USA 97, 883–888.
10. Glowatzki, E., and Fuchs, P.A. (2002). Transmitter release at theElectron Microscopy of Isolated Bipolar Cellshair cell ribbon synapse. Nat. Neurosci. 5, 147–154.Bipolar cells were plated onto Permanox dishes (Nalge Nunc Inter-
11. Burns, M.E., and Augustine, G.J. (1995). Synaptic structure andnational) and allowed to settle for 20–40 min. “Resting” conditionsfunction: dynamic organization yields architectural precision.were those in which exocytosis was inhibited by cells being main-Cell 83, 187–194.tained for 2 min in normal Ringer’s solution lacking Ca2�. For the
12. Wilson, M. (2003). Bassoon’s part in two presynaptic orchestras.stimulation of continuous exocytosis, cells were kept in 0 mM Ca2�
Neuron 37, 728–730.for 1 min and depolarized for the second minute using Ringer’s13. Muresan, V., Lyass, A., and Schnapp, B.J. (1999). The kinesinsolution containing 50 mM KCl/2.5 mM Ca2�. For the labeling of
motor KIF3A is a component of the presynaptic ribbon in verte-endocytic compartments, cells were prepared via an identical pro-brate photoreceptors. J. Neurosci. 19, 1027–1037.cedure with 2 mg/ml cationic ferritin (Sigma) added to the Ringer’s
14. Zenisek, D., Steyer, J.A., and Almers, W. (2000). Transport, cap-solutions during the 2 min prior to fixation. Ice-cold fixative wasture and exocytosis of single synaptic vesicles at active zones.applied within seconds via a custom-built perfusion system thatNature 406, 849–854.rapidly exchanged the fluid in the dish. Cells were then prepared
15. Mandell, J.W., Townes-Anderson, E., Czernik, A.J., Cameron,for sectioning via established methods (see Supplemental Data).R., Greengard, P., and De Camilli, P. (1990). Synapsins in theSections approximately 80–100 nm thick were subsequently cut withvertebrate retina: absence from ribbon synapses and heteroge-the knife so that they were parallel to the base of the dish. The initialneous distribution among conventional synapses. Neuron 5,two sections, which corresponded to where the terminal membrane19–33.lay flat on the dish, were not used because the surface of the dish
16. Von Kriegstein, K., Schmitz, F., Link, E., and Sudhof, T.C. (1999).was uneven. Sections were mounted onto copper grids, stainedDistribution of synaptic vesicle proteins in the mammalian retinawith uranyl acetate and lead citrate (EMS), and examined in a Philipsidentifies obligatory and facultative components of ribbon syn-EM208S electron microscope. Electron micrographs were taken atapses. Eur. J. Neurosci. 11, 1335–1348.a magnification of 1,300�–50,000�, scanned at 600–1000 dpi, and
17. Pieribone, V.A., Shupliakov, O., Brodin, L., Hilfiker-Rothenfluh,digitally inverted with Adobe Photoshop software (Adobe SystemsS., Czernik, A.J., and Greengard, P. (1995). Distinct pools ofIncorporated). The sections chosen for analysis were from the cen-synaptic vesicles in neurotransmitter release. Nature 375,tral region of the terminal, where the plasma membrane was perpen-493–497.dicular to the plane of the section. Electron micrographs were then
18. Rosahl, T.W., Spillane, D., Missler, M., Herz, J., Selig, D.K., Wolff,used for determining the size of synaptic vesicles, the density ofJ.R., Hammer, R.E., Malenka, R.C., and Sudhof, T.C. (1995).synaptic ribbons at the plasma membrane, and a model for theEssential functions of synapsins I and II in synaptic vesicledistribution of vesicles on the ribbon.regulation. Nature 375, 488–493.
19. Zenisek, D., Steyer, J.A., Feldman, M.E., and Almers, W. (2002).Supplemental Data A membrane marker leaves synaptic vesicles in millisecondsSupplemental data including further details on TIRF, confocal mi- after exocytosis in retinal bipolar cells. Neuron 35, 1085–1097.croscopy, FRAP, electron microscopy,the derivation of the autocor- 20. Henkel, A.W., Simpson, L.L., Ridge, R.M., and Betz, W.J. (1996).relation function for TIRF images, a description of the Virtual Cell Synaptic vesicle movements monitored by fluorescence recov-model, and two movies are available at http://www.current-biology. ery after photobleaching in nerve terminals stained with FM1–com/cgi/content/full/14/3/bxs/DC1/. 43. J. Neurosci. 16, 3960–3967.
21. Kraszewski, K., Daniell, L., Mundigl, O., and De Camilli, P. (1996).Mobility of synaptic vesicles in nerve endings monitored byAcknowledgmentsrecovery from photobleaching of synaptic vesicle-associatedfluorescence. J. Neurosci. 16, 5905–5913.We thank Jeremy Skepper and Janet Fisher at the Cambridge Uni-
versity Multi-Imaging Center for their help and advice with electron 22. Starr, T.E., and Thompson, N.L. (2001). Total internal reflection

Vesicle Mobility at a Ribbon Synapse183
with fluorescence correlation spectroscopy: combined surface domain E in regulating neurotransmitter release. Nat. Neurosci.1, 29–35.reaction and solution diffusion. Biophys. J. 80, 1575–1584.
23. Holt, M., Cooke, A., Wu, M.M., and Lagnado, L. (2003). Bulk 45. Geppert, M., Ullrich, B., Green, D.G., Takei, K., Daniels, L., DeCamilli, P., Sudhof, T.C., and Hammer, R.E. (1994). Synapticmembrane retrieval in the synaptic terminal of retinal bipolar
cells. J. Neurosci. 23, 1329–1339. targeting domains of synapsin I revealed by transgenic expres-sion in photoreceptor cells. EMBO J. 13, 3720–3727.24. Gomis, A., Burrone, J., and Lagnado, L. (1999). Two actions of
calcium regulate the supply of releasable vesicles at the ribbonsynapse of retinal bipolar cells. J. Neurosci. 19, 6309–6317.
25. Slepchenko, B.M., Schaff, J.C., Macara, I., and Loew, L.M.(2003). Quantitative cell biology with the Virtual Cell. Trends CellBiol. 13, 570–576.
26. Job, C., and Lagnado, L. (1998). Calcium and protein kinase Cregulate the actin cytoskeleton in the synaptic terminal of retinalbipolar cells. J. Cell Biol. 143, 1661–1672.
27. Parsons, T.D., Coorssen, J.R., Horstmann, H., and Almers, W.(1995). Docked granules, the exocytic burst, and the need forATP hydrolysis in endocrine cells. Neuron 15, 1085–1096.
28. Llobet, A., Cooke, A., and Lagnado, L. (2003). Exocytosis at theribbon synapse of retinal bipolar cells studied in patches ofpresynaptic membrane. J. Neurosci. 23, 2706–2714.
29. Lenzi, D., Crum, J., Ellisman, M.H., and Roberts, W.M. (2002).Depolarization redistributes synaptic membrane and creates agradient of vesicles on the synaptic body at a ribbon synapse.Neuron 36, 649–659.
30. Pyle, J.L., Kavalali, E.T., Piedras-Renteria, E.S., and Tsien, R.W.(2000). Rapid reuse of readily releasable pool vesicles at hippo-campal synapses. Neuron 28, 221–231.
31. Sara, Y., Mozhayeva, M.G., Liu, X., and Kavalali, E.T. (2002). Fastvesicle recycling supports neurotransmission during sustainedstimulation at hippocampal synapses. J. Neurosci. 22, 1608–1617.
32. Richardson, G.P., Forge, A., Kros, C.J., Fleming, J., Brown, S.D.,and Steel, K.P. (1997). Myosin VIIA is required for aminoglyco-side accumulation in cochlear hair cells. J. Neurosci. 17, 9506–9519.
33. Paillart, C., Li, J., Matthews, G., and Sterling, P. (2003). Endocy-tosis and vesicle recycling at a ribbon synapse. J. Neurosci. 23,4092–4099.
34. Zenisek, D., Davila, V., Wan, L., and Almers, W. (2003). Imagingcalcium entry sites and ribbon structures in two presynapticcells. J. Neurosci. 23, 2538–2548.
35. Richards, D.A., Guatimosim, C., and Betz, W.J. (2000). Two en-docytic recycling routes selectively fill two vesicle pools in frogmotor nerve terminals. Neuron 27, 551–559.
36. Hama, K., and Saito, K. (1977). Fine structure of the afferentsynapse of the hair cells in the saccular macula of the goldfish,with special reference to the anastomosing tubules. J. Neurocy-tol. 6, 361–373.
37. Gad, H., Low, P., Zotova, E., Brodin, L., and Shupliakov, O.(1998). Dissociation between Ca2�-triggered synaptic vesicleexocytosis and clathrin-mediated endocytosis at a central syn-apse. Neuron 21, 607–616.
38. Teng, H., and Wilkinson, R.S. (2000). Clathrin-mediated endocy-tosis near active zones in snake motor boutons. J. Neurosci.20, 7986–7993.
39. Raviola, E., and Raviola, G. (1982). Structure of the synapticmembranes in the inner plexiform layer of the retina: a freeze-fracture study in monkeys and rabbits. J. Comp. Neurol. 209,233–248.
40. von Gersdorff, H., Vardi, E., Matthews, G., and Sterling, P. (1996).Evidence that vesicles on the synaptic ribbon of retinal bipolarneurons can be rapidly released. Neuron 16, 1221–1227.
41. Lenzi, D., Runyeon, J.W., Crum, J., Ellisman, M.H., and Roberts,W.M. (1999). Synaptic vesicle populations in saccular hair cellsreconstructed by electron tomography. J. Neurosci. 19,119–132.
42. Ashmore, J.F., and Falk, G. (1980). Responses of rod bipolarcells in the dark-adapted retina of the dogfish, Scyliorhinuscanicula. J. Physiol. 300, 115–150.
43. Crawford, A.C., and Fettiplace, R. (1981). Non-linearities in theresponses of turtle hair cells. J. Physiol. 315, 317–338.
44. Hilfiker, S., Schweizer, F.E., Kao, H.T., Czernik, A.J., Greengard,P., and Augustine, G.J. (1998). Two sites of action for synapsin