High Illuminance Calibration Facility and Procedures · of magnitude higher are often required for...
23
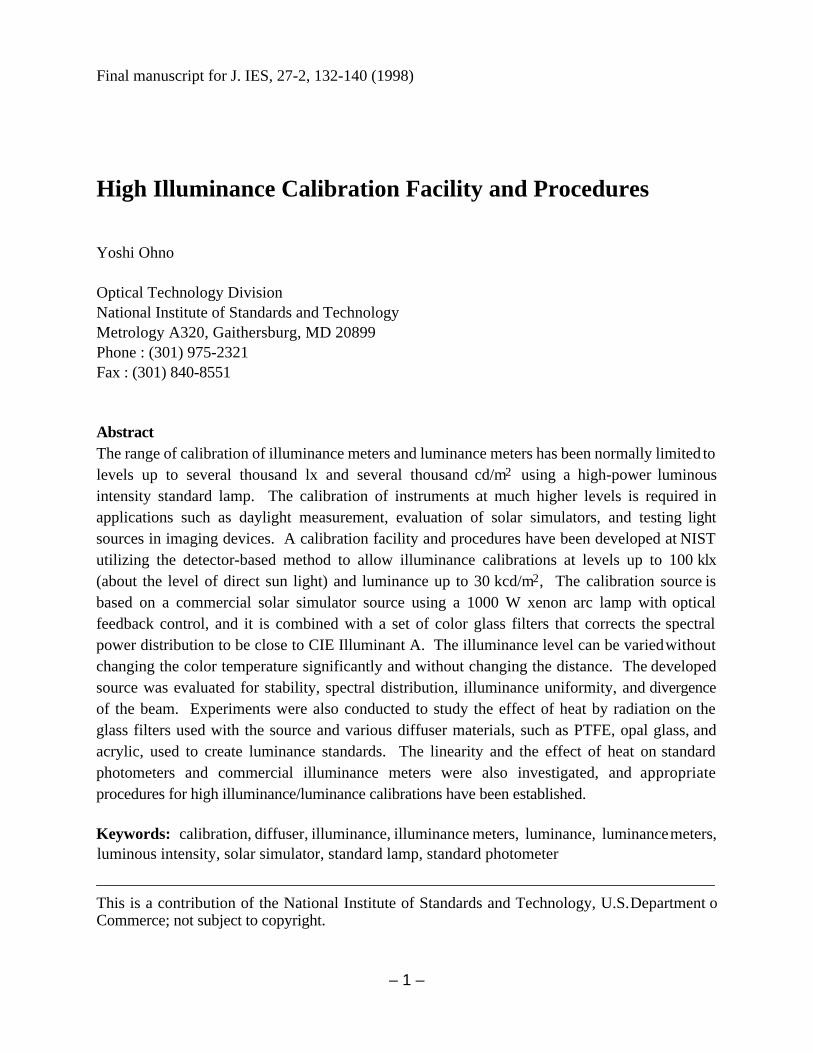
High Illuminance Calibration Facility and Procedures Yoshi Ohno Optical Technology Division National Institute of Standards and Technology Metrology A320, Gaithersburg, MD 20899 Phone : (301) 975-2321 Fax : (301) 840-8551 Abstract The range of calibration of illuminance meters and luminance meters has been normally limited to levels up to several thousand lx and several thousand cd/m 2 using a high-power luminous intensity standard lamp. The calibration of instruments at much higher levels is required in applications such as daylight measurement, evaluation of solar simulators, and testing light sources in imaging devices. A calibration facility and procedures have been developed at NIST utilizing the detector-based method to allow illuminance calibrations at levels up to 100 klx (about the level of direct sun light) and luminance up to 30 kcd/m 2 , The calibration source is based on a commercial solar simulator source using a 1000 W xenon arc lamp with optical feedback control, and it is combined with a set of color glass filters that corrects the spectral power distribution to be close to CIE Illuminant A. The illuminance level can be varied without changing the color temperature significantly and without changing the distance. The developed source was evaluated for stability, spectral distribution, illuminance uniformity, and divergence of the beam. Experiments were also conducted to study the effect of heat by radiation on the glass filters used with the source and various diffuser materials, such as PTFE, opal glass, and acrylic, used to create luminance standards. The linearity and the effect of heat on standard photometers and commercial illuminance meters were also investigated, and appropriate procedures for high illuminance/luminance calibrations have been established. Keywords: calibration, diffuser, illuminance, illuminance meters, luminance, luminance meters, luminous intensity, solar simulator, standard lamp, standard photometer This is a contribution of the National Institute of Standards and Technology, U.S. Department o Commerce; not subject to copyright. – 1 – Final manuscript for J. IES, 27-2, 132-140 (1998)
-
Upload
duongthien -
Category
Documents
-
view
215 -
download
0
Transcript of High Illuminance Calibration Facility and Procedures · of magnitude higher are often required for...
High Illuminance Calibration Facility and Procedures
Yoshi Ohno
Optical Technology DivisionNational Institute of Standards and TechnologyMetrology A320, Gaithersburg, MD 20899Phone : (301) 975-2321Fax : (301) 840-8551
AbstractThe range of calibration of illuminance meters and luminance meters has been normally limited tolevels up to several thousand lx and several thousand cd/m2 using a high-power luminousintensity standard lamp. The calibration of instruments at much higher levels is required inapplications such as daylight measurement, evaluation of solar simulators, and testing lightsources in imaging devices. A calibration facility and procedures have been developed at NISTutilizing the detector-based method to allow illuminance calibrations at levels up to 100 klx(about the level of direct sun light) and luminance up to 30 kcd/m2, The calibration source isbased on a commercial solar simulator source using a 1000 W xenon arc lamp with opticalfeedback control, and it is combined with a set of color glass filters that corrects the spectralpower distribution to be close to CIE Illuminant A. The illuminance level can be varied withoutchanging the color temperature significantly and without changing the distance. The developedsource was evaluated for stability, spectral distribution, illuminance uniformity, and divergenceof the beam. Experiments were also conducted to study the effect of heat by radiation on theglass filters used with the source and various diffuser materials, such as PTFE, opal glass, andacrylic, used to create luminance standards. The linearity and the effect of heat on standardphotometers and commercial illuminance meters were also investigated, and appropriateprocedures for high illuminance/luminance calibrations have been established.
Keywords: calibration, diffuser, illuminance, illuminance meters, luminance, luminance meters,luminous intensity, solar simulator, standard lamp, standard photometer
This is a contribution of the National Institute of Standards and Technology, U.S. Department ofCommerce; not subject to copyright.
– 1 –
Final manuscript for J. IES, 27-2, 132-140 (1998)

Introduction
Illuminance meters and luminance meters normally have a measurement range over several
orders of magnitude, thus a large calibration range is required for such instruments. However, the
calibration range is normally limited to levels up to several thousand lx and several thousand
cd/m2 using a typical photometric bench and a high power luminous intensity standard lamp1,2
(e.g., a 1000 W lamp used at a 50 cm distance creates ~5000 lx). Calibrations at levels of an order
of magnitude higher are often required for illuminance meters used in the measurement of
daylight, solar simulators, lighting optics in imaging devices, and military applications. However,
standard lamps that provide such a high illuminance have not been available.
The detector-based method has been introduced in the realization of the candela and the
illuminance calibration work at the National Institute of Standards and Technology (NIST)3,4.
With this method, the illuminance scale is provided by standard photometers, not by standard
lamps. Therefore, the calibration sources need not be extremely stable over long periods; rather,
needs to be stable only during each burning. Thus, various types of light sources other than
incandescent standard lamps can be used, if they have appropriate short-term stability, spatial
uniformity, and spectral power distributions. The illuminance scale can be extended, based on
the wide linearity range of the standard photometers.
A calibration facility and procedures have been developed at NIST to establish the
capability of illuminance calibrations at levels up to 100 klx (the level of direct sun light) and
luminance up to 30 kcd/m2 (luminance of a perfect diffuser at that level of illuminance). The
calibration source is based on a commercial solar simulator source using a 1000 W xenon arc lamp
with optical feedback control, and this source is combined with a set of color glass filters that
corrects its spectral power distribution to match the CIE† Illuminant A (2856 K Planckian
radiation). The illuminance level can be varied without changing the color temperature
significantly and without changing the distance. The developed source was evaluated for
stability, spectral distribution, illuminance uniformity, and other geometrical characteristics.
Experiments were conducted to study the effect of heat from radiation on the glass filters
used with the source and various diffuser materials, such as PTFE, opal glass, and acrylic used to
create a luminance surface. The linearity and the effect of heat on photometers and illuminance
meters were also investigated, and appropriate procedures for high illuminance and luminance
calibrations have been established.
– 2 –
––––––––––––––––––––––––––––––––––
† Commission Internationale de l’Eclairage (International Commission on Illumination)
Development of the calibration source
Design of the calibration sourceIn order to create an illuminance of 100 klx, a commercial solar simulator source (Oriel††
model 81192) is utilized. This source consists of a 1000 W xenon arc lamp with an ellipsoidal
reflector, an optical integrator, mirrors, and a collimating lens to create a parallel beam of light;
and it employs an optical feedback control system to stabilize the lamp intensity. The monitor
detector for the feedback control, initially consisting of only a silicon photodiode and an optical
fiber bundle, was modified to include a V(λ)-correction filter. The source provides an illuminance
field of approximately 300 klx in a 10 cm x 10 cm area at a distance 20 cm to 40 cm from the
unit. The source is also equipped with interchangeable apertures to reduce the illuminance levels
in several steps. The illuminance can also be varied by ± 20 % by adjusting the feedback
control.
The solar simulator source has the spectral distribution of a typical xenon lamp, having a
correlated color temperature of approximately 6500 K as shown in Fig. 1. However, it is an
internationally recommended practice5 to use a 2856 K Planckian source (CIE Illuminant A) for
calibration of illuminance meters and luminance meters. To meet this requirement, a color
correction filter was designed to match the output spectral power distribution to the CIE
Illuminant A. Among many combinations of color glass filters, HOYA LA60 (16.5 cm x
16.5 cm) was chosen for appropriate spectral matching and high transmittance. Combination
with a heat absorbing filter (HA50) was also included. The optimum thickness of the filter in
three different combinations was determined by calculation using the data from the manufacturer.
Figure 2 shows the calculated spectral power distributions of the source combined with these
filters. The predicted correlated color temperatures (CCT) and illuminances are shown in
Table 1. Filter C is intended to achieve the highest desired illuminance level, sacrificing the color
temperature.
To evaluate these spectral corrections, the spectral mismatch errors1,4 caused by the
differences between the spectral power distributions of the filtered source and the CIE Illuminate
– 3 –
––––––––––––––––––––––––––––––––––
†† Specific firms and trade names are identified in this paper to specify the experimental procedureadequately. Such identification does not imply recommendation or endorsement by the NationalInstitute of Standards and Technology, nor does it imply that the materials or equipment identifiedare necessarily the best available for the purpose.

A were calculated for two photometers used at NIST, Photometer A having an f1’ value5 of
3.0 % and Photometer B, 6.0 %. The results, as shown in Table 2, indicate that the errors for
medium-class illuminance meters ( f1’~ 6 %), even with Filters B and C, are in an acceptable
range. These errors, however, must be addressed in the uncertainty analysis if the calibration
refers to CIE Illuminant A as the calibration source.
Figure 3 shows the experimental arrangement of the source. The color conversion filters
are placed in front of the source. As the filters of calculated thickness (8.5 mm and 9.5 mm)
were not commercially available, LA60 filters in thicknesses of 2.5 mm, 3.0 mm, and 3.5 mm
were combined. The actual spectral power distributions of the source combined with each filter
combination were measured with a spectroradiometer, yielding results within 50 K of the
predicted color temperature and within 15 % of the predicted illuminance levels.
Illuminance stability of the source
The source as arranged in Fig. 3 was characterized for the stability of illuminance. The
illuminance was measured on the optical axis at 30 cm from the source. A temperature-
controlled standard photometer equipped with a diffuser was used within its linearity range and
with precautions to avoid heating as described in the “Characterization of the photometers”
section. Figure 4 shows the measurement results with no filter (line with symbol ▲) and with
Filter A (line with symbol 8 ). The horizontal axis indicates the time from turning on a cold
source. The source with no filter is stable to within 0.2 % whereas, with the filter, a change of
more than 3 % was observed over 1 h. It was obvious that the transmittance of the filter changed
due to the heat from radiation of 300 klx, causing the filter temperature to rise to about 65 °C.
Such a large change of illuminance is not acceptable for a calibration source.
The same experiment was made with Filter B (with a heat absorbing filter). The
individual filters were mounted close together, with the heat absorbing filter on the source side.
In this configuration, there was about 4 % drop of illuminance after 15 min, and the filters were
destroyed (cracked) at 20 min. This incident indicated that the radiation at this level was too
intense for the heat absorbing filter (unless it was water-cooled); and, therefore, the heat
absorbing filter was not used in the subsequent experiments.
To improve the illuminance stability of the source with the filter, the source arrangement
was modified so that the fiber entrance of the monitor detector was placed after the filter to view
the light emerging from the filter; thereby, the change of illuminance is corrected by the feedback
– 4 –

control. With this modification, the change of illuminance from a cold start was reduced to about
0.6 %, and the illuminance was kept stable to within 0.2 % after 10 min from the start (line with
symbol ◆ in Fig. 4). The small initial change was presumably caused by the change of the
temperature gradient in the filter, as the illuminance was measured on the optical axis whereas the
monitor illuminance was taken near the edge of the filter.
Even though the illuminance was stabilized by the feedback control, the heating of the
filter still slightly affects its spectral transmittance. The correlated color temperature of the
source with Filter A decreased by 20 K at 10 min from a cold start, and further decreased by 8 K
at 30 min from a cold start. The variations in color temperature with different apertures inside
the source (to reduce the illuminance level to a minimum of 20 %) was also tested and found to
be within 30 K. This variation of CCT normally does not affect the results of illuminance meter
calibrations.
Characterization of the photometers
Two different types of standard photometers, Photometer 1 (temperature-monitored
type) and Photometer 2 (temperature-controlled type)6, both designed and built at NIST, were
evaluated for use as reference standards to provide the illuminance unit. Photometer 1 is the
same type as those currently used to maintain the NIST illuminance unit3. Both photometers
are non-diffuser type, and employ a silicon photodiode (Hamamatsu S1226-8BQ) with a 0.3 cm2
sensitive area.
Linearity of the standard photometers
The two standard photometers were first tested for their linearity by comparing them
with another reference photometer which was previously measured to be linear up to 100 µA of
photocurrent4. An opal diffuser was added to the front of this reference photometer to minimize
the effect of heat, resulting in the output current of ~1 µA at 105 lx. The photometers were
exposed to radiation only when the reading was taken (approximately 10 s) to minimize the
effect of heat. The measurements were made for four different illuminance levels by using
different apertures for the source. Figure 5 shows the results of the measurements. Both
Photometers 1 and 2, with no diffuser attached, were found to have linear response up to an
illuminance level of 110 klx (~250 µA of photocurrent) within the measurement uncertainty.
The uncertainty of this measurement (± 0.3 %) was assessed from repeated measurements. The
– 5 –

variation was caused presumably by the effect of heat on the reference and test photometers,
though the precautions as described above were taken.
Effect of heat from radiation on photometers
It was expected that, when exposed to radiation at such a high illuminance level, the V(λ)
filter itself as well as the housing of a photometer would be heated, resulting in significant drift of
its responsivity. To investigate this effect, the two standard photometers were tested for
exposure to radiation at 100 klx for 50 min. Filter C was used to create this illuminance level.
The shutter was closed while the source was allowed to stabilize and the photometer was
mounted. The measurement started as the shutter opened.
Figure 6 shows the result of this test for Photometer 1 (temperature-monitored type).
The line with symbol ▲ indicates the raw signal from the photometer, and the line with symbol
6 shows the signal corrected for the change of the photometer temperature measured by the
built-in temperature sensor3. The photometer temperature is also plotted (line with symbol 8 )
with the scale on the right hand side. The results show that the photometer signal with no
correction drifted by ~1 % at only 10 min exposure. The drift is not well compensated even with
the correction (see the line with symbol 6 ) due to the temperature gradient between the V(λ)
filter and the part of the photometer where the temperature sensor is embedded.
Photometer 1 was tested again with an opal diffuser (25 mm diameter) attached on its
front surface to see if the temperature gradient was removed. Though the corrected signal was
significantly improved (~ 0.4 % in 50 min.), the drift was still not perfectly compensated.
The same test was conducted for Photometer 2 (temperature-controlled type). The drift
of the photometer signal was found to be surprisingly small (within 0.2 % in 30 min).
Photometer 2 has a new design, where the temperature sensor is attached more closely to the
V(λ) filter and thermally insulated from the case, which allows more accurate measurement of the
filter temperature6.
A commercial illuminance meter was also tested for this effect. This illuminance meter
has a black plastic housing and is equipped with a dome-shaped, plastic diffuser of ~25 mm
diameter. It has no temperature control or monitor capability. After exposure to radiation, the
reading of this illuminance meter first rose by 0.4 % (at 3 min), then decreased by more than 2 %
in 30 min, and continued decreasing. After 50 min of exposure, the illuminance meter head was
– 6 –

found contracted, resulting in a permanent change of its responsivity. This indicates how intense
the heat is from this level of radiation.
To avoid such problems caused by the heat from radiation, the exposure time for the test
photometer as well as for the standard photometer should be kept to the minimum necessary for
taking readings (normally 10 s). The shutter should be closed immediately before and after a
reading is taken, and the photometer head should be allowed to cool for some time before
repeating measurement. Another experiment with the same illuminance meter at the same
illuminance level showed that repeated readings with a 10 s exposure in 2 min intervals
reproduced within 0.2 % over a 20 min period.
Geometrical Considerations
The high-illuminance calibration source used in this work has geometrical characteristics
significantly different from normal luminous intensity standard lamps, and must be fully
understood before using it in calibration work.
First, the illuminance variation as a function of distance from the front collimating lens
was measured. The result is shown in Fig. 7. The measured data (▲) are fitted to an inverse
square law. As a result, the effective luminous intensity of the source is determined to be
approximately 850 kcd, and the effective distance offset is 2.51 m. This means that, if a
photometer head is placed 30 cm from the front lens of the source, it is equivalent to having a
2.8 m photometric distance. This is a great advantage compared to the case where a 1000 W
incandescent lamp is used at 50 cm to create 5000 lx. An error of 1 mm in distance alignment
causes a calibration error of 0.4 % at 50 cm and only a 0.07 % at 2.8 m.
The next concern is the divergence of the output beam, which can cause calibration errors
for photometers having a narrow acceptance angle. The angular distribution of the incident flux
was measured on the optical axis at 30 cm from the front lens by using a luminance meter with
measurement angle of 0.33°. Figure 8 shows the results of the horizontal angular scans at vertical
angles of 0° and 1°. The distributions for the vertical scans were similar. The range of
distributions was found to be ± 2.5° for both horizontal and vertical angles. Photometers used
with this source must have an accurate cosine response for this angle range. Figure 9 shows the
angular responsivity of Photometers 1 and 2. The acceptance angle of Photometer 2 is extremely
small (± 3°) and found barely acceptable for use with this high illuminance source.
– 7 –

Another important characteristic of the source is the spatial nonuniformity of illuminance
as it may cause errors when photometers having different sizes of sensitive area are compared.
Figure 10 shows the results of this measurement. The central part within ± 10 mm was found
fairly uniform (± 0.5 %), but the errors associated with this characteristic should be included in
the uncertainty analysis.
Luminance measurement
Once a high-illuminance source is established, a high-luminance surface can be created by
combining it with a reflecting or transmitting diffuser of a known luminance coefficient to allow
calibration of luminance meters. As it has been demonstrated that the level of illuminance at
100 klx has a significant heat content, it was expected that the diffusers might also be affected by
the heat from this radiation. Three different types of diffusers (an acrylic plate, opal glass, and a
pressed PTFE plaque) were tested for drift of luminance under a high level of illumination. As
the initial test at 100 klx showed very small drifts (less than 0.3 % in 30 min for any of the
samples), the illuminance level was increased to 300 klx (with no filter for the source) to see the
effect more clearly. The source was first completely stabilized, then the diffuser was mounted
with the shutter closed, and the measurement started as the shutter opened. The luminance was
measured with Photometer 2 (temperature-controlled type) combined with a luminance adapter
(Graseby Model 1120, modified to have 1° measurement angle). This photometer with the
luminance adapter was tested, in advance, for the effect of heat from radiation. The test was
conducted in a similar manner as described before, and showed no recognizable drift (less than
0.2 %) under continuous exposure to 50 kcd /m2 for 30 min.
The results of the test for the three samples are shown in Fig. 11. The acrylic diffuser
(line with symbol ▲) is 16.5 cm x 16.5 cm in size and 6 mm thick, creating 55 kcd/m2. The opal
glass (line with symbol 6 ) is 7.6 cm x 7.6 cm in size and flashed on 3 mm thick glass, creating
45 kcd/m2. Both diffusers were arranged with 0° incidence and 0° viewing geometry. The
pressed PTFE plaque (line with symbol 8 ) is 5 cm in diameter and arranged in 45°/45° geometry
(normally 0°/45° should be used) due to the space limitation, creating 70 kcd/m2. As the results
show, no drift was observed with PTFE, and both transmitting diffusers were found to increase
their luminance as a result of being heated by radiation. Caution should be used when using these
transmitting diffusers at such high illuminance levels.
– 8 –

Configuration and procedures for calibration at NIST
Based on the experiments described above, the configuration and procedures for high
illuminance calibration at NIST have been established. Figure 12 shows the arrangement of the
facility. The photometer is placed 30 cm from the front lens of the source. The monitor detector
is V(λ)-corrected. Filter A is used for color conversion and provides illumination of
approximately 70 klx at 2850 K. The source can also be set to 100 klx at 3400 K using Filter C.
Even though the current NIST standard photometers are found to have a linear response
at this illuminance level, another set of two standard photometers (temperature-controlled type)
for high illuminance use has been prepared in order to avoid possible damage of the primary
standard photometers due to heat cycles. The high-illuminance standard photometers are
calibrated periodically against the NIST illuminance scale.
The calibration of illuminance meters is conducted as follows. The source is turned on
under optical feedback and allowed to stabilize for at least 10 min. The shutter is always closed
except when taking data. Caution should be exercised since the shutter and the filters become
very hot. Flammable materials should not be used near the shutter, and sufficient air convection
should be provided. The standard photometer and the illuminance meter under test are mounted
in turn, and the reading is taken with the shutter open for 10 s. This comparison is repeated
three times with intervals of more than 2 min. This set of measurements is repeated for different
illuminance levels by changing the aperture of the source.
The uncertainty of the high-illuminance calibration is analyzed as shown in Table 3. The
uncertainty depends on the characteristics of illuminance meters under test. This example
assumes a commercial illuminance meter having an f1’ value of ~6 %, no sensitivity in the
ultraviolet and infrared region, and a 3 and 1/2 digit display.
Conclusion
A high-illuminance calibration facility has been developed at NIST, which can provide a
stable illuminance of 70 klx with a spectral power distribution approximated to CIE Illuminant
A (2856 K), or an illuminance of 100 klx with quasi Planckian radiation of 3400 K. These levels
are more than an order of magnitude higher than previously available with incandescent standard
lamps. The effects of heat from radiation on several different types of photometers and
diffusers have been investigated using this facility. Based on the results of the experiments, a
– 9 –
procedure for high-illuminance calibration has been established, and calibration services for
illuminance meters for up to 100 klx and luminance meters for up to 30 kcd/m2 are now available.
Although the spectral power distribution of the source is well corrected to the CIE
Illuminant A in the visible region, the infrared components were not well adjusted; and they are
much higher than the 2856 K Planckian radiation in the 850 nm to 1000 nm region. By reducing
the infrared components in this region, and thereby adjusting better to the Planckian distribution,
the effect of heat on photometers and diffusers can be reduced.
For illuminance meter calibrations in general, incandescent standard lamps have been
almost exclusively used; and therefore, the CIE Illuminant A (2856 K) is recommended for
worldwide uniformity of calibration. However, from a practical point of view, the CIE
Illuminant A need not be used in all cases. Theoretically, illuminance meters can be best
calibrated with the same type of source for which the meters are used. For specific purposes,
such as for solar irradiance measurements, illuminance meters can be calibrated for the xenon
spectra (similar to CIE Illuminant D65); in which case, the high-illuminance source described in
this paper can be used with no correction filter.
This work was carried out with support from the U. S. Air Force. The author is grateful
to Mr. Joe Velasquez and Mr. John Grangaard of the U. S. Air Force for providing the stimulus
to conduct this research. Thanks are also due to Dr. Georg Sauter of Physikalisch-Technische
Bundesanstalt (PTB), Germany, who stayed at NIST during this work and provided important
suggestions and support in the experiments.
References
1. Ohno, Y., NIST SP 250-37 Photometric Calibrations (1997)
2. PTB, Measurement–Testing–Calibration (1992)
3. Cromer, C. L., Eppeldauer, G., Hardis, J. E., Larason, T. C., and Parr, A. C., “National
Institute of Standards and Technology Detector-based Photometric Scale,” Applied Optics
32-16, 2936-2948 (1993).
4. Ohno, Y., Cromer, C. L., Hardis, J. E., and Eppeldauer, G., “The Detector-based Candela
Scale and Related Photometric Calibration Procedures at NIST,” J. IES, 23-1, 88-98 (1994).
5. CIE Publication No. 69, Methods of Characterizing Illuminance Meters and Luminance
Meters (1987).
6. Eppeldauer, G. and Ohno, Y., “Illuminance /Luminance Standard Photometer,” CORM96,
Gaithersburg (1996)
– 10 –

Discussion
Again Dr. Ohno has presented a very comprehensive account of a new system used for
calibrating to very high illuminance levels. I appreciate the thoroughness of the development of
the work presented.
As this is now a detector-based system rather than one dependent on lamps only, how
does this system compare to the current lamp-based system in terms of uncertainty? How
strong is the correlation between this high level calibration system and the previous lamp-based
system?
Thank you again for your continued work in this area.
R. B. Gibbons
Philips Lighting
My compliments to Dr. Ohno for a thorough description and analysis of the calibration
program. My comment for Dr. Ohno:
With the outstanding linearity characteristics of silicon detectors over six or seven decades,
it is unclear to me why such an elaborate setup is needed to “stretch” the calibration level only
two orders of magnitude. I would think that using what has historically been available at the
highest possible illuminance/luminance level would suffice with appropriate corrections for any
heating effects. These corrections for heating could be determined by measuring response vs.
temperature for the optical element(s) used. I would think this would be a simpler approach
than setting up a complete calibration facility for the higher levels.
R. G. Collins
Osram Sylvania
Y. Ohno presents a clear and comprehensive description of the new method to perform
calibration of high illuminance meters and luminance meters at NIST. Your presentation on the
development of a calibration source was very detailed. Your work on the characterization of the
illuminance stability of the source and on the thermal effects on the photometers and filter were
most complete. Was there any attempt to characterize the thermal effect on the spectral
transmittance of the color conversion filters? If so, what was the change in the spectral
mismatch error for CIE Illuminance A due to the thermal effect?
– 11 –

The utilization of this new facility will fulfill a need for National realization of the high
illuminance scale. Is there a low cost alternate to the solar simulator source for laboratories that
would derive secondary standards from the NIST calibrated standard photometers? Will you be
preparing a practitioner’s guide? Another need within the industry is for calibration sources that
will ensure accurate measurements of high intensity strobe sources. Will you be applying some
of the results from this work to the characterization for time-based integrating photometers?
Dave Ellis
Intertek Testing Services
It was thus with some pleasure that I learned of Dr. Ohno’s work and this paper being
presented to this IESNA Conference. Even then it only goes partly along the way to the high
values we have in measuring daylight availability around the world, nevertheless this is a
considerable stepforward.
Question: In view of the desirability of reaching calibration values up to about 180,000 to
200,000 lux for daylight measurements, what are the possibilities of using this facility and
procedures for reaching calibration values twice those that are reported in the paper?
J. D. Kendrick
University of Adelaide, Australia
Author’s response
To R. Gibbons
As Dr. Gibbons mentioned, this is a good example of the applications of the detector-based
methods. We introduced the detector-based method in our routine calibration work of luminous
intensity and illuminance (at normal levels) several years ago. Compared with the lamp-based
calibration method employed before, the detector-based method has reduced the calibration
uncertainty by a factor of two. When we introduced the detector-based candela in 1992, the
magnitude of the unit shifted by approximately 0.6 % from the previous blackbody-based unit.
To R. Collins
As Mr. Collins raised an interesting point. Our standard photometers showed no problem
with their linearity at least up to 100 klx. This is probably true with many other commercial
– 12 –

illuminance meters employing high quality silicon photodiodes as Mr. Collins pointed out.
However, one can never assume it, and it must be proved experimentally. This is the reason for
all the calibration work. If the linearity of the illuminance meters could be tested with a simple
device up to the range we need, then we do not have to “calibrate” the instrument using a high
illuminance source, and the calibration at much lower levels would suffice. However,
unfortunately, with currently available technology, linearity measurement devices are more
complicated and difficult to build than the high-illuminance source. Moreover, the linearity
facility may need a similar light source to provide an illuminance of 100 klx. The high
illuminance calibration facility we have developed can also be interpreted as a linearity testing
device for illuminance meters.
Regarding the effect of heat for photometers, it cannot be simply evaluated from the
individual components’ temperature characteristics due to the strong temperature gradient in the
photometer head exposed to radiation. This is why our temperature-monitored photometers did
not work well (Fig. 6). Nevertheless, we hope that this facility will be simplified in future when
a new technology becomes available.
To D. Ellis
As Mr. Ellis pointed out, there is a strong thermal effect of the spectral transmittance of the
color conversion filters. We found that the luminous transmittance decreased by 3 % during the
warm-up period (Fig. 4). It was not mentioned in the paper, but the color temperature of the
transmitted light also drifted by ~30 K, which is negligible in terms of spectral mismatch errors
of the photometers.
Regarding low-cost alternatives to the solar simuator source, our approach, of course, is not
the only solution for the high-illuminance calibration source. There are possibilities of utilizing,
e.g., more elaborate optical systems with a tungsten lamp to create a light source for uniform,
high illuminance.
Regarding the strobe source measurements, we have just completed the development of the
flashing-light photometric unit (lx·s) in the form of standard photometers having pulse
integration capability. This work was conducted under support by Federal Aviation
Administration to improve the accuracies of aircraft anticollision light measurements. The
calibration service for flashing-light photometers is now available.
– 13 –

To J. Kendick
The author appreciates his comments as an expert in daylight measurements. I hope our new
facility will also be useful in providing accurate calibration of photometers in this area. I do not
see much difficulties in going up to 200 klx. Our standard photometers are found to have a linear
response up to higher than 300 klx. The solar simulator source, by itself, has an illuminance of
~300 lx, but with a color temperature of ~6500 K. As I mentioned in the conclusion, it would
make more sense to calibrate the photometers for daylight measurement against a 6500 K source
than a 2856 K source, even though it is an internationally accepted practice to use a 2856 K
source for calibration of illuminance meters and luminance meters. In this particular situation,
we can use the solar simulator source with no color conversion filters, and utilize its original
illuminance level of 300 klx. I would like to discuss these and other issues more with experts in
the daylight measurement community.
– 14 –
List of Figures
Figure 1. Spectral power distribution of the solar simulator source.
Figure 2. Calculated spectral power distributions of the source combined with the filters.
Figure 3. Experimental arrangement of the source.
Figure 4. Drift of the illuminance of the source with and without the filter, from a cold start.
Figure 5. Linearity of Photometers 1 and 2.
Figure 6. Drift of the signal from Photometer 1 (temperature-monitored type) under 100 klx
illumination.
Figure 7. Illuminance variation as a function of distance.
Figure 8. Angular distributions of the incident flux at 30 cm from the front lens on the optical
axis.
Figure 9. Angular responsivity of Photometers 1 and 2.
Figure 10. Spatial nonuniformity of illuminance at 30 cm from the front lens.
Figure 11. Drift of luminance of diffusers due to the effect of heat of radiation at 300 klx.
Figure 12. Configuration of the high illuminance facility for calibration work at NIST.
List of Tables
Table 1. Results of the calculation of the spectral corrections for the source.
Table 2. Relative spectral mismatch errors in photometer calibration in reference to CIE
Illuminant A.
Table 3. An example of an uncertainty budget for NIST high-illuminance calibration of an
illuminance meter in a 10 klx to 70 klx range.
– 15 –

Table 1. Results of the calculation of the spectral corrections for the source.––––––––––––––––––––––––––––––––––––––––––––––––––––––––––––––––––
CCT Luminous PredictedFilter combination
[K] transmittance illuminance (lx)––––––––––––––––––––––––––––––––––––––––––––––––––––––––––––––––––
A) LA60/ 8.5 mm 2850 0.243 7.3 x 10⁴
B) LA60/ 9.5 mm + HA50/ 3 mm 2890 0.169 5.1 x 10⁴
C) LA60/ 6.0 mm 3500 0.335 1.0 x 10⁵
––––––––––––––––––––––––––––––––––––––––––––––––––––––––––––––––––
Table 2. Relative spectral mismatch errors in photometercalibration in reference to CIE Illuminant A.
–––––––––––––––––––––––––––––––––––––––––––––––––CCT Spectral mismatch error (%)
Source [K] Photometer A Photometer B ––––––––––––––––––––––––––––––––––––––––––––––––+ Filter A 2853 0.03 0.1
+ Filter B 2887 0.03 0.4
+ Filter C 3394 - 0.3 0.6
Source only 6634 1.2 2.0–––––––––––––––––––––––––––––––––––––––––––––––––
– 16 –

Table 3. An example of an uncertainty budget for NIST high-illuminancecalibration of an illuminance meter in a 10 klx to 70 klx range.
–––––––––––––––––––––––––––––––––––––––––––––––––––––––––––––––Relative expanded
Uncertainty factor uncertainty (k=2) [%]Type A Type B
–––––––––––––––––––––––––––––––––––––––––––––––––––––––––––––––The NIST illuminance unit realization 0.38Long-term drift of the NIST standard photometers 0.28Transfer to high-illuminance (HI) standard photometers 0.2Spectral mismatch correction of the HI standard photometers 0.1Linearity of the HI standard photometers 0.3Drift of the HI standard photometer due to heat 0.2Random noise and the stability of the source 0.2Stray light in the bench 0.2 Spectral mismatch error for CIE Illuminant A ** 0.2Illuminance nonuniformity ** 0.3Illuminance meter head alignment (distance and angle) ** 0.1Display resolution of the illuminance meter (1 in 199) ** 0.5 Drift of the illuminance meter under test due to heat ** 0.3Nonlinearity of response in different illuminance levels ** 0.7
Overall uncertainty of calibration 1.2––––––––––––––––––––––––––––––––––––––––––––––––––––––––––––––––** Uncertainty value depends on the test item.
– 17 –

0.0
0.5
1.0
1.5
2.0
2.5
3.0
3.5
400 500 600 700 800 900 1000 1100
Rela
tive P
ow
er
Figure 1. Spectral power distribution of the solar simulator source.
0.0
0.5
1.0
1.5
2.0
2.5
3.0
3.5
400 450 500 550 600 650 700 750 800
LA60/8.5mmLA60/9.5 mm+HA50Illluminant ACIE V( )
Rela
tive
Pow
er
Wavelength (nm)
λ
Figure 2. Calculated spectral power distributions of the source combined with the filters.
– 18 –

Solar simulatorsource
(1000 W xenon)
Interchangeableaperture
Optical integrator
Front lens
<Top View>Shutterstandard photometer
Color conversionfilters
Fiberentrance
V(λ)-corrected monitor detector
Illuminancemeter
Figure 3. Experimental arrangement of the source.
0.96
0.97
0.98
0.99
1.00
1.01
0 10 20 30 40 50 60
Source onlyWith filter AWith filter A(monitor moved)
Rela
tive
illu
min
ance
Time (min)
Figure 4. Drift of the illuminance of the source with and without the filter, from a cold start.
– 19 –

0.98
0.99
1.00
1.01
1.02
0 20000 40000 60000 80000 100000 120000
NIST Photometer 1NIST Photometer 2
Rela
tive r
esp
onsi
vit
y
Illuminance [lx]
Photometers; with No diffuser
Apeture 1Aperture 4 Aperture 3 Aperture 2
Source; with Filter C
Figure 5. Linearity of Photometers 1 and 2.
0.98
0.99
1.00
1.01
0 10 20 30 40 50
Raw signalTemperature-corrected signalPhotometer temperature(scale on the right)
Rela
tive
Sig
nal
Time (min)
45
40
35
30
Phot
omet
er T
empe
ratu
re (
°C)
Figure 6. Drift of the signal from Photometer 1 (temperature-monitored type) under 100 klx illumination.
– 20 –

85000
90000
95000
100000
105000
110000
115000
20 30 40 50 60 70
Measured Illuminance(lx)Inverse square law fitting
Illum
inan
ce (
lx)
Distance from the front lens (cm)
( 2.8 m )
Figure 7. Illuminance variation as a function of distance.
0.0
0.2
0.4
0.6
0.8
1.0
1.2
1.4
-6 -4 -2 0 2 4 6
Vertical 0°Vertical 1°
Rela
tive
sig
nal
Horizontal angle (degree)
Figure 8. Angular distributions of the incident flux at 30 cm from the front lens on the optical axis.
– 21 –

0
0.2
0.4
0.6
0.8
1
1.2
-40 -20 0 20 40
Photometer 1Photometer 2Cosine
Rel
ativ
e re
sponse
Angle of Incidence (degree)
Figure 9. Angular responsivity of Photometers 1 and 2.
0.98
0.99
1.00
1.01
1.02
1.03
1.04
-40 -30 -20 -10 0 10 20 30 40
-20-10 0 10 20
Rela
tive
illu
min
ance
Horizontal position (mm)
Verticalposition(mm)
Figure 10. Spatial nonuniformity of illuminance at 30 cm from the front lens.
– 22 –

0.995
1.000
1.005
1.010
1.015
0 5 10 15 20 25 30
Acrylic diffuserOpal GlassPTFE
Rela
tive
lum
inan
ce
Time (min)
Illuminance= 300,000 lx
Figure 11. Drift of luminance of diffusers due to the effectof heat of radiation at 300 klx.
Solar simulatorsource
<Top View>AutomaticShutterHigh-illuminance
standard photometerLA60 filter
(8.5 mm total)
Fiberentrance
V(λ)-corrected monitor detector(temperature-controlled)
Illuminancemeter
under test
Figure 12. Configuration of the high illuminance facilityfor calibration work at NIST.
– 23 –