High Grade, Safe Jurisdiction and Solid Partners Copper ... · Safe Jurisdiction – Mining...
59
Trust | Respect | Integrity 1 High Grade, Safe Jurisdiction and Solid Partners Copper-Zinc-Lead-Gold-Silver-Cobalt Toronto Marketing January 2020
Transcript of High Grade, Safe Jurisdiction and Solid Partners Copper ... · Safe Jurisdiction – Mining...

Trust | Respect | Integrity 1
1
High Grade, Safe Jurisdiction and Solid PartnersCopper-Zinc-Lead-Gold-Silver-Cobalt
Toronto MarketingJanuary 2020

Trust | Respect | Integrity 2
2
Forward Looking Statements
This presentation release includes certain "forward-looking information” and "forward-looking statements” (collectively "forward-lookingstatements”) within the meaning of applicable Canadian and United States securities legislation including the United States Private SecuritiesLitigation Reform Act of 1995. All statements, other than statements of historical fact, included herein, including, without limitation, the futureprice of copper, the estimation of mineral reserves and mineral resources, the realization of mineral reserve and mineral resource estimates,the timing and amount of estimated future production, costs of production, capital expenditures, costs and timing of the development ofprojects, the likelihood and timing of the AMDIAP, the potential future development of Bornite, the future operating or financial performanceof the Company, planned expenditures and the anticipated activity at the UKMP Projects, are forward-looking statements. Forward-lookingstatements are frequently, but not always, identified by words such as "expects”, "anticipates”, "believes”, "intends”, "estimates”, "potential”,"possible”, and similar expressions, or statements that events, conditions, or results "will”, "may”, "could”, or "should” occur or be achieved.These forward-looking statements may include statements regarding perceived merit of properties; exploration plans and budgets; mineralreserves and resource estimates; work programs; capital expenditures; timelines; strategic plans; market prices for precious and base metals;or other statements that are not statements of fact. Forward-looking statements involve various risks and uncertainties. There can be noassurance that such statements will prove to be accurate, and actual results and future events could differ materially from those anticipated insuch statements. Important factors that could cause actual results to differ materially from the Company's expectations include theuncertainties involving success of exploration, development and mining activities, permitting timelines, requirements for additional capital,government regulation of mining operations, environmental risks, unanticipated reclamation expenses; mineral reserve and resourceestimates and the assumptions upon which they are based; assumptions and discount rates being appropriately applied to the PFS; ourassumptions with respect to the likelihood and timing of the AMDIAP; capital estimates; prices for energy inputs, labour, materials, suppliesand services the interpretation of drill results, the need for additional financing to explore and develop properties and availability of financingin the debt and capital markets; uncertainties involved in the interpretation of drilling results and geological tests and the estimation ofreserves and resources; the need for cooperation of government agencies and native groups in the development and operation of properties aswell as the construction of the access road; the need to obtain permits and governmental approvals; risks of construction and mining projectssuch as accidents, equipment breakdowns, bad weather, non-compliance with environmental and permit requirements, unanticipatedvariation in geological structures, metal grades or recovery rates; unexpected cost increases, which could include significant increases inestimated capital and operating costs; fluctuations in metal prices and currency exchange rates; and other risks and uncertainties disclosed inthe Company’s Annual Report on Form 10-K for the year ended November 30, 2018 filed with Canadian securities regulatory authorities andwith the United States Securities and Exchange Commission and in other Company reports and documents filed with applicable securitiesregulatory authorities from time to time. The Company's forward-looking statements reflect the beliefs, opinions and projections on the datethe statements are made. The Company assumes no obligation to update the forward-looking statements or beliefs, opinions, projections, orother factors, should they change, except as required by law.

Trust | Respect | Integrity 3
3
Forward Looking Statements
Non-GAAP Performance Measures
Some of the financial measures referenced in this press release are non-GAAP performance measures. We have not reconciled forward-looking full year non-GAAP performance measures contained in this news release to their most directly comparable GAAP measures, aspermitted by Item 10(e)(1)(i)(B) of Regulation S-K. Such reconciliations would require unreasonable efforts at this time to estimate andquantify with a reasonable degree of certainty various necessary GAAP components, including for example those related to future productioncosts, realized sales prices and the timing of such sales, timing and amounts of capital expenditures, metal recoveries, and corporate generaland administrative amounts and timing, or others that may arise during the year. These components and other factors could materially impactthe amount of the future directly comparable GAAP measures, which may differ significantly from their non-GAAP counterparts.
Cautionary Note to United States Investors
This press release has been prepared in accordance with the requirements of the securities laws in effect in Canada, which differ from therequirements of U.S. securities laws. Unless otherwise indicated, all resource and reserve estimates included in this press release have beenprepared in accordance with Canadian National Instrument 43-101 Standards of Disclosure for Mineral Projects (“NI 43-101”) and theCanadian Institute of Mining, Metallurgy and Petroleum (CIM)—CIM Definition Standards on Mineral Resources and Mineral Reserves,adopted by the CIM Council, as amended (“CIM Definition Standards”). NI 43-101 is a rule developed by the Canadian Securities Administratorswhich establishes standards for all public disclosure an issuer makes of scientific and technical information concerning mineral projects.Canadian standards, including NI 43-101, differ significantly from the requirements of the United States Securities and Exchange Commission(SEC), and resource and reserve information contained herein may not be comparable to similar information disclosed by U.S. companies. Inparticular, and without limiting the generality of the foregoing, the term "resource” does not equate to the term "reserves”. Under U.S.standards, mineralization may not be classified as a "reserve” unless the determination has been made that the mineralization could beeconomically and legally produced or extracted at the time the reserve determination is made. The SEC's disclosure standards normally do notpermit the inclusion of information concerning "measured mineral resources”, "indicated mineral resources” or "inferred mineral resources” orother descriptions of the amount of mineralization in mineral deposits that do not constitute "reserves” by U.S. standards in documents filedwith the SEC. Investors are cautioned not to assume that all or any part of “measured” or “indicated resources” will ever be converted into“reserves”. Investors should also understand that "inferred mineral resources” have a great amount of uncertainty as to their existence andgreat uncertainty as to their economic and legal feasibility. Under Canadian rules, estimated "inferred mineral resources” may not form thebasis of feasibility or pre-feasibility studies except in rare cases. Disclosure of "contained ounces” in a resource is permitted disclosure underCanadian regulations; however, the SEC normally only permits issuers to report mineralization that does not constitute "reserves” by SECstandards as in-place tonnage and grade without reference to unit measures. The requirements of NI 43-101 for identification of "reserves”are also not the same as those of the SEC, and reserves reported by Trilogy Metals in compliance with NI 43-101 may not qualify as "reserves”under SEC standards. Arctic does not have known reserves, as defined under SEC Industry Guide 7. Accordingly, information concerningmineral deposits set forth herein may not be comparable with information made public by companies that report in accordance with U.S.standards.

Trust | Respect | Integrity 4
4
Copper and Cobalt are Critical for a Green Future
Audi E-Tron GT

Trust | Respect | Integrity 5
5
Is there Enough Supply Out There?
A Significant Demand/Supply Deficit is Looming

Trust | Respect | Integrity 6
6
➢ High-Grade Copper with Zinc and Precious Metals
➢ 50/50 Joint Venture w/ South32 Ltd.
➢ Located in Alaska: a Safe, Rule of Law Jurisdiction
➢ Ambler Mining District - Significant Exploration Upside
➢ Focused on Two Projects: Upper Kobuk Mineral Projects (UKMP)
1) Arctic Permitting Feasibility Study Underway with Permitting to follow
Arctic Pre-Feasibility Highlights
43 Mmt Open Pit Reserve Grading 5% Copper Equivalent
2.3% Copper; 3.2% Zinc; 0.59% Lead; 0.49 g/t Gold and 36 g/t Silver
➔ Post Tax $1.4 Billion NPV and 33% IRR
2) Bornite Exploration – > 6 Billion lbs Copper and 77 Million lbs of Cobalt
Trilogy’s Interests in the Ambler Mining District8 Billion Pounds of Copper, 3 Billion Pounds of Zinc andover 1 Million Ounces of Gold Equivalent Precious Metals

Trust | Respect | Integrity 7
7
Issued and Outstanding
140.4 M
Fully Diluted1
150.9 M
Options
9.2 M
1. Fully diluted shares include 1.1M Deferred Share Units (Directors) and 0.2M Restricted Share Units (Officers) at November 30, 2019.
Share Capitalization
Balance Sheet Shareholder Base
Well Funded
• Cash ~$20 Million
• No debt
• Market Cap. $340 Million
• Largely Institutionally Held
• Meaningful Management Ownership
Major Shareholders
• Electrum Group ~21.0%
• South32 Limited ~11.7%
• Paulson & Co. ~10.2
• Selz Capital ~9.7%
• Baupost Group ~8.7%
• PointState Capital ~ 3.6%
• Management ~3.4%
• Above totals almost 70%
Solid – Supportive Shareholder BaseNYSE American and Toronto Exchanges - Symbol “TMQ”
Institutional, 77%
Management & Directors,
3%
Retail, 20%

Trust | Respect | Integrity 8
8
Corporate Highlights - PartnershipsAdvancing the Ambler Mining District in Alaskaby Forming Strong Partnerships
➢ Three Partnerships
✓ Joint Venture Partnership with South32
✓ Local Native Partnership with NANA – Agreement/Business Relationship with strong community relationships
✓ Infrastructure Partnership with State of Alaska - AIDEA currently permitting to build road access
✓

Trust | Respect | Integrity 9
9
JV Co.~$145 million Upper Kobuk
Mineral Projects
• South32, which has a market capitalization of over $9 billion, is a global diversified metals and mining company, demerged from BHP Billiton in 2015, with high quality operations producing bauxite, alumina, aluminum, energy and metallurgical coal, manganese, nickel, silver, lead and zinc
• South32 will contribute ~$145 million into the Joint Venture and Trilogy contributes the Upper Kobuk Mineral Projects (includes Arctic and Bornite)
• $72.5 million is attributable to each of South32 and Trilogy• Anticipates that the JV will retain $87.5 million with the balance of $57.5 million
loaned back to South32• The loan will be repaid in installments, on notice by the Joint Venture as required to
advance development studies, resource drilling and regional exploration programs
50% 50%
JV Partnership - South32 Limited
South32 Limited has Exercised its Option to Form a Joint Venture with Trilogy

Trust | Respect | Integrity 10
10
Upper Kobuk Mineral Projects JV Area

Trust | Respect | Integrity 11
11
Corporate Highlights - PartnershipsAdvancing the Ambler Mining District in Alaskaby Forming Strong Partnerships
➢ Three Partnerships
✓ Joint Venture Partnership with South32
✓ Local Native Partnership with NANA – Agreement/Business Relationship with strong community relationships
✓ Infrastructure Partnership with State of Alaska - AIDEA currently permitting to build road access
✓

Trust | Respect | Integrity 12
12
Safe Jurisdiction – Mining District Hosts Deposits Rich in Copper, Zinc, Lead, Gold, Silver & Cobalt
➢ NANA - Alaskan Regional Native Corporation with 14,000 Iñupiat shareholders➢ Land owner and Joint partner with Teck on Red Dog➢ Red Dog is the largest Zinc mine in the world operating for nearly 30 years➢ Good jobs and Local taxes from Red Dog supports NW Arctic Borough Government and School District
Ambler Mining District - Alaska
➢ Politically Stable
➢ Rule of Law
➢ Recognized Mineral Potential
➢ Resource Extractive Industries are the Largest Contributors to Alaska’s Economy
➢ Well Established Permitting Process
➢ Supportive BoroughGov’t – tax base for region
➢ NANA Agreement
➔ Strong local support for Mining

Trust | Respect | Integrity 13
13
Corporate Highlights - PartnershipsAdvancing the Ambler Mining District in Alaskaby Forming Strong Partnerships
➢ Three Partnerships
✓ Joint Venture Partnership with South32
✓ Local Native Partnership with NANA – Agreement/Business Relationship with strong community relationships
✓ Infrastructure Partnership with State of Alaska - AIDEA currently permitting to build road access
✓

Trust | Respect | Integrity 14
14
Truck Transportation Plan
Truck Transfer to Alaska Railroad

Trust | Respect | Integrity 15
15
Port of Alaska - Anchorage

Trust | Respect | Integrity 16
16
Concentrates Loaded Directly into Ship Hold at Port of Alaska - Anchorage
Good for the EnvironmentSaves Money= Better $Green Solution

Trust | Respect | Integrity 17
17
NEPA Road Permitting Process (EIS)
404 PermitACOE
Dec 31, 2019
EXPLORATION &
ENVIRONMENTAL STUDIES
PER
MIT
TIN
G
EN
GIN
EE
RIN
G &
CO
NS
TR
UC
TIO
N
OPERATIONS
2 -3 years +/- 3 3 years + 20 years
Permit Application
(Consolidated Right of Way Application)
Notice of
Intent
Public Scoping
Preliminary Draft EIS
Draft EIS Public Comment
Period
Final EISBaseline DataGathering
Record of Decision
Issuance
Aug 23, 2019 Oct 29, 2019
60-day Comment Period on Draft EIS Completed
Bureau of Land Management is the Lead Agency for Road Permitting AIDEA is the proponent
RO
AD
Q1 2020

Trust | Respect | Integrity 18
18
Ambler Mining District Industrial Access Project (AMDIAP)

Trust | Respect | Integrity 19
19
Ambler Mining District Hosts Deposits Rich in Copper, Zinc, Lead, Gold, Silver & Cobalt
High-Grade String of Pearls
AMDIAP

Trust | Respect | Integrity 20
20
Arctic Resource Outline
Probable Mineral Reserves43,038,000 tonnes @ ~5% Cu Eq.
Average Grades:2.32% Cu 3.24% Zn 0.57% Pb
0.49 g/t Au 36.0 g/t Ag
Reserves at the Arctic ProjectProbable Mineral Reserves
Additional Inferred Resources of 3.5 Mt, with average grades of 1.71% Cu, 2.72% Zn, 0.60% Pb, 0.36 g/t Au and 28.69 g/t Ag.See Appendix for Reserve Estimate for the Arctic Project.

Trust | Respect | Integrity 21
21
Legend
Quartz-Mica-Schist (QMS)
Meta-Rhyolite Porphyry (MRP)
Aphanitic Meta-Rhyolite (AMR)
Sulfide Horizons
Proposed Open Pit
Strip Ratio ~ 6.9:1 2018 PFS
Arctic Deposit: Cross Section
Grey Schist (GS)

Trust | Respect | Integrity 22
22
Arctic PFS – Inputs & Economic Results
Pre-Feasibility Inputs and Economic ResultsMine Life 12 Years
Mill Capacity 10,000 tpdStrip Ratio (Waste/Ore) 6.9:1
Average Annual Production
159M lbs Cu
199M lbs Zn
33M lbs Pb
3.3M oz Ag
30,600 oz Au
Base Case Metal Prices
$3.00/lb Cu
$1.10/lb Zn
$1.00/lb Pb
$18.00/oz Ag
$1,300/oz Au
Initial Capital Cost ($ million) $779.6
Total Capital Cost ($ million) $910.8
Operating Cost ($/tonne milled) $46.81
Pre-Tax NPV ($ million) at 8% $1,935.2
After-Tax NPV ($ million) at 8% $1,412.7
Cash Costs, Net of By-Product Credits ($/lb Cu Payable) $0.15
All-in Cost ($/lb of Cu Payable) $0.63
Annual Free Cash Flow at Today's Metal Prices ($ million) ~$450
Capital Intensity Ratio ($ Initial Capital/Tonne of Copper Equivalent) $6,203
After-Tax IRR (%) / Pre-Tax IRR 33.0/38.0
Payback Period - After-Tax (Years) 2.0

Trust | Respect | Integrity 23
23
Arctic PFS – Inputs & Economic Results
159 million pounds Cu at $0.15/lb (by-product credits)
Source: RBC Capital Markets
Arctic Cash Costs
277 million pounds of payable CuEq at $1.37/lb

Trust | Respect | Integrity 24
24
Copper Concentrate
➢ 90% recovery➢ 30.3% concentrate grade➢ Cu payable 96.5%➢ Ag 169 g/t (4.93opt); Ag payable 90%➢ No significant penalty metals
Zinc Concentrate
➢ 91.7% recovery➢ 59.2% concentrate grade➢ Zn payable 85%➢ No significant penalty metals
Precious Metal Concentrate
➢ 80% recovery➢ 55% concentrate grade➢ Pb payable 95%, subject to 3% deduction
for concentrates <60% grade➢ Ag 2,383 g/t (69.5opt); Ag payable 95%➢ Au 34 g/t (1opt); Au payable 95%
Arctic Producing Quality Concentrates
3 Separate High-Quality Concentrates
Copper57%
Lead 4%
Zinc 27%
Gold 5%
Silver 7%
Percentage of Payable Metal
Copper Lead Zinc Gold Silver

Trust | Respect | Integrity 25
25
Arctic Project Development PlanOverview of Valley – Looking Northeast

Trust | Respect | Integrity 26
26
Arctic Project Development PlanOverview of Mine Site – Looking Northeast

Trust | Respect | Integrity 27
27
NEPA Mine Permitting Process (EIS)M
INE
404 PermitACOE
Start Permitting Process - Submit NOI for Mine in Early 2020Army Corp of Engineers (ACOE) is expected to be the lead agency
EXPLORATION & ENVIRONMENTAL
STUDIES
PER
MIT
TIN
G
ENG
INEE
RIN
G &
CO
NST
RU
CTI
ON
OPERATIONS
2 -3 years +/- 3 3 years + 20 years
404 PermitACOE
Notice of
Intent
Public Scoping Preliminary Draft EIS
Draft EIS Public Comment
Period
Final EIS Record of Decision Permit
Issuance
1 yrEarly 2020 2+ Years
Baseline DataGathering
3 yrs
CLO
SUR
E
MO
NIT
OR
ING
7-10 years

Trust | Respect | Integrity 28
28
No Federal Lands – Easier to Permit
➢ 404 Wetland Permit from the US Army Corps of Engineers is the only Federal Permit Required
➢ All other significant permits issued by the State of Alaska
➢ Mine Operating Permit
➢ Air Quality Permit
➢ Dam Operating Permit
➢ Water Discharge Permit
Requires Federal, State and Borough Approvals

Trust | Respect | Integrity 29
29
Horse [email protected]% CuEq Sunshine
[email protected]% CuEq
[email protected]% CuEq
[email protected]% CuEq
[email protected]% CuEq
District Exploration – Pearls on a String
See Company Press Release on February 6, 2019 regarding disclosure of Historic ResourcesA Qualified Person has not done sufficient work to classify the above historical estimates (Smucker, Horse Creek, Sunshine, Shungnak and BT) as current mineral resources or mineral reserves. Trilogy is not treating these historical estimates as current mineral resources or mineral reserves, has not verified the above historical resource estimates and is not relying on them.
Sun*[email protected]% CuEq
Smucker*[email protected]% CuEq
* Not owned by TMQ

Trust | Respect | Integrity 30
Numerous Electromagnetic Anomalies

Trust | Respect | Integrity 31
Numerous Electromagnetic Anomalies

Trust | Respect | Integrity 32
Numerous Electromagnetic Anomalies

Trust | Respect | Integrity 33
Sunshine
1.5% CuEq From (m) To (m) Length (m) Cu (%) Zn (%) Pb (%) Au (g/t) Ag (g/t) CuEq (%)*
139.52 144.76 5.24 2.08 3.13 0.63 0.15 41.64 3.93
238.72 245.06 6.34 1.63 1.45 0.09 0.07 13.38 2.38
247.86 255.06 7.20 0.72 2.18 0.21 0.03 6.64 1.69
260.46 261.60 1.14 1.53 0.35 0.01 0.03 3.67 1.71
176.37 179.74 3.37 4.15 3.42 0.83 0.26 74.35 6.54
188.55 190.10 1.55 1.43 1.65 0.40 0.06 23.30 3.77
204.15 209.09 4.94 4.47 3.42 0.01 0.00 0.12 5.77
219.30 221.98 2.68 3.70 0.44 0.00 0.00 0.40 3.87
SC19-021 146.62 156.28 9.66 3.93 3.00 0.77 0.22 73.10 6.10
114.12 115.47 1.35 2.89 4.87 1.41 0.17 68.30 5.90
130.40 134.61 4.21 0.34 2.28 1.07 0.07 30.63 1.85
143.73 159.01 15.28 1.35 2.91 0.78 0.16 32.58 3.08
SC19-023 163.50 168.51 5.01 0.87 1.92 0.66 0.10 24.69 2.09
SC19-018
SC19-020
SC19-022
2.5% CuEq From (m) To (m) Length (m) Cu (%) Zn (%) Pb (%) Au (g/t) Ag (g/t) CuEq (%)*
139.52 144.76 5.24 2.08 3.13 0.63 0.15 41.64 3.93
241.80 244.26 2.46 2.19 2.97 0.13 0.10 20.90 3.61
253.64 255.06 1.42 1.16 3.78 0.13 0.02 6.50 2.70
176.37 179.74 3.37 4.15 3.42 0.83 0.26 74.35 6.54
204.15 209.09 4.94 4.47 3.42 0.01 0.00 0.12 5.77
219.30 221.98 2.68 3.70 0.44 0.00 0.00 0.40 3.87
SC19-021 146.62 156.28 9.66 3.93 3.00 0.77 0.22 73.10 6.10
114.12 115.47 1.35 2.89 4.87 1.41 0.17 68.30 5.90
143.73 159.01 15.28 1.35 2.91 0.78 0.16 32.58 3.08
SC19-023 163.50 164.94 1.44 1.32 3.10 0.87 0.10 32.40 3.12
SC19-022
SC19-018
SC19-020

Trust | Respect | Integrity 34
Sunshine

Trust | Respect | Integrity 35
35
Sunshine X-Section for SC19-018, 0198.1m @ 3.3 % Cu, 1.5% Zn, 25ppm Ag
(4.3% Cu-Eq)
7.9m @ 2.2 % Cu, 5.6% Zn, 47ppm Ag (5.2% Cu-Eq)
3.8m @ 4.7 % Cu, 1.0% Zn, 29ppm Ag (5.5% Cu-Eq)
N-NES-SW
Copper equivalent (Cu-Eq) calculation is based on metal prices in USD of $2.90/lb copper, $1.10/lb zinc, $0.90/lb lead $1,250/oz Gold, and $18/oz Silver and 100% recovery

Trust | Respect | Integrity 36
Comparison of the Ambler VMS Belt with other Known Belts

Trust | Respect | Integrity 37
37
Ambler Mining District Hosts Deposits Rich in Copper, Zinc, Lead, Gold and Silver & Cobalt
District Exploration Upside

Trust | Respect | Integrity 38
38
Camp at Bornite

Trust | Respect | Integrity 39
39
Proposed Pit
Indicated & Inferred Open Pit Resource
InferredBelow Pit Resource
Drill Target
Exploration Upside Drill Holes
Bornite – Testing Northern ExtensionUS$31 million expended by South32 during 2017, 2018 & 2019 Drilling Programs
• 35 drill holes to in-fill and expand current resources
In-Pit Mineral Resources 40.5 Mt of 1.02% Cu Indicated84.1 Mt of 0.95% Cu Inferred
Below-Pit Mineral Resources57.8 Mt of 2.89% Cu Inferred
6 Billion Pounds of Copper77 Million Pounds of Cobalt

Trust | Respect | Integrity 40
40
Six Billion Pounds of Copper, 77 Million Pounds of Cobalt and Growing
Bornite Exploration Drilling
~27,000 Meters 35 Holes Drilled
2017, 2018 & 2019
Proposed Pit

Trust | Respect | Integrity 41
41
Upcoming Catalysts
• Q1 2020 – Infill Drilling Results for Arctic
• Q1 2020 – Formation of Joint Venture with South32
• Q1 2020 - Announcement of summer work program at the UKMP
• Q1 2020 – Final EIS for the Ambler Mining District Industrial Access Project (“AMDIAP”)
• Q1 2020 – AMDIAP Record of Decision & 404 Permit for AMDIAP from USACE
• H1 2020 Complete Arctic Feasibility Study
• Q2 2020 Summer exploration season commences
H1 News Flow

42
Sumitomo / 30% QB2 (Teck):
2.0x
Zijin / Nevsun:
0.9xNewmont /
50% Galore Creek (Novagold): 0.8x
South32 / Arizona Mining:
1.0x
Mitsubishi / 21.9% Quellaveco (Anglo American):
1.0x
South32 / Trilogy:
0.3x
First Quantum / 10% Cobre Panama (LS-Nikko Copper):
0.8xGoldcorp /
Exeter: 0.7x
Goldcorp / 25% Cerro Casale (Kinross):
1.8x
Goldcorp / 25% Cerro Casale (Barrick):
1.7x
Nevsun / Reservoir:
1.0x
Zijin / 50.5% Kamoa (IVN):
0.7x
Independence / Sirius: 1.1x
Ma'aden / 50% Jabal Sayid (Barrick):
0.5xFirst Quantum /
Lumina: 0.4x
HudBay / Augusta:
0.6x
Stillwater / Peregrine Metals:
0.5x
Capstone Mining / Far West Mining:
0.9x
Mercator / Creston Moly:
0.5x
--
0.3x
0.6x
0.9x
1.2x
1.5x
Apr-11 Apr-12 Apr-13 Apr-14 Apr-15 Apr-16 Apr-17 Apr-18 Apr-19
Developer P/NAV
Early Stage Precedent Transactions
Construction Ready Precedent Transactions
Increasing Scarcity of Quality has Driven Up Valuations
Source: company filings, FactSet, street research
1. Based on consolidated basis to account for ROFR.
Developer P / NAV Over Time
CAPITAL MARKETS UPDATE
$1.00
$2.00
$3.00
$4.00
$5.00
Apr-11 Apr-12 Apr-13 Apr-14 Apr-15 Apr-16 Apr-17 Apr-18 Apr-19
Spot Copper Price (US$/lb)
(1)

43
Trilogy
Excelsior
PolymetNevada Copper
Los Andes
Josemaria
Western Copper
Panoro
Northern Dynasty
Arizona Mining
Filo
Nevsun
MOD
SolGold
Ivanhoe
Cornerstone
Coro
Market Capitalization US$100 mm
--
0.5%
1.0%
1.5%
2.0%
2.5%
3.0%
3.5%
4.0%
-- 5.0 10.0 15.0 20.0 25.0 30.0 35.0
Reso
urc
e G
rad
e (
% C
u E
q.)
Resources (bn lb Cu Eq.)
153.5
73.1
Source: Company filings, FactSet, Fraser Institute, street research
Note: Metrics shown on an attributable basis where applicable; assumes 50% Trilogy interest in Arctic and Bornite, 39.6% Ivanhoe interest in Kamoa-Kakula, 85% SolGold interest in
Cascabel and 15% Cornerstone interest in Cascabel.
1. Resources and resource grade based on all assets.
2. Based on transaction equity value.
Resource Scale vs. Resource Grade
Low Geopolitical Risk Medium Geopolitical Risk High Geopolitical Risk
Leading resource grade amongst copper peers with emerging scale
RESOURCES(1) (BN LB CU EQ.) VS. RESOURCE GRADE(1) (% CU EQ.)
Hig
he
r R
eso
urc
e G
rad
e
Higher Resource Scale
(2)
(2)
(2)
Acquired by South32 Ltd for $1.6 billion
Acquired by Zijin Mining Group $1.42 billion

44
Trilogy
Nevada Copper
Los Andes
Josemaria
Western Copper
Northern Dynasty
Arizona Mining
Filo
NevsunMOD
SolGold
Ivanhoe
Cornerstone
Coro
Resources 20.0 bn lb Cu Eq.
--
500%
1,000%
1,500%
2,000%
2,500%
3,000%
3,500%
-- 0.2x 0.4x 0.6x 0.8x 1.0x
Init
ial C
ap
ex / M
ark
et
Cap
itali
zati
on
(%
)
P / NAV (ratio)
Feasibility and Mine
Permitting
Road Permitting
Source: Company filings, FactSet, Fraser Institute, street research
Note: Metrics shown on an attributable basis where applicable; assumes 50% Trilogy interest in Arctic and Bornite, 39.6% Ivanhoe interest in Kamoa-Kakula, 85% SolGold interest in
Cascabel and 15% Cornerstone interest in Cascabel.
1. Resources based on all assets.
2. Based on transaction P / NAV multiples.
Funding Requirements vs. Valuation
Low Geopolitical Risk Medium Geopolitical Risk High Geopolitical Risk
Trilogy has relatively low funding requirements
P / NAV (RATIO) VS. INITIAL CAPEX / MARKET CAPITALIZATION (%)
(1)
Higher Relative Valuation
Lo
wer
Fu
nd
ing
Re
qu
ire
me
nt
(2)
(2)(2)

Trust | Respect | Integrity 45
45
Taikuu!

Trust | Respect | Integrity 46
46
Appendix
Qualified Person: Andrew W. West, Certified Professional Geologist, Exploration Manager for Trilogy Metals Inc., is a QualifiedPerson as defined by National Instrument 43-101. Mr. West has reviewed and verified the technical information in thispresentation and approves the disclosure contained herein.

Trust | Respect | Integrity 47
47
Copper FundamentalsGlobal Copper Inventories are Down
Source: Scotiabank

Trust | Respect | Integrity 48
48
Copper FundamentalsGlobal Zinc Inventories are Down
Source: Scotiabank

Trust | Respect | Integrity 49
49
AMDIAP Draft EIS
• On August 23, 2019 the Bureau of Land Management (BLM) posted the draft Environmental Impact Statement (EIS) for the Ambler road.
• National Parks Service (NPS) issued the EEA on the same day (August 23, 2019). This document evaluates the potential environmental and economic impacts of Alts A and B. The Secretaries of Interior and Transportation to make final decision
• The Alaska National Interest Lands Conservation Act (ANILCA) requires that right-of-way access be permitted across NPS lands for this project.
• The 60-day comment period for both documents was completed on October 29, 2019
• The Draft EIS evaluates three alternative routes (A, B & C) with the 211-mile route, Alt. A, being the preferred Alterative
• Final EIS will incorporate Secretaries Decision Alt. A/B and carry final recommendation
• Once the Final EIS is completed the BLM will file the Record of Decision• US Army Corp. of Engineers will issue the Dredge and Fill permit which is covered
by Section 404 of the Clean Water Act

Trust | Respect | Integrity 50
50
Ambler Mining District Industrial Access Project (AMDIAP)
18 mi of AMDIAP traversing BLM managed land
6 mi of AMDIAP traversing State and Native selected lands managed by BLM

Trust | Respect | Integrity 51
51
Arctic PFS – Capital
Capital Costs Million (US$)Mining $281.1
Crushing $18.3
Process Plant $113.8
Tailings $30.3
On-Site Infrastructure $84.5
Off-Site Infrastructure $15.6
Total Direct Costs $543.8
Indirects $121.9
Contingency $92.0
Owners Costs $21.9
Total Indirect Costs $235.8
Total Initial Capital Costs $779.6
Sustaining Capital $65.9
Mine Closure and Reclamation $65.3
Total Capital Costs $910.8

Trust | Respect | Integrity 52
52
Arctic PFS – Operating Costs
Production Labour
2.33
Plant Maintenance
Labour3.69
Power 5.23
Operating Consumables
3.29
Light Vehicles &
Mobile Equipment
0.07
PFS Operating Cost ($/t)
MaintenanceConsumables
0.49
1% NSR to NANA Regional Corporation, Inc. in exchange for surface use agreement- NSR to NANA totals $90.4 million over the life of mine
Significant reduction in power generation costs due to use of LNG in processing facilities
- Power generation in 2018 PFS is $5.23/t
Off-Site Operating Costs
Royalties, TC/RCs, Penalties, Insurance & Transport ($, million) $2,526.8
On-Site Operating Costs
Mining Cost ($/t mined) $3.09
Mining ($/t milled) $20.47
Processing ($/t milled) $15.19
G&A ($/t milled) $5.60
Surface Service ($/t milled) $0.95
Road Toll & Maintenance ($/t milled) $4.70
Total Operating Cost ($/t milled) $46.81
Total Operating Cost ($, million) $2,014.7
Operating Costs (US$)

Trust | Respect | Integrity 53
53
Tonnage Average Grade:
Category t x 1000 Cu (%)Zn
(%)Pb (%)
Au
(g/t)
Ag
(g/t)
Proven Mineral Reserves - - - - - -
Probable Mineral Reserves 43,038 2.32 3.24 0.57 0.49 36.0
Proven & Probable Mineral
Reserves43,038 2.32 3.24 0.57 0.49 36.0
Waste within Designed Pit 296,444
Total Tonnage within Designed Pit 339,482
Notes
(1) Reserves estimated assuming open pit mining methods and include a combination of planned and contact dilution.
(2) Reserves are based on prices of $2.90/lb Cu, $0.90/lb Pb, $1.10/lb Zn, $1,250/oz Au and $18/oz Ag and fixed process recoveries of
90.0% Cu, 89.9% Pb, 91.7% Zn, 61.1% Au and 49.7% Ag.
(3) Mining costs: $3.00/t incremented at $0.02/t15m and $0.015/t/15m below and above 710m elevation respectively.
(4) Processing costs: $36.55/t. Includes process cost: $19.86/t, G&A: $8.92/t, sustaining capital: $4.11/t, closure: $1.00/t and road toll:
$2.66/t.
(5) Treatment costs of $70/t Cu concentrate, $180/t Pb concentrate and $300/t Zn concentrate. Refining costs of $0.07/lb Cu, $10/oz Au,
$0.60/oz Ag. Transport cost $149.96/t concentrate.
(6) Fixed royalty percentage of 1%.
(7) There is a risk to the mineral reserves if the toll road is not built in the time frame required for the Arctic Project, or if the toll charges
are significantly different from what was assumed.
(8) The geotechnical assumptions used in the pit design may vary in future assessments and could materially affect the strip ratio, or
mine access design.
(9) The Qualified Person for the reserves estimate is Antonio Peralta, P.Eng who visited the Project site in July 2017 as part of the data
verification process.
(10) The effective date of the mineral reserves estimate is October 10, 2017.
Reserve Estimate for Arctic Project
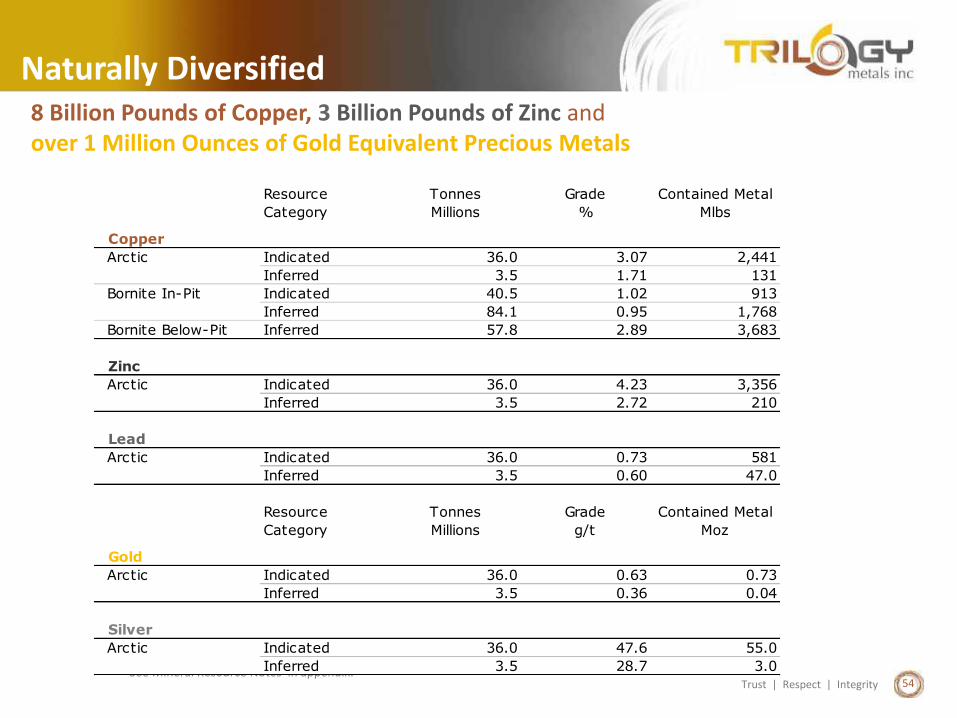
Trust | Respect | Integrity 54
54
* See Mineral Resource Notes in appendix.
8 Billion Pounds of Copper, 3 Billion Pounds of Zinc andover 1 Million Ounces of Gold Equivalent Precious Metals
Naturally Diversified
Mineral Resources Table – Arctic & Bornite DepositsResource Tonnes Grade Contained Metal
Category Millions % Mlbs
Copper
Arctic Indicated 36.0 3.07 2,441
Inferred 3.5 1.71 131
Bornite In-Pit Indicated 40.5 1.02 913
Inferred 84.1 0.95 1,768
Bornite Below-Pit Inferred 57.8 2.89 3,683
Zinc
Arctic Indicated 36.0 4.23 3,356
Inferred 3.5 2.72 210
Lead
Arctic Indicated 36.0 0.73 581
Inferred 3.5 0.60 47.0
Resource Tonnes Grade Contained Metal
Category Millions g/t Moz
Gold
Arctic Indicated 36.0 0.63 0.73
Inferred 3.5 0.36 0.04
Silver
Arctic Indicated 36.0 47.6 55.0
Inferred 3.5 28.7 3.0

Trust | Respect | Integrity 55
55
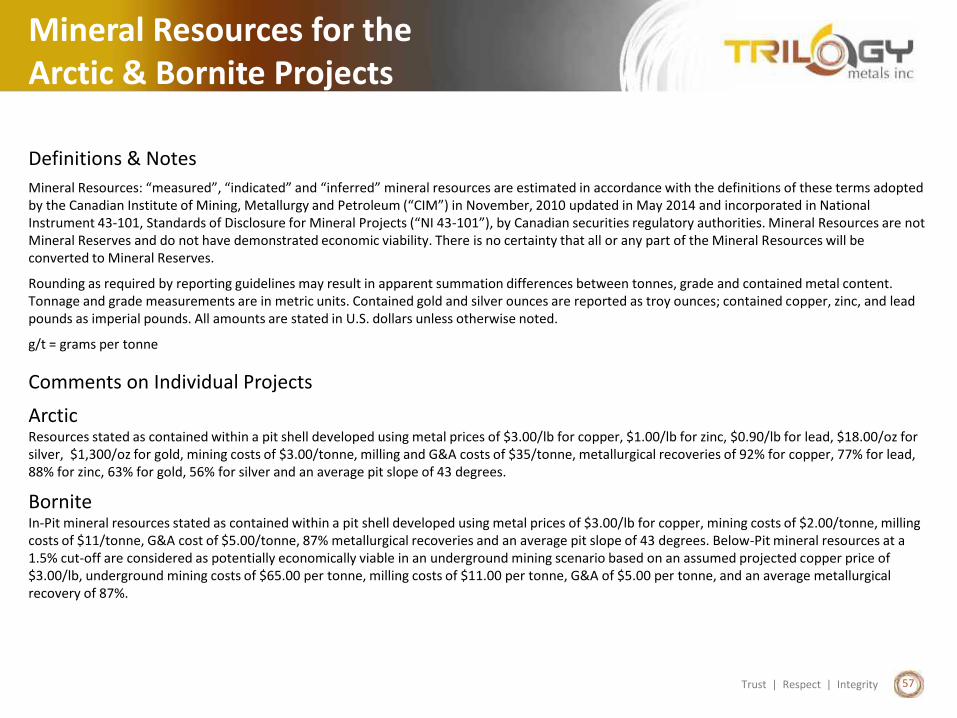
Mineral Resources for the Arctic & Bornite Projects
Resource Footnotes1) Resources stated as contained within a potentially mineable open pit design using a constant NSR cut-off of US$35.01/tonne millled.2) NSR calculation is based on assumed metal prices of $2.90/lb for copper, $0.85/lb for zinc, $0.90/lb for lead, $22.70/oz for silver, and $1,300/oz for gold. Appropriate mining costs, processing costs,
metal recoveries and inter ramp pit slope angles were used to generate the pit design. The $35.01/tonne milled cut-off is calculated based on a process operating cost of $19.03/tonne, G&A of $7.22/tonne and site services of $8.76/tonne. NSR equals payable metal values, based on the metal prices outlined above, less applicable treatment, smelting, refining costs, penalties, concentrate transportation costs, insurance and losses and royalties.
3) Resources stated as contained within a pit shell developed using a metal price of $3.00/lb for copper, mining costs of $2.00/tonne, milling costs of $11/tonne, G&A cost of $5.00/tonne, 87% metallurgical recoveries and an average pit slope of 43 degrees.
4) Mineral resources at a 1.5% cut-off are considered as potentially economically viable in an underground mining scenario based on an assumed projected copper price of $3.00/lb, underground mining costs of $65.00 per tonne, milling costs of $11.00 per tonne, G&A of $5.00 per tonne, and an average metallurgical recovery of 87%.
5) The Arctic copper-equivalent resource is calculated using the following metal price assumptions: (in USD) $2.90/lb Cu, $0.85/lb Zn, $0.90/lb Pb, $22.70 oz Ag , and $1,300/oz Au. Calculation excludes any adjustments for metal recoveries. Net of by-product credit. Cobalt not included in Bornite copper-equivalent calculation.
6) Note that although the data supports estimates of copper resources in both the Indicated and Inferred categories, the volume and distribution of available cobalt sample data is considered insufficient to support the estimate of cobalt resources in the Indicated category and, as a result, all of the estimated cobalt resource remains in the Inferred category.
Deposit Cut-offTonnes
(M)Cu% Co% Zn% Pb% Ag g/t Au g/t
Co
(Mlbs)
Cu
(Mlbs)
Cu Eq5
(Mlbs)
Tonnes
Cu
Tonnes
Cu Eq5
Indicated
Bornite
(In-Pit)3 0.5% Cu 40.5 1.02 913 913 413,000 413,000
Total Indicated 913 913 413,000 413,000
Inferred
Arctic1,2 0.5% Cu 3.4 3.22 3.84 0.58 41.5 0.59 239 399 108,000 181,000
Bornite Cu
(In-Pit)3 0.5% Cu 84.1 0.95 1,768 1,768 802,000 802,000
Bornite Co
(In-Pit)6 0.5% Cu 124.6 0.017 45
Bornite
(Below Pit)4 1.5% Cu 57.8 2.89 0.025 32 3,683 1,671,000
Total Inferred 77 5,690 2,167 2,581,000 983,000Notes:a) Mineral Resources are not Mineral Reserves and do not have demonstrated economic viability. There is no certainty that all or any part of the Mineral Resources will be converted into Mineral
Reserves.b) These resource estimates have been prepared in accordance with NI 43-101 and the CIM Definition Standard, unless otherwise noted.c) See numbered footnotes below on resource information.d) Rounding as required by reporting guidelines may result in apparent summation differences between tonnes, grade and contained metal content.e) Tonnage and grade measurements are in metric units. Contained gold and silver ounces are reported as troy ounces; contained copper, zinc, and lead pounds as imperial pounds.f) g/t = grams per tonneg) All amounts are stated in U.S. dollars unless otherwise noted.

Trust | Respect | Integrity 56
56
Cautionary Note Concerning Resource EstimatesThis summary table may use the term "resources", "measured resources", "indicated resources" and "inferred resources". United States investors are advised that, while such terms are recognized and required by Canadian securities laws, the United States Securities and Exchange Commission (the "SEC") does not recognize them. Under United States standards, mineralization may not be classified as a "reserve" unless the determination has been made that the mineralization could be economically and legally produced or extracted at the time the reserve determination is made. Mineral resources that are not mineral reserves do not have demonstrated economic viability. United States investors are cautioned not to assume that all or any part of measured or indicated resources will ever be converted into reserves. Further, inferred resources have a great amount of uncertainty as to their existence and as to whether they can be mined legally or economically. It cannot be assumed that all or any part of the inferred resources will ever be upgraded to a higher category. Therefore, United States investors are also cautioned not to assume that all or any part of the inferred resources exist, or that they can be mined legally or economically. Disclosure of "contained ounces" is permitted disclosure under Canadian regulations, however, the SEC normally only permits issuers to report "resources" as in place tonnage and grade without reference to unit measures. Accordingly, information concerning descriptions of mineralization and resources contained in this release may not be comparable to information made public by United States companies subject to the reporting and disclosure requirements of the SEC.
NI 43-101 is a rule developed by the Canadian Securities Administrators, which established standards for all public disclosure an issuer makes of scientific and technical information concerning mineral projects. Unless otherwise indicated, all resource estimates contained in this circular have been prepared in accordance with NI 43-101 and the CIM Definition of Standards.
NI 43-101 Compliant Resources
Technical Report and Qualified PersonsThe documents referenced below provide supporting technical information for each of the Company’s projects.
Project Qualified Person(s) Most Recent Disclosure & Filing DateArctic Dr. Bruce M. Davis, FAusIMM, BD Resource Consulting Inc. Company’s press release dated February 20,
Robert Sim, P.Geo., Sim Geological Inc. 2018
Paul Staples, P.Eng., Ausenco Engineering Canada Inc. Arctic Project, Northwest Alaska, USAJustin Hannon, P.Eng., Ausenco Engineering Canada Inc. NI 43-101 Technical Report on Pre-Feasibility Antonio Peralta Romero, PhD, P.Eng., Amec Foster Wheeler Americas Ltd. Study – Effective date February 20, 2018; Filed Bruce Davis, FAusIMM, BD Resource Consulting, Inc. April 6, 2018John J. DiMarchi, CPG, Core Geoscience Inc.Jeffrey B. Austin, P.Eng., International Metallurgical & Environmental Inc. Robert Sim, P.Geo., SIM Geological Inc.Calvin Boese, P.Eng., M.Sc., SRK Consulting (Canada) Inc.Bruce Murphy, P.Eng., SRK Consulting (Canada) Inc.Tom Sharp, PhD, P.Eng., SRK Consulting (Canada) Inc.
Bornite Dr. Bruce M. Davis, FAusIMM, BD Resource Consulting Inc. Company’s press release dated June 5, 2018Robert Sim, P.Geo., Sim Geological Inc.Jeff Austin, P.Eng., International Metallurgical & Environmental Inc. NI 43-101 Technical Report on the Bornite
Project, Northwest Alaska, USA – Effective date June 5, 2018; Filed July 20, 2018
Trust | Respect | Integrity 57
57
Mineral Resources for the Arctic & Bornite Projects
Definitions & Notes
Mineral Resources: “measured”, “indicated” and “inferred” mineral resources are estimated in accordance with the definitions of these terms adopted by the Canadian Institute of Mining, Metallurgy and Petroleum (“CIM”) in November, 2010 updated in May 2014 and incorporated in National Instrument 43-101, Standards of Disclosure for Mineral Projects (“NI 43-101”), by Canadian securities regulatory authorities. Mineral Resources are not Mineral Reserves and do not have demonstrated economic viability. There is no certainty that all or any part of the Mineral Resources will be converted to Mineral Reserves.
Rounding as required by reporting guidelines may result in apparent summation differences between tonnes, grade and contained metal content. Tonnage and grade measurements are in metric units. Contained gold and silver ounces are reported as troy ounces; contained copper, zinc, and lead pounds as imperial pounds. All amounts are stated in U.S. dollars unless otherwise noted.
g/t = grams per tonne
Comments on Individual Projects
ArcticResources stated as contained within a pit shell developed using metal prices of $3.00/lb for copper, $1.00/lb for zinc, $0.90/lb for lead, $18.00/oz for silver, $1,300/oz for gold, mining costs of $3.00/tonne, milling and G&A costs of $35/tonne, metallurgical recoveries of 92% for copper, 77% for lead, 88% for zinc, 63% for gold, 56% for silver and an average pit slope of 43 degrees.
BorniteIn-Pit mineral resources stated as contained within a pit shell developed using metal prices of $3.00/lb for copper, mining costs of $2.00/tonne, milling costs of $11/tonne, G&A cost of $5.00/tonne, 87% metallurgical recoveries and an average pit slope of 43 degrees. Below-Pit mineral resources at a 1.5% cut-off are considered as potentially economically viable in an underground mining scenario based on an assumed projected copper price of $3.00/lb, underground mining costs of $65.00 per tonne, milling costs of $11.00 per tonne, G&A of $5.00 per tonne, and an average metallurgical recovery of 87%.

Trust | Respect | Integrity 58
58
Unless otherwise indicated, all reserve and resource estimates included in this presentation have been prepared in accordance with Canadian NationalInstrument 43-101 Standards of Disclosure for Mineral Projects (“NI 43-101”) and the Canadian Institute of Mining, Metallurgy and PetroleumDefinition Standards for Mineral Resources and Mineral Reserves (“CIM Definition Standards”). Canadian standards, including NI 43-101, differsignificantly from the requirements of the United States Securities and Exchange Commission (“SEC”), and reserve and resource information in thispresentation may not be comparable to similar information disclosed by U.S. companies. In particular, and without limiting the generality of theforegoing, the term “resource” does not equate to the term “‘reserves”. Under U.S. standards, mineralization may not be classified as a “reserve”unless the determination has been made that the mineralization could be economically and legally produced or extracted at the time the reservedetermination is made. The SEC’s disclosure standards normally do not permit the inclusion of information concerning “measured mineral resources”,“indicated mineral resources” or “inferred mineral resources” or other descriptions of the amount of mineralization in mineral deposits that do notconstitute “reserves” by U.S. standards in documents filed with the SEC. U.S. investors should also understand that “inferred mineral resources” have agreat amount of uncertainty as to their existence and great uncertainty as to their economic and legal feasibility. It cannot be assumed that all or anypart of an “inferred mineral resource” will ever be upgraded to a higher category. Under Canadian rules, estimated “inferred mineral resources” maynot form the basis of feasibility or pre-feasibility studies except in rare cases. Investors are cautioned not to assume that all or any part of an “inferredmineral resource” exists or is economically or legally mineable. Disclosure of “contained ounces” in a resource is permitted disclosure under Canadianregulations; however, the SEC normally only permits issuers to report mineralization that does not constitute “reserves” by SEC standards as in-placetonnage and grade without reference to unit measures. The requirements of NI 43-101 for identification of “reserves” are also not the same as those ofthe SEC, and reserves reported in compliance with NI 43-101 may not qualify as “reserves” under SEC standards. Accordingly, information concerningmineral deposits set forth herein may not be comparable to information made public by companies that report in accordance with United Statesstandards.
Disclosure Regarding Scientific and Technical Information

Trust | Respect | Integrity 59
59
Trust | Respect | Integrity
Corporate OfficeSuite 1150 – 609 Granville Street, Vancouver, British Columbia, V7Y 1G5 Canada
Toll Free 1.855.638.8088
NYSE American, TSX: TMQwww.trilogymetals.com