High-flow nasal cannula oxygen therapy decreases ... · We also excluded patients showing paradox-...
11
RESEARCH Open Access High-flow nasal cannula oxygen therapy decreases postextubation neuroventilatory drive and work of breathing in patients with chronic obstructive pulmonary disease Rosa Di mussi 1 , Savino Spadaro 2 , Tania Stripoli 1 , Carlo Alberto Volta 2 , Paolo Trerotoli 3 , Paola Pierucci 4 , Francesco Staffieri 5 , Francesco Bruno 1 , Luigi Camporota 6 and Salvatore Grasso 1* Abstract Background: The physiological effects of high-flow nasal cannula O 2 therapy (HFNC) have been evaluated mainly in patients with hypoxemic respiratory failure. In this study, we compared the effects of HFNC and conventional low-flow O 2 therapy on the neuroventilatory drive and work of breathing postextubation in patients with a background of chronic obstructive pulmonary disease (COPD) who had received mechanical ventilation for hypercapnic respiratory failure. Methods: This was a single center, unblinded, cross-over study on 14 postextubation COPD patients who were recovering from an episode of acute hypercapnic respiratory failure of various etiologies. After extubation, each patient received two 1-h periods of HFNC (HFNC1 and HFNC2) alternated with 1 h of conventional low-flow O 2 therapy via a face mask. The inspiratory fraction of oxygen was titrated to achieve an arterial O 2 saturation target of 88–92%. Gas exchange, breathing pattern, neuroventilatory drive (electrical diaphragmatic activity (EAdi)) and work of breathing (inspiratory trans-diaphragmatic pressure-time product per minute (PTP DI/min )) were recorded. Results: EAdi peak increased from a mean (±SD) of 15.4 ± 6.4 to 23.6 ± 10.5 μV switching from HFNC1 to conventional O 2 , and then returned to 15.2 ± 6.4 μV during HFNC2 (conventional O 2 : p < 0.05 versus HFNC1 and HFNC2). Similarly, the PTP DI/min increased from 135 ± 60 to 211 ± 70 cmH 2 O/s/min, and then decreased again during HFNC2 to 132 ± 56 (conventional O 2 : p < 0.05 versus HFNC1 and HFNC2). Conclusions: In patients with COPD, the application of HFNC postextubation significantly decreased the neuroventilatory drive and work of breathing compared with conventional O 2 therapy. Keywords: High-flow nasal cannula oxygen therapy, Chronic obstructive pulmonary disease, Weaning from mechanical ventilation, Neuroventilatory drive, Work of breathing Background High-flow nasal cannula oxygen therapy (HFNC) con- sists of a totally conditioned, warmed, and humidified air/oxygen blend through a wide-bore nasal cannula at a flow rate between 20 and 60 L/min [1]. Compared with the ‘ conventional’ oxygen therapy devices, which deliver gas at 5–20 L/min (conventional O 2 ), during HFNC the tracheal inspiratory oxygen fraction (FiO 2 ) is more pre- dictable [2] and the mucociliary function is better pre- served [3]. In addition, HFNC generates a positive airway pressure (between 2 and 8 cmH 2 O at the pharyngeal level) which resembles positive end-expiratory pressure (PEEP) and is proportional to the administered gas flow rate and varies with the patient breathing pattern (i.e., breathing with the mouth open or closed) [4]. Furthermore, HFNC results in a significant, flow-dependent ‘CO 2 wash out ef- fect’ of the nasopharyngeal space which decreases the * Correspondence: [email protected] 1 Dipartimento dell’Emergenza e Trapianti d’Organo (DETO), Sezione di Anestesiologia e Rianimazione, Ospedale Policlinico, Università degli Studi di Bari “Aldo Moro”, Piazza Giulio Cesare 11, Bari, Italy Full list of author information is available at the end of the article © The Author(s). 2018 Open Access This article is distributed under the terms of the Creative Commons Attribution 4.0 International License (http://creativecommons.org/licenses/by/4.0/), which permits unrestricted use, distribution, and reproduction in any medium, provided you give appropriate credit to the original author(s) and the source, provide a link to the Creative Commons license, and indicate if changes were made. The Creative Commons Public Domain Dedication waiver (http://creativecommons.org/publicdomain/zero/1.0/) applies to the data made available in this article, unless otherwise stated. Di mussi et al. Critical Care (2018) 22:180 https://doi.org/10.1186/s13054-018-2107-9
Transcript of High-flow nasal cannula oxygen therapy decreases ... · We also excluded patients showing paradox-...
RESEARCH Open Access
High-flow nasal cannula oxygen therapydecreases postextubation neuroventilatorydrive and work of breathing in patientswith chronic obstructive pulmonary diseaseRosa Di mussi1, Savino Spadaro2, Tania Stripoli1, Carlo Alberto Volta2, Paolo Trerotoli3, Paola Pierucci4,Francesco Staffieri5, Francesco Bruno1, Luigi Camporota6 and Salvatore Grasso1*
Abstract
Background: The physiological effects of high-flow nasal cannula O2 therapy (HFNC) have been evaluated mainlyin patients with hypoxemic respiratory failure. In this study, we compared the effects of HFNC and conventionallow-flow O2 therapy on the neuroventilatory drive and work of breathing postextubation in patients with abackground of chronic obstructive pulmonary disease (COPD) who had received mechanical ventilation forhypercapnic respiratory failure.
Methods: This was a single center, unblinded, cross-over study on 14 postextubation COPD patients who wererecovering from an episode of acute hypercapnic respiratory failure of various etiologies. After extubation, eachpatient received two 1-h periods of HFNC (HFNC1 and HFNC2) alternated with 1 h of conventional low-flow O2
therapy via a face mask. The inspiratory fraction of oxygen was titrated to achieve an arterial O2 saturation target of88–92%. Gas exchange, breathing pattern, neuroventilatory drive (electrical diaphragmatic activity (EAdi)) and workof breathing (inspiratory trans-diaphragmatic pressure-time product per minute (PTPDI/min)) were recorded.
Results: EAdi peak increased from a mean (±SD) of 15.4 ± 6.4 to 23.6 ± 10.5 μV switching from HFNC1 toconventional O2, and then returned to 15.2 ± 6.4 μV during HFNC2 (conventional O2: p < 0.05 versus HFNC1 andHFNC2). Similarly, the PTPDI/min increased from 135 ± 60 to 211 ± 70 cmH2O/s/min, and then decreased againduring HFNC2 to 132 ± 56 (conventional O2: p < 0.05 versus HFNC1 and HFNC2).
Conclusions: In patients with COPD, the application of HFNC postextubation significantly decreased theneuroventilatory drive and work of breathing compared with conventional O2 therapy.
Keywords: High-flow nasal cannula oxygen therapy, Chronic obstructive pulmonary disease, Weaning frommechanical ventilation, Neuroventilatory drive, Work of breathing
BackgroundHigh-flow nasal cannula oxygen therapy (HFNC) con-sists of a totally conditioned, warmed, and humidifiedair/oxygen blend through a wide-bore nasal cannula at aflow rate between 20 and 60 L/min [1]. Compared withthe ‘conventional’ oxygen therapy devices, which deliver
gas at 5–20 L/min (conventional O2), during HFNC thetracheal inspiratory oxygen fraction (FiO2) is more pre-dictable [2] and the mucociliary function is better pre-served [3]. In addition, HFNC generates a positive airwaypressure (between 2 and 8 cmH2O at the pharyngeal level)which resembles positive end-expiratory pressure (PEEP)and is proportional to the administered gas flow rate andvaries with the patient breathing pattern (i.e., breathingwith the mouth open or closed) [4]. Furthermore, HFNCresults in a significant, flow-dependent ‘CO2 wash out ef-fect’ of the nasopharyngeal space which decreases the
* Correspondence: [email protected] dell’Emergenza e Trapianti d’Organo (DETO), Sezione diAnestesiologia e Rianimazione, Ospedale Policlinico, Università degli Studi diBari “Aldo Moro”, Piazza Giulio Cesare 11, Bari, ItalyFull list of author information is available at the end of the article
© The Author(s). 2018 Open Access This article is distributed under the terms of the Creative Commons Attribution 4.0International License (http://creativecommons.org/licenses/by/4.0/), which permits unrestricted use, distribution, andreproduction in any medium, provided you give appropriate credit to the original author(s) and the source, provide a link tothe Creative Commons license, and indicate if changes were made. The Creative Commons Public Domain Dedication waiver(http://creativecommons.org/publicdomain/zero/1.0/) applies to the data made available in this article, unless otherwise stated.
Di mussi et al. Critical Care (2018) 22:180 https://doi.org/10.1186/s13054-018-2107-9

anatomical dead space ventilation and therefore the CO2
rebreathing [5]. It seems likely that the overall impact ofHFNC on the respiratory function results from the syner-gistic interaction of the mechanisms described above aswell as other, more subtle, and as yet incompletely under-stood mechanisms [6].Since its introduction, HFNC has been applied to treat
patients with hypoxemic respiratory failure [2, 7–9] andto prevent reintubation in patients at risk of extubationfailure [10–12]. In these patients, compared with con-ventional O2 therapy, HFNC improves oxygenation anddecreases the work of breathing (WOB) [10, 13]. Studiesin patients with stable chronic obstructive pulmonarydisease (COPD) in a home-care setting suggest favorableeffects on the WOB and gas exchange [14–16]. However,far less known are the physiological effects of HFNC onneuroventilatory drive and WOB in patients with COPDin the critical care setting.The electric activity of the diaphragm (EAdi) is a ‘proc-
essed’ diaphragmatic electromyography signal recordedthrough an array of electrode pairs mounted on the wallof a nasogastric feeding tube [17]. The EAdi is propor-tional to the intensity of the electrical stimuli directed tothe diaphragm, i.e., the neuroventilatory drive [18–20].Recently, Bellani and coworkers demonstrated that EAdican be used to estimate the instantaneous WOB [21].In this physiological study, we administered HFNC
and conventional O2 therapy via a face mask postextuba-tion in patients with a background of COPD who hadreceived mechanical ventilation for hypercapnic respira-tory failure from various etiologies. The hypothesis ofthis study was that, in these patients, HFNC decreasesthe neuroventilatory drive and WOB compared withconventional O2 therapy.
MethodsPatient selectionWe enrolled patients with a background of moderate-se-vere COPD who were admitted to the intensive care unit(ICU) at the University Hospital of Bari (Italy) betweenDecember 2015 and December 2016 and required mech-anical ventilation for acute hypercapnic ventilatory fail-ure of various etiologies. The diagnosis of COPD wasmade by three experts, including one pulmonologist(PP) and two intensivists (SG and TS), and was gradedin accordance with the Global Initiative for ChronicObstructive Lung Disease (GOLD) criteria (http://goldcopd.org/gold-2017-global-strategy-diagnosis-management-prevention-copd/). For each patient, thethree assessors reviewed the clinical history, medicalrecords, smoking history, frequency of exacerbation,spirometry data, radiological findings, physical exam-ination, and measurement of static intrinsic PEEP onadmission to ICU. The GOLD spirometry criterion for
the diagnosis of COPD was a postbronchodilatorforced expiratory volume in 1 s/forced vital capacity(FEV1/FVC) < 0.7. Based on the FEV1 impairment, theseverity of COPD was defined as follows: GOLDstage 1 (mild), FEV1 ≤ 80% predicted; GOLD stage 2(moderate), 50% ≤ FEV1 < 80% predicted; GOLD stage3 (severe) 30% ≤ FEV1 < 50% predicted; GOLD stage4 (very severe), FEV1 < 30% predicted. The localethics committee approved the study protocol andinformed consent requirements were met accordingto local regulations (Azienda Ospedaliero-UniversitariaPoliclinico di Bari Ethic Committee, protocol number:885/C.E., May 2014).Patients ready for extubation, as assessed by the treat-
ing clinician, were eligible for the study. According toour clinical protocol, the criteria defining readiness forextubation were: a) resolution or improvement of thecondition leading to acute respiratory failure; b) setPEEP lower than 6 cmH2O and FiO2 lower than 0.6 witha PaO2/FiO2 ratio greater than 150 mmHg; c) arterialpH > 7.35; c) Richmond Agitation Sedation Scale (RASS)between 0 and −1 [22], with no sedation or with a con-tinuous infusion of dexmedetomidine (0.1–1.4 μg/kg/h);and d) ability to trigger the ventilator, i.e., to decreasepressure airway opening (PAO) > 3 cmH2O during a brief(5–10 s) end-expiratory occlusion test. Other criteria in-cluded normothermia and hemodynamic stability unsup-ported by vasopressors or inotropes, but we allowedlow-dose dobutamine (< 5 μg/kg/min) or low-dose dopa-mine (< 3 μg/kg/min). All patients underwent a 30-minspontaneous breathing trial (SBT) consisting of pressuresupport ventilation at 5 cmH2O with a PEEP of 5cmH2O. Patients were eligible to be included in thestudy after a successful SBT.Exclusion criteria were: age < 18 years; < 48 h of invasive
mechanical ventilation; presence of a tracheostomy; con-traindications to the insertion of the EAdi catheter (e.g.,recent upper gastrointestinal surgery, esophageal varices,esophageal trauma); and concomitant neurological orneuromuscular pathologies and/or known phrenic nervedysfunction. We also excluded patients showing paradox-ical abdominal movements or the use of accessory inspira-tory muscles. The reason for the latter exclusion criterionis because the correlation between work of breathing andEAdi is valid only if the diaphragm contributes to approxi-mately 75% of the overall WOB [23], and the calculationof WOB from EAdi may be inaccurate if the work carriedout by the accessory inspiratory muscles is more than thatof the diaphragm.Before extubation, all patients were ventilated with a
Servo-i ventilator (Maquet, Getinge group Critical Care,Solna, Sweden) equipped with the EAdi software (Maquet,Getinge group Critical Care, Solna, Sweden). At the begin-ning of the study, the standard feeding nasogastric tube was
Di mussi et al. Critical Care (2018) 22:180 Page 2 of 11

replaced with a 16-Fr, 125-cm EAdi catheter (Maquet,Getinge group Critical Care, Solna, Sweden) unless an EAdicatheter was already in place. The EAdi catheter was firstpositioned based on the corrected nose-earlobe-xyphoiddistance formula, in accordance with the manufacturer’s in-structions [24]. Its position was subsequently adjusted usingthe ventilator EAdi catheter position tool (Servo-i ventilatorNAVA software) [24].
MeasurementsPatients were studied in the semirecumbent position. TheEAdi signal was collected from the RS232 ventilator portat a sampling rate of 100 Hz (NAVA tracker software,Maquet Getinge group Critical Care, Solna, Sweden) andstored in a personal computer. The NAVA tracker fileswere subsequently converted and analyzed using the ICU-Lab software package (Kleistek Engineering, Bari, Italy).The inspiratory EAdi peak (EAdiPEAK), the integral of
the inspiratory EAdi deflection over time (EAdiPTP), theslope of the EAdi from the beginning of inspiration to thepeak (EAdiSLOPE), the respiratory rate (RR), and the neuralinspiratory time (TiNEUR) were measured from the EAdiwaveform [25].Given that all patients were breathing spontaneously, tidal
volume (VT) was not measured to avoid any modificationin breathing pattern caused by the measurement apparatus.The pressure generated by the diaphragm (i.e., the
trans-diaphragmatic pressure, PDI) throughout the in-spiratory phase was calculated from the EAdi signal asdescribed by Bellani and coworkers [21]. Briefly, we cal-culated first the diaphragmatic neuromuscular efficiency(NME), i.e., the ratio between the negative peak inairway opening pressure (PAO) during a spontaneous in-spiratory effort (recorded during a brief end-expiratoryocclusion lasting 5–10 s) and the corresponding peak inthe EAdi curve [19, 26, 27]. Since the fall in PAO duringa spontaneous inspiratory effort against the occludedairways is, by definition, equal to the corresponding fall inesophageal pressure (PES) [28, 29], the NME is an index ofdiaphragmatic neuromechanical coupling, and accordinglycan be used as a factor to convert the EAdi into PDI
(PDI = EAdi × NME) [21]. The inspiratory PDI pressure-timeproduct per breath (PTPDI/b) was calculated as the areaunder the PDI signal. The inspiratory PDI pressure-timeproduct per minute (PTPDI/min) was calculated as:
PTPDI= min ¼ PTPDI=b � RR:
Study protocolAt the beginning of the study, 5–10 min before extuba-tion, the NME was calculated after a brief (5–10 s)end-expiratory occlusion. Immediately after extubation,patients underwent a cross-over protocol with an ON–OFF–ON design, alternating HFNC with conventionalO2 delivered through a face mask (i.e., HFNC1 – con-ventional O2 therapy – HFNC2), with each phase lastingfor 1 h (Fig. 1).The HFNC was administered through the AIRVO™ 2
system (Fisher & Paykel Healthcare, Auckland, NewZealand) and specific medium/large nasal prongs to fitthe size of the nostrils (Fisher & Paykel Healthcare,Auckland, New Zealand). The system allows for the ad-ministration of humidified and warmed gas flow (10–60 L/min in the adult configuration). The gas flow wastitrated upwards at 5–10 L/min steps starting from20 L/min, up to the highest flow compatible with patientcomfort (maximum allowed flow 60 L/min) [30]. TheFiO2 was titrated to achieve an hemoglobin oxygen sat-uration (SaO2) target of 88–92%. The temperature of theheated humidifier was set at 37 °C.In keeping with previous studies [13], the conventional
O2 therapy was administered through a standard nonoc-clusive oxygen facial mask connected to a O2/air mixer(0–20 L/min). The mask gas flow was set to 10 L/min inall the patients. The FiO2 in the mask flow was titratedto achieve the 88–92% SaO2 target.At the end of each study period, arterial blood gas
analysis was performed. EAdi and PDI parameters werecalculated from the digital recordings of EAdi curve onthe last 30 min of each step.
Fig. 1 Study protocol timeline. ABG arterial blood gas, Conventional O2 period of conventional low flow oxygen therapy through a non-occlusiveface mask, EAdi diaphragm electrical activity, HFNC1 first period of high flow nasal cannula oxygen therapy, HFNC2 second period of high flownasal cannula oxygen therapy
Di mussi et al. Critical Care (2018) 22:180 Page 3 of 11

Extubation success was defined as the ability of the pa-tient to breathe spontaneously without signs of respira-tory distress and without the requirement of rescuenoninvasive ventilation (NIV) for 48 h postextubation.Signs of respiratory distress were defined as: a) paradox-ical abdominal movement, use of accessory respiratorymuscles, or evidence of respiratory muscle fatigue; b)cardiovascular instability (systolic blood pressure (SBP) >160 or < 90 mmHg or a 20% change from the pre-SBTvalues; heart rate (HR) > 120 or < 60 beats/min or 20%change from the pre-SBT values; c) arterial desaturationwith SaO2 < 88%), hypercapnia, and respiratory acidosiswith pH < 7.35; and d) retention of secretions.
Statistical analysisThe power analysis indicated a sample size of 14 patientswith a power of 0.8, a significance level of 0.05 and anexpected effect size of 0.25. The effect size refers to themagnitude of variability in an outcome explained by theintervention divided by the total variability of the sameoutcome measure. We have hypothesized that the vari-ability explained by the study condition in EAdiPEAK hadto be at least 5% of total variability that correspondsapproximatively to a medium effect size of 0.25. Asphericity correction of 0.8 and a correlation of 0.8 were
assumed from pilot measurements. The sample size wasdetermined using the software GPower version 3.1.9.2.Continuous quantitative variables were summarized
as mean ± standard deviation (SD) if normally distributedor as median and interquartile range if non-normallydistributed. Comparisons were performed with analysis ofvariance (ANOVA) for repeated measures or Friedman’stest as appropriate. A p value < 0.05 was consideredstatistically significant, except in the multiple comparisonprocedure, when the p value was adjusted. The ana-lyses were carried out with SAS software v.9.4 forWindows PC.
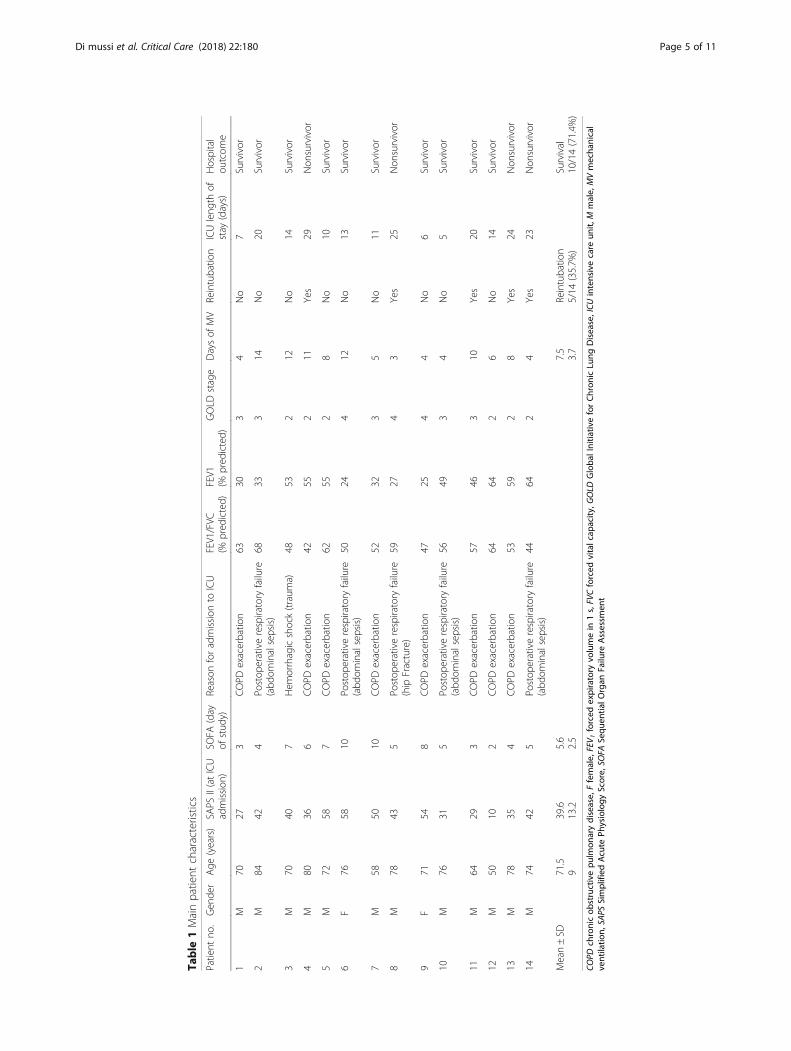
ResultsThe CONSORT diagram of our study (Fig. 2) shows that20 out of the 57 COPD patients admitted to our unit dur-ing the study period were eligible for the study and 16were enrolled. Two patients were excluded from the finalanalysis because of technical difficulties in recording theEAdi signal. Therefore, the final number of patients was14. Patient demographics and clinical characteristics areshown in Table 1.Five patients (31.5%) failed the initial extubation at-
tempt and were reintubated. Patients who required rein-tubation were similar to the ones who were successfully
Fig. 2 Flow diagram of patient enrollment. COPD chronic obstructive pulmonary disease, EAdi diaphragm electrical activity, NG nasogastric
Di mussi et al. Critical Care (2018) 22:180 Page 4 of 11
Table
1Mainpatient
characteristics
Patient
no.
Gen
der
Age
(years)
SAPS
II(atICU
admission
)SO
FA(day
ofstud
y)Reason
foradmission
toICU
FEV1/FVC
(%pred
icted)
FEV1
(%pred
icted)
GOLD
stage
Daysof
MV
Reintubatio
nICUleng
thof
stay
(days)
Hospital
outcom
e
1M
7027
3COPD
exacerbatio
n63
303
4No
7Survivor
2M
8442
4Po
stop
erativerespiratory
failure
(abd
ominalsepsis)
6833
314
No
20Survivor
3M
7040
7Hem
orrhagicshock(traum
a)48
532
12No
14Survivor
4M
8036
6COPD
exacerbatio
n42
552
11Yes
29Non
survivor
5M
7258
7COPD
exacerbatio
n62
552
8No
10Survivor
6F
7658
10Po
stop
erativerespiratory
failure
(abd
ominalsepsis)
5024
412
No
13Survivor
7M
5850
10COPD
exacerbatio
n52
323
5No
11Survivor
8M
7843
5Po
stop
erativerespiratory
failure
(hip
Fracture)
5927
43
Yes
25Non
survivor
9F
7154
8COPD
exacerbatio
n47
254
4No
6Survivor
10M
7631
5Po
stop
erativerespiratory
failure
(abd
ominalsepsis)
5649
34
No
5Survivor
11M
6429
3COPD
exacerbatio
n57
463
10Yes
20Survivor
12M
5010
2COPD
exacerbatio
n64
642
6No
14Survivor
13M
7835
4COPD
exacerbatio
n53
592
8Yes
24Non
survivor
14M
7442
5Po
stop
erativerespiratory
failure
(abd
ominalsepsis)
4464
24
Yes
23Non
survivor
Mean±SD
71.5
939.6
13.2
5.6
2.5
7.5
3.7
Reintubatio
n5/14
(35.7%
)Survival
10/14(71.4%
)
COPD
chronicob
structivepu
lmon
arydisease,
Ffemale,
FEV 1
forced
expiratory
volumein
1s,FVCforced
vitalcap
acity
,GOLD
Globa
lInitia
tiveforChron
icLu
ngDisease,ICU
intensivecare
unit,
Mmale,
MVmecha
nical
ventilatio
n,SA
PSSimplified
Acute
Physiology
Score,
SOFA
Sequ
entia
lOrgan
Failure
Assessm
ent
Di mussi et al. Critical Care (2018) 22:180 Page 5 of 11

extubated in terms of age, reason for ICU admission(COPD exacerbation vs other causes), days of mechan-ical ventilation, COPD severity (based on FEV1, FEV1/FVC ratio, GOLD stage, Simplified Acute PhysiologyScore (SAPS) II on admission, and Sequential OrganFailure Assessment (SOFA) score; Additional file 1).Four patients (25%) died after a mean (±SD) ICU
length of stay of 25.2 ± 2.6 days. The cause of death fortwo patients was septic shock and multiple organ failure,while the other two died of right cardiac failure and car-diogenic shock.
Breathing pattern and gas exchangeTable 2 shows the breathing pattern and gas exchangerecorded for each of the three experimental conditions. Toachieve the oxygenation target (SaO2 between 88 and 92%),the applied FiO2 during HFNC1 and HFNC2 periods was0.46 ± 0.1 and 0.46 ± 0.12, respectively (p= not significant),whereas during the conventional (mask) O2 period it was0.80 ± 0.19. However, a comparison between the FiO2 dur-ing HFNC and conventional O2 is not meaningful given thedifference in the delivered gas flow rates. Indeed, the FiO2
delivered during conventional O2 therapy is almost certainlyoverestimated since the patient’s inspiratory flow is higherthan the mask flow (10 L/min) and, therefore, the differencebetween patient inspiratory flow and the mask flow is pro-vided by room air. This also makes any comparison betweenthe PaO2/FiO2 in the different experimental conditionsinappropriate. Respiratory rate, TiNEUR, arterial PCO2, andpH remained similar throughout the study (Table 2).
Neuroventilatory drive and work of breathingFigure 3 shows EAdi traces obtained at the end of eachstudy period in three representative patients. In all pa-tients, the neuroventilatory drive, expressed by the EAdiwaveforms, clearly increased between HFNC1 and conven-tional O2 therapy and decreased again when the HFNCwas reinstituted (HFNC2). Table 3 shows that neuroventi-latory drive (EAdiPEAK) and work of breathing (PTPDI/band PTPDI/min) increased significantly while on conven-tional O2 therapy, and decreased again when HFNC wasreinstituted. Figure 4 shows the individual changes in theseparameters during the three study periods.We were not able to find any significant differences
between patients that were reintubated and patients suc-cessfully extubated in terms of EAdi parameters or workof breathing during each experimental condition(Additional file 2). For the same parameters, therewere no significant differences between patients admittedfor hypercapnic respiratory failure due to an exacerbationof COPD and patients with a background of COPD butwhose hypercapnic respiratory failure was due to otherprecipitating causes (Additional file 3).
DiscussionThis study shows that postextubation HFNC signifi-cantly decreases the neuroventilatory drive and work ofbreathing in patients with COPD who had receivedmechanical ventilation for hypercapnic respiratory fail-ure due to various etiologies.The EAdi reflects the rate of discharge of the phrenic
nerve and therefore it is a measure of the neuroventila-tory drive [17–20, 31, 32]. Thus, our data clearly showthat HFNC decreases the neuroventilatory drive (EAdi-PEAK and EAdiSLOPE) compared with conventional O2
therapy. Neuroventilatory drive and work of breathingare key factors for the weaning process and an excessiverespiratory drive predicts weaning failure [26, 32]. Infact, a high ventilatory drive may be associated eitherwith excessive mechanical load posed on the inspiratorymuscles, diaphragm weakness, or inappropriately highactivation of the respiratory centers due to pain, fever,anxiety, and acidosis [32]. In a mixed population of crit-ically ill patients, Liu and coworkers found that an EAdi-PEAK lower than 15–20 μV during a spontaneousbreathing trial (T-tube) was associated with weaningsuccess [26]. Similar results were recently obtained intwo other studies by Dres et al. [33] and Barwing et al.[34]. In our study, we found that the EAdiPEAK wasbelow this threshold in most of the patients during bothHFNC periods (Fig. 4), while it was on average 1.5-timeshigher than this threshold during conventional O2.Accordingly, considering that COPD patients are intrin-sically at risk of weaning failure [35], our results arepotentially clinically relevant.
Table 2 Breathing pattern and gas exchange in differentexperimental conditions
HFNC1 Conventional O2 HFNC2
RR (breaths/min) 20.5 ± 2.9 21.4 ± 4 20.0 ± 1.9
TiNEUR (s) 0.92 ± 0.21 0.95 ± 0.22 0.92 ± 0.17
pH 7.45 ± 0.07 7.44 ± 0.08 7.46 ± 0.08
PaCO2 (mmHg) 49.9 ± 11.9 51.8 ± 12.7 50.1 ± 12.6
HCO3− (mEq/L) 30.9 ± 7.6 31.3 ± 7.8 31.4 ± 8.4
PaO2 (mmHg) 75.1 ± 6.9 72.9 ± 8.6 81.2 ± 8
Applied FiO2a 0.46 ± 10 0.80 ± 0.19b,c 0.46 ± 0.12
Data are expressed as mean ± standard deviationConventional O2 conventional low flow oxygen therapy through a nonocclusiveface mask, FiO2 inspiratory oxygen fraction, HFNC high-flow nasal cannula oxygentherapy, PaCO2 arterial partial carbon dioxide pressure, PaO2 arterial partialoxygen pressure, RR respiratory rate, TiNEUR neural inspiratory timea The FiO2 delivered during conventional O2 therapy is overestimated sincethe patient’s inspiratory flow was higher than the mask flow (10 L/min) and,therefore, the difference between patient inspiratory flow and mask flow wastaken by room air; this makes inappropriate any comparison between thePaO2/FiO2 ratio in the different experimental conditionsb Different from HFNC1, ANOVA, with Bonferroni correctionc Different from HFNC2, ANOVA, with Bonferroni correction
Di mussi et al. Critical Care (2018) 22:180 Page 6 of 11

Although the work of breathing is proportional to theneuroventilatory drive, its absolute value depends on theability of the respiratory muscles to convert the electricalstimuli into mechanical contraction (electromechanicalcoupling) [18, 32]. We measured the work of breathingin terms of PTPDI per breath and per minute, a
well-known index of respiratory muscle oxygen con-sumption (Table 3 and Fig. 4). According to physio-logical studies in mixed populations of critically illpatients, an ‘acceptable’ PTPDI/min is between 50 and150 cmH2O/s/min [36, 37]. The PTPDI/min was in thisrange in 64.3% of our patients (i.e., 9/14) both duringHFNC1 and HFNC2 periods, whereas the PTPDI/min wasabove this acceptable range in 78.6% of patients duringthe conventional O2 period (i.e., 11/14) (Fig. 3).According to the 2017 European Respiratory Society–
American Thoracic Society (ERS/ATS) guidelines [38],COPD patients benefit from noninvasive ventilation toprevent reintubation. Therefore, it would have been ofinterest to compare the physiological effects of HFNC andNIV in our patients. However, at the time of the study,postextubation preventative NIV was not applied on aroutine basis in our institution. Interestingly, a recentstudy by Hernandez et al. showed that HFNC is noninfer-ior to NIV in preventing acute postextubation respiratoryfailure in patients at “high risk” of postextubation respira-tory failure, including patients older than 65 years or thosewith heart failure, moderate to severe COPD, an AcutePhysiology and Chronic Health Evaluation (APACHE) II
Table 3 Neuroventilatory drive and work of breathingparameters
HFNC1 Conventional O2 HFNC2
EAdiPEAK (μV) 15.4 ± 6.4 23.6 ± 10.5a,b 15.2 ± 6.4
EAdiPTP (μV/s) 13.7 ± 6.5 21.1 ± 11.8a,b 12.1 ± 5.2
EAdiSLOPE 18.6 ± 6.5 24 ± 14.7a,b 17.6 ± 10.2
PTPDI/b (cmH2O/s) 6.7 ± 2.7 9.9 ± 3.1a,b 6.7 ± 2.8
PTPDI/min (cmH2O/s/min) 135 ± 60 211 ± 70a,b 132 ± 56
Data are expressed as mean ± standard deviationConventional O2 conventional low flow oxygen therapy through anonocclusive face mask, EAdiPEAK diaphragm electrical activity peak, EAdiPTPEAdi deflection inspiratory area, EAdiSLOPE EAdi slope from the beginning ofinspiration to EAdiPEAK, HFNC high-flow nasal cannula oxygen therapy, PTPDI/binspiratory trans-diaphragmatic pressure-time product per breath, PTPDI/min
inspiratory trans-diaphragmatic pressure-time product per minutea Different from HFNC1, ANOVA, with Bonferroni correctionb Different from HFNC2, ANOVA, with Bonferroni correction
Fig. 3 Experimental record showing the diaphragm electrical activity (EAdi) in the three experimental conditions in three representative patients.Conventional O2 period of conventional low flow oxygen therapy through a non-occlusive face mask, HFNC1 first period of high flow nasalcannula oxygen therapy, HFNC2 second period of high flow nasal cannula oxygen therapy
Di mussi et al. Critical Care (2018) 22:180 Page 7 of 11

score higher than 12 on extubation day, a body mass indexof more than 30, those with airway patency problems, and,finally, patients with difficult or prolonged weaning [11].Further studies are needed to assess the beneficial mech-
anisms of HFNC in COPD patients. We speculate that twomechanisms are of particular relevance: a) the HFNC“PEEP” effect [14], that may have counterbalanced theflow-limited intrinsic positive end-expiratory pressure
(PEEPi), and b) the “CO2 wash-out” effect of the anatom-ical dead space [5] that may have decreased the diaphrag-matic workload. The better preservation of the mucociliaryfunction as compared with conventional O2 therapy mayhave been an adjunctive mechanism [3], but we believethat it was less important since the cross-over periods wererelatively short.In hypoxemic patients, Mauri et al. [39] and Maggiore
et al. [10] found that HFNC significantly decreased RRcompared with conventional O2 therapy. Mauri esti-mated the VT through electrical impedance tomography(EIT) and found that it remained stable. In contrast, inour COPD patients, the RR remained unchanged (Table 2),while we have no data on VT since patients were breathingspontaneously and we wanted to avoid any modification inbreathing pattern caused by the measurement apparatus.However, the VT likely increased since animal studiesshow that VT is proportional to the electrical activity ofthe diaphragm during unassisted spontaneous breathing[40]. Based on this hypothesis, in our patients, the responseto HFNC removal during the conventional O2 periodwould have been similar to the physiological response to asudden increase in respiratory workload during to CO2
rebreathing, i.e., to maintain the RR as constant and toincrease the VT [41, 42]. The different impact of HFNC onRR between our study and those of Mauri and Maggiorecould be explained by the different background of the re-spiratory failure of the studied patients (hypoxemic versushypercapnic).In our study, similar to previous studies [13], we used a
standard, nonocclusive oxygen facial mask with a fixed gasflow of 10 L/min in all the patients during the conventionalO2 study step (see the Methods section). Hence, in our pa-tients the peak inspiratory flow was very likely greater thanthe mask gas flow and therefore the true fraction of inhaledoxygen was lower than the one provided by the mask. The“Venturi Mask” is a high-flow oxygen delivery system thatprovides 35–45 L/min of a mixture of oxygen and air witha delivered FiO2 of 0.24–0.6 by taking advantage of the Ber-noulli principle [43]. By using a Venturi Mask instead of thestandard mask, it is possible that we would have bettermatched the patient’s inspiratory flow during the conven-tional O2 study period. One could also speculate that ahigher mask flow could have other effects in terms of CO2
washout from the mask or from the airways, but we are notaware of studies comparing Venturi mask and HFNC.We must acknowledge some study limitations. First, we
studied a population of patients with COPD that was ad-mitted to the ICU with hypercapnic ventilatory failure dueto various etiologies (Table 1). Only 8/14 (57%) of COPDpatients were admitted because of a COPD exacerbation,while the other 6 (43%) received mechanical ventilationfor postoperative ventilatory failure. In this regard, ourpopulation could be deemed as heterogenous. However,
Fig. 4 Trend of the neuroventilatory drive, as expressed by thediaphragm electrical activity peak EAdiPEAK, and of work ofbreathing, as expressed by the inspiratory PDI pressure-time productper breath (PTPDI/b) and per minute (PTPDI/min). *Significantdifference compared to the HFNC1 period (ANOVA with Bonferronicorrection); §Significant difference compared to the HFNC2 period(ANOVA with Bonferroni correction). Conventional O2 period ofconventional low flow oxygen therapy through a non-occlusive facemask, HFNC1 first period of high flow nasal cannula oxygen therapy,HFNC2 second period of high flow nasal cannula oxygen therapy
Di mussi et al. Critical Care (2018) 22:180 Page 8 of 11

we point out that: 1) our study was conducted in the post-extubation phase when the primary reason for the acuterespiratory failure had resolved or at least improved (seeMethods); and 2) all our patients had moderate to very se-vere COPD according to the GOLD classification. Second,we were not able to measure several respiratory parame-ters during spontaneous breathing (VT, PEEPi, inspiratoryflow) that could have provided us with a more completeinterpretation of the treatment effect. However, our studywas conducted in spontaneously breathing patients andwe sought to avoid any modification in breathing patterncaused by the measurement apparatus. Third, we mea-sured the work of breathing based on a method recentlyvalidated by Bellani and coworkers [21], but the correl-ation between work of breathing and EAdi may be mis-leading if the contraction of the accessory inspiratorymuscles is dominant compared with the diaphragmaticcontraction. Indeed, the estimation of work of breathingfrom EAdi assumes that the diaphragm contributes ap-proximately 75% to the overall WOB (as occurs in normalconditions) [23]. However, we assessed all patients forsigns of paradoxical abdominal motion and use ofaccessory inspiratory muscles throughout the study. Inaddition, the method described by Bellani et al. assumes alinear relationship between EAdi and PDI at different lungvolumes based on a close correlation at different lungvolumes between the PDI obtained from the esophagealpressure and the PDI obtained through the formulaEAdi × NME [21]. However, Bellani et al. studied pa-tients ventilated with different levels of pressure sup-port ventilation (PSV) and neurally adjusted ventilatoryassist (NAVA) while we studied spontaneously breath-ing patients. Of note, other authors showed a nonline-arity between diaphragmatic efficiency and lungvolumes, but only for intense diaphragmatic contrac-tions [19]. Fourth, we studied a small patient numberthat, while appropriate for a physiologically orientedstudy, weakens any speculation on the clinical out-comes (e.g., ICU and hospital length of stay and reintu-bation rate).
ConclusionsIn conclusion, we found that HFNC, as compared withconventional O2 therapy, significantly decreases the neu-roventilatory drive and the work of breathing in patientswith COPD recovering from an episode of acute respira-tory failure after a planned extubation.
Additional files
Additional file 1: Independent sample t tests. Comparison betweenpatients who required reintubation and patients who were successfullyextubated in terms of age, reason for ICU admission (COPD exacerbationversus other causes), days of mechanical ventilation, COPD severity
(based on FEV1, FEV1/FVC ratio, GOLD stage, SAPS II on admission, andSOFA score). (DOCX 26 kb)
Additional file 2: Independent sample t tests. Comparison betweenpatients who required reintubation and patients who were successfullyextubated in terms of EAdi parameters or work of breathing during eachexperimental condition. (DOCX 42 kb)
Additional file 3: Independent sample t tests. Comparison betweenpatients admitted for hypercapnic respiratory failure due to anexacerbation of COPD and patients with a background of COPD butwhose hypercapnic respiratory failure was due to other precipitatingcauses in terms of EAdi parameters or work of breathing during eachexperimental condition. (DOCX 60 kb)
AbbreviationsCOPD: Chronic obstructive pulmonary disease; EAdi: Electric activity of thediaphragm; FEV1: Forced expiratory volume in 1 s; FiO2: Inspiratory oxygenfraction; FVC: Forced vital capacity; GOLD: Global Initiative for Chronic LungDisease; HFNC: High-flow nasal cannula oxygen therapy; ICU: Intensive careunit; NIV: Noninvasive ventilation; NME: Neuromuscular efficiency;PAO: Pressure airway opening; PEEP: Positive end-expiratory pressure;PEEPi: Intrinsic positive end-expiratory pressure; PTPDI/b: Pressure-timeproduct per breath; PTPDI/min: Pressure-time product per minute;RR: Respiratory rate; SaO2: Arterial hemoglobin oxygen saturation;SBP: Systolic blood pressure; SBT: Spontaneous breathing trial; TiNEUR: Neuralinspiratory time; VT: Tidal volume; WOB: Work of breathing
AcknowledgementsWe would like to thank Dr. Joanna Brown for reviewing the final manuscript.
FundingNo specific funding was received for this study.
Availability of data and materialsThe data that support the findings of this study are available from thecorresponding author upon reasonable request.
Authors’ contributionsSG, RDm, and SS contributed to the design of the conception and design ofthe study. RDm, SS, TS, and PP were responsible for patient screening andenrollment. PT performed the statistical analysis. SG, CAV, FB, LC, and FSanalyzed the data and wrote the manuscript. All authors contributed tointerpretation of the data. All authors read and approved the finalmanuscript.
Ethics approval and consent to participateEthical approval was obtained by the local ethics committee (AziendaOspedaliero-Universitaria Policlinico di Bari Ethic Committee, protocol num-ber: 885/C.E., May 2014). All patients or their relatives provided informed con-sent to participate.
Consent for publicationNot applicable.
Competing interestsSG has given talks in symposia organized by Getinge Critical Care (SolnaSweden), Estor Critical Care (Mirandola, Italy), and Fisher and Paykel(Auckland, New Zealand), and has received compensation for related traveland accommodation fees. He declares no other relationship or activities thatcould appear to have influence the submitted work. The remaining authorsdeclare that they have no competing interests.
Publisher’s NoteSpringer Nature remains neutral with regard to jurisdictional claims inpublished maps and institutional affiliations.
Author details1Dipartimento dell’Emergenza e Trapianti d’Organo (DETO), Sezione diAnestesiologia e Rianimazione, Ospedale Policlinico, Università degli Studi diBari “Aldo Moro”, Piazza Giulio Cesare 11, Bari, Italy. 2Dipartimento di
Di mussi et al. Critical Care (2018) 22:180 Page 9 of 11

Morfologia, Chirurgia e Medicina Sperimentale, Sezione di Anestesiologia eTerapia Intensiva Universitaria, Università degli studi di Ferrara, Ferrara, Italy.3Dipartimento di Scienze Biomediche ed Oncologia Umana, Cattedra diStatistica Medica, Università degli Studi Aldo Moro, Bari, Italy. 4Dipartimentodi Medicina Respiratoria e del Sonno, Università degli Studi di Bari “AldoMoro”, Bari, Italy. 5Dipartimento dell’Emergenza e Trapianti d’Organo (DETO),Sezione di Chirurgia Veterinaria, Università degli Studi di Bari “Aldo Moro”,Bari, Italy. 6Department of Adult Critical Care, Guy’s and St Thomas’ NHSFoundation Trust, King’s Health Partners, and Division of Centre of HumanApplied Physiological Sciences, King’s College London, London, UK.
Received: 6 April 2018 Accepted: 22 June 2018
References1. Papazian L, Corley A, Hess D, Fraser JF, Frat JP, Guitton C, Jaber S, Maggiore
SM, Nava S, Rello J, et al. Use of high-flow nasal cannula oxygenation in ICUadults: a narrative review. Intensive Care Med. 2016;42(9):1336–49.
2. Sztrymf B, Messika J, Bertrand F, Hurel D, Leon R, Dreyfuss D, Ricard JD.Beneficial effects of humidified high flow nasal oxygen in critical carepatients: a prospective pilot study. Intensive Care Med. 2011;37(11):1780–6.
3. Spoletini G, Alotaibi M, Blasi F, Hill NS. Heated humidified high-flow nasaloxygen in adults: mechanisms of action and clinical implications. Chest.2015;148(1):253–61.
4. Parke RL, McGuinness SP. Pressures delivered by nasal high flow oxygenduring all phases of the respiratory cycle. Respir Care. 2013;58(10):1621–4.
5. Moller W, Feng S, Domanski U, Franke KJ, Celik G, Bartenstein P, Becker S,Meyer G, Schmid O, Eickelberg O, et al. Nasal high flow reduces dead space.J Appl Physiol (1985). 2017;122(1):191–7.
6. Goligher EC, Slutsky AS. Not just oxygen? Mechanisms of benefit from high-flow nasal cannula in hypoxemic respiratory failure. Am J Respir Crit CareMed. 2017;195(9):1128–31.
7. Messika J, Ben Ahmed K, Gaudry S, Miguel-Montanes R, Rafat C, Sztrymf B,Dreyfuss D, Ricard JD. Use of high-flow nasal cannula oxygen therapy insubjects with ARDS: a 1-year observational study. Respir Care. 2015;60(2):162–9.
8. Nagata K, Morimoto T, Fujimoto D, Otoshi T, Nakagawa A, Otsuka K, Seo R,Atsumi T, Tomii K. Efficacy of high-flow nasal cannula therapy in acutehypoxemic respiratory failure: decreased use of mechanical ventilation.Respir Care. 2015;60(10):1390–6.
9. Frat JP, Thille AW, Mercat A, Girault C, Ragot S, Perbet S, Prat G, Boulain T,Morawiec E, Cottereau A, et al. High-flow oxygen through nasal cannula inacute hypoxemic respiratory failure. N Engl J Med. 2015;372(23):2185–96.
10. Maggiore SM, Idone FA, Vaschetto R, Festa R, Cataldo A, Antonicelli F, MontiniL, De Gaetano A, Navalesi P, Antonelli M. Nasal high-flow versus Venturi maskoxygen therapy after extubation. Effects on oxygenation, comfort, and clinicaloutcome. Am J Respir Crit Care Med. 2014;190(3):282–8.
11. Hernandez G, Vaquero C, Colinas L, Cuena R, Gonzalez P, Canabal A,Sanchez S, Rodriguez ML, Villasclaras A, Fernandez R. Effect ofpostextubation high-flow nasal cannula vs noninvasive ventilation onreintubation and postextubation respiratory failure in high-risk patients: arandomized clinical trial. JAMA. 2016;316(15):1565–74.
12. Hernandez G, Vaquero C, Gonzalez P, Subira C, Frutos-Vivar F, Rialp G,Laborda C, Colinas L, Cuena R, Fernandez R. Effect of postextubation high-flow nasal cannula vs conventional oxygen therapy on reintubation in low-risk patients: a randomized clinical trial. JAMA. 2016;315(13):1354–61.
13. Mauri T, Turrini C, Eronia N, Grasselli G, Volta CA, Bellani G, Pesenti A.Physiologic effects of high-flow nasal cannula in acute hypoxemicrespiratory failure. Am J Respir Crit Care Med. 2017;195(9):1207–15.
14. Fraser JF, Spooner AJ, Dunster KR, Anstey CM, Corley A. Nasal high flowoxygen therapy in patients with COPD reduces respiratory rate and tissuecarbon dioxide while increasing tidal and end-expiratory lung volumes: arandomised crossover trial. Thorax. 2016;71(8):759–61.
15. Pisani L, Fasano L, Corcione N, Comellini V, Musti MA, Brandao M, BottoneD, Calderini E, Navalesi P, Nava S. Change in pulmonary mechanics and theeffect on breathing pattern of high flow oxygen therapy in stablehypercapnic COPD. Thorax. 2017;72(4):373–5.
16. Pisani L, Vega ML. Use of nasal high flow in stable COPD: rationale andphysiology. COPD. 2017;14(3):346–50.
17. Sinderby C, Navalesi P, Beck J, Skrobik Y, Comtois N, Friberg S, Gottfried SB,Lindstrom L. Neural control of mechanical ventilation in respiratory failure.Nat Med. 1999;5(12):1433–6.
18. Doorduin J, van Hees HW, van der Hoeven JG, Heunks LM. Monitoring of therespiratory muscles in the critically ill. Am J Respir Crit Care Med. 2013;187(1):20–7.
19. Beck J, Sinderby C, Lindstrom L, Grassino A. Effects of lung volume ondiaphragm EMG signal strength during voluntary contractions. J ApplPhysiol (1985). 1998;85(3):1123–34.
20. Beck J, Sinderby C, Lindstrom L, Grassino A. Influence of bipolar esophagealelectrode positioning on measurements of human crural diaphragmelectromyogram. J Appl Physiol (1985). 1996;81(3):1434–49.
21. Bellani G, Mauri T, Coppadoro A, Grasselli G, Patroniti N, Spadaro S, Sala V,Foti G, Pesenti A. Estimation of patient's inspiratory effort from the electricalactivity of the diaphragm. Crit Care Med. 2013;41(6):1483–91.
22. Sessler CN, Gosnell MS, Grap MJ, Brophy GM, O'Neal PV, Keane KA, TesoroEP, Elswick RK. The Richmond agitation-sedation scale: validity and reliabilityin adult intensive care unit patients. Am J Respir Crit Care Med. 2002;166(10):1338–44.
23. Tobin MJ. Respiratory monitoring in the intensive care unit. Am Rev RespirDis. 1988;138(6):1625–42.
24. Barwing J, Ambold M, Linden N, Quintel M, Moerer O. Evaluation of thecatheter positioning for neurally adjusted ventilatory assist. Intensive CareMed. 2009;35(10):1809–14.
25. Di Mussi R, Spadaro S, Mirabella L, Volta CA, Serio G, Staffieri F,Dambrosio M, Cinnella G, Bruno F, Grasso S. Impact of prolongedassisted ventilation on diaphragmatic efficiency: NAVA versus PSV. CritCare. 2016;20(1):1.
26. Liu L, Liu H, Yang Y, Huang Y, Liu S, Beck J, Slutsky AS, Sinderby C, Qiu H.Neuroventilatory efficiency and extubation readiness in critically ill patients.Crit Care. 2012;16(4):R143.
27. Schmidt M, Kindler F, Cecchini J, Poitou T, Morawiec E, Persichini R,Similowski T, Demoule A. Neurally adjusted ventilatory assist andproportional assist ventilation both improve patient-ventilator interaction.Crit Care. 2015;19:56.
28. Hedenstierna G. Esophageal pressure: benefit and limitations. MinervaAnestesiol. 2012;78(8):959–66.
29. Baydur A, Behrakis PK, Zin WA, Jaeger M, Milic-Emili J. A simple method forassessing the validity of the esophageal balloon technique. Am Rev RespirDis. 1982;126(5):788–91.
30. Mauri T, Alban L, Turrini C, Cambiaghi B, Carlesso E, Taccone P, Bottino N,Lissoni A, Spadaro S, Volta CA, et al. Optimum support by high-flow nasalcannula in acute hypoxemic respiratory failure: effects of increasing flowrates. Intensive Care Med. 2017;43(10):1453–63.
31. Beck J, Gottfried SB, Navalesi P, Skrobik Y, Comtois N, Rossini M, Sinderby C.Electrical activity of the diaphragm during pressure support ventilation inacute respiratory failure. Am J Respir Crit Care Med. 2001;164(3):419–24.
32. Telias I, Brochard L, Goligher EC. Is my patient’s respiratory drive (too) high?Intensive Care Med. 2018;
33. Dres M, Schmidt M, Ferre A, Mayaux J, Similowski T, Demoule A. Diaphragmelectromyographic activity as a predictor of weaning failure. Intensive CareMed. 2012;38(12):2017–25.
34. Barwing J, Pedroni C, Olgemoller U, Quintel M, Moerer O. Electrical activityof the diaphragm (EAdi) as a monitoring parameter in difficult weaningfrom respirator: a pilot study. Crit Care. 2013;17(4):R182.
35. Thille AW, Harrois A, Schortgen F, Brun-Buisson C, Brochard L. Outcomes ofextubation failure in medical intensive care unit patients. Crit Care Med.2011;39(12):2612–8.
36. Sassoon CS, Light RW, Lodia R, Sieck GC, Mahutte CK. Pressure-time productduring continuous positive airway pressure, pressure support ventilation,and T-piece during weaning from mechanical ventilation. Am Rev RespirDis. 1991;143(3):469–75.
37. Mancebo J, Isabey D, Lorino H, Lofaso F, Lemaire F, Brochard L. Comparativeeffects of pressure support ventilation and intermittent positive pressure breathing(IPPB) in non-intubated healthy subjects. Eur Respir J. 1995;8(11):1901–9.
38. Rochwerg B, Brochard L, Elliott MW, Hess D, Hill NS, Nava S, Navalesi P,Antonelli M, Brozek J, Conti G, et al. Official ERS/ATS clinical practiceguidelines: noninvasive ventilation for acute respiratory failure. Eur Respir J.2017;50(2):1602426-46.
39. Mauri T, Langer T, Zanella A, Grasselli G, Pesenti A. Extremely hightranspulmonary pressure in a spontaneously breathing patient with earlysevere ARDS on ECMO. Intensive Care Med. 2016;42(12):2101–3.
40. Lourenco RV, Cherniack NS, Malm JR, Fishman AP. Nervous output fromthe respiratory center during obstructed breathing. J Appl Physiol. 1966;21(2):527–33.
Di mussi et al. Critical Care (2018) 22:180 Page 10 of 11
41. Yan S, Lichros I, Zakynthinos S, Macklem PT. Effect of diaphragmatic fatigueon control of respiratory muscles and ventilation during CO2 rebreathing. JAppl Physiol (1985). 1993;75(3):1364–70.
42. Bradley GW, von Euler C, Marttila I, Roos B. Steady state effects of CO2and temperature on the relationship between lung volume andinspiratory duration (Hering-Breuer threshold curve). Acta Physiol Scand.1974;92(3):351–63.
43. Bateman NT, Leach RM. ABC of oxygen. Acute oxygen therapy. BMJ. 1998;317(7161):798–801.
Di mussi et al. Critical Care (2018) 22:180 Page 11 of 11