
High Energy Density Physics Research at Sandia National Laboratories
54
High Energy Density Physics Research at Sandia National Laboratories Ramon J. Leeper representing the Pulsed Power Sciences Center Sandia National Laboratories Albuquerque, New Mexico April 27, 2012
Transcript of High Energy Density Physics Research at Sandia National Laboratories

High Energy Density Physics Research at
Sandia National Laboratories
Ramon J. Leeper
representing the Pulsed Power Sciences Center
Sandia National Laboratories
Albuquerque, New Mexico
April 27, 2012

Sandia National Laboratories is one of three
Department of Energy’s NNSA laboratories
• Sandia National Laboratories is a government
owned/contractor operated (GOCO) facility operated by
Lockheed Martin Corporation as a set of multi-program
laboratories for the U.S. National Nuclear Security
Administration (NNSA)
• Sandia currently has 8980 employees and a operating budget
of approximately $2.5 billion
• Major locations include Albuquerque, New Mexico (~ 8055
employees) and Livermore, California (~925 employees)
• Sandia’s precursor was Los Alamos National Laboratory’s Z
Division created in 1945 as part of the Manhattan Project
• Sandia separated from Los Alamos in 1949 and ATT took over
its initial operation at the direct request of President Truman

• Sandia leads the national effort in pulsed power HEDP and ICF research
• Sandia operates the Z and Z-Beamlet facilities for the national program
• Since 1995, the Sandia program has participated and contributed to the NIF
diagnostic effort in the areas of x-ray and nuclear diagnostics
• Sandia is now actively engaged in the NIC physics efforts in the areas of
ablator physics, shock timing, and neutron measurements
• For over a decade we have had an active collaboration with MIT in the
development and calibration of nuclear diagnostics
• The Sandia program is now actively developing a fundamental science user
program on the Z and Z-Beamlet facilities that has resulted in active
collaborations with the CEA, Cornell University, Imperial College, LANL, LLNL,
Swarthmore College, University of Michigan, University of Nevada-Reno,
University of New Mexico, University of Texas-Austin, and the Weizmann
Institute
• The Sandia HEDP and ICF program employs approximately 155 technologists
and technical staff plus another 80 contractors
Sandia broadly contributes to the national HEDP
and ICF programs in a number of important areas

MIT/SNL collaboration in action at the MIT
Cockcroft-Walton

Z-pinches
ICE &
flyers
Copyright 2001 Contemporary Physics Education Project
Regimes of high energy density are typically
associated with energy density 105 J/cm3 = 1 Mbar

Z has a unique role as one of the three major US facilities
for High Energy Density Physics (HEDP) experiments
OMEGA
Refurbished Z (2007)
After 40 years of research, the components of
simulations, drivers, diagnostics, and targets
are in place to test ignition concepts
NIF (2009)
OMEGA EP
(2008)
(1.8 MJ @ 0.35 mm)
(30 kJ @
0.35 mm)
(3 MJ)
(Two PW &
two ns beams)
33 m

“Z” is the world’s largest pulsed power facility

The “Z” pulsed power facility is located at Sandia
National Laboratories in Albuquerque, New Mexico

Z compresses electrical energy to produce short
bursts of high power.
Goal: “Take the equivalent energy required to operate a TV for a few
hours (1-2 MJ) and compress it into more electrical power than
provided by all the power plants in the world combined (~15 TW)”
…S T Pai & Qi Zhang, “Introduction to High Power Pulse Technology,”
World Scientific Publishing Co., Singapore, 1995.
Energy Store Pulse
Forming
Pulse
Transmission
Load Target Fast
Switch
Slow
Switch
Low Electrical Power
Up to 107 J – 106 W
High Electrical Power
Up to 107 J – 1014 W

We use pulsed power drivers to create and
study matter at high energy densities
Z-pinch x-ray source
High Current
Magnetic pressure
Current
B-Field
JxB Force
wire array
Fusion
J x x x x x x B
Radiation Science Material Properties

A series of capacitors, transmission lines and switches achieves temporal and spatial compression on Z
Marx generators
Pulse Forming Line Vacuum Stack and
MITL’s
Water Switches
Intermediate Store Capacitor Load

Marx
generator
insulator
stack
laser-
triggered
gas switch magnetically
insulated
transmission
lines
The Refurbished Z Machine has more energy
and more pulse shape flexibility
22 MJ stored energy (up from 11 MJ)
~26 MA peak current (~18MA)
~100-600 ns rise time
Experiment

Z Facility Overview
100TW
PW

The Z-Beamlet and Z-Petawatt laser backlighters provide
a powerful new capability for diagnosing Z experiments
Z-Beamlet and Z-Petawatt
lasers
Z facility laser building
imploding z-pinch
imploding capsule
2 mm
2 mm

We use pulsed power drivers to create and
study matter at high energy densities
Z-pinch x-ray source
High Current
Magnetic pressure
Current
B-Field
JxB Force
wire array
Fusion
J x x x x x x B
Radiation Science Material Properties

Isentropic compression and shock wave
experiments are both possible on Z
C L C L
Isentropic Compression Experiments:
gradual pressure rise in sample
Shock Hugoniot Experiments:
shock wave in sample on impact
Sample Sample
Flyer Plate
P > 10 Mbar P > 4 Mbar
v up to 40 km/s

principal isentrope (isentropic
compression dS = 0)
principal Hugoniot
(shock impact)
STP
Magnetic pressure can be used to examine fundamental
material properties at HEDP conditions
room-temperature isotherm: diamond anvil cell (DAC) technique

Deuterium experiments demonstrated the capabilities
of Z as a platform for accurate EOS measurements
Impacts ICF, primary physics, planetary models
Density Compression
3 4 5 6 7
Pre
ssure
(GP
a) 0
50
100
150
200
250Kerley 71
Ross
Van Theil
Dick
Nellis
Density Compression
3 4 5 6 7
Pre
ssure
(GP
a) 0
50
100
150
200
250Kerley 71
Ross
Van Theil
Dick
Nellis
NOVA
Density Compression
3 4 5 6 7
Pre
ssure
(GP
a) 0
50
100
150
200
250Kerley 71
Ross
Van Theil
Dick
Nellis
NOVA
Z
Density Compression
3 4 5 6 7
Pre
ssure
(GP
a) 0
50
100
150
200
250Kerley 71
Ross
Van Theil
Dick
Nellis
NOVA
Z
Sandia DFT
100 GPa = 1 Mbar
Pre
ssu
re (
Gp
a)

kinetic and magnetic energy
internal energy
x rays
Magnetically-driven fast Z-pinch implosions
efficiently convert electrical energy into radiation
Current
B-Field
JxB Force
Stagnation Implosion Ablation
electrical energy
kinetic energy Fast wire z-pinch
loads:
• Z-pinches are
imploded in 60 to
120 ns
• Energy: x-ray ≈
15% of stored
electrical
• Power: x-ray ≈ 2-5 x
electrical

J
B JxB
z-pinch sources
ni ~ 1 - 5 x 1020 cm-3, Yrad ~ 1 - 2 MJ
Prad ~ 100-250 TW ~ 200 million million Watts
Trad ~ 200 eV ~ 2,300,000 °K
J x B force pinches wire array into a dense,
radiating plasma column

Z dynamic hohlraums are used to make opacity
measurements for comparison with models
Foil is heated during
the DH implosion
Foil is backlit
at stagnation
Data
Model
Fe transmission @ Te = 156 eV
l

exterior observations
+
interior plasma property models
= understanding
model reliability requires laboratory
experiments
“… the deep interior of the sun and stars is
less accessible to scientific investigation than
any other region of the universe….What
appliance can pierce through the outer layers
of a star and test the conditions within? ”
A.S. Eddington The internal constitution of the
stars
Cambridge, 1926

Z experiments test opacity models that are crucial
for stellar interior physics
core
zone radiative
convective zone
2007 Don Dixon / cosmographica.com
Predictions of solar structure do not agree with observations Solar structure depends on opacities that have never been measured Challenge: create and diagnose stellar interior conditions on earth High T enables first studies of transitions important in stellar interiors
Solar CZ boundary
193 eV, 1 x 1023 cm-3

Opacity measurements on Z are close to
replicating solar interior matter
He-g
He-d
Mg K-shell absorption from a Mg/Fe foil
He-b
Ly-a He-g
He-a
Z
ZR
Line Widths
• Higher Ly/He ratios indicate ~20% increase in Te
~190 eV
• Broader high-n lines indicate thicker tamper led to
~300% increase in ne
This is much closer to Fe conditions in the Sun
tamper
(CH)
radiation
source
FeMg
sample
spectrometer
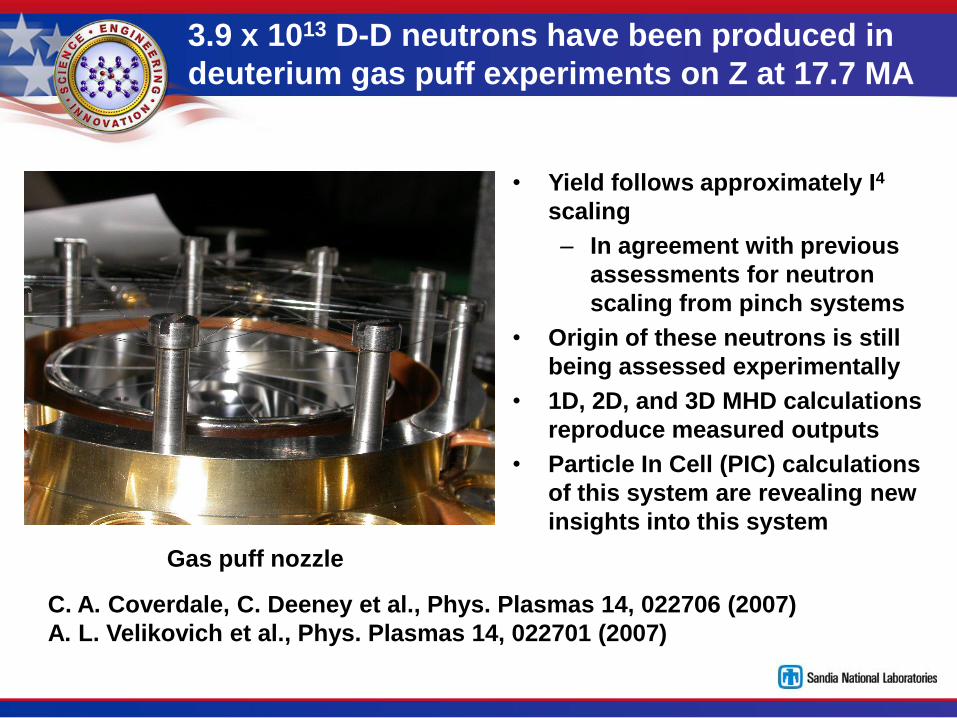
3.9 x 10¹³ D-D neutrons have been produced in
deuterium gas puff experiments on Z at 17.7 MA
Gas puff nozzle
• Yield follows approximately I4
scaling
– In agreement with previous
assessments for neutron
scaling from pinch systems
• Origin of these neutrons is still
being assessed experimentally
• 1D, 2D, and 3D MHD calculations
reproduce measured outputs
• Particle In Cell (PIC) calculations
of this system are revealing new
insights into this system
C. A. Coverdale, C. Deeney et al., Phys. Plasmas 14, 022706 (2007)
A. L. Velikovich et al., Phys. Plasmas 14, 022701 (2007)

PIC calculations provide insight to the 50 year old issue
of the neutron production mechanism in Z-pinch plasmas
• Neutron production scaling as I4 is quite promising*
• Deuterium Z-pinch systems have been examined experimentally for many years
– Significant neutron production is observed
– Early conclusions had been that the majority of neutron yield is from non-thermal deuterium population that does not scale favorably
• Fully kinetic electromagnetic modeling is now possible that includes both nonthermal and thermal processes to address this fundamental issue
• Recent PIC calculations of this fundamental plasma system are providing new understanding in how neutrons are produced in pinched plasma systems
• Recent Publications:
D. R. Welch et al., Phys. Rev. Lett. 103, 255002 (2009)
D. R. Welch et al., Phys. Plasmas 17, 072702 (2010)
D. R. Welch et al., Phys. Plasmas 18, 056303 (2011)
*J. Ise, Jr. and R. V. Pyle, in Conference on Controlled Thermonuclear Reactions,
Princeton Univ., 17-20 October 1955 (TID-7503, USAEC, 1955), p.218; Velikovich, et al.
Phys. of Plasmas 14 022701 (2007).

• PIC follows macroparticles with each representing many real
ones
– Particle currents J (or charges ) are interpolated to a grid
– Maxwell’s (or Poisson’s) equations are advanced on the grid
using J or
– The electric E and magnetic B fields are interpolated to
particles
– The particle momentum p and position x are advanced with
new E and B
Particle currents, n, v, interpolated to grid; fields back to particles
E B EM Fields, pressure, etc. calculated on grid
Particle-in-cell (PIC) modeling is a natural
way to describe Z-pinch plasmas
D. R. Welch, D. V. Rose, W. A. Stygar, and R. J. Leeper, “Electromagnetic Kinetic
Simulations of a Deuterium Gas Puff Z-pinch”, 36th International Conference on
Plasma Science, San Diego, CA, June 3, 2009.
28
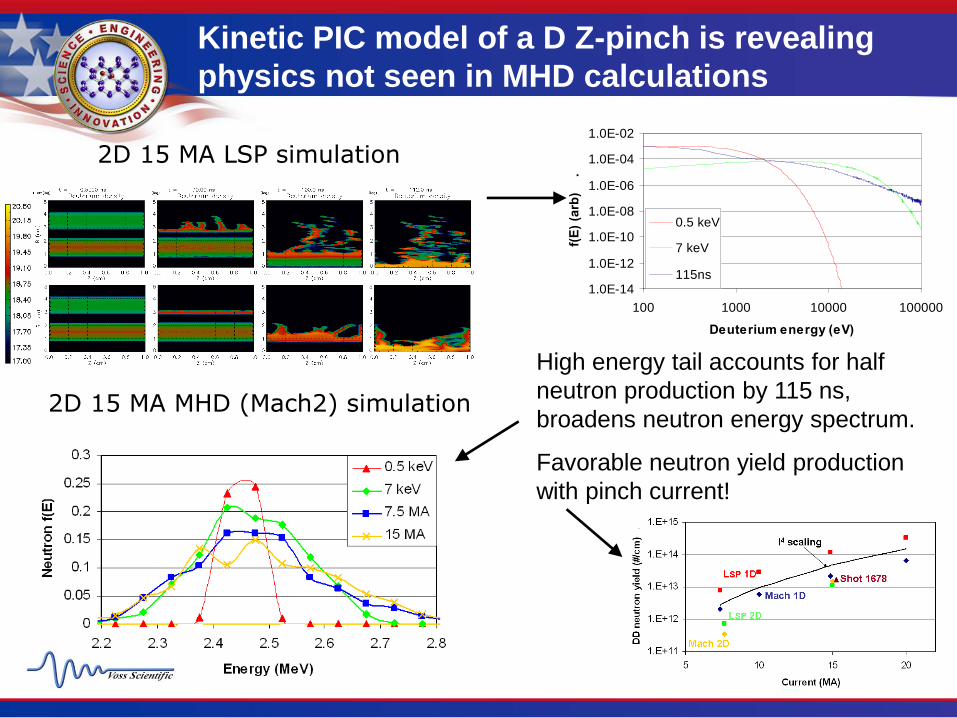
2D 15 MA LSP simulation
1.0E-14
1.0E-12
1.0E-10
1.0E-08
1.0E-06
1.0E-04
1.0E-02
100 1000 10000 100000
Deuterium energy (eV)
f(E
) (a
rb)
.
0.5 keV
7 keV
115ns
High energy tail accounts for half
neutron production by 115 ns,
broadens neutron energy spectrum.
Favorable neutron yield production
with pinch current!
2D 15 MA MHD (Mach2) simulation
Kinetic PIC model of a D Z-pinch is revealing
physics not seen in MHD calculations

Neutron spectrum reflect higher reactant energies
as pinch progresses
• FWHM of distribution increases from 80 to 300 keV
• These neutron spectra suggest that both “thermal” and “non-thermal” neutrons are produced in pinch plasma systems
0.0E+00
1.0E-01
2.0E-01
3.0E-01
4.0E-01
5.0E-01
2 2.2 2.4 2.6 2.8 3
Energy (MeV)
Neu
tro
n f
(E)
100 ns
105 ns
110 ns
115 ns

MHD code of gas puff Z-pinch on Z, using
measured deuterium density profile plus 3D helical
twist thermonuclear yield of 4x10¹³ D-D
Neutron spectrum is dominated by thermonuclear
reactions, but has a broad range of energies due to
accelerated and magnetized beam of deuterons
Combined MHD and PIC simulations model implosion,
particle acceleration and fusion reaction kinetics

S.A. Slutz et al., Phys. Plasmas 17,
056303 (2010)
Rayleigh Taylor instability grows in the aluminum liner during
implosion, but is unable to penetrate into fuel before a fusion
yield of 100 kJ is obtained
Unique explicit formalism of Imperial College’s MHD code ‘Gorgon’ enables efficient
parallel scaling - demonstrated on up to 13,000 processors on AWE’s Blackthorn
computer - with 13x109 computational elements in simulations of SNL wire arrays and
liner fusion schemes
Similar combined MHD & PIC techniques are being
used to model liner fusion schemes such as MagLIF

350 keV Cockcroft-Walton
Data acquisition setup
Dedicated beam-line and hardware
DD and DT associated particle neutron calibration
facility located at Sandia’s Ion Beam Laboratory

D + T → n(14.1 MeV) + 4He(3.23 - 2.77 MeV)
-90°
+110° +165°
5 or 2.5mm Dia.
Collimator
5 or 2.5 mm Dia.
Collimator
SBD Detector , 200 microns
Thick, 50 mm2, 14 keV res.
SBD Detector
Copper samples
located from 7.5 to 30
cm distance to target
center at -90 deg.
.6 µA, 175 keV
magnetically
analyzed
d beam
Water cooled 2 - 3µm
thick ErT2 or ErD2 target
on a 50 mil Cu substrate
2.5 µm Al filters prevent
Rutherford scattered
deuterons on the SBD’s
Associated-particle technique employs the measurement
of charge particle emission from DD and DT reactions

It’s an exciting time to be working
on the Z facility
• Refurbished Z is up and running
• Ever more extreme conditions are being reached in the dynamic materials program
• Several new concepts for pulsed power inertial confinement fusion look interesting
• Higher currents are enabling brighter x-ray sources and hotter and denser plasmas for astrophysical opacity research
• Particle In Cell (PIC) calculations of a gas puff Z-pinch reveal new insights into this “classic” plasma system

W. A. Stygar, et. al., “Architecture of
petawatt-class z-pinch drivers”, Phys.
Rev. ST Accel. Beams 10, 03040
(2007) diameter = 100 m
100 m
We are developing new pulsed power architectures
for a next generation z-pinch facility

Several recent studies have highlighted
High Energy Density Science
Science and Applications
of Ultrafast, Ultraintense
Lasers (SAUUL)
“Frontiers in High Energy
Density Physics”,
R. Davidson et al. 2004
“Connecting Quarks with
the Cosmos: Eleven
Science Questions for
the New Century”,
M Turner et al. 2002

The five-year Z-Refurbishment project has
been completed
Last Shot Demolition Completed Tank Modifications Completed
Installation Underway – Multiple Contractors Installation Completed
July ‘06 Sept ‘06 Jan ‘07
March ‘07 August ‘07

Our MHD simulation capability is a powerful
design tool
flyer
cathode
Bx
By
flyer
Measured / predicted current & flyer
velocity (850 μm Al)
current
velocity
Δ=6.1%
measured
predicted
In 3-D, up to 108 elements, 8192 CPUs, 300 hours (ASC Purple)
In 2-D, 106 elements, 160 CPUs, 4 hours (T-Bird)
DFT based material models gave us predictive capability
ASC codes enable optimized experiments
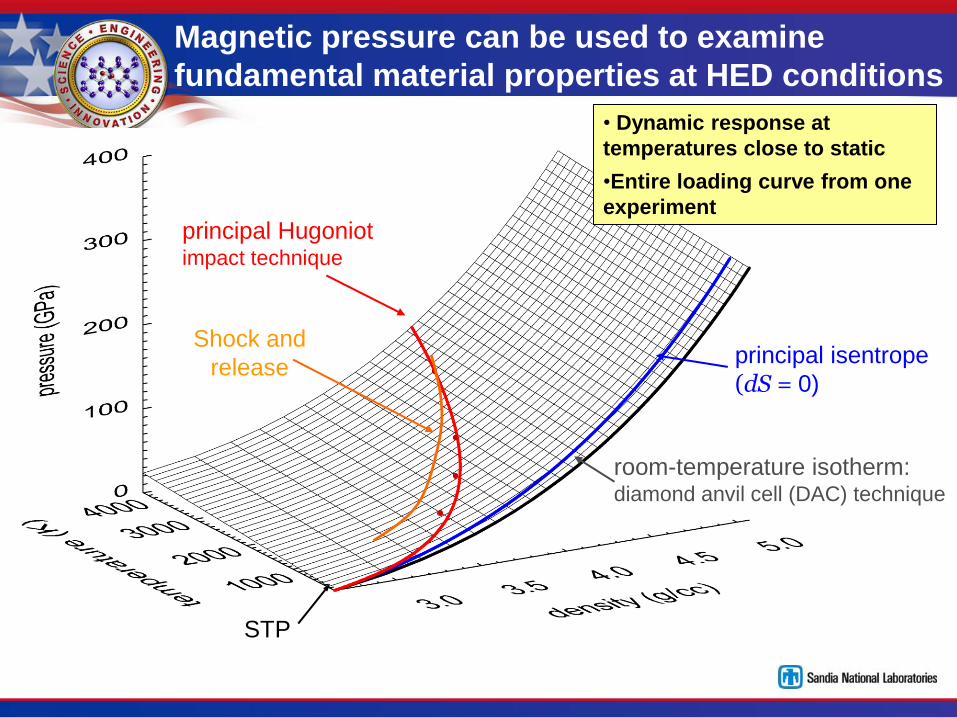
principal isentrope
(dS = 0)
principal Hugoniot impact technique
STP
room-temperature isotherm: diamond anvil cell (DAC) technique
• Dynamic response at
temperatures close to static
•Entire loading curve from one
experiment
Shock and
release
Magnetic pressure can be used to examine
fundamental material properties at HED conditions

It’s an exciting time to be working
on the Z facility
• Refurbished Z is up and running
• Ever more extreme conditions are being reached in the dynamic materials program
• Several new concepts for pulsed power inertial confinement fusion look interesting
• Higher currents are enabling brighter x-ray sources and hotter and denser plasmas for astrophysical opacity research
• Particle In Cell (PIC) calculations of a gas puff Z-pinch reveal new insights into this “classic” plasma system
It’s an exciting time to be working
on the Z facility

Dynamic hohlraums efficiently couple x-rays
to capsules
• Z-pinch plasma impacts foam converter
• The impact launches shocks in foam and tungsten
• The foam shock is a main radiation source
• The z-pinch confines the radiation
• Capsule heated mainly by re-emission from tungsten hohlraum wall
physics issues:
1. interior diagnostics
2. symmetry
3. radiation production
4. radiation transport
5. radiation confinement
6. preheat
tungsten
plasma 6 mm
CH2 foam radiating shock
capsule
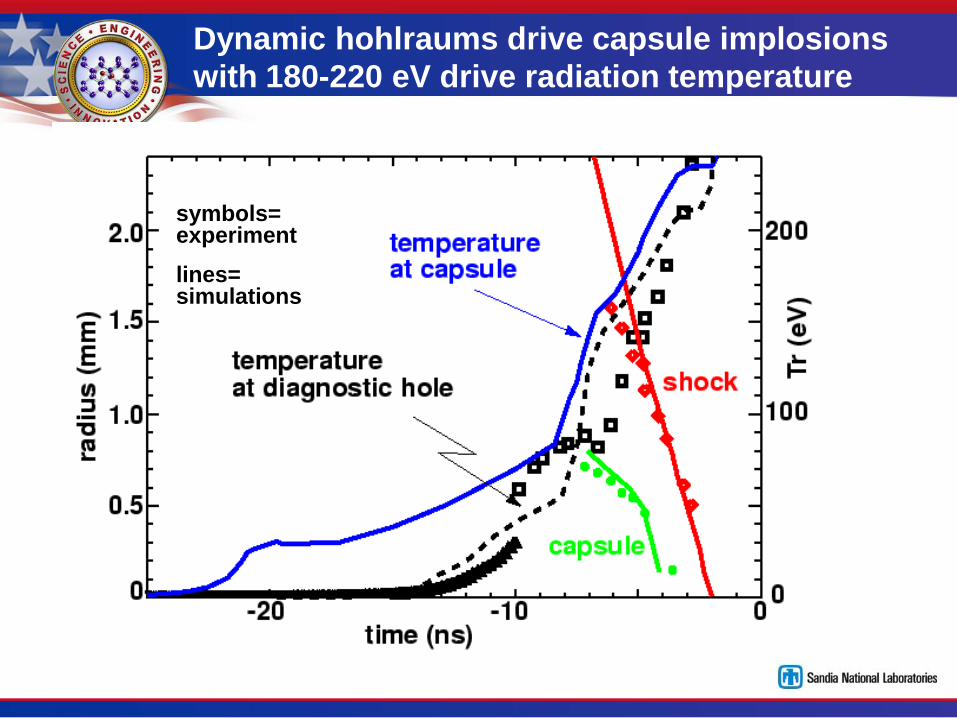
Dynamic hohlraums drive capsule implosions
with 180-220 eV drive radiation temperature
symbols= experiment
lines= simulations

Schematic of the neutron diagnostic arrangement
used in these capsule experiments is shown here

Side-on neutron time-of-flight data showing the
detection of DD neutrons on a Be capsule shot
V ~ 2.2 cm/ns
E ~ 2.49 MeV
ED-D = 2.45 MeV
Detector
at 740 cm
Detector
at 837 cm
44.3 ns
Data from 2-mm Be capsule with 33-mm Be wall on 18-mm plastic
filled with ~16 atm DD
Vo
lts
Time (ns)

Neutron time-of-flight signal dramatically decreases when Xe fill
gas is added to “null” the production of thermonuclear neutrons
• On “null shots,” neutron yield measured by Be activation
decreased by more than an order of magnitude
Z1031 “standard” fill (24 atm D2 + 0.085 atm Ar)
Z1032 “standard” fill + 0.6 atm Xe
C. L. Ruiz et al., Phys. Rev.
Lett. 93, 015001 (2004)
R. J. Leeper et al., J. Phys.
IV 133, 175 (2006)

400
600
800
1000
1200
1400
1600
4.75 5.25 5.75 6.25 6.75 7.25 7.75 8.25 8.75
Density (g/cc)
Str
ess (
GP
a)
Z answered important questions about the
properties of diamond at high pressure
18
20
22
24
26
28
30
6 8 10 12 14 16 18
Particle Velocity (km/s)
Sh
ock V
elo
cit
y (
km
/s)
Z data
QMD
400
600
800
1000
1200
1400
1600
4.75 5.25 5.75 6.25 6.75 7.25 7.75 8.25 8.75
Density (g/cc)
Str
ess (
GP
a)
18
20
22
24
26
28
30
6 8 10 12 14 16 18
Particle Velocity (km/s)
Sh
ock V
elo
cit
y (
km
/s)
Z fit
Z data
Pavlovskii
Gekko
Omega
Luli
QMD
stress versus density for diamond
• The Z data was
obtained in 1 week
• Measurements on
Z have a accuracy
of ≤ 1%
QMD predicted
region of melt

Magnetized Liner Inertial Fusion (MagLIF) provides
beneficial effects for pulsed power driven ICF
axial
field
cold fuel
azimuthal
drive field Liner
laser
beam
preheated
fuel
compressed
axial field
• A magnetic field inhibits thermal conduction and enhances alpha particle deposition within the fuel
• Preheating the fuel reduces the compression needed to obtain ignition temperature
– allows relatively low velocity implosions (5-10 cm/ms)
– calculations indicate this could be done by the Z Beamlet laser
• Simulations indicate significant yields on ZR with modest convergence ratios
• The Z Beamlet backlighter will enable studies of the evolution of the Magneto-Rayleigh-Taylor instability in Beryllium liners

Refurbished Z has delivered world-record currents to Dynamic
Hohlraum Z-pinch loads with < 1% shot-to-shot variation
ti = 123 ± 0.9 ns
Ip = 23.8 ± 0.2 MA
40 mm
12 m
m
m ~ 7.3 mg
This reproducible, bright (~200 TW) source is ideal for opacity experiments

I0(n)
I(n)
plasma
opacity
k(n)
[cm2/g]
Opacity quantifies how transparent or opaque
a plasma is to radiation
Optical depth
t(n) = k(n)x
Transmission
T = I(n) / I0(n) = exp {-t(n)}
x
Stellar structure depends on opacities that have never been measured Challenge: create and diagnose stellar interior conditions on earth

Z opacity experiments reached T ~ 156 eV, two
times higher than in prior Fe research
l (Angstroms)
tra
nsm
issio
n
Fe + Mg at Te ~ 156 eV, ne ~ 6.9x1021 cm-3
Fe XVI-XX
Mg XI
8.0 10.0 12.0 14.0
0.4
0.0
0.8
• Mg is the “thermometer”, Fe is the test element
Fe & Mg sample
radiation
source
X-rays
J.E. Bailey et al., PRL 99, 265002 (2007)

PIC calculations are the first pinch calculations to predict a power
law ion distribution E-a that has been observed in experiment
Average Ez within
1.5 cm radius
Average ion Vz within
1.5 cm radius
Deuterium energy
distribution
105 ns 110 ns 115 ns
H. L. L. Paasen et al., Phys. Fluids 13, 2606 (1970)
J. H. Lee et al., Plasma Phys. 13, 347 (1971)
W. A. Stygar et al., Nuclear Fusion 22, 1161 (1982)

How can we use this efficient x-ray source
to do ICF?
Where do we put the capsule?
We want high intensity (high Tr)
for high ablation pressure
-> let the capsule see the pinch
We need high uniformity (~1%) in
x-rays the capsule sees for symmetry
-> hide the capsule from the pinch
Double-Ended
Hohlraum
Dynamic Hohlraum
This approach
is the most
conservative

Pulsed power has been investigated
for over a century.
Tesla’s Lab (GW) ZR facility {SNL}
Z-pinch (100 TW)
1900 1920 1940 1960 1980 2000
Radar (MW) •Germany
•US
•Russia
•Great Britain
WWII
Hermes - II {SNL}
e-beam (TW) PBFA - II {SNL}
Ion Beams (20 TW)
Angara - II {Russia}
Simulator (TW)
DARHT {LANL}
Radiography (10 GW)


