what is a QTL? what is the goal of your QTL study? why worry about multiple QTL?
Draft
High-density SNP mapping reveals closely linked QTL for
resistance to Stagonospora nodorum blotch (SNB) in flag leaf and glume of hexaploid wheat.
Journal: Genome
Manuscript ID gen-2017-0203.R1
Manuscript Type: Note
Date Submitted by the Author: 28-Nov-2017
Complete List of Authors: Francki, Michael; Department of Agriculture and Food Western Australia, ;
Murdoch University, State Agricultural Biotechnology Centre Walker, Esther ; Western Australia Department of Agriculture and Food, Grains R&D Transformation Li, Dora ; DAFWA, Biotechnology Forrest, Kerrie; Agriculture Victoria Research, Department of Economic Development, Jobs, Transport and Resources
Is the invited manuscript for consideration in a Special
Issue? : N/A
Keyword: Stagonospora nodorum blotch, quantitative trait loci, adult plant resistance, single nucleotide polymorphism
https://mc06.manuscriptcentral.com/genome-pubs
Genome
Draft
1
High-density SNP mapping reveals closely linked QTL for resistance to 1
Stagonospora nodorum blotch (SNB) in flag leaf and glume of hexaploid 2
wheat. 3
4
Michael G. Francki • Esther Walker • Dora A. Li • Kerrie Forrest 5
6
Michael G. Francki � • Esther Walker 7
Department of Agriculture and Food Western Australia, South Perth WA 6151, Australia 8
Michael G. Francki � • Esther Walker • Dora A. Li 9
State Agricultural Biotechnology Centre, Murdoch University, Murdoch WA, 6150, Australia 10
Kerrie Forrest 11
Department of Economic Development, Jobs, Transport and Resources, Agriculture Victoria Research, Agribio, Bundoora, 12
VIC, Australia 13
e-mail: [email protected] 14
15
16
Page 1 of 14
https://mc06.manuscriptcentral.com/genome-pubs
Genome

Draft
2
Abstract 17
The genetic control of adult plant resistance to Stagonospora nodorum blotch (SNB) is complex 18
consisting of genes with minor effects interacting in an additive manner. Earlier studies detected 19
quantitative trait loci (QTL) for flag leaf resistance in successive years on chromosomes 1B, 2A, 2D, 20
5B using SSR- and DArT-based genetic maps of progeny from the crosses EGA Blanco/Millewa, 21
6HRWSN125/WAWHT2074 and P92201D5/P91193D1. Similarly, QTL for glume resistance detected 22
in successive years and multiple environments were identified on chromosomes 2D and 4B from 23
genetic maps of P92201D5/P91193D1 and 6HRWSN125/WAWHT2074, respectively. The SSR- and 24
DArT-based genetic maps had an average distance of 6.5, 7.8 and 9.7 cM between marker loci for 25
populations EGA/Millewa, P92201D5/P91193D1 and 6HRWSN125/WAWHT2074, respectively. This 26
study used single nucleotide polymorphism (SNP) markers from the iSelect Infinium 90K genotyping 27
array to fine map genomic regions harbouring QTL for flag leaf and glume SNB resistance reducing 28
the average distance between markers to 2.9, 3.3 and 3.4 -3.4 cM for populations 29
P92201D5/P91193D1, EGA/Millewa and 6HRWSN125/WAWHT2074, respectively. Increasing the 30
marker density of the genetic maps with SNPs did not identify any new QTL for SNB resistance but 31
discriminated previously identified co-located QTL into separate but closely linked QTL. 32
33
Key words: Stagonospora nodorum blotch; quantitative trait loci; adult plant resistance; single 34
nucleotide polymorphism 35
36
Page 2 of 14
https://mc06.manuscriptcentral.com/genome-pubs
Genome

Draft
3
Introduction 37
Stagonospora nodorum blotch (SNB) is a nercrotophic fungal disease of wheat caused by the 38
pathogen Parastagonospora nodorum (synonyms Stagonospora nodorum, Phaeosphaeria nodorum). 39
Symptoms of infection in adult plants generally develop in wet and humid environments and include 40
red-brown lesions surrounded by a yellow halo on flag leaves or pale to brown lesions on the glume. 41
SNB infection on adult plants reduces the photosynthetic capacity of flag leaves, heads and peduncle 42
causing significant losses in grain yield (Krupinsky et al 1973). Although fungicide application and 43
crop rotation are common approaches for managing SNB, the use of resistant wheat varieties 44
provides a complementary strategy to maintain grain yields under SNB epidemics. 45
Breeding for SNB resistance in wheat is a challenging task due to complex quantitative 46
genetic control. Genetic analysis for adult plant resistance in spring and winter wheat has identified 47
several minor quantitative trait loci (QTL) interacting in an additive manner, where genes expressing 48
resistance in flag leaves are independent to those in glumes (reviewed in Francki 2013). QTL for flag 49
leaf resistance on chromosomes 1B, 2A, 2D and 5B were detected in successive years under 50
Australian field conditions using spring wheat doubled-haploid populations EGA Blanco/Millewa 51
(Francki et al. 2011) and 6HRWSN125/WAWHT2074 (Shankar et al. 2008), while QTL for glume 52
resistance were detected on chromosome 2D in the latter population (Shankar et al. 2008). Analysis 53
of glume response in a P92201D5/P91193D1 recombinant-inbred population across multiple 54
environments detected the same QTL on chromosome 2D (Uphaus et al. 2007), suggesting similar 55
genes may be responsible for expression of resistance to the pathogen in USA and Australia. It was 56
therefore reasonable to assume that co-located QTL for flag leaf and glume resistance in the EGA 57
Blanco/Millewa, 6HRWSN125/WAWHT2074 and P92201D5/P91193D1 populations contained the 58
same genes responding to SNB infection in different environments. However, the genetic maps 59
underpinning those studies were based on a maximum of 492 DNA markers, the average distance 60
between marker loci was as high as 9.7 cM (Francki et al. 2009; Shankar et al. 2008), and QTL 61
intervals spanned 10-30 cM and accounted for 8-38% of the phenotypic variation (reviewed in Francki 62
2013). 63
Page 3 of 14
https://mc06.manuscriptcentral.com/genome-pubs
Genome

Draft
4
QTL spanning large genome intervals (i.e. >5 cM) can have restrictions when transferred to 64
breeders germplasm. In particular is the increased risk of chromosome recombination between 65
marker loci and the gene when QTL intervals are large which reduces the accuracy of selection for 66
desirable phenotype. To mitigate these problems, fine mapping can be used to reduce QTL intervals 67
and thereby increase efficiencies for QTL introgression in breeding programs (Salvi and Tuberosa 68
2005). Recently, several high-density genotyping arrays providing wide genome coverage have been 69
developed for wheat including the iSelect Infinium 9K and 90K bead chip arrays (Cavanagh et al. 70
2013; Wang et al. 2014). Here, we used the iSelect 90K wheat SNP array to genotype the EGA 71
Blanco/Millewa, 6HRWSN125/WAWHT2074 and the P92201D5/P91193D1 populations to create a 72
high-density integrated SNP, SSR and DArT genetic map for each population to help refine QTL 73
intervals for flag leaf and glume resistance to SNB. 74
Methods 75
SNP genotyping and genetic map construction 76
DNA samples from 241, 250 and 239 individuals of doubled-haploid (DH) populations EGA 77
Blanco/Millewa and 6HRWSN125/WAWHT2074 and recombinant-inbred (RI) line population 78
P92201D5/P91193D1, respectively, were assayed using the 90K iSelect SNP array Agriculture 79
Victoria Research, Agribio, Bundoora, VIC, Australia. SNP clustering and assignment of samples to 80
cluster was performed using custom scripts. In brief, sample theta and normR values for each SNP 81
were exported from GenomeStudio v1.9.4. Assignment of a sample to a cluster required that the 82
sample data point fell within two standard deviations of the sample cluster, and that the confidence 83
score for assignment to that cluster versus the next closest cluster exceeded the value of 0.7, where 0 84
and 1 represent lowest and highest confidence, respectively. Cluster assignments were converted to 85
binary parental phasing using a custom perl script. Genotyping data for each population was 86
preliminarily mapped using MSTmap (Wu et al. 2008) at LOD6 to assess the quality of genotype 87
calling. Markers with either less than 80% call rate or segregation distortion (p-value >0.10 calculated 88
from a chi-square test) were removed. Moreover, samples with a high crossover rate (indicating a 89
Page 4 of 14
https://mc06.manuscriptcentral.com/genome-pubs
Genome

Draft
5
mixed sample) or duplicate samples (>95% identical genotypes) were also removed. The datasets for 90
each population were then merged with SSR, DArT and other markers previously genotyped for these 91
populations (Francki et al. 2011; Shankar et al. 2008; Uphaus et al. 2007) and re-mapped using 92
MSTmap at LOD6, without redundant markers, selecting “DH” as Population Type for populations 93
EGA Blanco/Millewa and 6HRWSN125/WAWHT2074, and “RIL at generation 8” for population 94
P92201D5/P91193D1. The merged datasets were also mapped using QTL Ici Mapping Version 95
4.0.6.0 (Meng et al. 2015) to confirm marker order. Redundant markers were removed by selecting 96
the BIN parameter within QTL IciMapping using “Delete redundancy By Missing Rate (%)” and 97
missing data was set at 20% using the “Delete markers By missing rate (%)” function. MAP 98
parameters were set at LOD6, specifying Algorithm: nnTwoOpt and Rippling:SARF. 99
QTL mapping with SNP-based genetic maps 100
The high-density genetic maps containing SNP markers and mean flag leaf and glume 101
disease scores from multi-environments (Francki et al. 2011; Shankar et al. 2008; Uphaus et al. 2007) 102
were used to identify any new QTL not previously detected using SSR and DArT-based genetic maps 103
and to fine map existing genomic regions for SNB resistance. QTL IciMapping was used to identify 104
QTL regions using inclusive composite interval mapping with additive effect (ICIM-ADD). Parameters 105
for all traits and environments were set to 0.1cM steps, Probability in Stepwise Regression (PIN) of 106
0.001, minimum LOD threshold of 2.5 and deleting missing phenotypes. Final maps and associated 107
QTL were drawn using MapChart Version 2.3 (Voorrips, 2002). 108
Results and Discussion 109
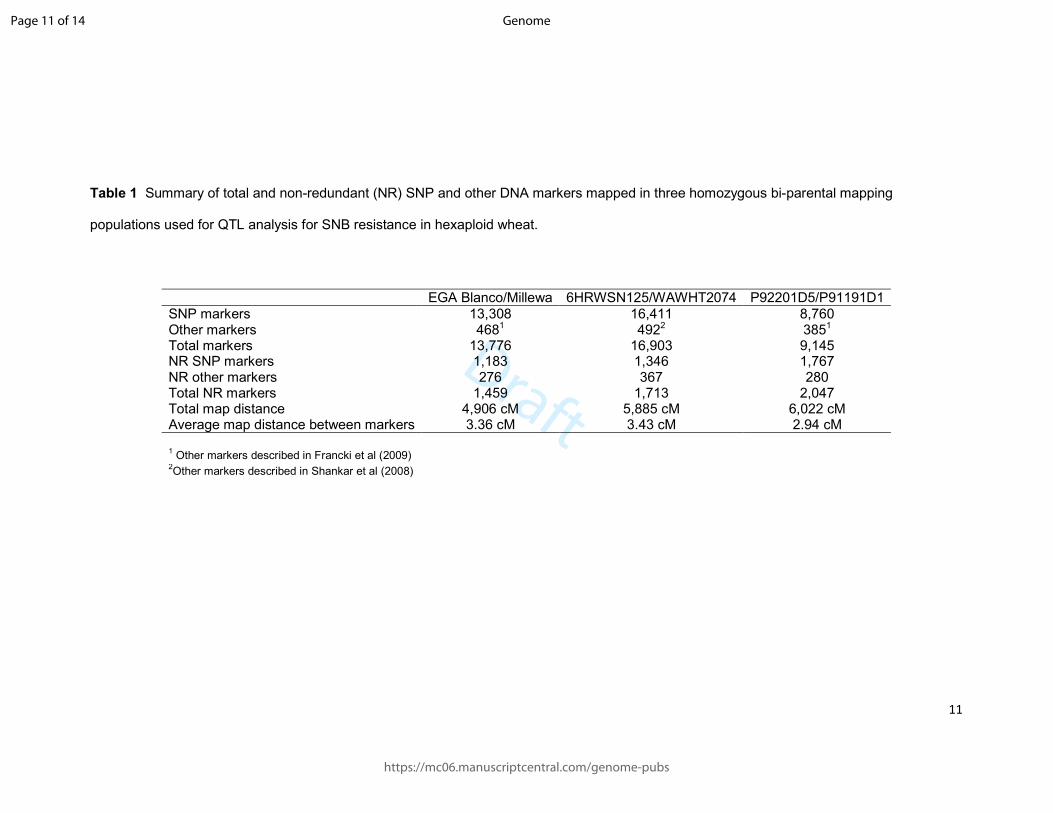
The 90K iSelect SNP array substantially increased the number of markers with identification of 110
8,760-16,411 polymorphic SNP loci (Table 1) representing 22.8-33.3 times the number of existing 111
markers for each genetic map reported in Francki et al. (2009) and Shankar et al. (2008). However, 112
the number of non-redundant SNP markers polymorphic between parents of the mapping populations 113
ranged from 1,183-1,767 (Table 1) representing 8-20% of the total polymorphic SNP markers and 114
were used to integrate with other markers in genetic maps. Although the SNP markers cover the 115
Page 5 of 14
https://mc06.manuscriptcentral.com/genome-pubs
Genome

Draft
6
majority of the wheat genome, the high SNP redundancy reflects the marker density to the limited 116
recombination for each DH and RIL population. The total number of SSR, DArT, non-redundant SNP 117
and other markers mapped in the EGA Blanco/Millewa, 6HRWSN125/WAWHT2074 and 118
P92201D5/P91193D1 populations were 1,459, 1,713 and 2,047, respectively, where the integration of 119
non-redundant polymorphic SNP markers expanded the total genetic map distance 4,906-6,022 cM 120
(Table 1) from the SSR- and DArT-based map reported in Francki et al. 2009 and Shankar et al. 121
2008. The average genetic map distance between SNP and other marker loci was 2.94 cM, 3.36 cM 122
and 3.43 cM for populations P92201D5/P91193D1, EGA/Millewa and 6HRWSN125/WAWHT2074, 123
respectively (Table 1). The intervals were reduced from 6.5, 7.8 and 9.7 cM between marker loci for 124
populations EGA/Millewa, P92201D5/P91193D1 and 6HRWSN125/WAWHT2074, respectively, when 125
predominantly SSR and DArT markers were used in map construction (Francki et al. 2009; Shankar 126
et al. 2008). SNP marker locus intervals were comparable to previously published high-density SNP-127
based marker maps derived from the DH mapping populations of hexaploid wheat, Avalon/Cadenza 128
and Savannah/Rialto, with average intervals of 2.8 and 3.8 cM, respectively (Allen et al. 2011; Allen et 129
al. 2013). The smaller interval size was, therefore, suitable for fine mapping QTL for SNB resistance 130
in flag leaf and glumes. 131
The co-location of QTL using SSR and DArT marker-based genetic maps indicated that 132
genome regions controlling SNB resistance contain similar genes expressed in different 133
environments. QTL analysis of maps supplemented with SNP markers did not identify any new QTL 134
for flag leaf resistance. It was anticipated that existing QTL for flag leaf resistance detected in 135
different environments would co-locate in the same genomic region as previously described in Francki 136
et al. (2011) and Shankar et al. (2008) using genetic maps supplemented with SNP markers. Instead, 137
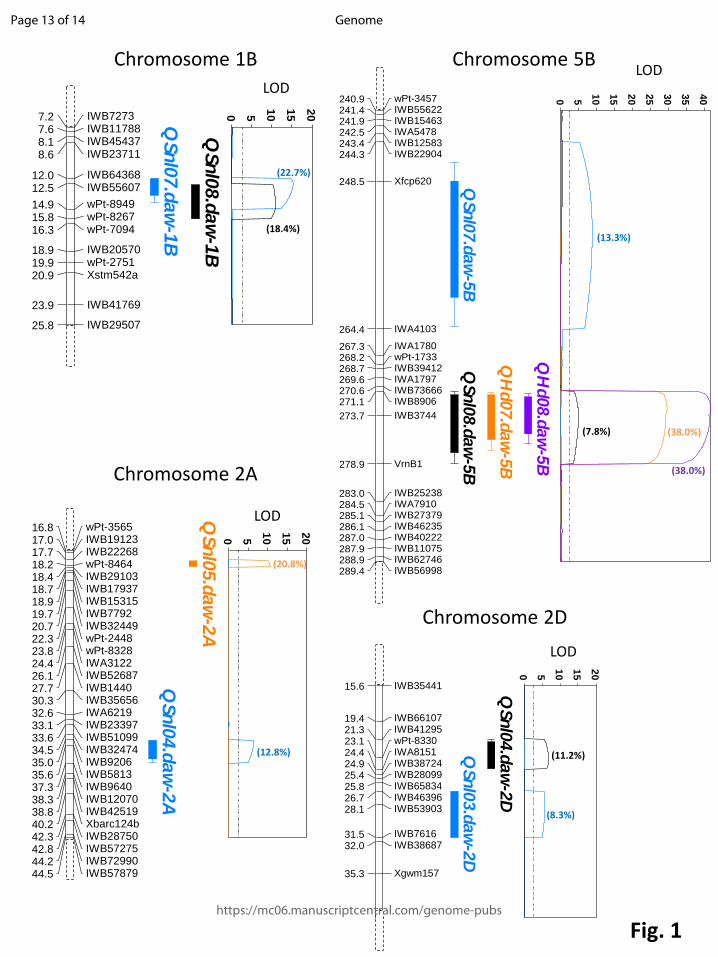
the higher density genetic maps discriminated two closely linked QTL for flag leaf resistance detected 138
in different environments on chromosome 2A and 2D from the populations P92201D5/P91193D1 and 139
6HRWSN125/WAWHT2074, respectively (Fig. 1). The distinct QTL provided unambiguous evidence 140
that multiple flag leaf genes on chromosomes 2A and 2D are linked within 17 cM and 5 cM, 141
respectively, and express resistance in response to different environmental signals. The proportion of 142
Page 6 of 14
https://mc06.manuscriptcentral.com/genome-pubs
Genome

Draft
7
phenotypic variation accounted by each QTL using genetic maps supplemented with SNP markers 143
ranged from 7.8% to 20.8% depending on the environment (Fig. 1). The proportion of variation 144
accounted for by each QTL and environment using composite interval mapping was the same as 145
previously reported in Francki et al. (2011) and Shankar et al. (2008). 146
Similarly, SNP markers were able to discriminate at least two QTL for flag leaf resistance on 147
chromosomes 5B in the EGA Blanco/Millewa population where each QTL contained genes that 148
express resistance in response to different environments (Fig. 1). However, additional SNP markers 149
within a 10-cM interval were unable to discriminate between the Qsnl08.daw QTL for flag leaf SNB 150
resistance detected in 2008 and Qhd07.daw and Qhd08.daw for heading date in 2007 and 2008 on 151
chromosome 5B (Fig. 1). As heading date was unlikely to have pleiotropic effects on flag leaf 152
resistance in the EGA Blanco/Millewa population (Francki et al. 2011) it is anticipated, therefore, that 153
further fine mapping within this region would discriminate QTL for flag leaf resistance from heading 154
date. Although high-density SNP markers were mapped on chromosome 1B in the EGA 155
Blanco/Millewa population (Fig. 1), it remains unclear whether single or linked QTL controlling flag leaf 156
resistance in different environments reside at this locus. Analysis using a larger size of the EGA 157
Blanco/Millewa population would determine whether single or multiple QTL for flag leaf resistance 158
reside on chromosome 1B. 159
The genetic maps supplemented with SNP markers were used in QTL analysis for SNB 160
resistance in glumes for the 6HRWSN125/WAWHT2074 population using mean glume disease 161
scores from two environments reported in Shankar et al (2008). Glume resistance on chromosome 162
4B identified two linked QTL within 12 cM (Fig. 2), indicating at least two genes underpin resistance 163
and are expressed in this genomic region. The QTL explained similar phenotypic variance to that 164
reported previously by Shankar et al. (2008). However, high-resolution SNP mapping detected QTL 165
co-located for glume resistance on chromosome 2D within the same SNP marker interval of 0.3 cM 166
(IWB31450- IWB21124) when the P92201D5/P91193D1 population was evaluated in three 167
environments in the USA (Fig. 2). Distinct but tightly linked QTL were also detected for glume 168
resistance in two environments in Australia and resided in the (Xgwm526a - IWB53436) marker 169
Page 7 of 14
https://mc06.manuscriptcentral.com/genome-pubs
Genome
Draft
8
interval of <1.0 cM (Fig. 2). Therefore, it appears that the same genes control glume resistance to 170
SNB across different USA environments but are different to resistance genes that consistently 171
respond to variable Australian environments. 172
The significant increase in map density provided by SNP markers in three genetic maps in this 173
study provided a new insight on the QTL underpinning SNB resistance contributing to the genetic 174
complexity of this trait in wheat. It was reasonable to assume in earlier studies (Francki et al. 2011; 175
Shankar et al. 2008; Uphaus et al 2007) that similar genes controlled expression of flag leaf and 176
glume resistance to SNB in different environments based on the co-location of QTL using medium-177
resolution SSR- and DArT-based genetic maps. Instead, fine mapping using SNP markers in this 178
study revealed multiple but closely linked QTL, indicating distinct clusters of concomitant disease-179
related genes in the host that respond differently to pathogen infection across environments. Plant 180
resistance (R) multi-gene families are typically tandem or segmentally duplicated for large stretches 181
of contiguous DNA and contain diverse copies within clusters that have evolved through selective 182
forces generating novel or diverse pathogen recognition capabilities (Gururani et al. 2012; Leister 183
2004; Liu et al. 2007; Meyers et al. 2005). Therefore, it is conceivable that multiple linked QTL for 184
SNB resistance identified in this study through high-density SNP mapping may have detected disease 185
response from clusters of R genes or R gene-mediated signalling pathway factors that respond to 186
specific isolates in mixed inoculum that predominate in specific environments. The identified SNP 187
markers in this study would assist in aligning QTL intervals to the sequenced genome of wheat (The 188
International Wheat Genome Sequencing Consortium, 2014) and provide further knowledge of the 189
underlying genes involved in SNB resistance. In the meantime, the knowledge of the genetic control 190
and SNP markers identified in this study are exemplary tools to introgress clusters of disease related 191
genes for breeding improved SNB resistance in wheat. 192
Acknowledgements: Funding from the Grains Research Development Corporation through 193
DAW00248 and DAV00127 is gratefully acknowledged. 194
References 195
Page 8 of 14
https://mc06.manuscriptcentral.com/genome-pubs
Genome
Draft
9
Allen, A., Barker, G., Berry, S., Coghill, J., Gwilliam, R., Kirby, S., Robinson, P. et al. 2011. Transcript-196
specific, single-nucleotide polymorphism discovery and linkage analysis in hexaploid bread wheat 197
(Tricticum aestivum L.). Plant Biotech. J. 9:1086-1099 198
Allen, A., Barker, G., Wilkinson, P., Burridge, A., Winfield, M., Coghill, J., Uauy, C. et al. 2013. 199
Discovery and development of exome based, co-dominant single nucleotide polymorphism 200
markers in hexaploid wheat (Tricticum aestivum L.). Plant Biotech. J. 11:279-295 201
Cavanagh, C., Chao, S., Wang, S., Huang, B.E., Stephen, S., Kiani, S., Forrest, K. et al. 2013. 202
Genome-wide comparative diversity uncovers multiple targets of selection for improvement in 203
hexaploid wheat landraces and cultivars. Proc. Natl. Acad. Sci. USA 110:8057-8062 204
Francki, M. 2013. Improving Stagonospora nodorum resistance in wheat: a review. Crop Sci .53:355-205
365 206
Francki, M., Walker, E., Crawford, A., Broughton, S., Ohm, H., Barclay, I., Wilson, R., McLean, R. 207
2009. Comparison of genetic and cytogenetic maps of hexaploid wheat (Triticum aestivum L.) 208
using SSR and DArT markers. Mol. Genet. Genomics 281:181–191 209
Francki, M., Shankar, M., Walker, E., Loughman, R., Golzar, H., Ohm, H. 2011. New quantitative trait 210
loci for flag leaf resistance to Stagonospora nnodorum blotch. Phytopath. 101:1278-1284 211
Gururani, M., Venkatesh, J., Upadhyaya, C., Nookaraju, A., Pandey, S., Park, S. 2012. Plant disease 212
resistance genes: current status and future directions. Physiol. Mol. Plant Pathol. 78:51-65 213
Krupinsky, J., Scharen, A., Schillinger, J. 1973. Pathogenic variation in Septoria nodorum (Berk.) 214
Berk. in relation to organ specificity, apparent photosynthetic rate and yield of wheat. Physiol. 215
Plant Path. 3:187-194 216
Leister, D. 2004. Tandem and segmental duplication and recombination in the evolution of plant 217
disease resistance genes. Trends Genet. 20:116-122 218
Page 9 of 14
https://mc06.manuscriptcentral.com/genome-pubs
Genome
Draft
10
Liu, J., Liu, X., Dai, L., Wang, G. 2007. Recent progress in elucidating the structure, function and 219
evolution of disease resistance genes in plants. J. Genet. Genom. 34:765-776 220
Meng, L., Li, H., Zhang, L., Wang, J. 2015. QTL IciMapping: Integrated software for genetic linkage 221
map construction and quantitative trait locus mapping in biparental populations. Crop J. 3: 269-222
283 223
Myers, B., Kaushik, S., Nandety, R. 2005. Evolving disease resistance genes. Curr. Op. Plant Biol. 224
8:129-134 225
Salvi, S., Tuberosa, R. 2005. To clone or not to clone plant QTLs: present and future challenges. 226
Trends Plant Sci. 10:297-304 227
Shankar, M., Walker, E., Golzar, H., Loughman, R., Wilson, R., Francki, M. 2008. Quantitative trait 228
loci for seedling and adult plant resistance to Stagonospora nodorum in wheat. Phytopath. 229
98:886-893 230
The International Wheat Genome Sequencing Consortium (IWGSC) 2014. A chromosome-based 231
draft sequence of the hexaploid bread wheat (Triticum aestivum) genome. Science 345:1251788 232
Uphaus, J., Walker, E., Shankar, M., Golzar, H., Loughman, R., Francki, M., Ohm, H. 2007. 233
Quantitative trait loci to Stagonospora glume blotch in wheat in the USA and Australia. Crop Sci. 234
47:1813-1822 235
Voorrips, R. 2002. MapChart: Software for the graphical presentation of linkage maps and QTLs. J 236
Hered. 93:77–78 237
Wang, S., Wong, D., Forrest, K., Allen, A., Chao, S., Huang, B., Maccaferri, M. et al. 2014. 238
Characterization of polyploid wheat genomic diversity using a high-density 90 000 single 239
nucleotide polymorphism array. Plant Biotech. J. 12:787-796 240
Wu, Y., Bhat, P., Close, T., Lonardi, S. 2008. Efficient and accurate construction of genetic linkage 241
maps from the minimum spanning Tree of a Graph. PLoS Genet. 4: e1000212 242
Page 10 of 14
https://mc06.manuscriptcentral.com/genome-pubs
Genome
Draft
11
Table 1 Summary of total and non-redundant (NR) SNP and other DNA markers mapped in three homozygous bi-parental mapping
populations used for QTL analysis for SNB resistance in hexaploid wheat.
EGA Blanco/Millewa 6HRWSN125/WAWHT2074 P92201D5/P91191D1
SNP markers 13,308 16,411 8,760 Other markers 4681 4922 3851 Total markers 13,776 16,903 9,145 NR SNP markers 1,183 1,346 1,767 NR other markers 276 367 280 Total NR markers 1,459 1,713 2,047 Total map distance 4,906 cM 5,885 cM 6,022 cM Average map distance between markers 3.36 cM 3.43 cM 2.94 cM
1 Other markers described in Francki et al (2009) 2Other markers described in Shankar et al (2008)
Page 11 of 14
https://mc06.manuscriptcentral.com/genome-pubs
Genome

Draft
12
Fig. 1 QTL analysis for flag leaf resistance to SNB from populations EGA Blanco/Millewa
(chromosomes 1B and 5B), 6HRWSN125/WAWHT2074 (chromosome 2D) and P92201D5/P91191D1
(chromosome 2A). Chromosomal location of SNP integrated with other DNA markers are shown to
the left and QTL traces based on phenotypic data for flag leaf response from successive years are
shown on the right. Coloured solid bars in traces represent QTL regions detected in different
environments (Qnl designations) and threshold LOD are represented by dotted lines. The phenotypic
variance accounted for each QTL is shown in parentheses.
Fig. 2 QTL analysis for glume resistance to SNB from populations P92201D5/P91191D1
(chromosome 2D) and 6HRWSN125/WAWHT2074 (chromosome 4B). Chromosomal location of SNP
integrated with other DNA markers are shown to the left and QTL traces based on phenotypic data for
glume response from successive years screened in Australia and USA are shown on the right.
Coloured solid bars in traces represent QTL regions detected in Australian and USA environments
(Qng.daw and Qng.pur designations, respectively) and threshold LOD are represented by dotted
lines. The phenotypic variance accounted for each QTL is shown in parentheses.
Page 12 of 14
https://mc06.manuscriptcentral.com/genome-pubs
Genome
Draft
Chromosome 1B Chromosome 5B
Chromosome 2A
Chromosome 2D
wPt-356516.8IWB1912317.0IWB2226817.7wPt-846418.2IWB2910318.4IWB1793718.7IWB1531518.9IWB779219.7IWB3244920.7wPt-244822.3wPt-832823.8IWA312224.4IWB5268726.1IWB144027.7IWB3565630.3IWA621932.6IWB2339733.1IWB5109933.6IWB3247434.5IWB920635.0IWB581335.6IWB964037.3IWB1207038.3IWB4251938.8Xbarc124b40.2IWB2875042.3IWB5727542.8IWB7299044.2IWB5787944.5
QSnl0
4.d
aw
-2A
QSnl0
5.d
aw
-2A
0
5
10
15
20
2ALOD
wPt-3457240.9IWB55622241.4IWB15463241.9IWA5478242.5IWB12583243.4IWB22904244.3
Xfcp620248.5
IWA4103264.4
IWA1780267.3wPt-1733268.2IWB39412268.7IWA1797269.6IWB73666270.6IWB8906271.1
IWB3744273.7
VrnB1278.9
IWB25238283.0IWA7910284.5IWB27379285.1IWB46235286.1IWB40222287.0IWB11075287.9IWB62746288.9IWB56998289.4
QSnl0
7.d
aw
-5B
QSnl0
8.d
aw
-5B
QH
d07.d
aw
-5B
QH
d08.d
aw
-5B
0
5
10
15
20
25
30
35
40
5B LOD
IWB72737.2IWB117887.6IWB454378.1IWB237118.6
IWB6436812.0IWB5560712.5
wPt-894914.9wPt-826715.8wPt-709416.3
IWB2057018.9wPt-275119.9Xstm542a20.9
IWB4176923.9
IWB2950725.8
QSnl0
7.d
aw
-1B
QSnl0
8.d
aw
-1B
0
5
10
15
20
1BLOD
IWB3544115.6
IWB6610719.4IWB4129521.3wPt-833023.1IWA815124.4IWB3872424.9IWB2809925.4IWB6583425.8IWB4639626.7IWB5390328.1
IWB761631.5IWB3868732.0
Xgwm15735.3
QSnl0
3.d
aw
-2D
QSnl0
4.d
aw
-2D
0
5
10
15
20
2DLOD
(22.7%)
(18.4%) (13.3%)
(7.8%) (38.0%)
(38.0%)
(20.8%)
(12.8%) (11.2%)
(8.3%)
Fig. 1
Page 13 of 14
https://mc06.manuscriptcentral.com/genome-pubs
Genome

Draft
Fig. 2
LOD
Chromosome 4B
IWB5607895.2
IWB7325898.0IWB7295598.4IWB472098.9IWB6993999.3IWB71675100.8IWB7612102.2IWB62190103.0wPt-3991105.3
wPt-7569108.4
Xbarc340112.7
IWA3325116.6
IWA4055118.4IWB28921119.3Xgwm495120.6
IWB41476125.8
QSng03.d
aw
-4B
QSng04.d
aw
-4B
0
5
10
15
20
4B
LOD
Xcfd50b0.0
IWB269544.2
IWB505327.9
IWB7379111.3IWB7379912.3IWB4531213.2IWB1198714.5IWB3528715.0IWB3145016.2IWB2112416.5Xgwm526a17.0IWB5343617.5IWB2579119.1
IWB908823.8
QSng04.d
aw
-2D
QSng05.d
aw
-2D
QSng03.p
urE
-2D
QSng03.p
urL
-2D
QSng03.p
urV
-2D
0
5
10
15
20
2D
Chromosome 2D
(13.3%)
(7.7%)
(35.8%) (25.4%)
(11.2%) (16.9%)
(17.3%)
Page 14 of 14
https://mc06.manuscriptcentral.com/genome-pubs
Genome


![Quantitative Trait Locus (QTL) Mapping Reveals a Role for …summit.sfu.ca/system/files/iritems1/13352/journal.pone... · 2020. 9. 5. · Yersinia pseudotuberculosis [29]. In addition](https://static.fdocuments.in/doc/165x107/6068f314f94ad21c506e92d2/quantitative-trait-locus-qtl-mapping-reveals-a-role-for-2020-9-5-yersinia.jpg)