High Cholesterol and Heart Disease Case Study · High Cholesterol and Heart Disease Case Study...
25
High Cholesterol and Heart Disease Case Study TREATMENT OF UNDERLYING FACTORS EFFECTIVELY LOWERS LIPIDS AND LIPOPROTEINS IN AN OTHERWISE HEALTHY 56-YEAR-OLD MALE INITIAL PRESENTATION AND LABORATORY TESTING David, 56 years old, was not my typical patient. His sole complaint was high cholesterol and reducing his risk of heart disease. He had no other symptoms or concerns and felt he was in excellent health in all other respects. David was eating a Paleo-template diet, exercising regularly, managing his stress, sleeping well, and doing everything he could to prevent heart disease. David did have a family history of heart disease (though neither his mother or father had a heart attack before age 60). David had several mercury dental amalgams removed about six years prior to coming to see me, though he experienced no adverse symptoms at that time. He had switched to a Paleo template diet about three years prior to our visit, and he’d seen a steady increase in his total and LDL cholesterol over that time, as illustrated in Table 1. kresserinstitute.com 1 CASE SUMMARY A 56-year-old man wanted to lower his cholesterol and his risk for heart disease but was otherwise healthy and led a healthy lifestyle. Testing revealed that he had small intestinal bacterial overgrowth, intestinal permeability, Helicobacter pylori, and high levels of mercury. He also had a genetic predisposition for cardiovascular disease and suboptimal thyroid function. Treatments to clear the gut infection and toxic metals brought about significant improvements in total cholesterol, LDL cholesterol, LDL particle number, lipoprotein (a), fibrinogen, and Lp-PLA2. Additional treatment with natural desiccated thyroid hormone, red yeast rice, tocotrienols, pantethine, and ubiquinol brought all lipids and lipoproteins into optimal ranges. This case shows that lipids can be significantly reduced by addressing the gut, toxicity, and thyroid function and by using nutraceuticals, without a lifelong prescription for statin medications.
Transcript of High Cholesterol and Heart Disease Case Study · High Cholesterol and Heart Disease Case Study...

High Cholesterol and Heart Disease Case Study
TREATMENT OF UNDERLYING FACTORS EFFECTIVELY LOWERS LIPIDS AND LIPOPROTEINS IN AN OTHERWISE HEALTHY 56-YEAR-OLD MALE
INITIAL PRESENTATION AND LABORATORY TESTING David, 56 years old, was not my typical patient. His sole complaint was high cholesterol and reducing his risk of heart disease. He had no other symptoms or concerns and felt he was in excellent health in all other respects. David was eating a Paleo-template diet, exercising regularly, managing his stress, sleeping well, and doing everything he could to prevent heart disease. David did have a family history of heart disease (though neither his mother or father had a heart attack before age 60). David had several mercury dental amalgams removed about six years prior to coming to see me, though he experienced no adverse symptoms at that time.
He had switched to a Paleo template diet about three years prior to our visit, and he’d seen a steady increase in his total and LDL cholesterol over that time, as illustrated in Table 1.
kresserinstitute.com 1
CASE SUMMARY A 56-year-old man wanted to lower his cholesterol and his risk for heart disease but was otherwise healthy and led a healthy lifestyle. Testing revealed that he had small intestinal
bacterial overgrowth, intestinal permeability, Helicobacter pylori, and high levels of mercury. He also had a genetic predisposition for cardiovascular disease and suboptimal thyroid
function. Treatments to clear the gut infection and toxic metals brought about significant improvements in total cholesterol, LDL cholesterol, LDL particle number, lipoprotein (a),
fibrinogen, and Lp-PLA2. Additional treatment with natural desiccated thyroid hormone, red yeast rice, tocotrienols, pantethine, and ubiquinol brought all lipids and lipoproteins into
optimal ranges. This case shows that lipids can be significantly reduced by addressing the gut, toxicity, and thyroid function and by using nutraceuticals, without a lifelong prescription
for statin medications.

Table 1. David’s HDL, LDL, and cholesterol levels from 2012 to 2015. Note the steady increase of LDL over the years.
While it is possible that David’s increased LDL cholesterol resulted from adopting a Paleo diet (and thus, a higher-saturated-fat diet) in recent years, most of the research refutes this. I wanted to lower his cholesterol levels without drugs. By using a functional approach, I could look for the underlying causes of the increased cholesterol.
The most important thing to realize about high cholesterol from a functional perspective is that it is a symptom, not a disease.
The two primary causes of high cholesterol and LDL-P are metabolic dysfunction (insulin and leptin resistance) or genetic predisposition. However, there are a few other potential causes that should be investigated in patients with abnormal lipid profiles. I go into much more detail on these in the Discussion section and in the ADAPT Framework Level One course:
■ Poor thyroid function
■ Infections
■ Intestinal permeability and metabolic endotoxemia (i.e., disrupted gut microbiota leading to translocation of lipopolysaccharide from the gut into the bloodstream)
■ Environmental toxins
Given this, it is imperative to do a comprehensive panel of tests for patients like David, even when the only complaint is high cholesterol. This may seem excessive, especially to patients that are not familiar with a functional medicine approach. However, I’ve found that if you explain that cholesterol is a symptom rather than a disease, and you provide an overview of the underlying causes that can be addressed, most patients are amenable to the testing because they would rather not take a drug with potentially dangerous side effects for the rest of their lives.
I ran a panel of tests to measure lipids, lipoproteins, inflammation, oxidation, glucose control, genetics, gastrointestinal health, thyroid function, and heavy metals.
kresserinstitute.com 2

Figure 1. True Health Diagnostics Custom Panel showing lipids, lipoproteins, and markers of inflammation and oxidation.
I use a custom panel I have designed particularly for patients with lipid and metabolic abnormalities from a lab called True Health Diagnostics (THD). THD specializes in this kind of testing and provides many markers that are not available through standard labs like Quest or LabCorp.
There are several notable findings in the lipid and lipoprotein sections of David’s THD panel:
■ Very high total cholesterol (346 mg/dL; optimal range was <200 )
■ Very high LDL cholesterol (228 mg/dL; optimal range was <100)
■ Normal HDL cholesterol (100 mg/dL; optimal range was >40)
■ Very high LDL particle number, or LDL-P (2433 nmol/L; optimal range was <1020)
■ Normal small LDL-P (238 nmol/L; optimal range was <501)
■ Very high Lp(a) (219 nmol/L; optimal range was <75)
■ Borderline high fibrinogen (442 mg/dL; optimal range was 126-437)
■ High Lp-PLA2 (496 ng/mL; optimal range was <291)
kresserinstitute.com 3
David had two markers of increased inflammation, including borderline high fibrinogen and frankly elevated Lp-PLA2. Fibrinogen is a glycoprotein involved in the blood clotting process, and higher levels are associated with increased risk of myocardial infarction and stroke. Lp-PLA2, or lipoprotein-associated phospholipase A2, is an enzyme that plays a role in the inflammation of blood vessels and has been shown to promote atherosclerosis.1,2
A total cholesterol above 300 is often indicative of familial hypercholesterolemia (FH), a genetic condition that leads to very high total cholesterol levels. In FH, total and LDL cholesterol and LDL-P are often very high, but triglycerides, HDL, and other markers of metabolic dysfunction (such as small LDL-P) are normal.
Familial hypercholesterolemia involves a mutation of the gene that produces the LDL receptor or a mutation of the gene that produces apolipoprotein B. Though genetic testing would be required to confirm the diagnosis of FH, David’s markers are consistent with it. At this point in the conventional model, a statin would be prescribed and that would be the end of the story.
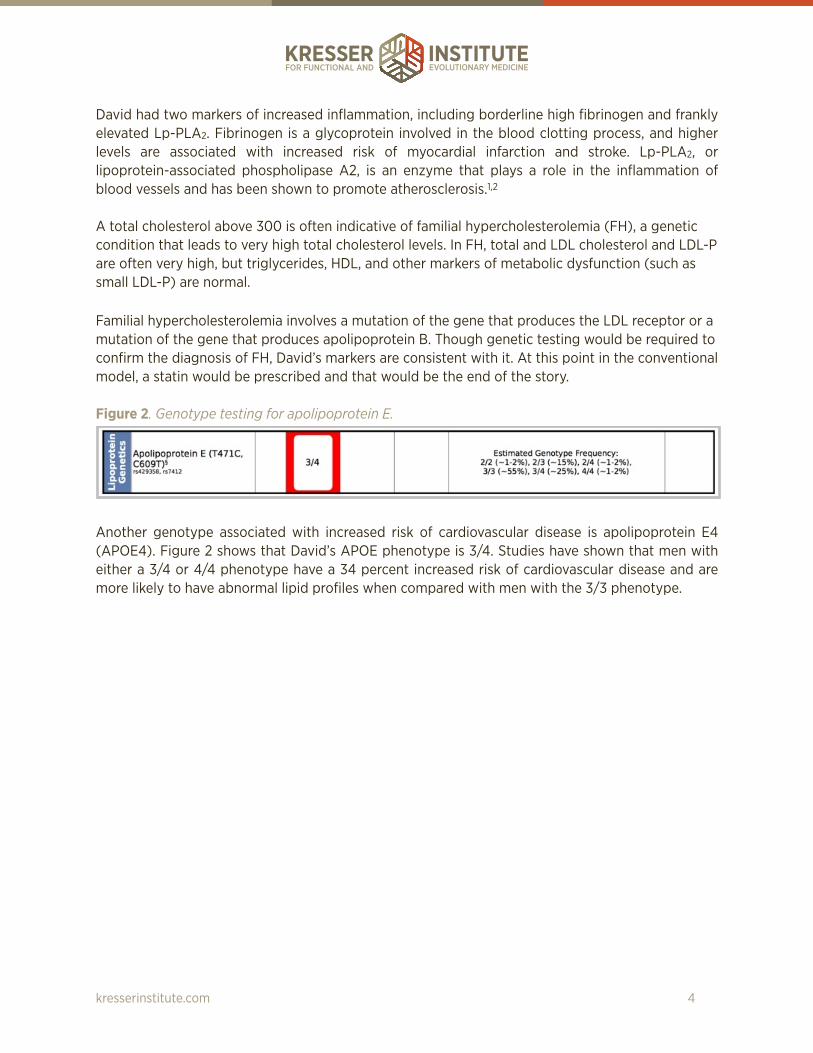
Figure 2. Genotype testing for apolipoprotein E.
Another genotype associated with increased risk of cardiovascular disease is apolipoprotein E4 (APOE4). Figure 2 shows that David’s APOE phenotype is 3/4. Studies have shown that men with either a 3/4 or 4/4 phenotype have a 34 percent increased risk of cardiovascular disease and are more likely to have abnormal lipid profiles when compared with men with the 3/3 phenotype.
kresserinstitute.com 4

Figure 3. True Health Diagnostics custom panel measuring markers of glycemic control, insulin resistance, and beta cell function.
David’s metabolic markers were borderline. His fasting glucose and hemoglobin A1c were high normal at 98 mg/dL and 5.7 percent respectively, and his fructosamine (another way of estimating average blood sugar in the recent past) was elevated at 356 µmol/L. However, his insulin resistance and beta cell function markers were largely normal.
Thus far, David’s results indicate that genetics are playing a significant role in his dyslipidemia, while metabolic dysfunction (insulin and leptin resistance) is not.
What about his thyroid, infections, intestinal permeability, and environmental toxins?
kresserinstitute.com 5
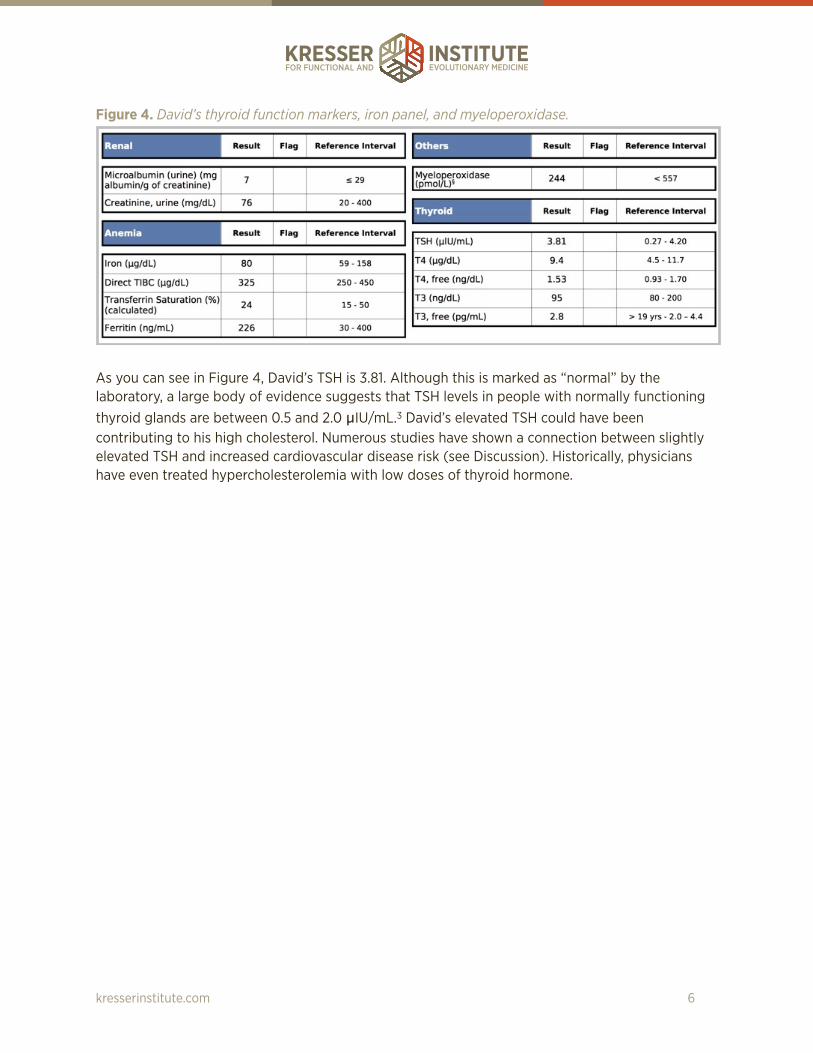
Figure 4. David’s thyroid function markers, iron panel, and myeloperoxidase.
As you can see in Figure 4, David’s TSH is 3.81. Although this is marked as “normal” by the laboratory, a large body of evidence suggests that TSH levels in people with normally functioning thyroid glands are between 0.5 and 2.0 µIU/mL.3 David’s elevated TSH could have been contributing to his high cholesterol. Numerous studies have shown a connection between slightly elevated TSH and increased cardiovascular disease risk (see Discussion). Historically, physicians have even treated hypercholesterolemia with low doses of thyroid hormone.
kresserinstitute.com 6

Figure 5. Small Intestinal Bacterial Overgrowth Breath Test Results.
David was positive for small intestinal bacterial overgrowth (SIBO). SIBO is a risk factor for increased intestinal permeability, so it is conceivable that it could contribute to hypercholesterolemia.
Figure 6. David’s results for Helicobacter pylori in stool.
kresserinstitute.com 7
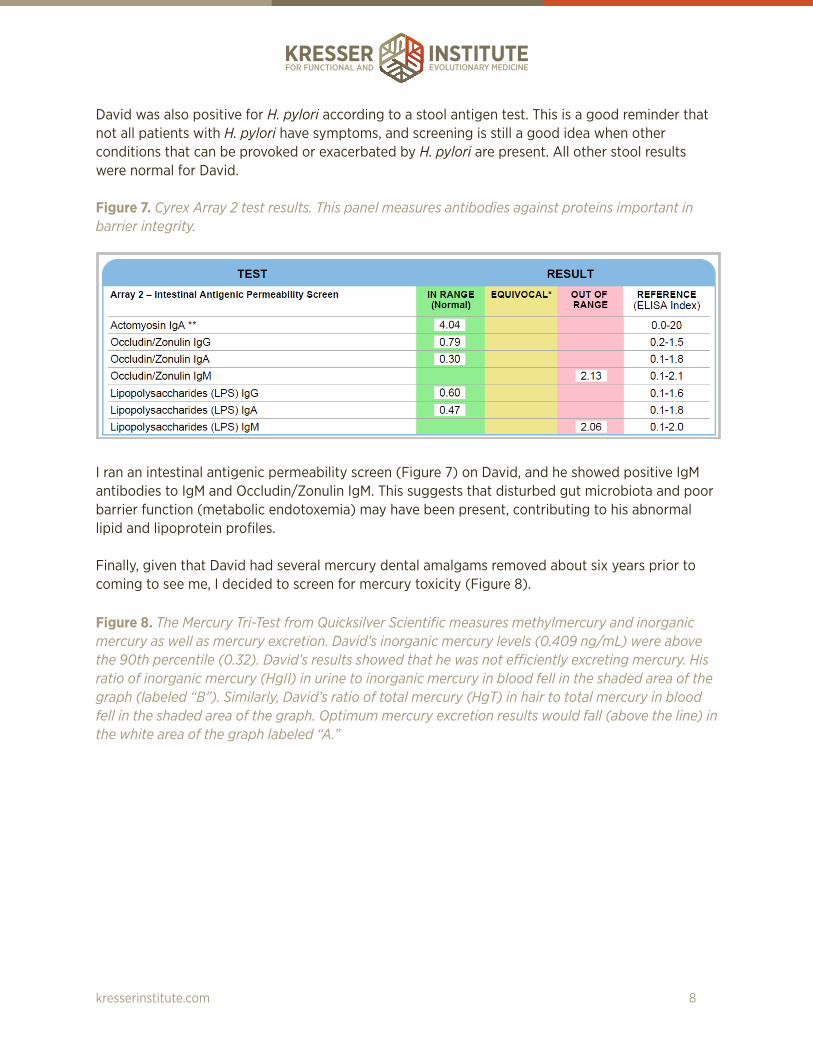
David was also positive for H. pylori according to a stool antigen test. This is a good reminder that not all patients with H. pylori have symptoms, and screening is still a good idea when other conditions that can be provoked or exacerbated by H. pylori are present. All other stool results were normal for David.
Figure 7. Cyrex Array 2 test results. This panel measures antibodies against proteins important in barrier integrity.
I ran an intestinal antigenic permeability screen (Figure 7) on David, and he showed positive IgM antibodies to IgM and Occludin/Zonulin IgM. This suggests that disturbed gut microbiota and poor barrier function (metabolic endotoxemia) may have been present, contributing to his abnormal lipid and lipoprotein profiles.
Finally, given that David had several mercury dental amalgams removed about six years prior to coming to see me, I decided to screen for mercury toxicity (Figure 8).
Figure 8. The Mercury Tri-Test from Quicksilver Scientific measures methylmercury and inorganic mercury as well as mercury excretion. David’s inorganic mercury levels (0.409 ng/mL) were above the 90th percentile (0.32). David’s results showed that he was not efficiently excreting mercury. His ratio of inorganic mercury (HgII) in urine to inorganic mercury in blood fell in the shaded area of the graph (labeled “B”). Similarly, David’s ratio of total mercury (HgT) in hair to total mercury in blood fell in the shaded area of the graph. Optimum mercury excretion results would fall (above the line) in the white area of the graph labeled “A.”
kresserinstitute.com 8
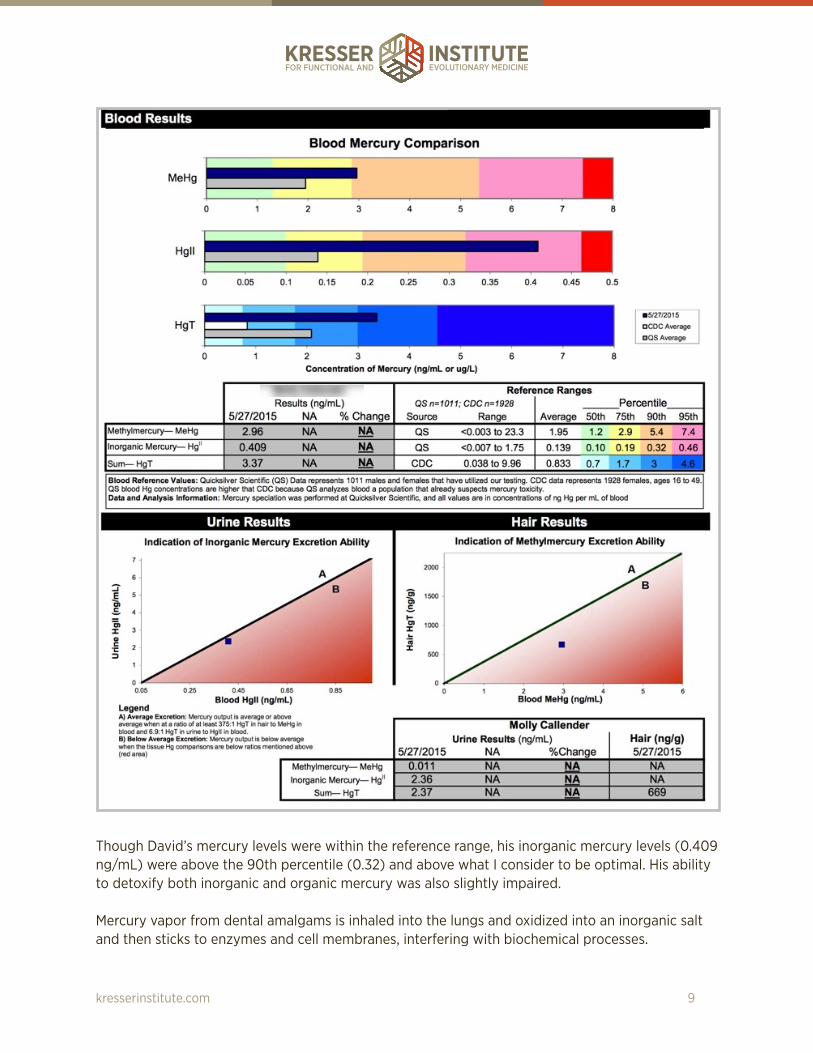
Though David’s mercury levels were within the reference range, his inorganic mercury levels (0.409 ng/mL) were above the 90th percentile (0.32) and above what I consider to be optimal. His ability to detoxify both inorganic and organic mercury was also slightly impaired.
Mercury vapor from dental amalgams is inhaled into the lungs and oxidized into an inorganic salt and then sticks to enzymes and cell membranes, interfering with biochemical processes.
kresserinstitute.com 9

INITIAL TREATMENT PLAN Recall that there are six underlying causes to investigate when lipid profiles are abnormal:
■ Genetics
■ Metabolic dysfunction (insulin and leptin resistance)
■ Thyroid dysfunction
■ Infections
■ Intestinal permeability
■ Environmental toxins
Of these six causes, David had five present. This strongly suggested to me that a functional approach would yield positive changes, without addressing his cholesterol levels directly with medication or supplements.
I used an antimicrobial protocol to treat the SIBO and dysbiosis. I used a heavy metal detox protocol including binders like silica and EDTA and agents to improve innate detoxification including glutathione, vitamin C, and milk thistle to address the mercury levels.
Table 2. David’s Treatment Protocol.
I chose not to address the thyroid during this first round of treatment. Why? Because poor thyroid function can itself often be a symptom of a deeper underlying cause. I wanted to clear up some of the underlying issues and see how his thyroid numbers changed, if at all.
Treatment Nutraceutical Brand DosageProbiotic Prescript-Assist Prescript-Assist One BID upon rising and
before bed
Probiotic Saccharomycin DF Xymogen 3 billion CFU twice daily at lunch and before bed
Antimicrobial GI Synergy Apex Energetics 1 packet BID (with breakfast and dinner)
Antimicrobial Lauricidin Med-Chem Laboratories
1 scoop three times daily with meals
Antimicrobial A-FNG Byron White Formulas
Slowly build to 20-30 drops BID with meals
Antimicrobial InterFase Plus Klaire Labs 3-4 capsules BID on an empty stomach
Detoxification Optimal Liposomal Glutathione
Seeking Health 1 tsp/day on an empty stomach
kresserinstitute.com 10
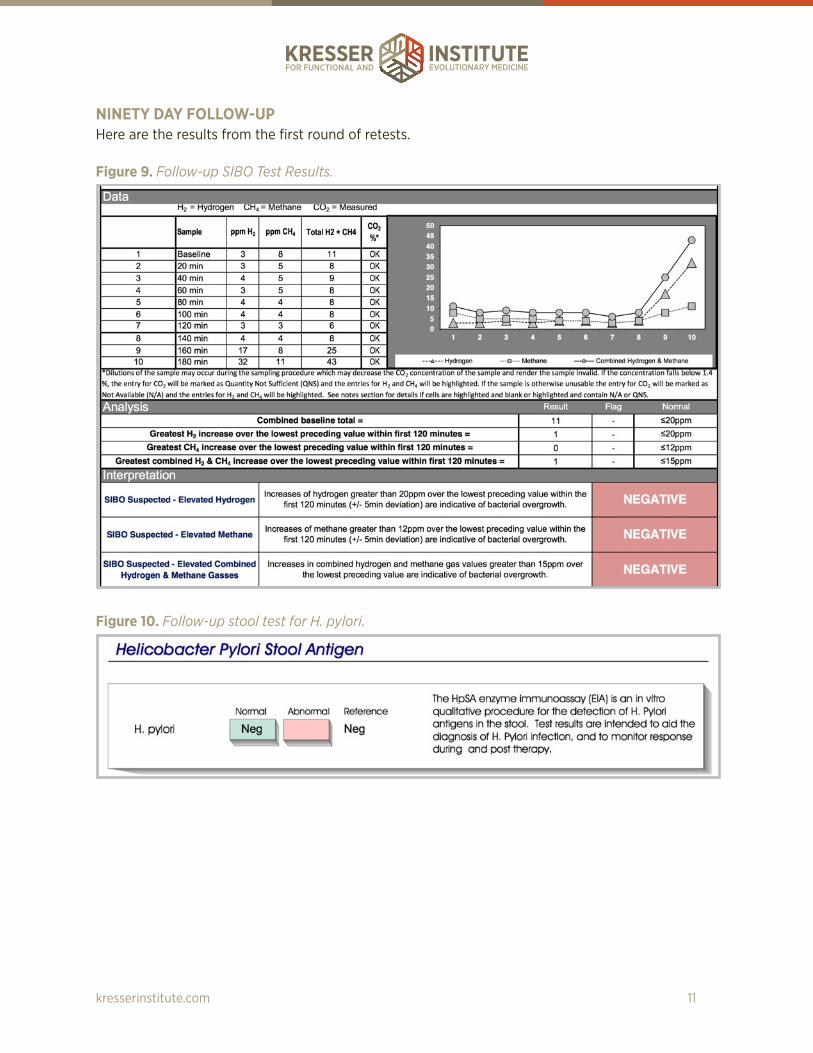
NINETY DAY FOLLOW-UP Here are the results from the first round of retests.
Figure 9. Follow-up SIBO Test Results.
Figure 10. Follow-up stool test for H. pylori.
kresserinstitute.com 11

Figure 11. David’s Cyrex Array 2 follow-up test.
As you can see in Figures 9-11, the SIBO, H. pylori infection, and intestinal permeability were resolved after three months of treatment. Figure 12. Follow-up testing for lipids, lipoproteins, and inflammatory markers after 90 days of treatment.
kresserinstitute.com 12

David’s lipid, lipoprotein, and inflammatory markers were significantly improved.
■ His total cholesterol dropped by 31 percent.
■ His LDL cholesterol dropped by 38 percent.
■ His LDL-P dropped by 29 percent.
■ His Lp(a), which many clinicians believe to be almost entirely genetically determined, dropped by 35 percent.
■ His fibrinogen and Lp-PLA2 went from being abnormal to normal.
This is a phenomenal improvement given that we not only did not use statins or cholesterol-lowering medications, we didn’t even use supplements or botanicals that are directly related to lowering lipids and lipoproteins. We achieved these benefits simply by addressing the underlying causes of his dyslipidemia.
That said, his markers are still above the laboratory reference range limits, and conventional guidelines would suggest further treatment. In a patient that has no other risk factors and no family history of heart disease, I believe the research is unclear on whether treatment of elevated LDL cholesterol or even LDL particle number provides a meaningful reduction of CVD risk.
For example, if we use the Reynolds Risk Score—an evidence-based algorithm that incorporates blood pressure, high-sensitivity C-reactive protein, and other markers to estimate the ten-year risk of heart attack, stroke, or other major cardiovascular event for David, we find that his risk of those events is only 3 percent.
kresserinstitute.com 13

Figure 13. Reynolds Risk Score for David. The score is a calculation of risk for a cardiovascular event over ten years.
If we aggressively lowered David’s total cholesterol to 160 mg/dL, his ten-year risk would drop from 3 percent to 2 percent. That is a 33 percent reduction on a relative basis (if we compare the difference between someone with a 3 percent versus a 2 percent risk), but it is only a one percent reduction on an absolute basis. The remaining 2 percent risk is mostly due to age—which is the single most significant risk factor for having a cardiovascular event.
kresserinstitute.com 14
Furthermore, risk calculators like the Reynolds Risk Score are based on studies that included mostly people in the U.S. that were following a Standard American Diet and lifestyle. David was eating a Paleo-template diet, exercising regularly, managing his stress, sleeping well, and doing everything he could to prevent heart disease. We do not have research demonstrating the relative risk of slightly elevated total and LDL cholesterol in a population following a very healthy diet and lifestyle and thus can’t assume that these risk calculations would even apply to David.
All of that said, in this case, David did have a family history of heart disease (though neither his mother or father had a heart attack before age 60), his Lp(a)-P was still significantly elevated, and he was still concerned about his lipid and lipoprotein markers at these levels. For these reasons we decided to continue treatment.
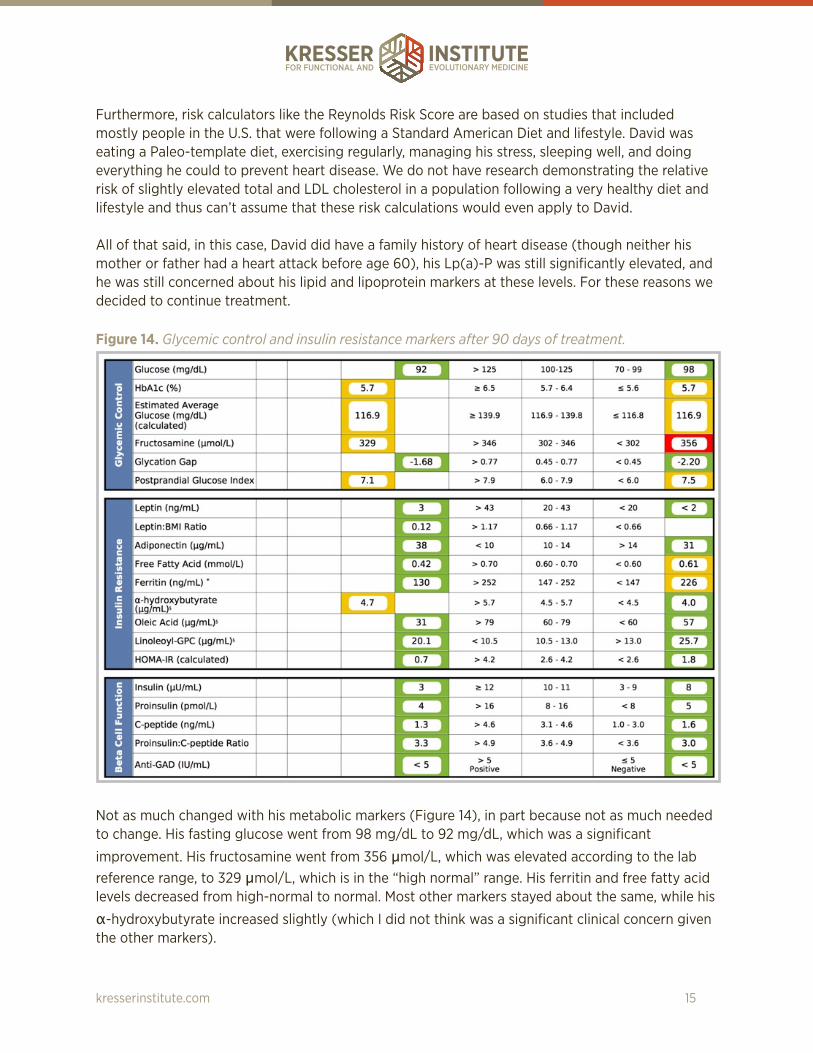
Figure 14. Glycemic control and insulin resistance markers after 90 days of treatment.
Not as much changed with his metabolic markers (Figure 14), in part because not as much needed to change. His fasting glucose went from 98 mg/dL to 92 mg/dL, which was a significant
improvement. His fructosamine went from 356 µmol/L, which was elevated according to the lab reference range, to 329 µmol/L, which is in the “high normal” range. His ferritin and free fatty acid levels decreased from high-normal to normal. Most other markers stayed about the same, while his
α-hydroxybutyrate increased slightly (which I did not think was a significant clinical concern given the other markers).
kresserinstitute.com 15

Figure 15. Iron, renal, and thyroid function markers after 90 days of treatment.
His TSH dropped from 3.8 µIU/mL to 2.8 µIU/mL. This is a significant improvement, but still above
the cutoff of 2.0 µIU/mL suggested for optimal thyroid and cardiovascular function.
TREATMENT PLAN MODIFICATIONS AFTER 90 DAYS Given that we had addressed most of the underlying modifiable factors that lead to dyslipidemia, the next steps were to focus on optimizing thyroid function and using natural agents that have been shown to reduce lipids and lipoproteins.
For David’s thyroid, I used a natural desiccated thyroid (NDT) from a bovine source from Nutri-Meds. The dose was one tablet a day, and I monitored him carefully since his free T3 was not low and I did not want to push him toward hyperthyroidism. Other options for NDT include WP-Thyroid, NatureThroid, and N.P. Thyroid (from Acella Pharmaceuticals).
Table 3. David’s treatment plan modifications after 90 days of treatment.
Treatment Nutraceutical Brand DosageThyroid hormone Bovine Thyroid Health Nutri-Meds One tablet per day
Lipid- and cholesterol-lowering
Choleast Thorne 2 capsules with breakfast
Lipid- and cholesterol-lowering
Annato Tocotrienols Designs for Health 2 capsules with dinner
Lipid- and cholesterol-lowering
Pantethine 450 Jarrow Formulas One capsule with breakfast and one capsule with dinner
Lipid- and cholesterol-lowering
QH-absorb 200 mg Jarrow Formulas One capsule daily with breakfast
kresserinstitute.com 16

EIGHT-MONTH (240-DAY) FOLLOW-UP
Figure 16. Lipids, lipoproteins, inflammation, and oxidation markers after eight months (or 240 days) of treatment.
Figure 15 shows David’s follow-up panel after a total of eight months of treatment, five months of which he was taking the thyroid and lipid-lowering supplements. Note that all of his lipid and lipoprotein markers are now in the “optimal” range, with the exception of LDL-C, ApoB, HDL2-C, and Lp(a)-P. His hs-CRP went up, but he was recovering from a cold/flu when he had this blood test and that can cause a transient elevation in hs-CRP. We retested his hs-CRP a month later, and it was again normal.
kresserinstitute.com 17

Figure 17. Thyroid function markers after a total treatment period of eight months (240 days).
Note that his TSH was now in the optimal range, and his free T3 had increased as well. The further improvement observed was likely a result of both the natural desiccated thyroid and the nutraceuticals we used for lipid/lipoprotein management (RYR, tocotrienols, and pantethine).
Maximal results for pantethine may not be observed until nine months of treatment with the supplement. It’s possible that David will continue to experience further gains on this protocol. At the time of writing this case study, we haven’t yet done the final retest, but I have seen improvement continue with other patients even after three to four, and up to nine, months on the protocol.
kresserinstitute.com 18
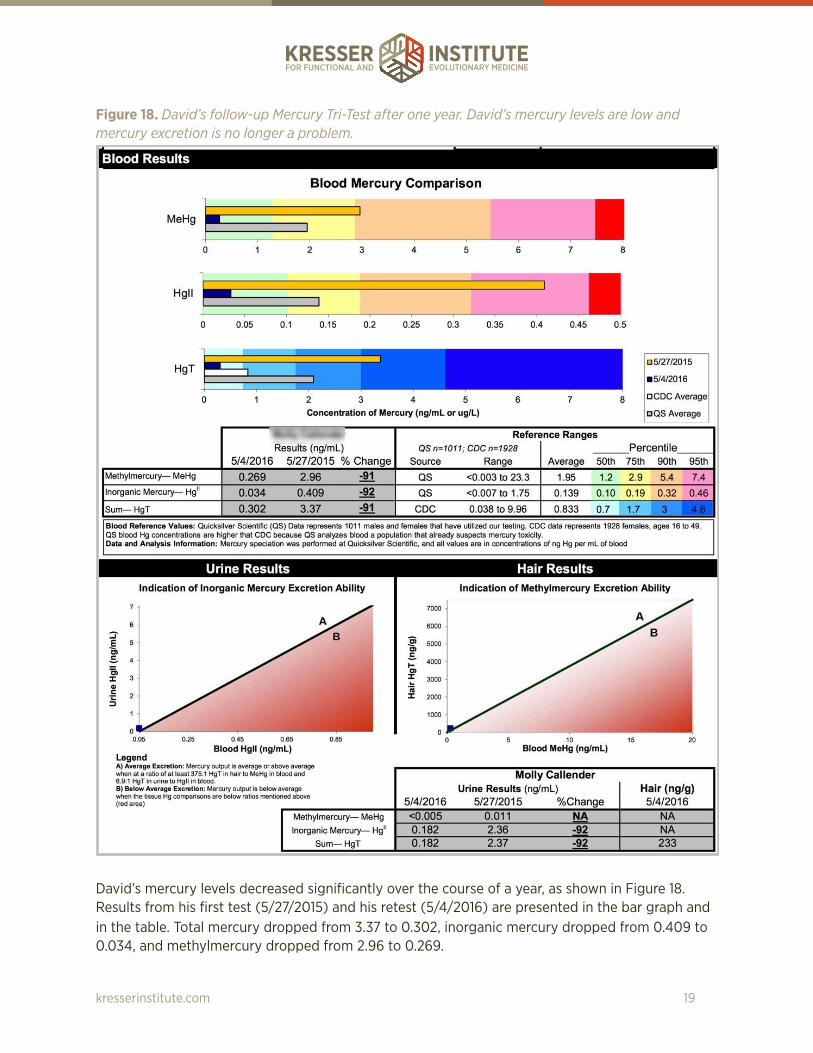
Figure 18. David’s follow-up Mercury Tri-Test after one year. David’s mercury levels are low and mercury excretion is no longer a problem.
David’s mercury levels decreased significantly over the course of a year, as shown in Figure 18. Results from his first test (5/27/2015) and his retest (5/4/2016) are presented in the bar graph and in the table. Total mercury dropped from 3.37 to 0.302, inorganic mercury dropped from 0.409 to 0.034, and methylmercury dropped from 2.96 to 0.269.
kresserinstitute.com 19

David was essentially a healthy patient with healthy lifestyle habits who wanted to reduce his cardiovascular disease risk. Therefore, other than getting impressive changes to his laboratory results, he did not report dramatic clinical improvements in the areas of energy, mood, GI function, or blood sugar control. Perhaps if the physiological imbalances we detected in David (intestinal permeability, SIBO, mercury, H. pylori, and thyroid hormone imbalance) had been allowed to continue without treatment, he would have experienced clinical symptoms (not just elevated lipids) over time, and those would have likely responded to this treatment protocol.
DISCUSSION Paleo Diet and Saturated Fat Although the most recent studies suggest that intake of saturated fat is not associated with total or LDL cholesterol levels on average, as clinicians we have to remember that we don’t treat averages—we treat individuals. And some individuals do experience a significant increase in their cholesterol levels after increasing their intake of saturated fat.
While it is possible that his increase in saturated fat due to adoption of a Paleo diet led to higher LDL cholesterol levels, recent research suggests that this does not occur on average. Nonetheless, I wanted to explore a functional approach to reducing David’s cholesterol levels without drugs, and I know from clinical experience that the response of individual patients to dietary saturated fat and cholesterol varies considerably.
Because David’s lipids responded favorably to the treatment protocol, I don’t believe that the increase in his saturated fat consumption on a Paleo diet was the root cause of his increasing lipid numbers from 2012 to 2015.
Treating High Cholesterol The most important thing to realize about high cholesterol from a functional perspective is that it is a symptom, not a disease.
In the conventional model, high cholesterol is essentially viewed as a statin deficiency. In other words, there is no interest or investigation into why cholesterol is high in the first place; the patient is simply prescribed a statin and told to take it for the rest of his or her life.
In functional medicine, we’re concerned with the underlying causes of a particular sign, symptom, or syndrome. We want to identify and address the pathologies that give rise to these manifestations, rather than just suppressing symptoms with drugs (or even supplements and herbs, though both may be necessary at times).
The two primary causes of high cholesterol and LDL-P are insulin and leptin resistance and genetics. LDL particles in a patient’s blood, not total cholesterol, are actually the driving factor behind plaque formation and heart disease. However, poor thyroid function, infections, intestinal permeability, and toxicity should also be investigated in patients with abnormal lipid profiles.
kresserinstitute.com 20

Poor thyroid function Thyroid hormone has multiple effects on the regulation of lipid production, absorption, and metabolism, and thyroid-stimulating hormone (TSH) levels are associated with cardiovascular disease risk.4-6 Numerous studies have shown that even slightly elevated TSH levels at a range currently considered to be “normal” (i.e., 3–4.5 µIU/mL) are associated with increased risk of cardiovascular disease. In addition, thyroid hormone replacement with thyroxine (T4) has been found to improve lipid profiles and vascular function in patients with TSH levels between 2.5 and 4.5. It was not uncommon, prior to the development of cholesterol-lowering drugs like statins, for physicians to prescribe low doses of thyroid hormone to reduce cholesterol levels (even in patients without overt hypothyroidism).3,7-9
Infections Multiple studies have shown associations between elevated lipids and bacterial infections like Chlamydia pneumoniae and H. pylori or viral infections like herpes and cytomegalovirus.10,11
Intestinal permeability Studies have shown that metabolic endotoxemia (i.e., disrupted gut microbiota leading to translocation of lipopolysaccharide from the gut into the bloodstream) is associated with obesity, insulin resistance, dyslipidemia, and oxidative stress.12
Environmental toxins Some research has shown that environmental toxins such as mercury and bisphenol A are associated with altered blood lipid profiles.13,14
NATURAL TREATMENTS TO LOWER LIPIDS AND LIPOPROTEINS There are over 25 compounds that have been shown to prevent and treat vascular disease by more than 38 different mechanisms, but we’re going to focus on those that have the best evidence behind them as well as the fewest side effects.15,16
Several studies have looked at each of these compounds individually, but only a few studies have looked at them in combination. That said, those studies have shown pretty promising results. For example, in one study using a combination of pantethine, plant sterols, green tea extract, tocotrienols, phytolens, and a red yeast rice extract, total cholesterol and LDL cholesterol fell by 34 percent, LDL particle number fell by 35 percent, VLDL dropped by 27 percent, and HDL increased by 10 percent.17 These improvements are pretty remarkable. In fact, they’re comparable and even greater in some cases than what’s typically observed with statin drugs.
Red yeast rice extract Red yeast rice (RYR) is a fermented product of rice that contains compounds called monacolins that reduce cholesterol production by inhibiting the HMG-CoA reductase enzyme. This is exactly the same mechanism by which statins lower cholesterol, and this isn’t a coincidence. Lovastatin, which is also known as Mevacor, was the first statin introduced to the market, and it was isolated from red yeast rice, and lovastatin, which is also known as monacolin K, is the main active ingredient in red yeast rice.
kresserinstitute.com 21

Two capsules of Thorne Choleast 900 contain about 5 mg of lovastatin, which is analogous to taking a very low dose of a statin. However, RYR has a far lower incidence of side effects than statins. For example, in one study in 2009 published in the Annals of Internal Medicine, only 7 percent of statin-intolerant patients experienced muscle pain when they switched to red yeast rice.18
Note that the brand of RYR that you choose is extremely important. The levels of monacolin K (the active ingredient) can vary tremendously in some products, so you never know what dose the patient is getting. For example, in a recent peer-reviewed study of 12 commercially available red yeast rice products, the dose of monacolin K ranged from zero to 10 mg with an average of 2.5 mg.19
The other issue is that some varieties of RYR may contain citrinin, which is a toxic byproduct of the fermentation of the rice. Citrinin is a mycotoxin that has been shown to be toxic to the kidneys. In the study I just mentioned, five out of 12 products had detectable levels of citrinin.
The Thorne product has been shown to have a consistent dose of monacolin K and be free of citrinin.
Tocotrienols Alpha-tocopherol is the form of vitamin E that most people supplement with. However, studies have shown that alpha-tocopherol not only does not reduce the risk of heart disease, it may even be harmful. Tocotrienols are naturally occurring derivatives of tocopherols with much more potent antioxidant activity than tocopherols. Studies have shown that tocotrienols are much more effective in reducing total and LDL cholesterol, but this is true, however, if the formula does not contain more than 20 percent tocopherols.15
The other important consideration is which isomers of tocotrienols are included. Studies have shown that a combination of the delta and gamma isomers is most effective at reducing total cholesterol, LDL, and triglycerides.15
The recommended dose is 200 mg of delta- and gamma-tocotrienols in purified form, preferably from the annatto plant with 90 percent delta- and 10 percent gamma-tocotrienols, taken at night with food. Tocopherol should be less than 20 percent of the total vitamin E consumed per day, otherwise it will inhibit the cholesterol-lowering effect of tocotrienols. Many multivitamins contain alpha-tocopherol or mixed tocopherols, so these should probably be avoided during treatment.
Pantethine Pantethine is a naturally occurring derivative of pantothenic acid, which is vitamin B5 and a precursor of coenzyme A, or CoA. Human studies have shown significant improvement in lipid profiles with pantethine. Total and LDL cholesterol and triglycerides are decreased, and HDL is increased without any known adverse effects.15,16
Pantethine works by increasing the bioavailability of coenzyme A, which in turn reduces synthesis of fatty acids by about 50 percent and cholesterol by 80 percent. Pantethine enhances the removal of arterial cholesterol as well, which reduces plaque formation, endothelial dysfunction, and thickening of the arteries. And pantethine has been shown in some studies to reduce the oxidation of LDL, which is important, since as you know from the e-book, that’s one of the major driving
kresserinstitute.com 22

factors in heart disease. Finally, pantethine is one of the few natural products that increases HDL in addition to reducing LDL and triglycerides. No single pharmaceutical has this capability.
The average dose of pantethine in clinical trials was 900 mg per day, either 300 mg three times a day or 450 mg twice a day. I prefer the 450 mg twice daily dosing for convenience. Note that pantethine does not work overnight. You have to give it at least four months to see significant results. But in some studies that lasted longer, there was a continual improvement in lipids for up to nine months.15
Ubiquinol
Although the research is somewhat mixed, many observational and limited clinical trial results indicate that CoQ10 can partially but not completely reverse myopathy and other adverse effects caused by statins. Although David was not taking a statin, RYR is similar to taking a very low dose of a statin, and I prefer to be conservative and prescribe ubiquinol whenever I prescribe RYR.
One reason for the mixed results in studies may be that the bioavailability of CoQ10 supplements on the market varies considerably. Some are much better absorbed than others. It’s possible that if highly bioavailable forms of CoQ10 were used in all studies, the results would be more consistent.
The Kaneka form has been used in the majority of higher-quality CoQ10 trials in the US in the past 30 years. This is the form that Jarrow uses in their QH-absorb formula, which I’ve had good results with. The dose is 200 mg once a day. Since ubiquinol is fat-soluble, it should always be taken with a meal that contains fat for optimal absorption, and since some patients find it to be stimulating, I typically recommend that they take it with breakfast.
CONCLUSIONS David was a 56-year-old, healthy male who wanted to lower his risk for heart disease. Analysis of underlying factors suggested that SIBO, intestinal permeability, genetics, mercury burden, and H. pylori may have contributed to his high lipid and lipoprotein levels. After three months of treatment for gut dysbiosis and toxic metals, David’s total cholesterol dropped by 31 percent, his LDL cholesterol decreased by 38 percent, his LDL-P dropped by 29 percent, Lp(a) was reduced by 35 percent, and fibrinogen and Lp-PLA2 normalized. This was a phenomenal improvement considering that no cholesterol-lowering medications or supplements were used. Over the following five months, additional treatments to normalize thyroid function and lower his lipids led to complete normalization of his lipids, lipoproteins, and thyroid function markers. This case shows that high cholesterol and lipoproteins can be effectively lowered by addressing underlying causes of dysfunction with natural treatments.
kresserinstitute.com 23

REFERENCES 1. Carlquist JF, Muhlestein JB, Anderson JL. Lipoprotein-associated phospholipase A2: a new
biomarker for cardiovascular risk assessment and potential therapeutic target. Expert Rev Mol Diagn. 2007;7(5):511-517.
2. Stec JJ, Silbershatz H, Tofler GH, et al. Association of fibrinogen with cardiovascular risk factors and cardiovascular disease in the Framingham Offspring Population. Circulation. 2000;102(14):1634-1638.
3. Spencer CA, Hollowell JG, Kazarosyan M, Braverman LE. National Health and Nutrition Examination Survey III thyroid-stimulating hormone (TSH)-thyroperoxidase antibody relationships demonstrate that TSH upper reference limits may be skewed by occult thyroid dysfunction. J Clin Endocrinol Metab. 2007;92(11):4236-4240.
4. Wu J, Tao Y, Gu H, Sui J. Association Between Cardiovascular Risk Factors and Serum Thyrotropin Concentration Among Healthy Chinese Subjects and Subjects with Unsuspected Subclinical Hypothyroidism. Clinical laboratory. 2016;62(5):807-814.
5. Peixoto de Miranda EJ, Bittencourt MS, Pereira AC, et al. Subclinical hypothyroidism is associated with higher carotid intima-media thickness in cross-sectional analysis of the Brazilian Longitudinal Study of Adult Health (ELSA-Brasil). Nutr Metab Cardiovasc Dis. 2016.
6. Souza LL, Guedes EP, Teixeira PF, Moreira RO, Godoy-Matos AF, Vaisman M. Serum TSH levels are associated with cardiovascular risk factors in overweight and obese adolescents. Jornal de pediatria. 2016.
7. Waise A, Price HC. The upper limit of the reference range for thyroid-stimulating hormone should not be confused with a cut-off to define subclinical hypothyroidism. Ann Clin Biochem. 2009;46(Pt 2):93-98.
8. Taylor PN, Razvi S, Pearce SH, Dayan CM. Clinical review: A review of the clinical consequences of variation in thyroid function within the reference range. J Clin Endocrinol Metab. 2013;98(9):3562-3571.
9. Biondi B, Cooper DS. The clinical significance of subclinical thyroid dysfunction. Endocr Rev. 2008;29(1):76-131.
10. Vijayvergiya R, Vadivelu R. Role of Helicobacter pylori infection in pathogenesis of atherosclerosis. World J Cardiol. 2015;7(3):134-143.
11. Patel P, Mendall MA, Carrington D, et al. Association of Helicobacter pylori and Chlamydia pneumoniae infections with coronary heart disease and cardiovascular risk factors. BMJ (Clinical research ed. 1995;311(7007):711-714.
12. Neves AL, Coelho J, Couto L, Leite-Moreira A, Roncon-Albuquerque R, Jr. Metabolic endotoxemia: a molecular link between obesity and cardiovascular risk. J Mol Endocrinol. 2013;51(2):R51-64.
13. You CH, Kim BG, Kim JM, et al. Relationship between blood mercury concentration and waist-to-hip ratio in elderly Korean individuals living in coastal areas. J Prev Med Public Health. 2011;44(5):218-225.
14. Marmugi A, Lasserre F, Beuzelin D, et al. Adverse effects of long-term exposure to bisphenol A during adulthood leading to hyperglycaemia and hypercholesterolemia in mice. Toxicology. 2014;325:133-143.
15. Houston MC, Fazio S, Chilton FH, et al. Nonpharmacologic treatment of dyslipidemia. Prog Cardiovasc Dis. 2009;52(2):61-94.
16. Houston M. The role of nutraceutical supplements in the treatment of dyslipidemia. Journal of clinical hypertension. 2012;14(2):121-132.
17. Sparks WS. Effect of combination pantethine, plant sterols, green tea extract , delta tocotrienols and phytolens on lipid profile in patients with hyperlipidemia. 2009.
18. Becker DJ, Gordon RY, Halbert SC, French B, Morris PB, Rader DJ. Red yeast rice for dyslipidemia in statin-intolerant patients: a randomized trial. Ann Intern Med. 2009;150(12):830-839, W147-839.
kresserinstitute.com 24

19. Gordon RY, Cooperman T, Obermeyer W, Becker DJ. Marked variability of monacolin levels in commercial red yeast rice products: buyer beware! Archives of internal medicine. 2010;170(19):1722-1727.
kresserinstitute.com 25