High cancer prescription drug prices: causes, consequences,...
33
High cancer prescription drug prices: causes, consequences, reform opportunities Rena Conti, PhD Associate Professor Departments of Pediatrics & Public Health Sciences The University of Chicago [email protected]
-
Upload
truongkien -
Category
Documents
-
view
213 -
download
0
Transcript of High cancer prescription drug prices: causes, consequences,...
High cancer prescription drug prices: causes, consequences, reform opportunities
Rena Conti, PhD
Associate Professor
Departments of Pediatrics & Public Health Sciences
The University of Chicago
Acknowledgements and disclaimer
• Financial support: National Cancer Institute, Commonwealth Fund, Arnold Foundation, American Cancer Society, Leukemia and Lymphoma Foundation.
• “Team science”: Peter Bach, Blasé Polite, Robin Yabroff, Ernst Berndt, David Howard, Meredith Rosenthal, Melinda Buntin, Harold Pollack, Robert Gibbons, Stacie Dusetzina.
• I currently serve on the National Academy of Sciences, Engineering, and Medicine Committee “Ensuring Patient Access to Affordable Drug Therapies.”
• Opinions expressed are mine alone, publicly available in a series of peer reviewed publications.
1
We have a shared objective
Our system should ensure patient access to effective treatment
without exacerbating disparities in health and wealth.
2
My agenda
• It’s the prices, stupid: A brief review of current challenges.
• Current incentives in setting drug prices.
• Public outcry creates opportunities for reform.
3
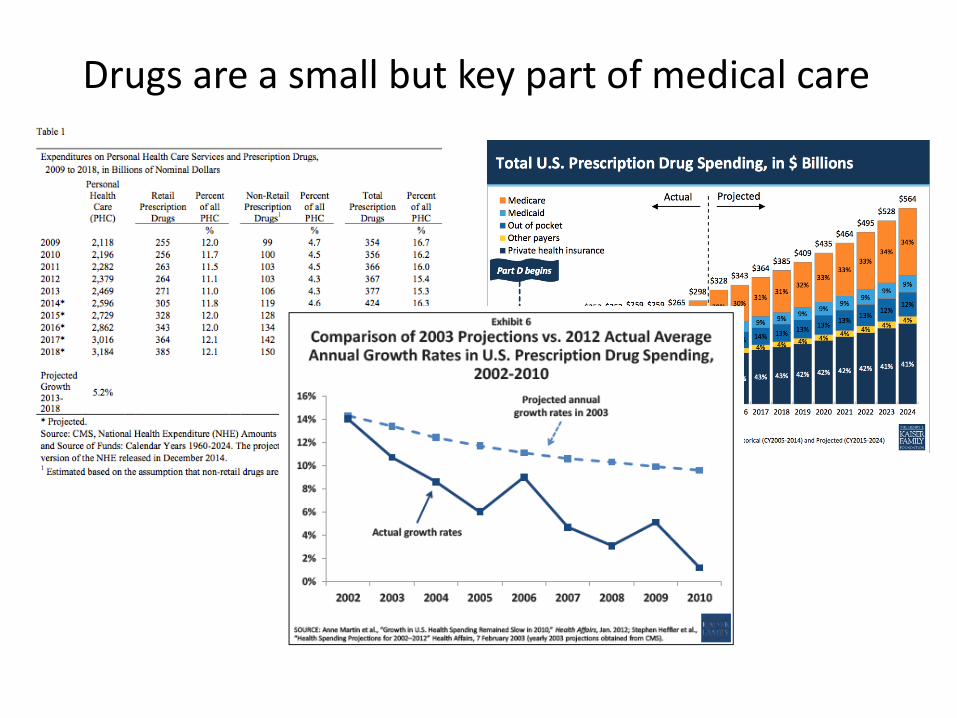
Drugs are a small but key part of medical care
5
6
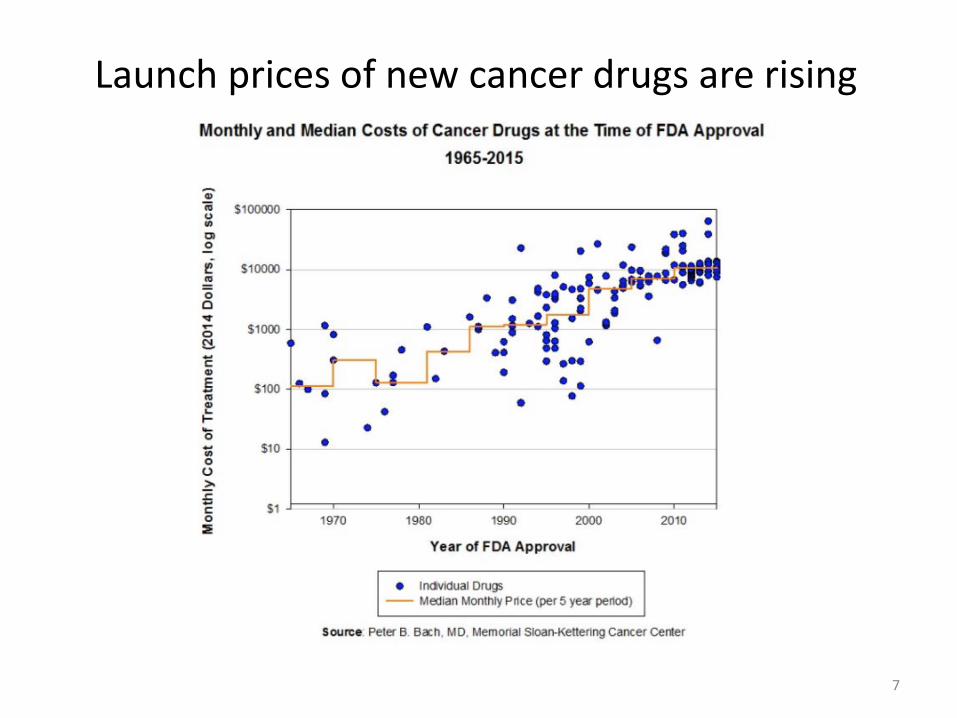
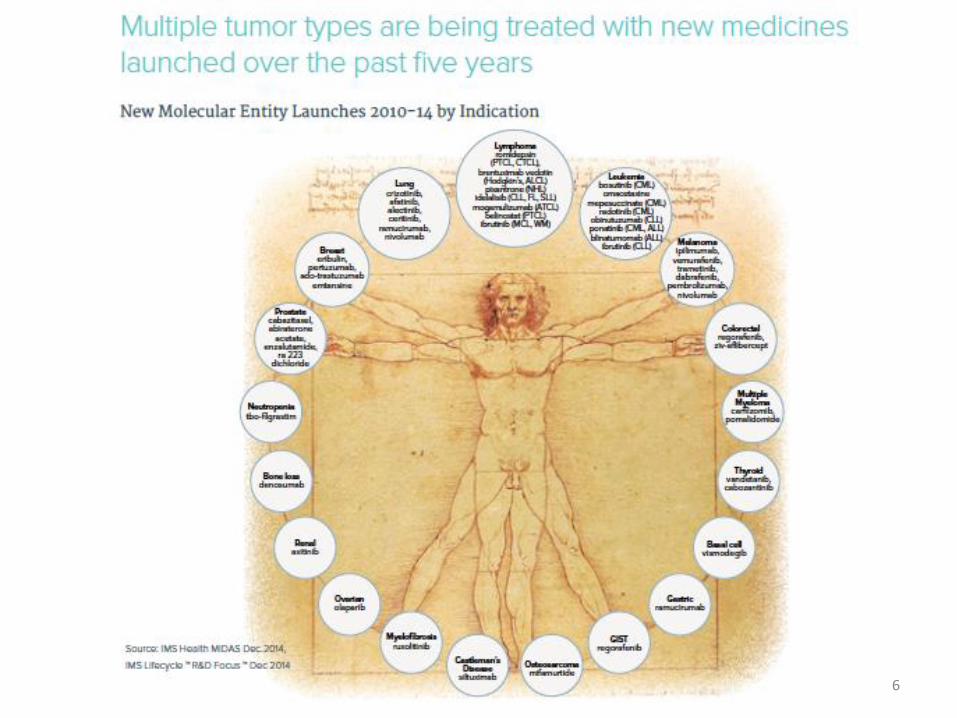
Launch prices of new cancer drugs are rising
7
8
9
Why are prices high and growing?
A closer look at current market incentives.
10
“Monopoly by design”
Patent system encourages innovative activity.
11
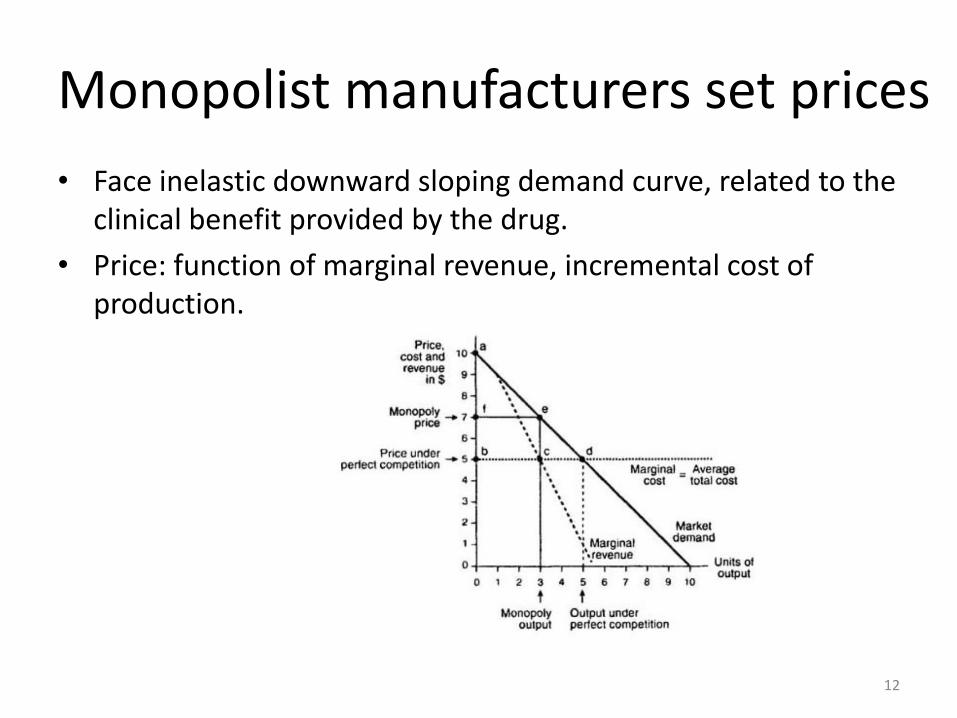
Monopolist manufacturers set prices
• Face inelastic downward sloping demand curve, related to the clinical benefit provided by the drug.
• Price: function of marginal revenue, incremental cost of production.
12
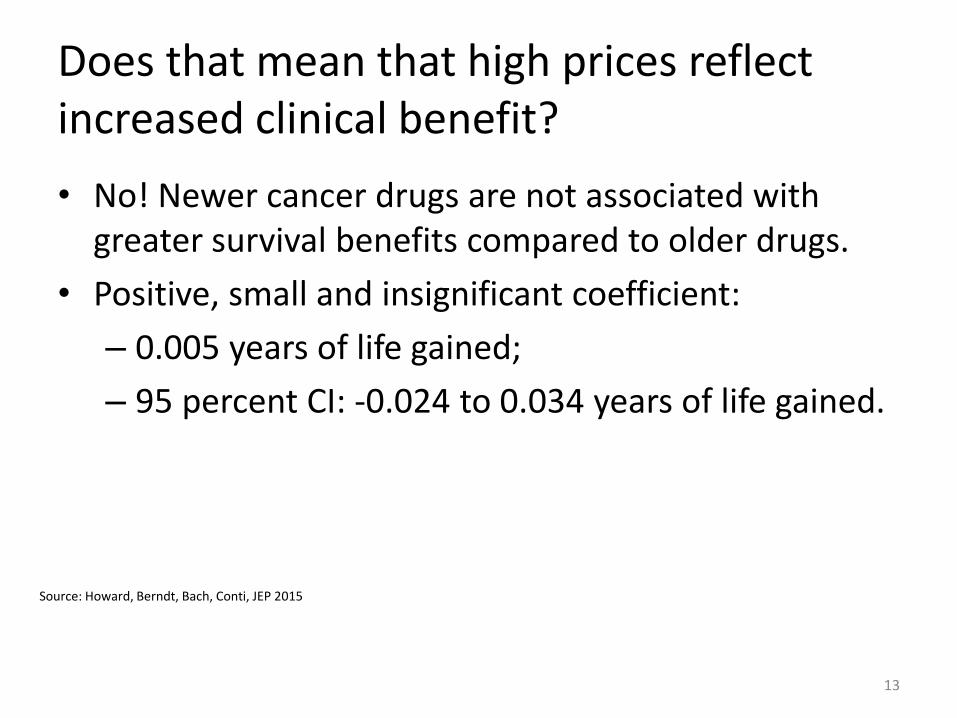
Does that mean that high prices reflect increased clinical benefit?
• No! Newer cancer drugs are not associated with greater survival benefits compared to older drugs.
• Positive, small and insignificant coefficient:
– 0.005 years of life gained;
– 95 percent CI: -0.024 to 0.034 years of life gained.
13
Source: Howard, Berndt, Bach, Conti, JEP 2015
825
0
50
100
150
200
250
300
350
400
450
500
Pri
ce p
er
year
of
surv
ival
ben
efi
t ($
1,0
00
s)
1996 1998 2000 2002 2004 2006 2008 2010 2012 2014
Approval date
Benefit measured from RCT using OS
Benefit measured from RCT using PFS
Benefit measured from modeling study
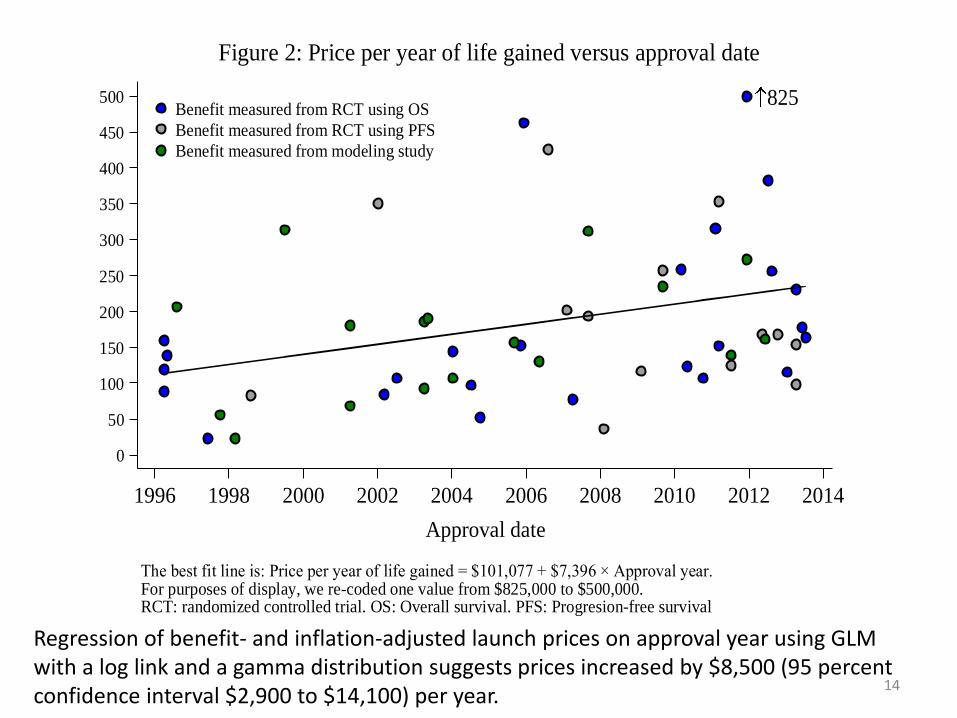
The best fit line is: Price per year of life gained = $101,077 + $7,396 × Approval year.For purposes of display, we re-coded one value from $825,000 to $500,000.RCT: randomized controlled trial. OS: Overall survival. PFS: Progresion-free survival
Figure 2: Price per year of life gained versus approval date
Regression of benefit- and inflation-adjusted launch prices on approval year using GLM with a log link and a gamma distribution suggests prices increased by $8,500 (95 percent confidence interval $2,900 to $14,100) per year.
14
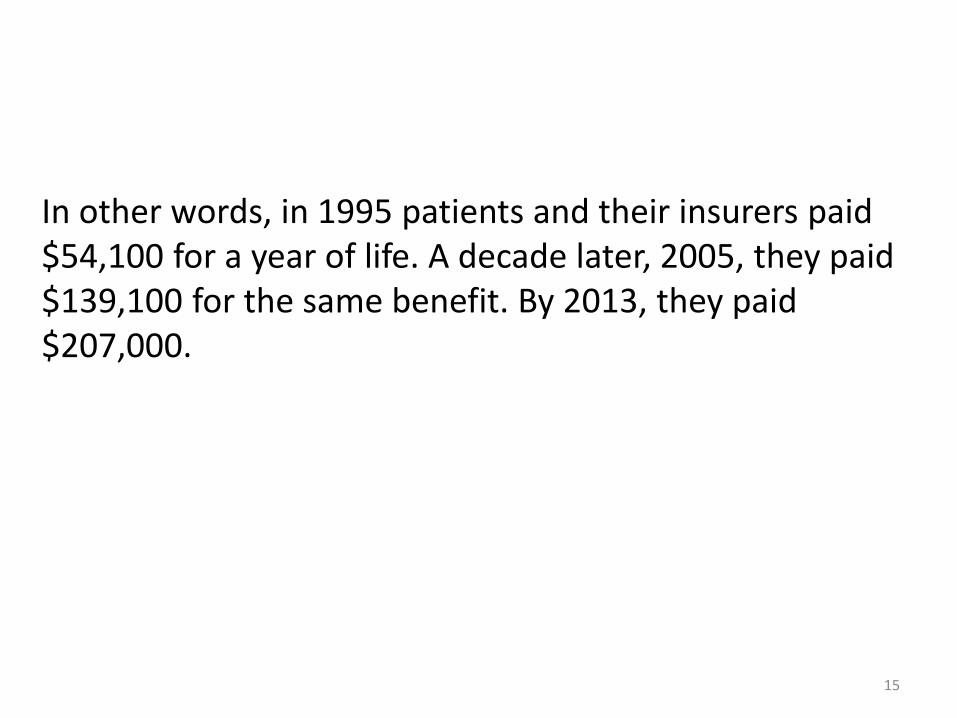
In other words, in 1995 patients and their insurers paid $54,100 for a year of life. A decade later, 2005, they paid $139,100 for the same benefit. By 2013, they paid $207,000.
15
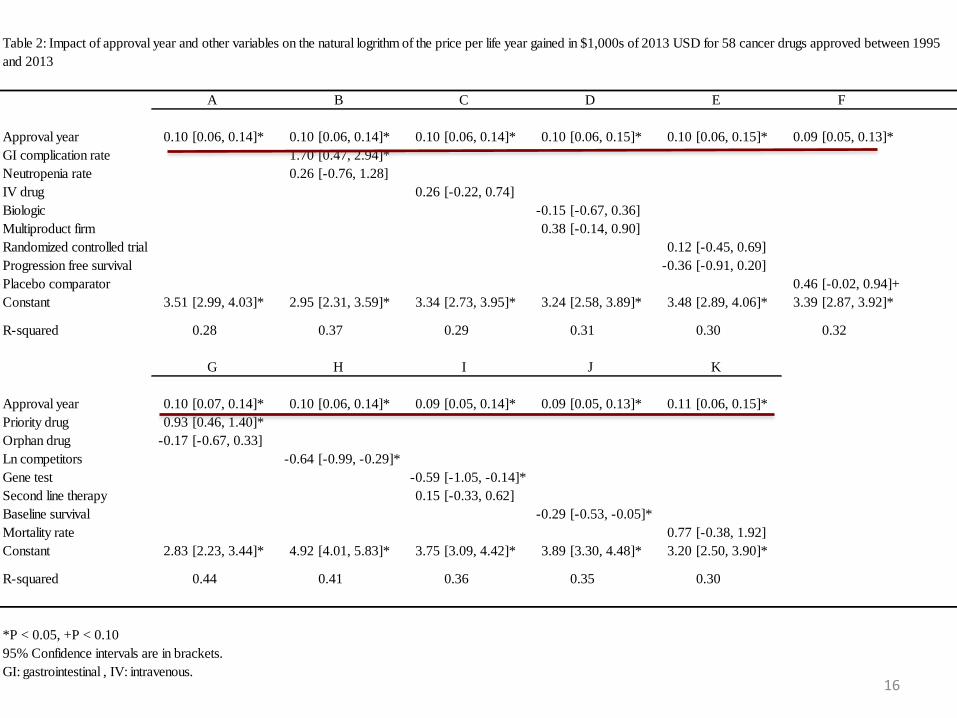
Approval year 0.10 [0.06, 0.14]* 0.10 [0.06, 0.14]* 0.10 [0.06, 0.14]* 0.10 [0.06, 0.15]* 0.10 [0.06, 0.15]* 0.09 [0.05, 0.13]*
GI complication rate 1.70 [0.47, 2.94]*
Neutropenia rate 0.26 [-0.76, 1.28]
IV drug 0.26 [-0.22, 0.74]
Biologic -0.15 [-0.67, 0.36]
Multiproduct firm 0.38 [-0.14, 0.90]
Randomized controlled trial 0.12 [-0.45, 0.69]
Progression free survival -0.36 [-0.91, 0.20]
Placebo comparator 0.46 [-0.02, 0.94]+
Constant 3.51 [2.99, 4.03]* 2.95 [2.31, 3.59]* 3.34 [2.73, 3.95]* 3.24 [2.58, 3.89]* 3.48 [2.89, 4.06]* 3.39 [2.87, 3.92]*
R-squared 0.28 0.37 0.29 0.31 0.30 0.32
Approval year 0.10 [0.07, 0.14]* 0.10 [0.06, 0.14]* 0.09 [0.05, 0.14]* 0.09 [0.05, 0.13]* 0.11 [0.06, 0.15]*
Priority drug 0.93 [0.46, 1.40]*
Orphan drug -0.17 [-0.67, 0.33]
Ln competitors -0.64 [-0.99, -0.29]*
Gene test -0.59 [-1.05, -0.14]*
Second line therapy 0.15 [-0.33, 0.62]
Baseline survival -0.29 [-0.53, -0.05]*
Mortality rate 0.77 [-0.38, 1.92]
Constant 2.83 [2.23, 3.44]* 4.92 [4.01, 5.83]* 3.75 [3.09, 4.42]* 3.89 [3.30, 4.48]* 3.20 [2.50, 3.90]*
R-squared 0.44 0.41 0.36 0.35 0.30
*P < 0.05, +P < 0.10
95% Confidence intervals are in brackets.
GI: gastrointestinal , IV: intravenous.
C D
G H
E F
K
Table 2: Impact of approval year and other variables on the natural logrithm of the price per life year gained in $1,000s of 2013 USD for 58 cancer drugs approved between 1995
and 2013
I J
A B
16
“Obvious” explanations for pricing trends
• Demand:
– Neither increases in income nor the income elasticity of the demand for health care appear to have shifted out.
– Patient cost-sharing is higher now than it was in 1995.
• Supply:
– Production costs likely stable (or decreasing) over time.
– R&D cost are sunk and therefore shouldn’t influence prices (and appear to be declining over time).
17
Other incentives must matter
18
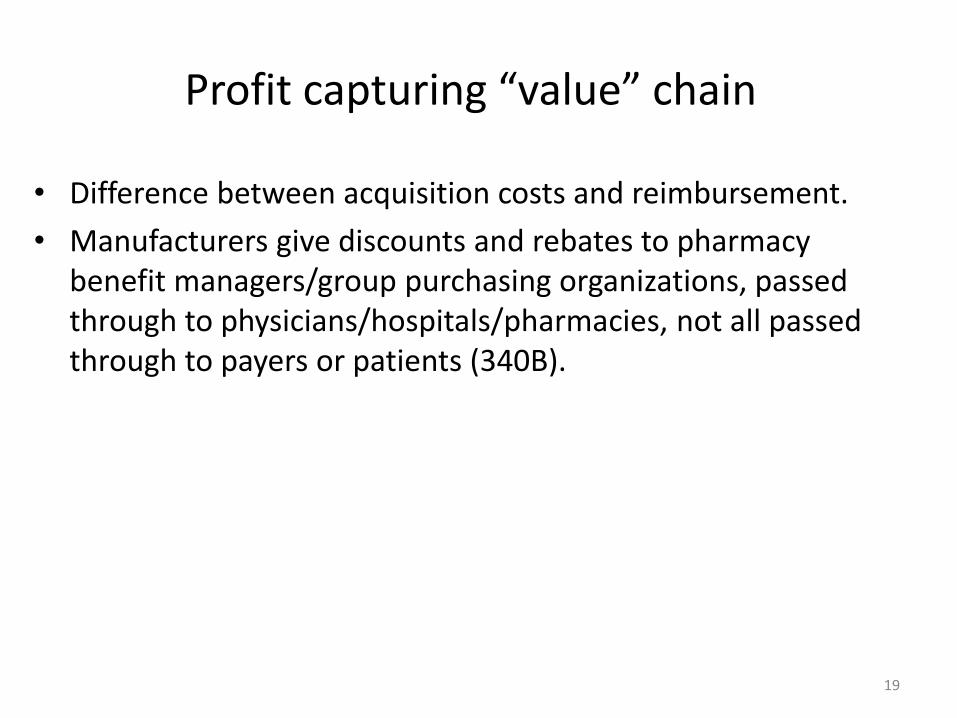
Profit capturing “value” chain
• Difference between acquisition costs and reimbursement.
• Manufacturers give discounts and rebates to pharmacy benefit managers/group purchasing organizations, passed through to physicians/hospitals/pharmacies, not all passed through to payers or patients (340B).
19
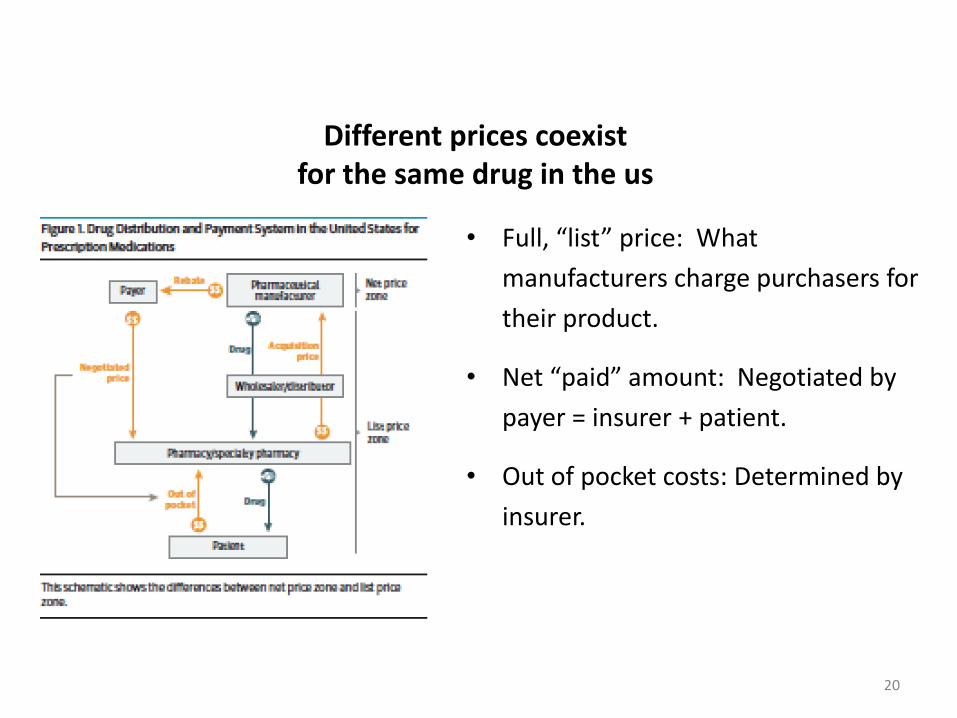
Different prices coexist for the same drug in the us
• Full, “list” price: What
manufacturers charge purchasers for
their product.
• Net “paid” amount: Negotiated by
payer = insurer + patient.
• Out of pocket costs: Determined by
insurer.
20
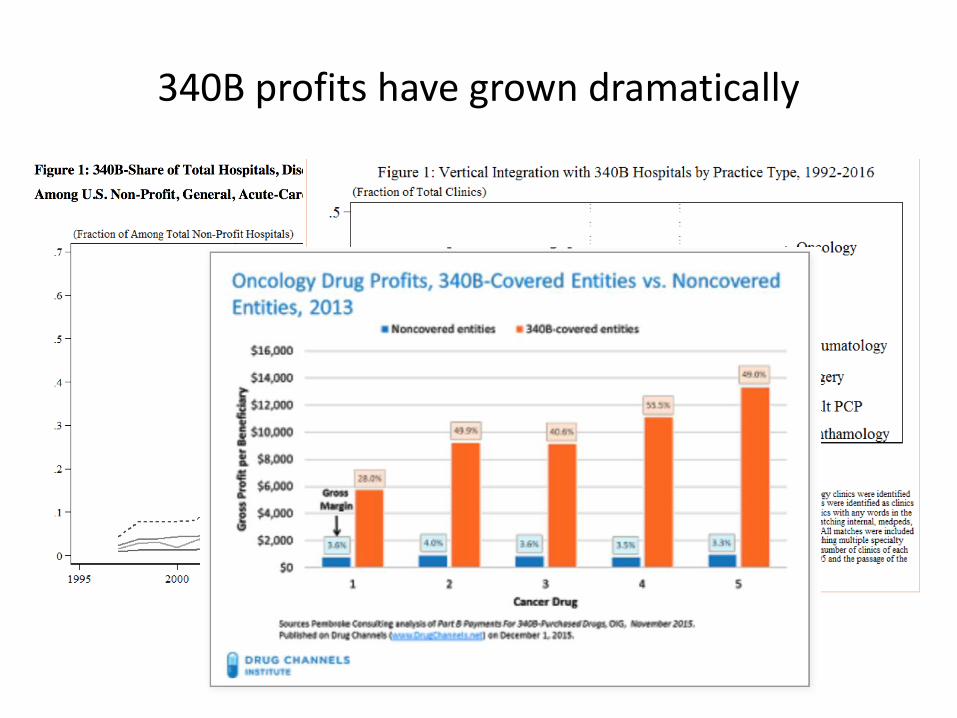
340B profits have grown dramatically
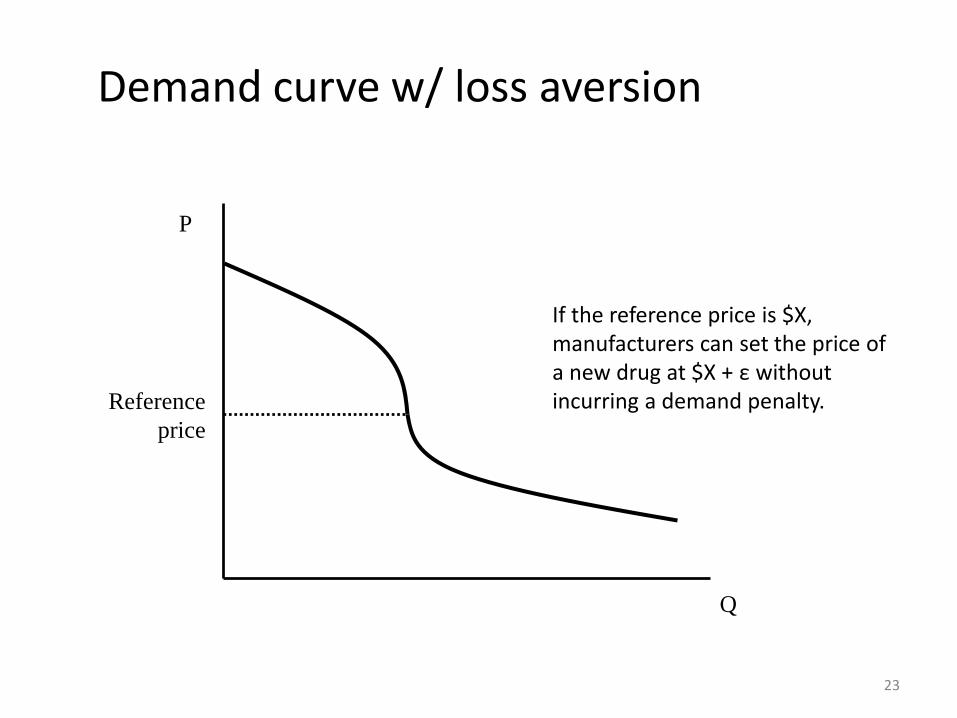
We speculate manufacturers practice “reference pricing” at launch, build in
discounts into list price setting• MDs/hospitals/pharmacies have no direct incentive to avoid
costly drugs, face some incentive to use costly drugs, – But balk at using drugs with prices they perceive as
unreasonable.• Perceptions of unreasonableness are malleable and influenced
by the prices of previously approved drugs – a reference price!– Not necessarily within class or disease because limited entry
(winner take all markets).
22
Q
P
Reference
price
Demand curve w/ loss aversion
23
If the reference price is $X, manufacturers can set the price of a new drug at $X + ε without incurring a demand penalty.
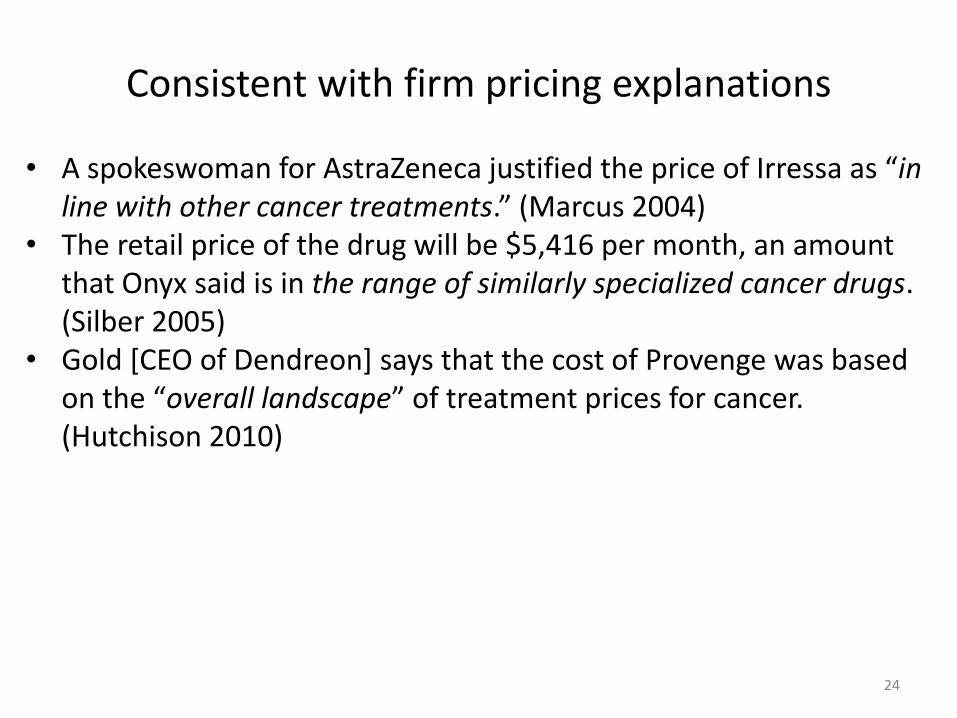
Consistent with firm pricing explanations
• A spokeswoman for AstraZeneca justified the price of Irressa as “in line with other cancer treatments.” (Marcus 2004)
• The retail price of the drug will be $5,416 per month, an amount that Onyx said is in the range of similarly specialized cancer drugs. (Silber 2005)
• Gold [CEO of Dendreon] says that the cost of Provenge was based on the “overall landscape” of treatment prices for cancer. (Hutchison 2010)
24
25
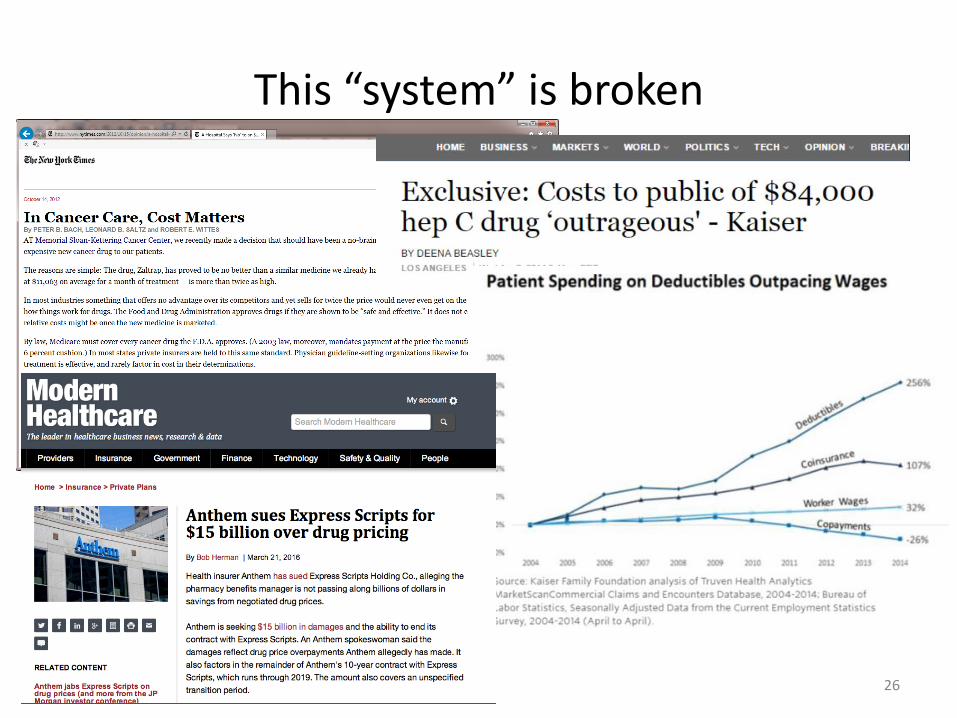
This “system” is broken
26
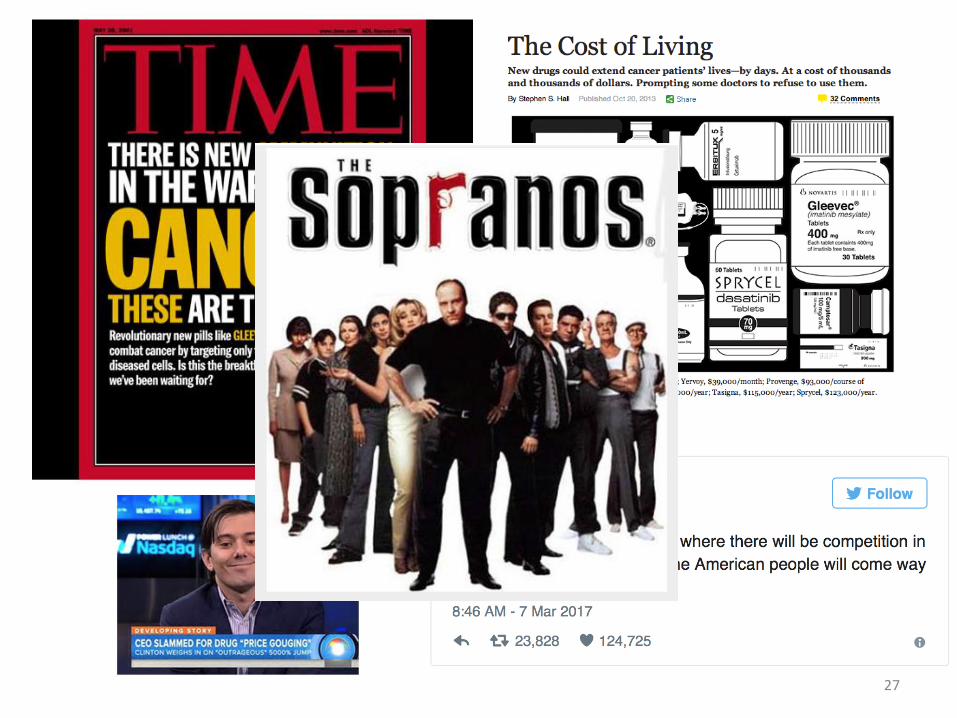
27
28
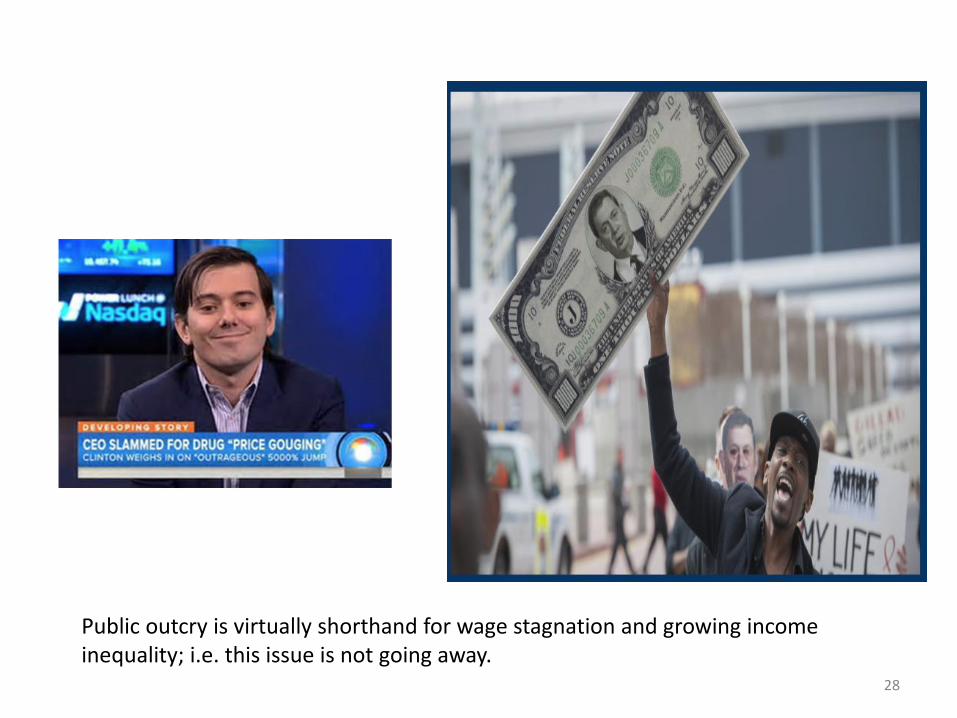
Public outcry is virtually shorthand for wage stagnation and growing income inequality; i.e. this issue is not going away.
Standing on the verge
Public outcry creates an opportunity for reform.
In such a complex system, there are no silver bullets.
29
Best reforms will embody three principals
1) Finance innovation related to public health.
2) Improve patient access/affordability.
3) Improve transparency, reduce profit seeking.
30
"We stand in the midst of medicines too costly to be sustainable members of our therapeutic armamentarium...All of us -- those who discover, develop, manufacture, regulate, market, pay for, prescribe
and take medicines -- ’own’ the responsibility to ensure access to the very best medicine and science have to offer.”
-Stephen Spielberg. Editor-in-Chief’s Commentary: Integrating
Economics Into Innovation. Therapeutic Innovation & Regulatory Science July 2013 47: 395-396.
31
I’m happy to discuss, debate and provide more detail.
Thank you.
32