HIFiRE-5 Flight Vehicle Design - NASA · 2013-04-10 · Figure 6 illustrates the nominal trajectory...
17
American Institute of Aeronautics and Astronautics 1 HIFiRE-5 Flight Vehicle Design Roger L. Kimmel * David Adamczak † Air Force Research Laboratory, 2130 8 th St., WPAFB, OH 45433 Karen Berger ‡ , Meelan Choudhari § NASA Langley Research Center, Hampton, VA 23681 The Hypersonic International Flight Research Experimentation (HIFiRE) program is a hypersonic flight test program executed by the Air Force Research Laboratories (AFRL) and Australian Defence Science and Technology Organization (DSTO). HIFiRE flight 5 is devoted to measuring transition on a three-dimensional body. This paper summarizes payload configuration, trajectory, vehicle stability limits and roughness tolerances. Results show that the proposed configuration is suitable for testing transition on a three-dimensional body. Transition is predicted to occur within the test window, and a design has been developed that will allow the vehicle to be manufactured within prescribed roughness tolerances. I. Nomenclature C m = pitching moment AoA = angle of attack D = leading edge diameter k = roughness height L = reference length, 0.861 m M = Mach number Re = Reynolds number R = Reynolds number based on reference length scale and spanwise velocity, e e v / R = Reynolds number based on reference length scale at reference temperature T*, * * / e e v s = chordwise coordinate along swept cylinder T* = reference temperature, Ref. 37 U = freestream velocity u = chordwise velocity v = velocity tangential to attachment line on swept cylinder x = coordinate along model long axis (Figure 2) y = coordinate along model semi-minor axis (Figure 2) z = coordinate along model semi-major axis (Figure 2) = angular model coordinate (Figure 2) = boundary layer displacement thickness = boundary layer momentum thickness = length scale, ds du e e Subscripts = freestream, upstream of the model bow shock L = based on model reference length * Principal Aerospace Engineer, Associate Fellow AIAA. † Senior Engineer, Member AIAA ‡ Aerospace Engineer, Aerothermodynamics Branch, MS 408A, Senior Member AIAA § Aerospace Technologist, Computational AeroSciences Branch, MS 128, Associate Fellow AIAA. https://ntrs.nasa.gov/search.jsp?R=20100026402 2020-03-13T03:00:10+00:00Z
Transcript of HIFiRE-5 Flight Vehicle Design - NASA · 2013-04-10 · Figure 6 illustrates the nominal trajectory...

American Institute of Aeronautics and Astronautics
1
HIFiRE-5 Flight Vehicle Design
Roger L. Kimmel* David Adamczak† Air Force Research Laboratory, 2130 8th St., WPAFB, OH 45433
Karen Berger‡, Meelan Choudhari§ NASA Langley Research Center, Hampton, VA 23681
The Hypersonic International Flight Research Experimentation (HIFiRE) program is a hypersonic flight test program executed by the Air Force Research Laboratories (AFRL) and Australian Defence Science and Technology Organization (DSTO). HIFiRE flight 5 is devoted to measuring transition on a three-dimensional body. This paper summarizes payload configuration, trajectory, vehicle stability limits and roughness tolerances. Results show that the proposed configuration is suitable for testing transition on a three-dimensional body. Transition is predicted to occur within the test window, and a design has been developed that will allow the vehicle to be manufactured within prescribed roughness tolerances.
I. Nomenclature Cm = pitching moment AoA = angle of attack D = leading edge diameter k = roughness height L = reference length, 0.861 m M = Mach number Re = Reynolds number
R = Reynolds number based on reference length scale and spanwise velocity, eev / R = Reynolds number based on reference length scale at reference temperature T*,
** / eev
s = chordwise coordinate along swept cylinder T* = reference temperature, Ref. 37 U = freestream velocity u = chordwise velocity v = velocity tangential to attachment line on swept cylinder x = coordinate along model long axis (Figure 2) y = coordinate along model semi-minor axis (Figure 2) z = coordinate along model semi-major axis (Figure 2) = angular model coordinate (Figure 2) = boundary layer displacement thickness = boundary layer momentum thickness = length scale, dsduee
Subscripts = freestream, upstream of the model bow shock L = based on model reference length
* Principal Aerospace Engineer, Associate Fellow AIAA. † Senior Engineer, Member AIAA ‡ Aerospace Engineer, Aerothermodynamics Branch, MS 408A, Senior Member AIAA § Aerospace Technologist, Computational AeroSciences Branch, MS 128, Associate Fellow AIAA.
https://ntrs.nasa.gov/search.jsp?R=20100026402 2020-03-13T03:00:10+00:00Z

American Institute of Aeronautics and Astronautics
2
e = boundary layer edge conditions Superscripts * = evaluated at reference temperature T*
II. Introduction The Hypersonic International Flight Research Experimentation (HIFiRE) program is a hypersonic flight test
program executed by the Air Force Research Laboratory (AFRL) and the Australian Defence Science and Technology Organization (DSTO).1,2 Its purpose is to develop and validate technologies critical to next generation hypersonic aerospace systems. Candidate technology areas include, but are not limited to, propulsion, propulsion-airframe integration, aerodynamics and aerothermodynamics, high temperature materials and structures, thermal management strategies, guidance, navigation, and control, sensors, and weapon system components such as munitions, submunitions, avionics, and weapon system separation. The HIFiRE program consists of extensive ground tests and computation focused on specific hypersonic flight technologies. Each technology program culminates in a flight test. HIFiRE-5 is the second of two flights in the HIFiRE manifest focused on boundary layer transition. The HIFiRE-1 program created an extensive knowledge base regarding transition on axisymmetric bodies that has been summarized in numerous prior publications.3,4,5,6,7,8,9,10,11,12,13,14 The HIFiRE-5 flight is devoted to measuring transition on a three-dimensional (3D) body.
Extended hypersonic flight with lifting configurations requires improved understanding and prediction of 3D transition. Transition on 3D configurations embodies several phenomena not encountered on axisymmetric configurations like HIFiRE-1, including leading-edge or attachment-line transition and crossflow instabilities (including crossflow interactions with other instability mechanisms shared with axisymmetric flow configurations such as first and second mode instabilities). Very limited hypersonic flight data exist for either phenomena.15 The need for a better understanding of 3D transition motivates the HIFiRE-5 experiment. This paper describes how the HIFIRE-5 overall vehicle configuration has been designed, including booster, trajectory, aerodynamic stability and aeroshell outer moldline design to meet requirements to measure 3D transition.
III. Vehicle and Trajectory
A. Vehicle Description The HIFiRE-5 configuration consists of a payload mounted atop an S-30 first stage16 and Improved Orion17
second stage motor, shown in Figure 1. The term “payload” refers to all test equipment mounted to the second stage booster, including the instrumented test article and additional control and support sections situated between the test article and the second stage motor. The test article consists of a blunt-nosed elliptic cone of 2:1 ellipticity, 0.86 meters in length. The payload does not separate from the second-stage Orion, and remains attached to it throughout the reentry. The vehicle is spin-stabilized. Cant-angle on the first and second-stage fins causes the vehicle to spin passively. Because of this, the payload is rolling throughout the entire trajectory.
The elliptic cone configuration was chosen as the test-article geometry based on extensive previous testing and analysis on elliptic cones.18,19,20,21,22,23,24,25 This prior work18,19,20 demonstrated that the 2:1 elliptic cone would generate significant crossflow instability at the flight conditions and potentially exhibit leading-edge transition. The 2:1 elliptic cone configuration also possesses ample internal volume for sensors and instrumentation. In order to exploit this prior body of work and expedite configuration development, the 2:1 elliptical geometry was selected as the HIFiRE-5 test article. Figure 2 illustrates the elliptic cone geometry and coordinate system.
Figure 3 presents a dimensioned drawing of the payload, including nosetip detail. The half-angle of the elliptic cone test article in the minor axis (x-y) plane is seven degrees, and 13.797 degrees in the major axis. The nose tip cross-section in the minor axis is a 2.5 mm radius circular arc, tangent to the cone ray describing the minor axis, and retains a 2:1 elliptical cross-section to the stagnation point. The elliptic cone major axis diameter is 431.8 mm at the base, and the cone overhangs the 355.6 mm diameter second-stage booster in the yaw (x-z) plane. A section with minimal instrumentation blends the elliptical cone cross-section into the circular booster cross section. Small canards for material tests may be incorporated on the transition section. A cylindrical can containing GPS, antennas and other equipment resides between the transition section and the Orion booster. The vehicle is stable in yaw and pitch planes as described below, and no shroud is currently envisioned.

American Institute of Aeronautics and Astronautics
3
S-30
Orion
Can
Transition Section
Payload
Figure 1 HIFiRE-5 stack.
x
y
z
Pitch Plane
Yaw Plane
U
Figure 2 Elliptic cone geometry and coordinate system.
American Institute of Aeronautics and Astronautics
4
Figure 3 HIFiRE-5 payload, including nosetip detail (dimensions in mm).
The advantage of designing the HIFiRE 5 without a shroud over the payload was that it simplifies the payload
mechanical design, reduces weight and removes the risk of shroud-deployment failure. Flight without a shroud however incurs some risk to the payload through ascent heating and exposure of the test article sensors. The HIFiRE-0 risk-reduction flight demonstrated that flight-control sensors would withstand ascent heating26 on the Terrier / Improved Orion stack27 used for HIFiRE-0 and -1. Since the ascent characteristics of the S-30 first-stage booster are much more benign than the Terrier first-stage used on HIFiRE-0 and -1, thermal loads on instrumentation during ascent should be acceptable. Although the HIFiRE-5 test article produces no lift at zero angle-of-attack, the non-axisymmetric test article possesses different pitch-plane and yaw-plane aerodynamics, which was a source of concern. Because of this, the HIFiRE-5 aerodynamics were examined in detail using Missile Datcom semi-empirical methods28,29 and the CART3D Euler solver.30 Figure 4 illustrates the asymmetric aerodynamics of the reentry configuration. Aerodynamics were obtained with Missile Datcom, using the aerodynamics and mass properties of the reentry stack consisting of the burnt-out second stage and payload at Mach 7. Figure 4 shows the effect of roll angle on pitching moment for the two extremes, 0-deg (least stable) and 90-deg (most stable). Although windward-side pressures are less on the 0-deg roll case, the 0-deg case is less stable than the 90-deg case due to the greater lifting area it introduces at the nose.
Figure 5 compares pitching moments obtained using Datcom and CART3D for the reentry configuration. Two center-of-gravity (CG) locations are considered for each method, an aft CG (x=3.426 m) and a more forward CG (x=2.837 m) obtained by ballasting the vehicle to make it neutrally stable at Mach 10, based on the Datcom-calculated center-of-pressure. These CGs are representative only, since the final CG will vary as the design evolves. These results are for the 0-deg (least stable) roll angle. Datcom indicates a less-stable vehicle than does CART3D over the Mach number range examined, 2 < M < 8. Both methods indicate reduced stability as Mach number increases. Although the Euler analysis is expected to be more accurate than Datcom, which is semi-empirical, the Datcom results are more conservative and were thus used to analyze the vehicle stability. The final HIFiRE-5 design incorporates 33 kg of ballast to retain a 1.5 caliber static margin throughout ascent, based on Datcom estimates. Based on observed differences between CART3D and Datcom results, the actual static margin is expected to be 1.8- 2 calibers at 0-deg roll angle. Since this is based on the least-stable roll configuration, it represents a minimum expected stability.

American Institute of Aeronautics and Astronautics
5
HIFiRE 5 Aerodynamics
-18
-16
-14
-12
-10
-8
-6
-4
-2
0
2
4
-5 0 5 10 15 20
Alpha
Cm
- P
itch
ing M
om
ent C
oef
ic
Roll 0deg
Roll 90deg
Roll 0deg
Roll 90deg
Figure 4 Pitching moment as a function of angle of attack and roll attitude.
HIFiRE 5 Pitch Stability
-1.800
-1.600
-1.400
-1.200
-1.000
-0.800
-0.600
-0.400
-0.200
0.000
0.200
0.400
0.0 2.0 4.0 6.0 8.0 10.0 12.0
Mach
cm
alp
ha
(p
er
de
g)
aft cg
cart3d aft cg
fw d cg
cart3d fw d cg
Figure 5 Comparison of predicted pitch moments for 0-deg roll angle using Datcom (purple lines) and
CART3D (blue lines) The HIFiRE-5 trajectory was simulated with the vehicle aerodynamics obtained from the Euler solver CART3D.
Figure 6 illustrates the nominal trajectory for a launcher quadrant elevation (angle above horizon) of 81.65 deg. The high launch angle serves two purposes. First it constrains the range of the missile. Second, it limits the reentry exposure and heating of the test article. In this nominal trajectory, the S-30 / Orion stack boosts the test article to approximately 266 km, with a peak reentry Mach number of 7.4. The predicted second-stage impact is approximately 350 km downrange of the launcher. Total endoatmospheric flight time is less than eighty seconds.
The high launch angle also aids in transition measurement. Successful transition measurement requires that the transition occur on the instrumented region of the test article at some point during the trajectory. The high launch angle trajectories used in HIFiRE-1 and 5 are ideal for this since it creates a flight environment analogous to a wind tunnel Reynolds number sweep. Mach number varies less than +/- 0.15 during the period of expected transitional

American Institute of Aeronautics and Astronautics
6
flow over the test article during reentry. Figure 7, which illustrates the Reynolds number and Mach number profiles during ascent and descent, shows the Reynolds number sweep that occurs during reentry.
Figure 6 HIFiRE 5 trajectory
Figure 7 HIFiRE-5 Reynolds number and Mach profile

American Institute of Aeronautics and Astronautics
7
The entire reentry vehicle (payload plus second stage) is aerodynamically stable and will self-orient into a nose-first attitude during reentry upon achieving sufficient dynamic pressure, regardless of any control inputs. In general, the missile will be spinning and precessing (coning) throughout flight. In the absence of any control input, the payload will reenter the atmosphere nose high relative to the flight-path vector. When the dynamic pressure is high enough, the vehicle will orient into a low AoA attitude since it is statically stable. Figure 8 illustrates this situation. The top graph shows the flight-path angle of the vehicle center of mass (relative to the horizon) and total pitch angle (relative to the horizon). This simulation is for a case in which the mean pitch angle is 75-deg, and the coning half angle is 6-deg. Asymmetric aerodynamics due to the test article geometry are taken into account. Apogee is at 270 seconds. The vehicle’s motion continues unimpeded until approximately 460 seconds, when rapidly increasing air density causes the pitch angle to rather suddenly align approximately with the flight path angle. Pitch oscillations increase and then begin to damp. Note that the flight path angle varies continuously due to the ballistic nature of the trajectory. The bottom graph of Figure 8 details pitch and yaw angle during the last 13 seconds of the trajectory and illustrates this damping. Since the vehicle is spinning, pitch and yaw are 90-deg out of phase.
time
ga
mm
ar,
pitr
300 350 400 450 500
-80
-60
-40
-20
0
20
40
60
80
gammarpitr
time
be
ta,a
lph
a
490 492 494 496 498 500 502 504-20
-10
0
10
20betaalpha
Figure 8 Flight-path angle and total pitch angle (top), and yaw and pitch (bottom) for reentry with no control
inputs. In order to achieve a low angle of attack and minimize oscillations within the atmosphere during reentry, a
nitrogen-jet reaction control system will align the vehicle during exoatmospheric flight, so the vehicle longitudinal axis is approximately coincident with the reentry flight path vector, minimizing the coning angle. In the HIFiRE-0 flight, this system was capable of aligning the vehicle to within 5.1 deg of the flight path angle and zero coning angle.26 The maximum allowable angle of attack when transitional flow occurs on the test article sets requirements on the pointing accuracy of the exoatmospheric cold-gas thruster maneuver. The primary variables of concern are the residual coning (or precession) angle and the pitch angle at the end of the cold-gas thruster maneuver. In order to determine the pitch and coning angle required to minimize total AoA during testing, residual pitch angle and coning angle were varied parametrically over a range of expected values, and used as initial conditions for 6DOF simulations.
American Institute of Aeronautics and Astronautics
8
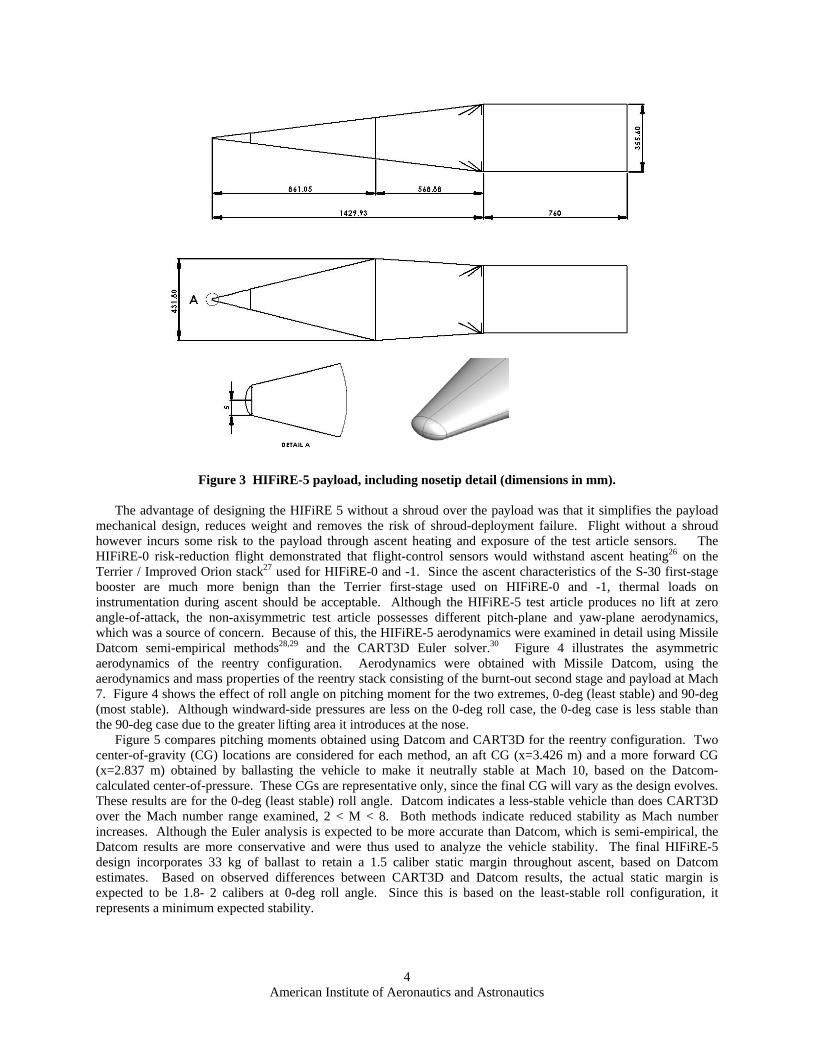
Numerous 6DOF simulations showed that best results were obtained at zero coning angle, and that the optimum pitch angle was near the flight path angle that occurs near the atmospheric interface (approximately –70-deg at 460 seconds for this trajectory). Figure 9 shows an example for a pitch angle of -70-deg and a coning angle of half-cone two degrees. Since the pitch angle is near the flight path angle at atmospheric interface, and the cone angle is small, AoA oscillations are small and have damped to less than +/- 1 deg by 490 seconds. A 6-DOF simulation for pitch angle of -70-deg but 6-deg coning half-angle, yielded AoA oscillations of +/- 2 deg. These results are in contrast to expected AoA oscillations greater than 20-deg for no thruster control (Figure 8). It should be noted that even for the case of no control inputs, oscillations have damped to less than +/- 5 deg by 502 seconds.
time
ga
mm
ar,
pitr
300 350 400 450 500
-80
-60
-40
-20
0gammarpitr
time
be
ta,a
lph
a
490 492 494 496 498 500 502 504-6
-4
-2
0
2
4
6betaalpha
Figure 9 Flight-path angle and total pitch angle (top), and yaw and pitch (bottom) for reentry with pitch
angle -70 deg and 2-deg coning half-angle.
There is no test window per se during the HIFiRE-5 flight, since data are acquired and telemetered continuously throughout ascent and descent. However, the beginning of the useful reentry test period is defined by the highest altitude at which transition may be expected. The end of the effective test window occurs either where the vehicle fails structurally due to combined aerothermal loads, or flow over the vehicle is fully turbulent. The HIFiRE-0 vehicle departed from stable flight at approximately 19 km, probably due to fin failure, although roll anomalies occurred as high as 23 km.26 An important goal of the HIFiRE-5 analysis and ground test was to determine probable transition altitudes.
Transition altitudes were determined from wind tunnel results and stability calculations. 31 Presumably, wind tunnel results will be biased towards lower transition Reynolds numbers due to tunnel noise32 and provide an upper altitude (lower Reynolds number) bound for transition. N-factor correlations, using expected correlating values for flight (approximately 8-12), should give lower altitude (higher Reynolds number) bounds on transition. Of interest are the highest altitude at which transition may be expected, and the altitude at which flow is turbulent from the most upstream sensors, a case in which the entire vehicle is turbulent and no boundary layer transition data is provided. Determination of altitude transition bounds is complicated by the dramatic difference between the test-article centerline stability and leading edge stability. Transition altitudes are thus bounded by high altitude, earliest and latest transition estimates, and low altitude, earliest and latest transition estimates, each for centerline and leading edge.
American Institute of Aeronautics and Astronautics
9
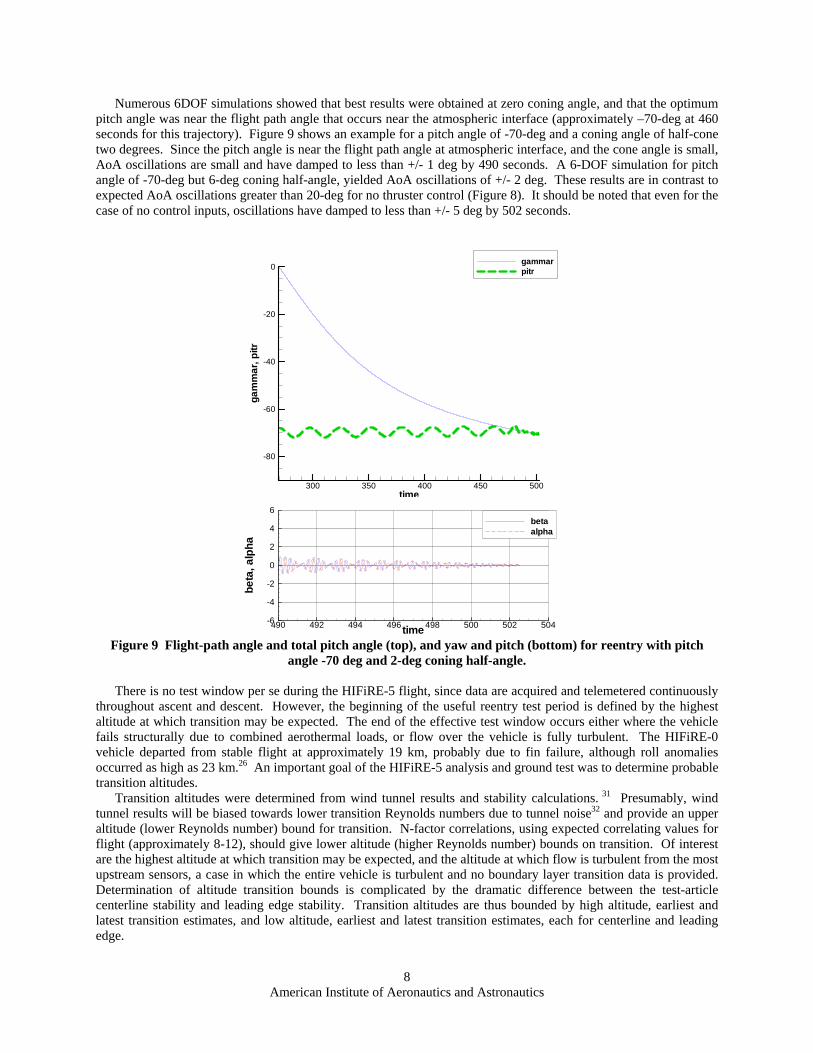
Figure 10 shows centerline transition Reynolds numbers derived from NASA LaRC Mach 6 wind tunnel heat transfer data.33 The transition Reynolds numbers were extracted by plotting measured heat transfer rates in log-log coordinates. A straight line was fit to the sensibly laminar portion of the data, and another to the transitional portion of the data. The lower bound on transition is taken as the point where heat transfer first deviates from the laminar trend, and the upper bound is taken as where the two extrapolated lines intersect. There is a strong and probably spurious trend in transition Reynolds number with tunnel unit Reynolds number. Although the “unit Reynolds number effect” has been observed and speculated upon for many years, the general consensus is that it seems to be an artifact related to wind tunnel noise.32 Centerline transition Reynolds numbers are thus expected to lie between 6x10⁵ and 1.8x10⁶. With a smooth leading edge surface, transition was observed only under a small number of test conditions corresponding to higher Reynolds numbers within the test matrix. No unit Reynolds number effect was observed in the leading edge transition Reynolds numbers (due either to the limited data set or true flow physics). Leading edge transition Reynolds numbers obtained by the same method (based on freestream conditions and leading edge diameter) ranged from 4.5x10⁵ to 5.8x10⁵.
Figure 10 Centerline transition Reynolds numbers from wind tunnel data
The expected extreme ranges for transition on HIFiRE-5 are plotted on Reynolds-number versus altitude maps in
Figure 11. Figure 11 plots length Reynolds number (based on freestream conditions and overall reference length L=0.861m) on the left, and leading edge diameter Reynolds number (based on freestream conditions and diameter at the base of the test article at x = 0.861 m) on the right. The black line indicates the Reynolds number during reentry obtained from trajectory simulation. In both plots a green line is superimposed to indicate the expected range of altitudes at which transition may begin near the base of the cone. The extent of this region is determined by the transition Reynolds numbers derived from wind tunnel data described above. A red line is superimposed to indicate where transition is expected to move upstream of the forward sensors at x=0.3 m, again as derived from wind tunnel data. The green and red points indicate these respective altitudes as derived from PSE computations. Freestream-based Reynolds numbers can only serve as relatively crude surrogates for more sophisticated N-factor correlations, but since the Mach number, wall-temperatures and angle of attack vary very little over the trajectory range of interest, these Reynolds numbers are adequate for engineering estimates.
In contrast to the wind tunnel data, which shows earliest transition on the centerline, stability calculations indicate that leading edge and centerline transition will occur at nearly identical Reynolds numbers. This was observed in higher-Reynolds number cases tested at CUBRC.34 If transition occurs at the extreme low-limit of Reynolds number (6x10⁵) this would correspond to an altitude of 39.4 km (492.5 sec). A more plausible transition altitude would be that derived from PSE stability analysis, corresponding to a length Reynolds number of 3.7x10⁶.

American Institute of Aeronautics and Astronautics
10
This altitude is 28.3 km, occurring at 497.9 seconds. Figure 9 indicates that if the vehicle is properly aligned by the bang-bang maneuver, AoA of less than one degree may be achieved at 39.4 km altitude.
x10-5
Figure 11 Length Reynolds number (left) and leading edge diameter Reynolds number (right) as functions of altitude.
IV. Thermal Analysis The design tools MINIVER35, HEAT-TK36 and TOPAZ3D were used to develop the vehicle heat transfer and
temperature profiles. MINIVER employs analytical and semi-empirical engineering methods to determine heat transfer throughout the trajectory. TOPAZ3D is a three-dimensional, finite-element solver for unsteady conduction problems. TOPAZ3D was used to provide higher fidelity results for the conduction analysis rather than MINIVER, which contains a 1D conduction solver. The MINIVER conduction analyses provided spot checks of the TOPAZ3D results where lateral conduction was not significant. Detailed thermal analysis was performed by porting the MINIVER heat transfer coefficients to TOPAZ3D, and then using TOPAZ3D to determine the payload temperature field as a function of time using a convection boundary condition on the vehicle exterior and adiabatic interior wall. Boundary-layer transition was taken into account using Re/Me correlation, with Re/Me =150 corresponding to the beginning of transition, and Re/Me =212 corresponding to the end of transition. The Re/Me correlation is well-known for having a large uncertainty, even for simple axisymmetric configurations (see for example Ref. 5), but it provides a simple means to account for transition during the preliminary design of HIFiRE-5, since thermal margins are not critical for this vehicle.
Figure 12 shows outer surface temperature at six x-stations on the =0 plane for HIFiRE-5 as a function of time during ascent. This temperature profile was calculated for a TZM nosetip 80 mm long followed by two steel frusta (150 mm total length) to insulate the body from the nosetip, all followed by a 20 mm thick aluminum shell. Temperatures at the stagnation point and the bluntness / frustum juncture at 2.5 mm peak initially at first-stage burnout at about 22 seconds, then drop as heat is conducted away by the rest of the tip during coast phase. After the second stage ignites at approximately 30 seconds, the stagnation point temperature climbs to its ascent peak of approximately 750 K. Temperature at the end of the TZM nosetip however, only reaches 450 K. Peak temperature at the end of the steel isolator sections is less than 400 K, and temperatures on the aluminum frustum reach only 375 K, and are relatively uniform.
Figure 13 shows descent heating to the test article. During descent, nosetip stagnation point temperatures are predicted to peak at about 1750 K shortly after the vehicle passes through 18 km (502.7 sec). Temperatures on the aluminum frustum remain near 400 K throughout descent until about 24 km, when transition is expected to occur, based on the simple Re/Me prediction. At this point, temperatures rise rapidly but remain less than 500 K through 18 km.

American Institute of Aeronautics and Astronautics
11
Figure 12 Ascent heating for HIFiRE-5
Figure 13 HIFiRE-5 descent heating.

American Institute of Aeronautics and Astronautics
12
V. Roughness Tolerances
A. Discrete Roughness Correlations for the Frustum The primary concern for HIFiRE-5 roughness occurs on the leading edge, where the boundary layer is thinnest.
Roughness was applied using 2D (tape strips) and 3D (tape squares) to the HIFiRE-5 model leading edge in the NASA LaRC 20-inch Mach 6 wind tunnel.33 Heat transfer measurements from these experiments were used to determine the transition location due to the roughness elements. The procedure to determine the transition location was similar to that outlined previously for smooth-body transition. These tests confirmed that the leading edge was the region of the model most susceptible to roughness tripping.Error! Bookmark not defined. The boundary layer tripped more effectively with diamond-shaped roughness than with the 2D strip. Roughness correlations were used to extrapolate the wind tunnel results to flight conditions in order to place requirements on the flight-vehicle full-scale roughness.
Poll used the parameter R to correlate incompressible swept cylinder leading edge transition, and mapped this
correlation to compressible flow by evaluating R at a reference temperature T to obtain the correlating parameter R .37 Although R was developed for roughness on swept cylinders, and the HIFiRE-5 configuration possesses a
non-cylindrical leading edge that increases in diameter in the downstream direction, R was investigated as a representative correlation. The correlating parameters were obtained using Newtonian theory, consistent with past results published by other investigators. The elliptic cone leading edge radius is taken in the plane transverse to the freestream. Although strictly speaking the leading edge radius should be defined normal to the leading edge, the radius in the plane normal to the freestream velocity is easier to define and for the high sweep of HIFiRE-5, is within 4% of the radius normal to the leading edge.
Very little data regarding transition from 3D roughness exists for swept leading edges in hypersonic flow. The HIFiRE-5 data are compared in Figure 14 to results of Creel, et al. 38 obtained in the NASA LaRC Mach 3.5 quiet tunnel. The Creel data were obtained on a cylinder swept at 60-deg. Critical roughness occurs at k/* slightly less than one. Critical roughness is defined as roughness just large enough to affect transition. Effective roughness occurs at k/* near two. Effective roughness is defined as roughness so large that further increases in height cause no further forward movement of transition.39 Results show that the data are generally in agreement with the correlation obtained by Creel. Creel et al. observed similar trends for a 45-deg sweep model. Critical roughness values were higher for the 45-deg sweep configuration than the 60-deg sweep configuration. The Mach 3.5 data also show that transition was more sensitive to roughness under noisy flow, compared to quiet flow.
LaRCHF5 3D
Creel, LaRCM=3.5, =60o, noisy
Figure 14 Scaling of transition due to 3D roughness

American Institute of Aeronautics and Astronautics
13
A larger body of data exists regarding 2D roughness, usually trip wires applied around the leading edge. Figure
15 compares 2D tape strip data for HIFiRE-5 to other transition data from 2D trips on cylinders by Murakami et al.,40 Benard et al.,41 and Da Costa, as cited in Benard. Data with arrows represent bounding values only. These data, coming as they do from various wind tunnels, Mach numbers and geometries, show a great deal of scatter. The general trend of the HIFiRE-5 data is consistent with data from cylindrical leading edges. The HIFiRE-5 leading edge transition is unaffected by roughness for k/* < 3.
Figure 15 Scaling of transition due to 2D roughness
Since the HIFiRE-5 configuration does not possess a cylindrical leading edge of constant radius, it is not
immediately clear why the R correlation collapses the data. The R versus k/* correlation is based on the length scale *, which characterizes the boundary layer velocity and integral thicknesses for similar profiles. In order to assess the suitability of * as a length scale for the HIFiRE-5 boundary layer, the displacement and momentum thicknesses along the leading edge, as determined from a Navier-Stokes solution for the NASA Mach 6 model,31 were normalized by *. Figure 16 shows that beyond 0.1 m downstream of the nosetip, * characterizes
the boundary layer thickness well, so R versus k/* might be expected to correlate HIFiRE-5 leading edge transition, just as it correlates transition on swept cylinders.
Figure 14 indicates that the critical value of * for 3D roughness is approximately 0.6, and Figure 15 shows 2D roughness begins to be significant when * > 3. The distribution of roughness height along the leading edge at 18 km altitude during descent, corresponding to these two values, is shown in Figure 17. The 18 km altitude is chosen to set roughness tolerances since it is the lowest expected altitude (highest Reynolds number) at which data will be obtained. 2D roughness is assessed at the first joint location of 0.1 meters, since this represents the most probable form of 2D roughness. At this location the allowable joint height mismatch would be 0.22 mm. At the same location, tolerances for 3D roughness are much more stringent, 0.045 mm. Data obtained under noisy and quiet flow conditions for HIFiRE-1 in the Purdue Mach 6 quiet tunnel8 indicate that tripped transition may be affected by wind tunnel noise. Critical and effective roughnesses were higher under quiet conditions. Creel et al.38 observed similar behavior for leading edge roughness in supersonic flow. Therefore, allowable-roughness correlations based on noisy wind tunnel data may be conservative when extrapolated to flight. Correlations may only be expected to provide at best an order-of-magnitude estimate of allowable roughness. Experience on HIFiRE-1 showed that a tolerance of 0.08 mm could be held at joints. As an added factor of safety, this lower value was imposed for

American Institute of Aeronautics and Astronautics
14
maximum allowable steps at joints, well below the 0.22 mm value obtained from the k/* correlation for 2D roughness.
Figure 16 Boundary layer thicknesses normalized by length scale *.

American Institute of Aeronautics and Astronautics
15
Figure 17 Allowable roughnesses along HIFiRE-5 leading edge at 18 km.
The natural construction for the HIFiRE-5 vehicle would be a clamshell shape, similar to HIFiRE-1. However, this would place longitudinal joints along the leading edge, precisely where the configuration is most susceptible to roughness. A split along the x-y plane along the minor axis was rejected since it would make access to internal components inconvenient. In order to prevent this, the vehicle is designed with one-piece leading edges, as shown in Figure 18. Sliding internal keys, similar to HFIRE-1,14 lock the leading edges together with top and bottom clamshell pieces without external penetrating fasteners.
Figure 18 HIFiRE-5 aeroshell construction.

American Institute of Aeronautics and Astronautics
16
VI. Conclusion The HIFiRE-5 vehicle is designed to create transition in hypersonic flight with flowfields and pressure gradients
characteristic of maneuvering hypersonic bodies. The 2:1 elliptic cone configuration, lofted with the S30-Orion stack, is capable of providing adequate Reynolds number to achieve this goal. Although the payload is not axially symmetric and thus has different pitch-plane and yaw-plane aerodynamics, the entire vehicle is stable in both planes.
The effect of leading-edge roughness on transition is well-correlated with the R correlation. This correlation is used to extrapolate wind tunnel data to full-scale flight conditions and obtain allowable leading-edge roughness tolerances. Leading-edge roughness tolerances are stringent but can be achieved using a clamshell design with a one-piece leading edge.
Acknowledgments The authors thank John Schmisseur of AFOSR, Douglas Dolvin of AFRL/RBA and the NASA Fundamental
Aeronautics Program for their support of this work. The authors also wish to thank the DSTO design team, especially Myles Frost, for the conception and design of the HIFiRE-5 aeroshell. The authors also thank Thomas Jentink of ATK Space Systems, Inc., for his assistance with the Navier-Stokes solutions for the HIFiRE5 configuration.
References
1 Dolvin, D. “Hypersonic International Flight Research and Experimentation (HIFiRE) Fundamental Science and Technology Development Strategy,” AIAA Paper 2008-2581, April 2008.
2 Dolvin, D. J., “Hypersonic International Flight Research and Experimentation Technology Development and Flight Certification Strategy,” AIAA paper 2009-7228, October 2009.
3 Kimmel, R. L., Adamczak, D., Gaitonde, D., Rougeux, A., Hayes, J. R., “HIFiRE-1 Boundary Layer Transition Experiment Design,” AIAA paper 2007-0534, January 2007.
4 Wadhams, T. P., MacLean, M. G., Holden, M.S., and Mundy, E., “Pre-Flight Ground Testing of the Full-Scale FRESH FX-1 at Fully Duplicated Flight Conditions,” AIAA paper 2007-4488, June 2007.
5 Johnson, H. B., Alba, C. R., Candler, G. V., MacLean, M., Wadhams, T, and Holden, M. “Boundary Layer Stability Analysis of the Hypersonic International Flight Research Transition Experiments,” AIAA Journal of Spacecraft and Rockets, vol. 45, no. 2, March-April 2008.
6 Holden, M. S., Wadhams, T. P., MacLean, M., “Experimental Studies in the LENS Supersonic and Hypersonic Tunnels for Hypervelocity Vehicle Performance and Code Validation,” AIAA paper 2008-2505, April 2008.
7 Kimmel, R. L., “Aerothermal Design for the HIFiRE-1 Flight Vehicle,” AIAA paper 2008-4034, June 2008. 8 Casper, K. M., Wheaton, B. M., Johnson, H. B., and Schneider, S. P., “Effect of Freestream Noise on Roughness-Induced
Transition at Mach 6,” AIAA paper 2008-4291 June 2008. 9 Kimmel, R. L., “Roughness Considerations for the HIFiRE-1 Vehicle,” AIAA Paper 2008-4293, June 2008. 10 Alba, C. R., Johnson, H. B., Bartkowicz, M. D., Candler, G. V., and Berger, K. T. “Boundary-Layer Stability Calculations
for the HIFiRE-1 Transition Experiment,” AIAA Journal of Spacecraft and Rockets, vol. 45, no. 6, November-December 2008, pp. 1125-1133.
11 Wadhams, T. P., Mundy, E., MacLean, M. G., and Holden, M. S., “Ground Test Studies of the HIFiRE-1 Transition Experiment Part1: Experimental Results,” AIAA Journal of Spacecraft and Rockets, vol. 45, no. 6, November-December 2008, pp. 1134-1148.
12 MacLean, M., Wadhams, T., Holden, M., and Johnson, H., “Ground Test Studies of the HIFiRE-1 Transition Experiment Part 2: Computational Analysis,” AIAA Journal of Spacecraft and Rockets, vol. 45, no. 6, November-December 2008, pp. 1149-1164.
13 Berger, K. T., Greene, F. A., Kimmel, R. L., Alba, C., and Johnson, H., “Erratum on Aerothermodynamic Testing and Boundary-Layer Trip Sizing of the HIFiRE Flight 1 Vehicle,” AIAA Journal of Spacecraft and Rockets, vol. 46, no., 2, March-April, 2009, pp. 473-480.
14 Adamczak, D., Alesi, H., Frost, M., “HIFiRE-1: Payload Design, Manufacture, Ground Test, and Lessons Learned,” AIAA paper 2009-7294, October 2009.
15 Malik, M. R., Li, F., Choudhari, M., “Analysis of Crossflow Transition Flight Experiment aboard the Pegasus Launch Vehicle,” AIAA paper 2007-4487, June 2007.
16 Palmerio, A. F.; Peres da Silva, J. P. C.; Turner, P.; Jung, W., “The development of the VSB-30 sounding rocket vehicle,” in 16th ESA Symposium on European Rocket and Balloon Programmes and Related Research, 2 - 5 June 2003. Ed.: Barbara Warmbein. ESA SP-530, Noordwijk: ESA Publications Division, 2003, p. 137 – 140.
17 “NASA Sounding Rocket Program Handbook,” 810-HB-SRP, Sounding Rockets Program Office, Suborbital & Special Orbital Projects Directorate, Goddard Space Flight Center, Wallops Island Flight Facility, June 2005.

American Institute of Aeronautics and Astronautics
17
18 Kimmel, R. L., and Poggie, J., “Transition on an Elliptic Cone at Mach 8,” American Society of Mechanical Engineers
ASME FEDSM97-3111, June 1997. 19 Kimmel, R. L., and Poggie, J., “Three-Dimensional Hypersonic Boundary Layer Stability and Transition,” Air Force
Research Laboratory Technical Report, WL-TR-97-3111, December 1997, Wright-Patterson Air Force Base, Ohio. 20 Kimmel, R. L., and Poggie, J., Schwoerke, S. N., “Laminar-Turbulent Transition in a Mach 8 Elliptic Cone Flow,” AIAA
Journal, vol. 37, no. 9, Sep. 1999, pp. 1080-1087. 21 Schmisseur, J. D., “Receptivity of the Boundary Layer on a Mach-4 Elliptic Cone to Laser-Generated Localized
Freestream Perturbations,” Doctoral Dissertation, Purdue University Aerospace Sciences Laboratory, December 1997. 22 Holden, M., “Experimental Studies of Laminar, Transitional, and Turbulent Hypersonic Flows Over Elliptic Cones at
Angle of Attack,” Air Force Office of Scientific Research Technical Report AFRL-SR-BL-TR-98-0142, Bolling Air Force Base, DC, 1998.
23 Schmisseur, J. D., Schneider, S. P., and Collicott, S. H., “Receptivity of the Mach 4 Boundary Layer on an Elliptic Cone to Laser-Generated Localized Freestream Perturbations,” AIAA paper 1998-0532, January 1998.
24 Schmisseur, J. D., Schneider, S. P., and Collicott, S. H., “Response of the Mach 4 boundary layer on an elliptic cone to laser-generated freestream perturbations,” AIAA paper 1999-0410, January 1999.
25 Lyttle, I. J., and Reed, H. L., “Use of Transition Correlations for Three-Dimensional Boundary Layers Within Hypersonic Flows,” AIAA-95-2293, June 1995.
26 Odam, J., Paull, A., Alesi, H., Hunt, D., Paull, R., Pietsch, R., “HIFiRE 0 Flight Test Data,” AIAA paper 2009-7293, October 2009.
27 “NASA Sounding Rocket Program Handbook,” 810-HB-SRP, Sounding Rockets Program Office, Suborbital & Special Orbital Projects Directorate, Goddard Space Flight Center, Wallops Island Flight Facility, June 2005.
28 McDonnell Douglas Astronautics Company, “The USAF Stability and Control Digital Datcom Volume II, Implementation of Datcom Methods,” Air Force Flight Dynamics Laboratory Technical Report AFFDL-TR-79-3032, Wright-Patterson Air Force Base, Ohio, April 1979.
29 Auman, L., Doyle, J., Rosema, C., Underwood, M., and Blake, W., “Missile Datcom User’s Manual – 2008 Revision,” Air Force Research Laboratory AFRL-RB-WP-TR-2009-3015, Wright-Patterson Air Force Base, Ohio, August 2008
30 Aftosmis, M. J., Berger, M. J., and Alonso, J. J., “Applications of a Cartesian Mesh Boundary-Layer Approach for Complex Configurations,” AIAA paper 2006-0652, January 2006.
31 Choudhari, M., Chang, C.-L., Jentink, T., Li, F., Berger, K., Candler, G., Kimmel, R., “Transition Analysis for the HIFiRE-5 Vehicle,” AIAA paper 2009-4056, June 2009.
32 Schneider, S. P., “Effects of High-Speed Tunnel Noise on Laminar-Turbulent Transition,” Journal of Spacecraft and Rockets, vol. 38, no. 3, May-June 2001, pp. 323-333.
33 Berger, K. T., Rufer, S.J., Kimmel, R., and Adamczak, D., “Aerothermodynamic Characteristics of Boundary Layer Transition and Trip Effectiveness of the HIFiRE Flight 5 Vehicle,” AIAA paper 2009-4055, June 2009.
34 Holden, M. S., Wadhams, T. P., MacLean, M., and Mundy, E., “Review of Studies of Boundary Layer Transition in Hypersonic Flows over Axisymmetric and Elliptic Cones Conducted in the CUBRC Shock Tunnels,” AIAA paper 2009-0872, January 2009.
35 Engel, C. D., and Praharaj, S. C., “MINIVER Upgrade for the AVID System. Volume I: LANMIN User’s Manual,” NASA Contractor Report 172212, August 1983.
36 Carter, M. L., Kuruvila, G., Woo, Y., Lau, K. Y., and Bowcutt, K. G., “Hypersonic Engineering Aerothermodynamic Trajectory Tool Kit (Heat-TK),” Air Force Research Laboratory technical report AFRL-VA-WP-TR 2005-3120, Wright-Patterson Air Force Base Ohio, Januacry 2005
37 Poll, D. I. A., “The Development of Intermittent Turbulence on a Swept Attachment Line Including the Effects of Compressibility,” The Aeronautical Quarterly, vol. XXXIV, Feb. 83, pp. 1-23.
38 Creel, T. R., Beckwith, I. E., and Chen, F. J., “Transition on Swept Leading Edges at Mach 3.5,” AIAA J. Aircraft, vol. 24, no. 10, Oct. 1987, pp. 710-717.
39 Schneider, S. P., “Effects of Roughness on Hypersonic Boundary Layer Transition,” AIAA Journal of Spacecraft and Rockets, vol. 45, no. 2, March-April 2008.
40 Murakami, A., Stanewsky, E., and Krogman, P., “Boundary Layer Transition on Swept Cylinders at Hypersonic Speeds,” AIAA Journal, vol. 34, no. 4, April 1996, pp. 649-654.
41 Benard, E., Gaillard, L., Alziary de Roquefort, A., “Influence of roughness on attachment line boundary-layer transition in hypersonic flow,” Experiments in Fluids, vol. 22, no. 4, February 1997, pp. 286-291.