Hibbs Newsletter - The University of Texas at Tyler
9
Hibbs Newsletter Hibbs Institute for Business & Economic Research July 2019 In this issue of the Hibbs Newsletter, we discuss health status in the U.S. with a focus on East Texas. Since this topic is broad, we will be discussing the topic in two issues of the newsletter, July and September. The health status of a region is described using health indicators, which include measures of health outcomes and measures of health factors. Measures of health outcomes illustrate how long people live and how healthy they feel while alive. Health factors include measures that describe health behaviors, clinical care, socio-economic and physical environment factors. The first health status issue contains information related to measures of health outcomes, while the second issue will discuss measures of health factors. In this first issue, we discuss the two most common measures of health outcomes: life expectancy at birth (LEB) and mortality rates. Life expectancy at birth (LEB) is a statistical measure of the average number of years that an individual is expected to live from the day he or she is born. LEB is based on demographic factors, such as gender, race, ethnicity and others. For instance, females typically have higher LEB figures than males. Similarly, LEB figures are higher for Hispanics than what they are for non-Hispanics, both white and black (Figure 1). LEB is also affected by risk factors during the life span of an individual. The reduction of mortality rates of individuals experiencing risk factors, such as death from accidents, diseases or others, increases the LEB. Similarly, modern medicine and its increasing availability significantly increases LEB. The LEB in the U.S. has decreased for three consecutive years. A newborn is expected to live to be 78.6 years old. 1 This figure has decreased from the previous year (78.7) and the year before (78.9). Before such decline, LEB in the U.S. rose steadily for several decades. This is common among 1 The most recent year available, 2016. 2 Over a 10-year period, the death rate for chronic liver disease and cirrhosis among men aged 25 to 34 increased by nearly 8% per year, while women in the same age group increased more than 11% per year. developed countries, which spend more money per person on health care than underdeveloped ones. Although the LEB can increase or decrease due to a number of factors, the Center for Disease Control and Prevention (CDC) has identified three high factors that may have contributed to the LEB decrease experienced by the U.S. during the past three years. A) A rise in drug overdoses; more than 70,000 deaths occurred in 2017 because of drug overdoses, rising the death rate 72% within a decade. B) An increase in liver disease; the death rate of individuals aged 25 to 34 increased considerably over a 10-year period. 2 C) A rise in suicide rates; the national suicide rate has increased by 33% since 1999. Figure 1. Life Expectancy at Birth, by Race/Ethnicity and Gender, in the U.S. (2006–2016) 69 77 85 ’16 ’15 ’14 ’13 ’12 ’10 ’09 ’08 ’07 ’06 All q Male Hispanic Female Hispanic Male White Non-Hispanic Female White Non-Hispanic Male Black Non-Hispanic Female Black Non-Hispanic q q q q Source: National Center for Health Statistics.
Transcript of Hibbs Newsletter - The University of Texas at Tyler

Hibbs NewsletterHibbs Institute for Business & Economic Research
July 2019
In this issue of the Hibbs Newsletter, we discuss health status in the U.S. with a focus on East Texas. Since this topic is broad, we will be discussing the topic in two issues of the newsletter, July and September.
The health status of a region is described using health indicators, which include measures of health outcomes and measures of health factors. Measures of health outcomes illustrate how long people live and how healthy they feel while alive. Health factors include measures that describe health behaviors, clinical care, socio-economic and physical environment factors. The first health status issue contains information related to measures of health outcomes, while the second issue will discuss measures of health factors. In this first issue, we discuss the two most common measures of health outcomes: life expectancy at birth (LEB) and mortality rates.
Life expectancy at birth (LEB) is a statistical measure of the average number of years that an individual is expected to live from the day he or she is born. LEB is based on demographic factors, such as gender, race, ethnicity and others. For instance, females typically have higher LEB figures than males. Similarly, LEB figures are higher for Hispanics than what they are for non-Hispanics, both white and black (Figure 1). LEB is also affected by risk factors during the life span of an individual. The reduction of mortality rates of individuals experiencing risk factors, such as death from accidents, diseases or others, increases the LEB. Similarly, modern medicine and its increasing availability significantly increases LEB.
The LEB in the U.S. has decreased for three consecutive years. A newborn is expected to live to be 78.6 years old.1 This figure has decreased from the previous year (78.7) and the year before (78.9). Before such decline, LEB in the U.S. rose steadily for several decades. This is common among
1 The most recent year available, 2016.2 Over a 10-year period, the death rate for chronic liver disease and cirrhosis among men aged 25 to 34 increased by nearly 8% per year, while women in the same age group increased more than 11% per year.
developed countries, which spend more money per person on health care than underdeveloped ones.
Although the LEB can increase or decrease due to a number of factors, the Center for Disease Control and Prevention (CDC) has identified three high factors that may have contributed to the LEB decrease experienced by the U.S. during the past three years. A) A rise in drug overdoses; more than 70,000 deaths occurred in 2017 because of drug overdoses, rising the death rate 72% within a decade. B) An increase in liver disease; the death rate of individuals aged 25 to 34 increased considerably over a 10-year period.2 C) A rise in suicide rates; the national suicide rate has increased by 33% since 1999.
Figure 1. Life Expectancy at Birth, by Race/Ethnicity and Gender, in the U.S. (2006–2016)
69
77
85
’16’15’14’13’12’10’09’08’07’06
Allq
Male Hispanic
Female Hispanic
Male White Non-Hispanic
Female White Non-Hispanic
Male Black Non-Hispanic
Female Black Non-Hispanic
q
q
q
q
Source: National Center for Health Statistics.

Mortality rate is a measure of the number of deaths in a specific location, which is scaled to the location’s population during a period of time. It can be expressed in units per 100,000 per year (crude rate), it can also be adjusted to a certain age when a specific cohort is focused (age-adjusted rate), or it can be standardized using an age cohort with a population weight (age-standardized rate).3 Mortality rates illustrate cause-specific mortality risk and numerically denote the cause relevancy when compared to the total and to each another.
For more than a decade, heart disease and cancer have been the leading causes of death in the nation. In 2017, these diseases account for the first and second rankings with 23% (647,457) and 21.3% (599,108) of all deaths, respectively (Figure 2). These two causes combined with accidents, or unintentional injuries (169,936), accounted for half of all deaths in the United States during that year. Next on the list are chronic lower respiratory diseases with 5.7% (160,201), stroke with 5.2% (146,383), Alzheimer’s disease with 4.3% (121,404), diabetes mellitus with 3% (83,564), influenza and pneumonia with 2% (55,672), kidney disease with 1.8% (50,633), and suicide with 1.7% (47,173) of all mortality. About three out of four persons, or 74%, die due to one of these 10 causes of death in the U.S.
The difference between heart disease and cancer related deaths narrowed from 1968 through 2012. While the number of heart disease-related deaths declined since the late 1980s, the number of cancer-related deaths has been rising over the last several decades.4 Although heart disease deaths experienced a moderate growth between 2011 and 2017,5 experts believe that cancer will overtake heart disease as the leading cause of death in the U.S. by 2020.6
Deaths from stroke and influenza or pneumonia have decreased considerably during the last few years. Deaths from stroke dropped by 11% between 2010 and 2014, while deaths related to influenza and pneumonia dropped an average of 3.8% each year since 1999. In contrast, accidental deaths have increased recently. The number of accident-related deaths went up by 23% between 2010 and 2014. A large portion of such increase can be attributed to substance overdose deaths.
3 The Age-standardized Rates; Statistics Canada. www.statcan.gc.ca4 National Center for Health Statistics, (2016); “Changes in the Leading Cause of Death: Recent Patterns in Heart Disease and Cancer Mortality”5 National Vital Statistics Reports; “Deaths: Final Data” for 2010–2019.6 Hastings, K.G. (2018) “Cancer to surpass heart disease as leading cause of death in US by 2020.” Oncology at Internal Medicine; Healio Primary Care. www.healio.com
Other, 26.0%
Heart Disease, 23.0%Cancer, 21.3%
Accidents(Unintentional Injuries),
6.0%
Chronic LowerRespiratory Diseases,
5.7%
Stroke, 5.2%
Diabetes, 3.0%Influenza and Pneumonia, 2.0%
Kidney Disease, 1.8% Suicide, 1.7%
Alzheimer’s Disease, 4.3%
Source: National Vital Statistics System (NCHS).
Figure 2. Percentage of Total Deaths for the Leading Causes of Death in the U.S. (2017)
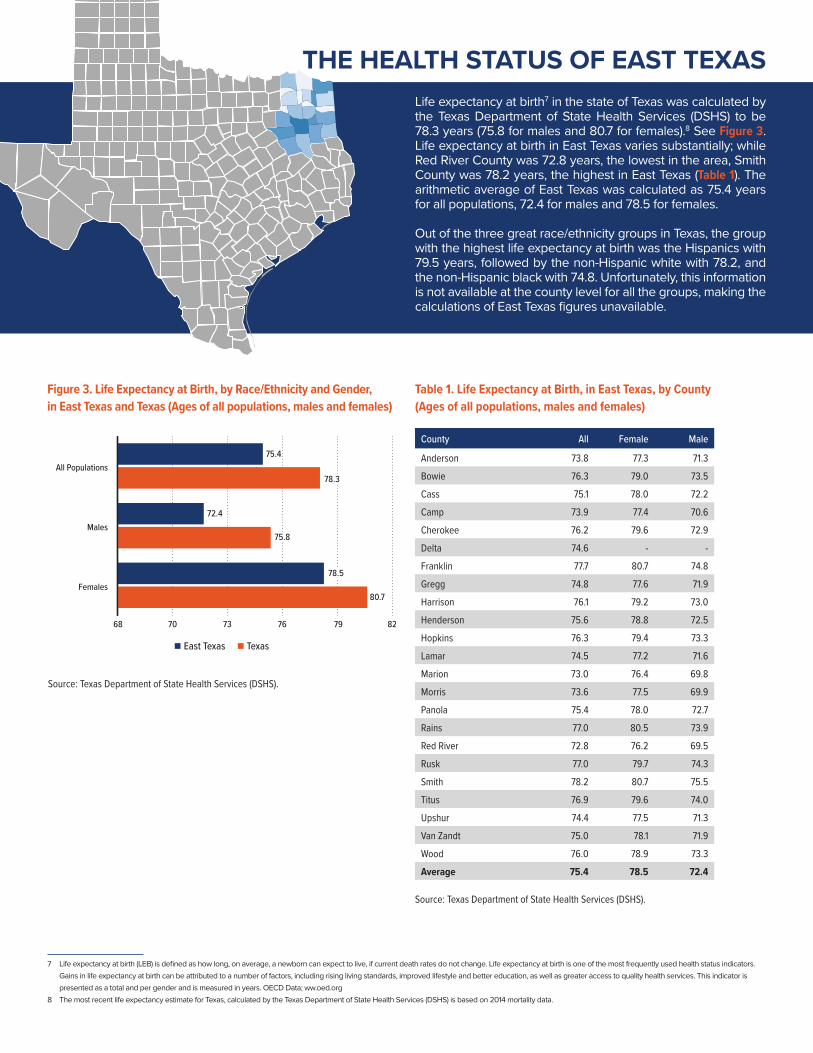
THE HEALTH STATUS OF EAST TEXASLife expectancy at birth7 in the state of Texas was calculated by the Texas Department of State Health Services (DSHS) to be 78.3 years (75.8 for males and 80.7 for females).8 See Figure 3. Life expectancy at birth in East Texas varies substantially; while Red River County was 72.8 years, the lowest in the area, Smith County was 78.2 years, the highest in East Texas (Table 1). The arithmetic average of East Texas was calculated as 75.4 years for all populations, 72.4 for males and 78.5 for females.
Out of the three great race/ethnicity groups in Texas, the group with the highest life expectancy at birth was the Hispanics with 79.5 years, followed by the non-Hispanic white with 78.2, and the non-Hispanic black with 74.8. Unfortunately, this information is not available at the county level for all the groups, making the calculations of East Texas figures unavailable.
7 Life expectancy at birth (LEB) is defined as how long, on average, a newborn can expect to live, if current death rates do not change. Life expectancy at birth is one of the most frequently used health status indicators. Gains in life expectancy at birth can be attributed to a number of factors, including rising living standards, improved lifestyle and better education, as well as greater access to quality health services. This indicator is presented as a total and per gender and is measured in years. OECD Data; ww.oed.org
8 The most recent life expectancy estimate for Texas, calculated by the Texas Department of State Health Services (DSHS) is based on 2014 mortality data.
85
68 70 73 76 79 82
Females
Males
All Populations
East Texas Texas
75.4
72.4
80.7
78.3
78.5
75.8
County All Female Male
Anderson 73.8 77.3 71.3
Bowie 76.3 79.0 73.5
Cass 75.1 78.0 72.2
Camp 73.9 77.4 70.6
Cherokee 76.2 79.6 72.9
Delta 74.6 - -
Franklin 77.7 80.7 74.8
Gregg 74.8 77.6 71.9
Harrison 76.1 79.2 73.0
Henderson 75.6 78.8 72.5
Hopkins 76.3 79.4 73.3
Lamar 74.5 77.2 71.6
Marion 73.0 76.4 69.8
Morris 73.6 77.5 69.9
Panola 75.4 78.0 72.7
Rains 77.0 80.5 73.9
Red River 72.8 76.2 69.5
Rusk 77.0 79.7 74.3
Smith 78.2 80.7 75.5
Titus 76.9 79.6 74.0
Upshur 74.4 77.5 71.3
Van Zandt 75.0 78.1 71.9
Wood 76.0 78.9 73.3
Average 75.4 78.5 72.4
Figure 3. Life Expectancy at Birth, by Race/Ethnicity and Gender, in East Texas and Texas (Ages of all populations, males and females)
Table 1. Life Expectancy at Birth, in East Texas, by County(Ages of all populations, males and females)
Source: Texas Department of State Health Services (DSHS).
Source: Texas Department of State Health Services (DSHS).

THE HEALTH STATUS OF EAST TEXAS (CONTINUED)
The mortality rates in 2017 were 896 deaths per 100,000 population (age-standardized rates)9 for East Texas; 736 deaths per 100,000 population for Texas and 732 deaths per 100,000 population for the nation. While mortality rates declined by 17% in Texas from 2000 to 2017, rates in East Texas declined just by 11% (Figure 4).
In 2017, mortality rates were higher in East Texas than Texas overall for almost all subcategories: 17% higher for both males and females, 14% higher for both whites and blacks (Figures 5 & 6). For Hispanics, the mortality rate was 30% lower in East Texas than in Texas overall.
9 Death rates in this document are age-standardized rates unless otherwise specified.
East Texas Texas U.S.
0
200
400
600
800
1,000
1,200
FemaleMale0
200
400
600
800
1,000
1,200
HispanicNon-Hispanic BlackNon-Hispanic WhiteEast Texas Texas U.S.
Figure 4. All-Cause Mortality Rates in East Texas, Texas and the U.S. (2000–2017)
Figure 5. All-Cause Mortality Rates by Gender, in East Texas, Texas and the U.S. (2017)
Figure 6. All-Cause Mortality Rates by Race/Ethnicity, in East Texas, Texas and the U.S. (2017)
Note: Age-standardized rates; deaths per 100,000 population.Source: Centers for Disease Control and Prevention.
Note: Age-standardized rates; deaths per 100,000 population.Source: Centers for Disease Control and Prevention.
Note: Age-standardized rates; deaths per 100,000 population.Source: Centers for Disease Control and Prevention.
East Texas
Texas
U.S.
700
850
1,000
’17’16’15’14’13’12’11’10’09’08’07’06’05’04’03’02’01’00

THE HEALTH STATUS OF EAST TEXAS (CONTINUED)
Disparities between East Texas and both Texas and the U.S. are also seen across age groups. Mortality rates are higher in East Texas than what they are in both Texas and the nation for all age cohorts (Figure 7). Such disparities are also evident in most of the leading causes of death. Mortality rates for each of the top three leading causes of death—heart disease, cancer and chronic lower respiratory diseases (CLRD)—were particularly higher in East Texas (Figure 8).
Figure 9 depicts cancer mortality rates by type of cancer in East Texas, Texas and the nation. Although lung cancer is the type of cancer with the highest mortality rates of all three, East Texas rates are significantly higher than Texas overall and the U.S.
Figure 7. All-Cause Mortality Rates, by Age Group, in East Texas, Texas and the U.S. (2017)
Figure 8. Mortality Rates for Top Causes of Death in East Texas, Texas and the U.S. (2017)
Figure 9. Cancer Disease Mortality Rate by Type of Cancer in East Texas, Texas and the U.S. (2000–2017)
Note: Age-standardized rates; deaths per 100,000 population.Source: Centers for Disease Control and Prevention.
Note: Age-standardized rates; deaths per 100,000 population.Source: Centers for Disease Control and Prevention.
Note: Age-standardized rates; deaths per 100,000 population.Source: East Texas – Texas Cancer Registry, Texas Department of State Health Services. Texas and National – National Cancer Institute on the Centers for Disease Control and Prevention.
0
1,000
2,000
3,000
4,000
5,000
65>55–6445–5435–4425–3415–241–14<1
East Texas
Texas
U.S.
0 50 100 150 200 250 300 350
Suicide
Kidney DiseaseDiabetes
Alzheimer’sDisease
UnintentionalInjury
Stroke
Chronic LowerRespiratory Diseases
CancerHeart Disease
East Texas
Texas
U.S.
0
10
20
30
40
50
MelanomaCervicalProstateBreastColorectalLung
East Texas
Texas
U.S.

Van Zandt
Smith
Henderson
AndersonCherokee
Rusk
Wood Upshur
Gregg
TOP CAUSES OF DEATH IN TYLER AREAHeart disease mortality rates in Tyler area are considerably higher than the overall state and the nation’s (Figure 10). In 2017, heart disease mortality rates in Tyler area were of 303 deaths per 100,000 population, compared to Texas and the nation’s rates of 225.6 and 219.4 per 100,000 population, respectively. Cancer mortality rates decreased from 2000 to 2014; since then, these rates have increased to 168.4 deaths per 100,000 population in 2017. CLRD mortality rates showed an upward trend for the Tyler area since 2006 (Figure 12). In fact, CLRD mortality rates in 2017 (58.7 deaths per 100,000 population) were 8% higher than in 2000.
Figure 10. Heart Disease Mortality Rate in the Tyler Area (2000–2017)
Figure 11. Cancer Mortality Rate in the Tyler Area (2000–2017)
Figure 12. Chronic Obstructive Pulmonary Disease Mortality Rate in the Tyler Area (2000–2017)
Note: Age-standardized rates; deaths per 100,000 population.Source: Centers for Disease Control and Prevention.
Note: Age-standardized rates; deaths per 100,000 population.Source: Centers for Disease Control and Prevention.
Note: Age-standardized rates; deaths per 100,000 population.Source: Centers for Disease Control and Prevention.
Tyler Area
Texas
U.S.
’17’16’15’14’13’12’11’10’09’08’07’06’05’04’03’02’01’00200
250
300
350
400
Tyler Area
Texas
U.S.
’17’16’15’14’13’12’11’10’09’08’07’06’05’04’03’02’01’00100
150
200
250
Tyler Area
Texas
U.S.
’17’16’15’14’13’12’11’10’09’08’07’06’05’04’03’02’01’0030
40
50
60
70

TOP CAUSES OF DEATH IN LONGVIEW AREA
Smith
Rusk
Upshur
Gregg
HarrisonHeart disease mortality rates in Longview area (286.6 deaths per 100,000 population) are considerably higher than the overall state and the nation (225.6 and 219.4 deaths per 100,000 population, respectively). See Figure 13. Cancer mortality rates in Longview area (157.2 deaths per 100,000 population) decreased consistently from 2000 to 2014, experiencing lower rates than the overall state and the nation (Figure 14). After 2014 a small increase puts the Longview area cancer mortality rates very close to Texas overall. CLRD mortality rates have grown since 2004 (46.6 deaths per 100,000 population) reaching 57 deaths per 100,000 population in 2017 (Figure 15).
Figure 13. Heart Disease Mortality Rate in the Longview Area (2000–2017)
Figure 14. Cancer Mortality Rate in the Longview Area (2000–2017)
Figure 15. Chronic Obstructive Pulmonary Disease Mortality Rate in the Longview Area (2000–2017)
Note: Age-standardized rates; deaths per 100,000 population.Source: Centers for Disease Control and Prevention.
Note: Age-standardized rates; deaths per 100,000 population.Source: Centers for Disease Control and Prevention.
Note: Age-standardized rates; deaths per 100,000 population.Source: Centers for Disease Control and Prevention.
Longview Area
Texas
U.S.
’17’16’15’14’13’12’11’10’09’08’07’06’05’04’03’02’01’00200
250
300
350
400
Longview Area
Texas
U.S.
’17’16’15’14’13’12’11’10’09’08’07’06’05’04’03’02’01’00100
150
200
250
Longview Area
Texas
U.S.
’17’16’15’14’13’12’11’10’09’08’07’06’05’04’03’02’01’0030
40
50
60
70

TOP CAUSES OF DEATH IN TEXARKANA AREA
Miller
CassMorris
Red River
Bowie
Heart disease mortality rates in Texarkana area (311 deaths per 100,000 population) are substantially higher than the overall state and the nation (225.6 and 219.4 deaths per 100,000 population, respectively). See Figure 16. Although heart disease mortality rates in Texarkana area have decreased over the past 17 years, these rates are higher than other areas in East Texas (Tyler and Longview). Cancer mortality rates in the Texarkana area have decreased consistently since 2000 (Figure 17). CLRD mortality rates in the Texarkana area did not follow a clear pattern and experienced peaks and troughs from 2000 to 2014. Yet, an upward trend is observed after 2014 (Figure 18).
Figure 16. Heart Disease Mortality Rate in Texarkana Area (2000–2017)
Figure 17. Cancer Mortality Rate in the Texarkana Area (2000–2017)
Figure 18. Chronic Obstructive Pulmonary Disease Mortality Rate in the Texarkana Area (2000–2017)
Note: Age-standardized rates; deaths per 100,000 population.Source: Centers for Disease Control and Prevention.
Note: Age-standardized rates; deaths per 100,000 population.Source: Centers for Disease Control and Prevention.
Note: Age-standardized rates; deaths per 100,000 population.Source: Centers for Disease Control and Prevention.
Texarkana Area
Texas
U.S.
’17’16’15’14’13’12’11’10’09’08’07’06’05’04’03’02’01’00200
300
400
500
Texarkana Area
Texas
U.S.
’17’16’15’14’13’12’11’10’09’08’07’06’05’04’03’02’01’00100
150
200
250
Texarkana Area
Texas
U.S.
’17’16’15’14’13’12’11’10’09’08’07’06’05’04’03’02’01’0030
40
50
60
70
80

Acting DirectorManuel Reyes-Loya, D.E.D.
Hibbs Faculty Research FellowMarilyn Young, [email protected]
Undergraduate Research AssistantAyush Akumar
HIBBS INSTITUTE STAFF
The Hibbs Institute for Business and Economic Research is a unit of The University of Texas at Tyler’s Soules College of Business. The mission of the Hibbs Institute is to provide expert research and analysis for businesses, local government and economic development councils with the common goal of increasing economic activity and personal income in East Texas.
Services provided: economic impact analysis; industry/firm economic contribution studies; policy analysis; strategic planning; project analysis; and business and economic forecasting.
Associated with several leading universities, the Hibbs team includes professors of economics, finance, management, marketing and accounting. The group includes two former university presidents and leaders of CPA and other firms.
For more information, visit:UTTYLER.EDU/HIBBS
Email us at:[email protected]
Call:903.565.5952