HHS Public Access Elliott H. Berger William J. Murphy ... · Design —Hearing ... An important...
20
Spectral analysis of hearing protector impulsive insertion loss Cameron J. Fackler a , Elliott H. Berger a , William J. Murphy b , and Michael E. Stergar a a 3M Personal Safety Division, Indianapolis Acoustical Laboratories, Indianapolis, Indiana, USA b Hearing Loss Prevention Team, National Institute for Occupational Safety and Health, Cincinnati, Ohio, USA Abstract Objective—To characterize the performance of hearing protection devices in impulsive-noise conditions and to compare various protection metrics between impulsive and steady-state noise sources with different characteristics. Design—Hearing protectors were measured per the impulsive test methods of ANSI/ASA S12.42-2010. Protectors were measured with impulses generated by both an acoustic shock tube and an AR-15 rifle. The measured data were analyzed for impulse peak insertion loss (IPIL) and impulsive spectral insertion loss (ISIL). These impulsive measurements were compared to insertion loss measured with steady-state noise and with real-ear attenuation at threshold (REAT). Study Sample—Tested devices included a foam earplug, a level-dependent earplug, and an electronic sound-restoration earmuff. Results—IPIL for a given protector varied between measurements with the two impulse noise sources, but ISIL agreed between the two sources. The level-dependent earplug demonstrated level-dependent effects both in IPIL and ISIL. Steady-state insertion loss and REAT measurements tended to provide a conservative estimate of the impulsively-measured attenuation. Conclusions—Measurements of IPIL depend strongly on the source used to measure them, especially for hearing protectors with less attenuation at low frequencies. ISIL provides an alternative measurement of impulse protection and appears to be a more complete description of an HPD’s performance. Keywords hearing protection; impulse noise; insertion loss; spectral analysis Corresponding author: Cameron J. Fackler, 3M Personal Safety Division, Indianapolis Acoustical Laboratories, 7911 Zionsville Road, Indianapolis, Indiana, USA 46268, [email protected]. Declaration of interest: Cameron Fackler, Elliott Berger, and Michael Stergar are employed by 3M, the manufacturer of the hearing protectors studied in this work. Disclaimer: The findings and conclusions in this report are those of the authors and do not represent any official policy of the Centers for Disease Control and Prevention or the National Institute for Occupational Safety and Health. Mention of company names and products does not constitute endorsement by the CDC or NIOSH. 3M, E-A-R, Classic, Combat Arms, TacticalPro, and the color yellow for earplugs are trademarks of 3M Company, used under license in Canada. PELTOR is a trademark of 3M Svenska AB, used under license in Canada. HHS Public Access Author manuscript Int J Audiol. Author manuscript; available in PMC 2017 May 05. Published in final edited form as: Int J Audiol. 2017 ; 56(SUP1): 13–21. doi:10.1080/14992027.2016.1257869. Author Manuscript Author Manuscript Author Manuscript Author Manuscript
Transcript of HHS Public Access Elliott H. Berger William J. Murphy ... · Design —Hearing ... An important...
Spectral analysis of hearing protector impulsive insertion loss
Cameron J. Facklera, Elliott H. Bergera, William J. Murphyb, and Michael E. Stergara
a3M Personal Safety Division, Indianapolis Acoustical Laboratories, Indianapolis, Indiana, USA
bHearing Loss Prevention Team, National Institute for Occupational Safety and Health, Cincinnati, Ohio, USA
Abstract
Objective—To characterize the performance of hearing protection devices in impulsive-noise
conditions and to compare various protection metrics between impulsive and steady-state noise
sources with different characteristics.
Design—Hearing protectors were measured per the impulsive test methods of ANSI/ASA
S12.42-2010. Protectors were measured with impulses generated by both an acoustic shock tube
and an AR-15 rifle. The measured data were analyzed for impulse peak insertion loss (IPIL) and
impulsive spectral insertion loss (ISIL). These impulsive measurements were compared to
insertion loss measured with steady-state noise and with real-ear attenuation at threshold (REAT).
Study Sample—Tested devices included a foam earplug, a level-dependent earplug, and an
electronic sound-restoration earmuff.
Results—IPIL for a given protector varied between measurements with the two impulse noise
sources, but ISIL agreed between the two sources. The level-dependent earplug demonstrated
level-dependent effects both in IPIL and ISIL. Steady-state insertion loss and REAT measurements
tended to provide a conservative estimate of the impulsively-measured attenuation.
Conclusions—Measurements of IPIL depend strongly on the source used to measure them,
especially for hearing protectors with less attenuation at low frequencies. ISIL provides an
alternative measurement of impulse protection and appears to be a more complete description of
an HPD’s performance.
Keywords
hearing protection; impulse noise; insertion loss; spectral analysis
Corresponding author: Cameron J. Fackler, 3M Personal Safety Division, Indianapolis Acoustical Laboratories, 7911 Zionsville Road, Indianapolis, Indiana, USA 46268, [email protected].
Declaration of interest: Cameron Fackler, Elliott Berger, and Michael Stergar are employed by 3M, the manufacturer of the hearing protectors studied in this work.
Disclaimer: The findings and conclusions in this report are those of the authors and do not represent any official policy of the Centers for Disease Control and Prevention or the National Institute for Occupational Safety and Health. Mention of company names and products does not constitute endorsement by the CDC or NIOSH.
3M, E-A-R, Classic, Combat Arms, TacticalPro, and the color yellow for earplugs are trademarks of 3M Company, used under license in Canada. PELTOR is a trademark of 3M Svenska AB, used under license in Canada.
HHS Public AccessAuthor manuscriptInt J Audiol. Author manuscript; available in PMC 2017 May 05.
Published in final edited form as:Int J Audiol. 2017 ; 56(SUP1): 13–21. doi:10.1080/14992027.2016.1257869.
Author M
anuscriptA
uthor Manuscript
Author M
anuscriptA
uthor Manuscript
1 Introduction
Impulsive noises are short-duration, high-level sounds. They are created by many sound
sources, including firearms, impact hammers, some pneumatic tools, and automotive
airbags. An important question and area of research is how effective hearing protectors are at
protecting users from impulsive noises.
The current American National Standard for objectively measuring the insertion loss of
hearing protection devices (HPDs) is ANSI/ASA S12.42-2010. The impulsive-noise portion
of that document standardizes a measurement of impulse peak insertion loss (IPIL). This is
the amount in decibels (dB) that an HPD reduces the peak sound pressure level of an
impulse, at the HPD user’s ear. This measurement requires the use of an acoustic test fixture
(ATF), since a key component is the measurement of an unoccluded ear’s response to
impulses with peak levels as high as 168 dB.
An ATF is essentially an artificial head, containing ear simulators mimicking human ears
and microphones to record the sound pressure that would be present at the location of the
eardrum. To ensure that the attenuation measured with an ATF is reasonably representative
of actual use data, ANSI/ASA S12.42-2010 defines requirements for ATFs used for
impulsive noise measurements. These include dimensional requirements, a requirement for
heated flesh simulations in the earcanals and circumaural areas, and a minimum requirement
for self insertion loss, which is the maximum attenuation that could be measured with the
ATF if its artificial ears were completely sealed. At least two commercially-available ATFs
have been designed to meet these requirements; measurements reported in this paper were
obtained with an ATF manufactured by the French-German Research Institute of Saint-Louis
(ISL).
Historically, several studies have measured the impulse-noise performance of various HPDs.
Impulsive noises are commonly characterized by their peak sound pressure level and A
duration, defined as the time required for the initial pressure wave to rise to its peak pressure
and return momentarily to ambient (Coles et al., 1968). Ylikoski et al. (1987, 1995)
measured the impulse peak reduction of various hearing protectors for impulses generated
by a variety of weapons, using microphone-in-real-ear (MIRE) techniques in actual shooting
conditions. They found that attenuation was greatest for small-caliber weapons such as
pistols and least for large-caliber weapons such as howitzers and cannons. Zera and Mlynski
(2007) also studied the peak reduction of impulses by earmuffs, using a laboratory shock
tube impulse source and an ATF for measurements. Their measurements were made at peak
levels from 150 to 170 dB, with impulses at the higher levels having a shorter A duration.
They found that as the impulse A duration decreases, the reduction in peak level by the
earmuff increases.
Giguère and Kunov (1989) constructed an ATF with enhanced self insertion loss. Among
other measurements, they used it to assess the complex (amplitude and phase), frequency-
dependent insertion loss of HPDs exposed to gunshot impulses. They recommended that
future work supplement the frequency-based measurements by including time-domain
impulse measurements, such as the reduction of peak sound pressure level.
Fackler et al. Page 2
Int J Audiol. Author manuscript; available in PMC 2017 May 05.
Author M
anuscriptA
uthor Manuscript
Author M
anuscriptA
uthor Manuscript

Recently, a number of studies have been conducted with the goal of measuring IPIL, as
standardized in ANSI/ASA S12.42-2010, for a variety of hearing protectors, using a variety
of ATFs and impulse sources. Murphy et al. (2012) studied four hearing protectors,
measuring IPIL with a single-eared ATF, using an AR-15 as the impulse source. Murphy et
al. (2015) used a shock tube impulse source and measured IPIL for four hearing protector
conditions, including double protection.
This work combines aspects of several of the aforementioned studies. Using both an acoustic
shock tube and an AR-15 as impulse sources, we measure both IPIL and the frequency-
dependent (spectral) insertion loss of several HPDs. Measurements are conducted with the
ISL ATF mentioned above, including measurements of insertion loss using a steady-state
pink noise signal. Additionally, the steady-state and impulsive insertion loss measurements
are compared to real-ear attenuation at threshold (REAT) measurements, which use human
listeners to characterize the attenuation of the same HPDs.
2 Methods
2.1 Hearing Protector Impulse Noise Measurements
Three HPDs (shown in Figure 1) were characterized in impulse noise conditions using the
methods of ANSI/ASA S12.42-2010. The hearing protectors studied include the 3M™ E-A-
R™ Classic™ Earplug, a roll-down foam earplug that is a passive device whose attenuation
is not expected to vary with the ambient noise level. The 3M™ PELTOR™ TacticalPro™
Electronic Headset (referred to as the electronic earmuff in the remainder of this paper)
contains environmental microphones and level-dependent electronics that provide
amplification of (allowing a wearer to hear) low-level sounds. This device was tested with
the electronics powered on and the volume control adjusted to its middle setting, providing
approximately unity gain. At higher sound pressure levels, the electronics cease to amplify
the environmental sounds, thus no longer bypassing the inherent passive attenuation of the
earmuff. Lastly, the 3M™ Combat Arms™ Single-Ended Earplug contains a passive acoustic
filter that responds nonlinearly to increasing sound pressure levels, such that higher-level
impulses are attenuated more than lower-level incident noises. This device, subsequently
referred to as the level-dependent (LD) earplug, also contains a switch that allows the filter
to be opened or closed; the device was tested in the open mode to quantify its level-
dependent attenuation.
To complete an impulse-noise characterization following the methods of ANSI/ASA
S12.42-2010, an impulse-noise source is used to generate test signals that are measured by
an ATF and free-field microphone. The outputs of the ATF ear-simulator microphones, with
and without an HPD fitted to the ATF, are recorded with the impulse-noise source generating
impulses over a range of test levels. At each test level, six open-ear calibration waveforms
and ten occluded-ear test waveforms are measured. Testing at a given level begins and ends
with the measurement of three calibration waveforms. Before each test waveform
measurement, a sample of the HPD under test is fitted to the ATF. ANSI/ASA S12.42-2010
stipulates that at least five samples of the hearing protector under test are to be measured; the
ten test waveforms at each level correspond to two repeat fittings of each HPD sample. Five
Fackler et al. Page 3
Int J Audiol. Author manuscript; available in PMC 2017 May 05.
Author M
anuscriptA
uthor Manuscript
Author M
anuscriptA
uthor Manuscript

samples each of the LD earplug and electronic earmuff were measured; for the foam
earplug, a fresh sample was used for each of the ten measurements at each test level.
To study the influence of the impulse-noise source on the resulting HPD measurements,
impulses were generated by two sources with different characteristics. The acoustic shock
tube and horn (shown in the left of Figure 2; constructed following the design outlined in
Khan et al. (2012) with a catenoidal horn) in the Impulse Laboratory of 3M’s Indianapolis
Acoustical Laboratories generated impulses with A durations of approximately 1.0 to 1.5
ms. A Rock River LAR-15LH LEF-T Tactical Operator-L rifle firing a Federal American
Eagle .223 Remington cartridge with 55 grains of powder and a full metal jacket bullet
(referred to as the AR-15 rifle for the remainder of this paper), shown in the right of Figure
2, generated impulses with A durations of approximately 0.3 to 0.5 ms; measurements were
taken outdoors in Lawrence County, Indiana, USA. Although representative of impulses that
may be encountered by users of HPDs while shooting small firearms, these AR-15 impulses
did not meet the requirements of ANSI/ASA S12.42-2010, which calls for test impulses with
A durations between 0.5 and 2.0 ms.
Examples of typical impulse waveforms and their corresponding one-third-octave-band
spectra generated by the two impulse sources are shown in Figure 3. The spectra were
calculated by filtering ten representative free-field waveforms from each impulse source at
each test level into one-third-octave bands, computing the equivalent sound level in each
band, and averaging these values across the ten impulses. Each spectrum has been
normalized to its average value across frequency from 1000 Hz to 8000 Hz, to facilitate
comparison between the various impulses, especially in the low frequencies. As would be
expected by comparing the A durations, it is clear from these data that the impulses
generated by the shock tube contain more low-frequency energy than the impulses generated
by the AR-15. Additionally, it is evident that for a given source, lower-level impulses contain
more low-frequency energy.
To generate an impulse with the shock tube, a polyester film membrane is clamped between
flanges at one end of a cylindrical pressure chamber. After the chamber is pressurized, the
membrane is ruptured with a pointed lance and the compressed air is rapidly released,
creating a shock wave and impulse after propagation down the shock tube and attached
acoustic horn. The peak level of the resulting impulse is controlled by varying the membrane
thickness and chamber air pressure.
For the shock-tube measurements reported in this paper, an ISL acoustic test fixture (ATF)
was used to measure the open- and protected-ear waveforms and a GRAS Type 67SB blast
probe measured the free-field waveforms. The ISL ATF contained GRAS Model RA0045-
S5 ear simulators with GRAS Type 40BP ¼-inch pressure microphones, GRAS Type 26AC
microphone preamplifiers, and earcanals approximately 18 mm long (to the microphone
protection grid). The blast probe contained a GRAS Type 40DP 1/8-inch pressure
microphone and GRAS Type 26AC microphone preamplifier. The ATF and blast probe
microphones were located approximately 1 m away from the mouth of the acoustic horn,
with the blast probe located on the central axis of the horn and the right ear of the ATF
located approximately 0.32 m to the left of the blast probe. Both the blast probe and ATF
Fackler et al. Page 4
Int J Audiol. Author manuscript; available in PMC 2017 May 05.
Author M
anuscriptA
uthor Manuscript
Author M
anuscriptA
uthor Manuscript

were aligned to point into the throat of the acoustic horn to capture the impulses in grazing
incidence, with their microphone elements located approximately 1.1 m above the floor of
the test room. Fiberglass panels were placed on the floor between the mouth of the horn and
the blast probe and ATF microphones to minimize acoustic reflections. To generate impulses
with a nominal peak level of 168 dB, membranes with a thickness of approximately 51 μm
(2 mil) were ruptured at a gauge pressure of approximately 310 kPa (45 psi). For impulses
with nominal peak levels of 150 dB, membranes approximately 25 μm (1 mil) thick were
ruptured at a gauge pressure of approximately 68 kPa (10 psi). Due to limitations in the
generation of low-level impulses by the shock tube setup, the third set of impulses were
measured with nominal peak levels of 140 dB, not the 132 dB called for in ANSI/ASA
S12.42-2010. To generate impulses of this level, membranes with a thickness of
approximately 13 μm (0.5 mil) were ruptured at a gauge pressure of approximately 35 kPa (5
psi).
For impulses generated with the AR-15 rifle, the impulse peak level was controlled by
varying the distance from the rifle’s muzzle to the location of the ATF and free-field
microphone. The ISL ATF described above measured the in-ear waveforms, while a Brüel &
Kjær (B&K) Type 4136 ¼-inch pressure microphone and B&K Type 2669 microphone
preamplifier located beside the ATF measured the free-field waveforms. To capture impulses
with a nominal peak level of 168 dB, the ATF and free-field microphone were positioned
approximately 1.8 m to the side of and slightly behind the AR-15’s muzzle. For impulses
with a nominal peak level of 150 dB, the ATF and microphone were located approximately
4.3 m behind the rifle’s muzzle, and they were positioned approximately 25.7 m behind the
muzzle to capture impulses with a nominal peak level of 132 dB. The extended distance
required for the 132 dB impulses required the ATF and free-field microphone to be
positioned within approximately 10 m of trees at the edge of the range. In all cases, the
rifle’s muzzle and the ATF and free-field microphone diaphragms were located
approximately 1.5 m above the ground surface, with the free-field microphone oriented for
grazing incidence with respect to the impulse source. This produced ground reflections
which are clearly seen in the AR-15 impulses shown in Figure 3, especially at the 150 and
168 dB test levels. The noticeable dip in the 150 dB AR-15 spectrum at approximately 200
Hz may be attributed to the presence of this ground reflection. At the 132 dB test level, the
ground reflection is merged with the initial impulse, causing a slight elongation of the
impulse’s A duration.
For both the shock tube and AR-15, measurements were recorded with a National
Instruments (NI) PXI-1033 data acquisition chassis with an NI PXI-4462 data acquisition
module, controlled by Nelson Acoustics Trident software. The microphones were polarized
to 200 V with GRAS Type 12AA power modules. The power module was set to a unity gain
of +0 dB for the free-field microphone channel at all test levels. The gain on the ATF
channels was adjusted to −20 dB at the highest test level (168 dB peak), unity gain of +0 dB
for testing at 150 dB, and a gain of +20 dB for testing at the lowest levels (140 dB for shock
tube tests, 132 dB with the AR-15). Microphone sensitivities were verified with a GRAS
Type 42AP pistonphone at the start of each day of testing and anytime gain settings were
adjusted or instrumentation was moved. The microphone signals were sampled at a rate of
Fackler et al. Page 5
Int J Audiol. Author manuscript; available in PMC 2017 May 05.
Author M
anuscriptA
uthor Manuscript
Author M
anuscriptA
uthor Manuscript

102.4 kHz and a resolution of 24 bits; the resulting three-channel waveforms (one free-field
and two ATF ear channels) were saved digitally as calibrated WAV files for later processing.
2.2 Data Analysis
After the waveforms described in the previous section have been measured, the recorded
waveforms are processed to determine the impulsive performance of the HPDs under test. In
the following analysis procedures, the waveforms consist of the 24-bit digital recordings
described above. Prior to analysis, the peak sound pressure of the free-field channel of each
recording was used to align and truncate the waveforms; a total of 105 ms of recorded data is
used for the analysis of each trial, beginning 5 ms before the free-field peak.
2.2.1 Impulse Peak Insertion Loss (IPIL)—For reference, a summary of the IPIL data
analysis methods from ANSI/ASA S12.42-2010 is provided in the following.
The six open-ear calibration measurements at each test level are used to compute a
frequency-domain transfer function (H(f)) between the free-field microphone response
(represented by the recorded waveforms pFF,cal(t)) and the open-ear fixture response (from
the waveforms popen(t)). The calculation is performed as
(1)
where n is the calibration trial number, ℱ denotes the discrete-time Fourier transform, and
the subscripts level and ear indicate that unique transfer functions are computed at each test
level for both ATF ears.
These transfer functions are used to estimate the open-ear ATF response (popen,est) that
would have been measured during each of the ten occluded-ear measurements at each test
level. Given the free-field microphone response (waveform pFF,test(t)) from each occluded-
ear test, the ATF ear responses are estimated as
(2)
where k is the sample number (from 1 to 5) of the HPD under test, m is the repeat fitting
number (1 or 2) of the HPD, and ℱ−1 denotes the discrete-time inverse Fourier transform.
As before, the subscripts level and ear indicate that the unique transfer function Hlevel,ear(f) is used for each test level and fixture ear to predict the open-ear response.
For each test measurement, the IPIL of the HPD is computed from the estimated open-ear
and measured occluded-ear waveforms as
Fackler et al. Page 6
Int J Audiol. Author manuscript; available in PMC 2017 May 05.
Author M
anuscriptA
uthor Manuscript
Author M
anuscriptA
uthor Manuscript
(3)
where maxt denotes the maximum value across all time samples (of the absolute value of the
respective waveform), and lg denotes the common logarithm. Performing the calculation for
each ATF ear, HPD sample k, and repeat fitting m results in 20 IPIL values at each test level.
Before reporting the data, the average and standard deviation (SD) is computed across the
IPIL values at each test level for every HPD tested.
2.2.2 Impulsive Spectral Insertion Loss (ISIL)—The IPIL analysis described in the
previous section quantifies the impulsive protection of an HPD with a single number, based
on the instantaneous reduction in maximum peak level between the unoccluded and
occluded time waveforms measured. This single number does not explicitly quantify any
frequency-dependence of the HPD’s attenuation properties. To characterize the frequency-
dependence, we also analyzed the impulsive waveforms for spectral insertion loss using the
following procedure.
Transfer functions to estimate the open-ear ATF response from the free-field microphone
response were calculated as in Equation (1) above. For each occluded-ear test measurement
pclosed,level,ear,k,m(t), the appropriate transfer function (Hlevel,ear(f)) was used to estimate the
corresponding open-ear waveform popen,est,level,ear,k,m(t), as in Equation (2) above. A one-
third-octave-band spectrum from 125 Hz to 8000 Hz is then computed for each estimated
open-ear waveform and measured occluded-ear waveform. The spectrum value at each band
is calculated as the equivalent level (Leq) after filtering the waveform into the corresponding
one-third-octave band.
For each occluded measurement, the measured occluded-ear one-third-octave-band spectrum
is arithmetically subtracted from the corresponding estimated open-ear spectrum. This
results in the one-third-octave-band insertion loss spectrum, from 125 Hz to 8000 Hz. ISIL
is computed by averaging the insertion loss spectra across the ten measurement trials at each
test level, ultimately yielding three ISIL curves (one at each test level) for each HPD under
test.
2.2.3 Steady-state Insertion Loss and Real-Ear Attenuation—The insertion loss of
each HPD under test was also measured in steady-state (continuous) noise conditions. These
measurements were taken with the same ISL ATF described above for the impulse test
methods. In this case, the ATF was positioned in a pink-noise sound field, with a free-field
sound pressure level of 120 dB at the head-center position, measured without the ATF
present.
With no HPD fitted to the ATF, three open-ear measurements of pink noise were recorded
and stored as one-third-octave-band sound pressure levels. Each HPD was fitted to the ATF
three times, and occluded-ear measurements of the one-third-octave-band sound pressure
levels under the HPD were recorded for each fit. The insertion loss was obtained by
Fackler et al. Page 7
Int J Audiol. Author manuscript; available in PMC 2017 May 05.
Author M
anuscriptA
uthor Manuscript
Author M
anuscriptA
uthor Manuscript
averaging the occluded-ear measurements (across three trials and both ATF ears) and
subtracting these values from similarly-averaged open-ear levels. Like the ISIL described
above, these measurements were obtained at all one-third-octave bands with center
frequencies from 125 Hz to 8000 Hz.
Real-ear attenuation at threshold (REAT) measurements of the HPDs under test were also
obtained. These data were measured according to the experimenter-fit procedures of ANSI
S3.19-1974. In contrast to the steady-state measurements conducted at 120 dB and the
impulsive measurements obtained at higher peak sound pressure levels, REAT quantifies the
insertion loss of an HPD at sound pressure levels corresponding to the threshold of hearing
of human subjects. Even in the protected condition, these sound pressure levels did not
exceed approximately 70 dB.
Each trial during a REAT measurement consists of measuring the test subject’s auditory
threshold with and without an HPD fitted. Each threshold is determined as the subject listens
to one-third-octave-band noise stimuli, and a complete trial includes measurements with a
range of one-third-octave bands at center frequencies from 125 Hz to 8000 Hz. The insertion
loss is calculated by subtracting the open-ear threshold level from the occluded-ear threshold
level. Three repeat fittings of each HPD under test are measured on each of ten subjects. The
REAT insertion loss average and standard deviation are computed across these 30 trials for
each HPD.
During REAT measurements, the active electronics of the earmuff were turned off. These
electronics amplify low-level sounds, which would obscure the occluded thresholds
measured on the test subjects. Steady-state insertion loss and impulsive tests were conducted
with the electronics turned on, as the product would be used in these conditions. The level-
dependent electronics limit the output of the device in high-level sounds; at the steady-state
and impulsive levels reported here, any electronic reproduction of ambient sounds is
effectively disabled.
3 Results
For simplicity, the three impulse peak test levels are labeled as nominally 132 dB, 150 dB,
and 168 dB in the following figures and table. Shock-tube testing at the lowest level was
conducted at a nominal peak level of 140 dB in order to produce more ideal impulse
waveforms, as described above.
As required by ANSI/ASA S12.42-2010, the ISL ATF has a self insertion loss of greater
than or equal to 60 dB at all test frequencies, exceeding the bone-conduction limits of
human subjects. Consequently, it is possible for insertion loss measured with the ATF to
exceed values that are physically achievable by humans. Since one of the research goals of
this study is to compare the impulsively-measured results to measurements obtained on
human subjects, the ATF spectral insertion-loss measurements were adjusted to account for
bone conduction and physiological noise masking following the methods of Schroeter and
Poesselt (1986). Unfortunately, such a correction does not exist for impulsive peak
measurements.
Fackler et al. Page 8
Int J Audiol. Author manuscript; available in PMC 2017 May 05.
Author M
anuscriptA
uthor Manuscript
Author M
anuscriptA
uthor Manuscript

IPIL results for all three HPDs studied are listed in Table 1. The results are presented for
both impulse sources and all three test levels. They are presented as the mean and standard
deviation of IPIL across the ten trials for each device at each test level. These results are also
provided in graphical form for each protector in the following sections.
3.1 Foam Earplug
Results measured for the foam earplug are pictured in Figure 4. Considering first the
impulse peak insertion loss (IPIL), it is seen that the performance is relatively constant
across impulse peak levels, with an IPIL of approximately 50 dB at all three test levels.
Since this earplug is a passive device with no intentional level-dependent properties, this
agreement is expected. There is also good agreement between the IPIL measurements taken
with the shock tube and AR-15 impulse sources.
Considering the spectral insertion loss measurements, similar agreement is noted between
both impulse sources and also between impulsive and steady-state results. The insertion loss
measured with steady-state pink noise is in very good agreement with that measured with
both impulse sources, at all test levels. Additionally, the REAT measurements on human
subjects are also in generally good agreement with the other insertion loss values, although
they tend to be slightly offset towards less attenuation than the other measurements.
3.2 Electronic Earmuff
Results for the electronic earmuff are shown in Figure 5. Although this earmuff contains
active circuitry to amplify and reproduce low-level environmental sounds, at the impulsive
and steady-state test levels, these electronics should be effectively turned off. Thus, the
earmuff should respond like a passive, non-level-dependent HPD. However, the measured
IPIL increases as a function of impulse peak test level. Similar results have been observed in
previous impulse measurements of passive earmuff peak attenuation (for example, Ylikoski
et al., 1987, 1995; Zera and Mlynski, 2007; and unpublished results from our own
laboratory). As in these earlier studies, the increase in IPIL with increasing test level may be
attributed to a corresponding decrease in both the impulse’s A duration and its low-
frequency energy content.
The difference in IPIL between the shock tube and AR-15 measurements may be explained
in a similar manner. The attenuation of the electronic earmuff decreases at lower
frequencies, particularly below approximately 500 Hz. Since the shock tube impulses have
more acoustic energy at these frequencies, the IPIL measured with a shock tube may be
expected to be lower than that measured with the AR-15 impulses.
Unlike the IPIL measurements, the ISIL measured for the electronic earmuff increases only
slightly, if at all, with increasing test level. This is in agreement with previous findings that
earmuffs have a linear response to shock waves below approximately 150–160 dB, and do
not appreciably demonstrate nonlinear effects until over 170 dB (Zera and Mlynski, 2007).
Further evidence for the linear, level-independent earmuff response is provided by the
steady-state insertion loss and REAT measurements, which agree nicely with the ISIL data.
Fackler et al. Page 9
Int J Audiol. Author manuscript; available in PMC 2017 May 05.
Author M
anuscriptA
uthor Manuscript
Author M
anuscriptA
uthor Manuscript

One ISIL curve that appears out of place is that measured with the AR-15 at 132 dB. For the
outdoor measurements taken with the AR-15, some trees and other potential reflecting
surfaces were located in the vicinity of the ATF and free-field microphone at the 132 dB
level, as previously noted. Although the active electronics would not reproduce the peak of
the impulse, they may have amplified and reproduced any low-level reflected or reverberant
energy following the impulse peak. This would tend to decrease the measured ISIL, without
significantly affecting the peak insertion loss, since ISIL is computed using energy
integrated over the entire waveform recording. Such an effect would not have been noticed
with the other HPDs studied, since they are both passive devices.
3.3 Level-dependent Earplug
Results for the LD earplug are shown in Figure 6. Unlike the foam earplug and electronic
earmuff, the LD earplug contains a passive acoustic filter intended to create a level-
dependent attenuation by responding nonlinearly to increasing sound pressure level (Hamery
and Dancer, 1998). Therefore, the IPIL is expected to increase with increasing impulse level
above a transition level of approximately 120 dB (Allen and Berger, 1990), as is seen in the
measured results. As measured with the shock tube, IPIL increased from approximately 13
dB (at an impulse peak level of 140 dB), to 21 dB (at 150 dB), to 36 dB (at 168 dB). The
AR-15 IPIL values increased from 24 dB (at the 132 dB test level), to 30 dB (at 150 dB), to
37 dB (at 168 dB).
Considering the ISIL, a similar increase in attenuation with increasing test level is evident,
indicative of the inherently LD attenuation of this HPD. Unlike the IPIL data, which do not
agree in magnitude between shock tube and AR-15 measurements, the ISIL data appear to
agree well between the two impulse sources, varying only as a function of test level. Since
the spectral insertion loss may be considered a more broadly-applicable attenuation property
of an HPD than its response to an arbitrary time waveform, this insertion-loss agreement
between impulse sources is to be expected.
Examining the frequency-dependence of the insertion loss, it is seen that for the LD earplug,
the insertion loss is greatest around 3000 to 4000 Hz and decreases at lower frequencies. As
with the electronic earmuff earlier, the fact that the shock tube impulses have greater low-
frequency energy than the AR-15 impulses explains the lower IPIL measured with the shock
tube. In addition to the inherently LD response of this earplug, the decrease in low-
frequency energy of the impulses at higher test levels also likely contributes to the measured
increase in IPIL. However, as can be seen with the ISIL curves, the attenuation becomes
flatter across frequencies at higher levels (the low-frequency attenuation increases more than
the high-frequency attenuation). This may help to explain why the shock tube and AR-15
IPIL measurements almost agree at the 168 dB test level.
As with the previous HPDs, the steady-state insertion loss measured with 120 dB pink noise
and the REAT insertion loss measured on human subjects demonstrate good agreement with
the lowest-level ISIL. The REAT values tend to provide a conservative estimate of the lowest
level of impulsive protection. Since the acoustic filter element in the LD earplug is not
expected to demonstrate appreciable nonlinear effects until levels over approximately 120
Fackler et al. Page 10
Int J Audiol. Author manuscript; available in PMC 2017 May 05.
Author M
anuscriptA
uthor Manuscript
Author M
anuscriptA
uthor Manuscript

dB, the agreement between steady-state and lowest-level-impulsive measurements is
expected and indicates linear performance of the device at low levels.
4 Discussion
When considering the impulsive measurements of an HPD, the ISIL appears to be a more
complete description of the device’s performance than IPIL. In all cases where the HPD
under test was responding linearly to the applied test signals, spectral insertion loss
measured with either steady-state or impulsive noise was in agreement. Additionally, in
these cases, the REAT measurements provided a conservative estimate of the steady-state
and even the lowest-level-ISIL measurements.
Although the data collection and IPIL analysis procedure employed in this work follow the
methods of ANSI/ASA S12.42-2010, the impulses generated by the AR-15 rifle do not meet
the A-duration requirements of that standard. These impulses had an A duration of
approximately 0.3 to 0.5 ms; S12.42-2010 requires A durations of at least 0.5 ms and not
more than 2 ms. As we have shown, IPIL measured with longer-A-duration impulses
typically underestimates that which would be measured with a shorter A duration. Future
revisions to the S12.42 standard should consider allowing the use of shorter A durations for
impulsive measurements. However, IPIL measured with impulses meeting the current A-
duration requirements would provide a conservative estimate of the peak reduction of an
HPD worn for protection from impulses generated by weapons such as rifles and pistols,
including the AR-15 used in this study.
As noted above, there is currently no defined method to adjust measured IPIL values to
account for the bone-conduction limits to attenuation encountered with human subjects. A
potential for future research would be to develop such a method, so that IPIL measured on
an ATF might be more predictive of the performance obtainable by a human wearer of the
HPD tested.
5 Conclusion
The attenuation properties of three hearing protectors, including a passive foam earplug, an
electronic earmuff, and a passive level-dependent earplug, were measured in impulsive and
steady-state conditions. Measurements include impulse peak insertion loss (IPIL), impulsive
spectral insertion loss (ISIL), steady-state spectral insertion loss, and real-ear attenuation at
threshold (REAT). For the impulsive measurements, both a shock tube and an AR-15 were
used as impulse noise sources, generating impulses with varying amounts of low-frequency
energy.
IPIL was found to depend on the spectrum of the test impulse as well as the attenuation
characteristics of the HPD under test. For HPDs with less attenuation at low frequencies,
IPIL was lower for the shock tube impulse source, because it produced impulses containing
more low-frequency energy. IPIL for these devices also increased with increasing test level;
in this study, lower-level impulses also contained more low-frequency energy than higher-
level impulses. For the LD earplug, increases in IPIL with increasing test level were also
Fackler et al. Page 11
Int J Audiol. Author manuscript; available in PMC 2017 May 05.
Author M
anuscriptA
uthor Manuscript
Author M
anuscriptA
uthor Manuscript

observed, as expected from the presence of the nonlinear acoustic filter element in the
earplug.
Spectral insertion loss for an HPD under test, whether measured with the shock tube or
AR-15 impulsive sources or steady-state noise, agreed between test methods at a given test
level. For protectors that may be considered level-independent (including the passive foam
earplug, the electronic earmuff above approximately 120 dB, and the LD earplug below
approximately 120 dB), the spectral insertion loss results also agreed well between test
levels. For the LD earplug, insertion loss increased as a function of test level above
approximately 120 dB, as expected. Furthermore, shock tube and AR-15 ISIL measurements
were in agreement at a given impulse test level, demonstrating that the frequency-dependent
insertion loss is a more robust description of the HPD than its time-domain response to
arbitrary time waveforms, which is used for the computation of IPIL. For all HPDs studied
over the range of test levels studied in this paper (up to approximately 170 dB SPL), REAT
provided a conservative estimate of the spectral insertion loss, measured with either steady-
state or impulsive noise.
Acknowledgments
The authors thank Amir Khan and Taichi Murata from the National Institute for Occupational Safety and Health for their assistance with data collection for this study. The authors also thank Jeff Hamer for the use of his shooting range and his assistance with data collection. Portions of this research were presented at the 2016 Annual Conference of the National Hearing Conservation Association in San Diego, California.
Abbreviations
ANSI American National Standards Institute
ATF Acoustic test fixture
B&K Brüel & Kjær
HPD Hearing protection device
IPIL Impulse peak insertion loss
ISIL Impulsive spectral insertion loss
ISL French-German Research Institute of Saint-Louis
LD Level-dependent
NI National Instruments
REAT Real-ear attenuation at threshold
SD Standard deviation
References
Allen CH, Berger EH. Development of a unique passive hearing protector with level-dependent and flat attenuation characteristics. Noise Cont Eng J. 1990; 34(3):97–105.
Fackler et al. Page 12
Int J Audiol. Author manuscript; available in PMC 2017 May 05.
Author M
anuscriptA
uthor Manuscript
Author M
anuscriptA
uthor Manuscript
ANSI S3.19-1974. American National Standard Methods for the Measurement of Real-Ear Protection of Hearing Protectors and Physical Attenuation of Earmuffs. New York: American National Standards Institute;
ANSI/ASA S12.42-2010. American National Standard Methods for the Measurement of Insertion Loss of Hearing Protection Devices in Continuous or Impulsive Noise Using Microphone-in-Real-Ear or Acoustic Test Fixture Procedures. New York: American National Standards Institute;
Coles RRA, Garinther GR, Hodge DC, Rice CG. Hazardous exposure to impulse noise. J Acoust Soc Am. 1968; 43(2):336–343. [PubMed: 5636796]
Giguère C, Kunov H. An acoustic head simulator for hearing protector evaluation. II: Measurements in steady-state and impulse noise environments. J Acoust Soc Am. 1989; 85(3):1197–1205. [PubMed: 2708666]
Hamery, PJF., Dancer, AL. New nonlinear earplugs for protection against impulse noise. In: Carter, N., Soames, RF., editors. Noise Effects ’98 – Proceedings of the 7th Int. Cong. On Noise as a Public Health Problem; Sydney, Australia. 1998. p. 95-97.
Khan, A., Murphy, WJ., Zechmann, EL. Design and construction of an acoustic shock tube for generating high-level impulses to test hearing protection devices. Cincinnati: National Institute for Occupational Safety and Health; 2012. EPHB Report No. 250-12a
Murphy WJ, Fackler CJ, Berger EH, Shaw PB, Stergar M. Measurement of impulse peak insertion loss from two acoustic test fixtures and four hearing protector conditions with an acoustic shock tube. Noise Health. 2015; 17:364–373. [PubMed: 26356380]
Murphy WJ, Flamme GA, Meinke DK, Sondergaard J, Finan DS, et al. Measurement of impulse peak insertion loss for four hearing protection devices in field conditions. Int J Audiol. 2012; 51:S31–S42. [PubMed: 22176308]
Schroeter J, Poesselt C. The use of acoustical test fixture for the measurement of hearing protector attenuation. Part II: Modeling the external ear, simulating bone conduction, and comparing test fixture and real-ear data. J Acoust Soc Am. 1986; 80(2):505–527. [PubMed: 3745683]
Ylikoski J, Pekkarinen J, Starck J. The efficiency of earmuffs against impulse noise from firearms. Scand Audiol. 1987; 16:85–88. [PubMed: 3629173]
Ylikoski ME, Pekkarinen JO, Starck JP, Pääkkönen RJ, Ylikoski JS. Physical characteristics of gunfire impulse noise and its attenuation by hearing protectors. Scand Audiol. 1995; 24(1):3–11. [PubMed: 7761796]
Zera J, Mlynski R. Attenuation of high-level impulses by earmuffs. J Acoust Soc Am. 2007; 122(4):2082–2096. [PubMed: 17902846]
Fackler et al. Page 13
Int J Audiol. Author manuscript; available in PMC 2017 May 05.
Author M
anuscriptA
uthor Manuscript
Author M
anuscriptA
uthor Manuscript

Figure 1. Measured hearing protection devices. 3M™ E-A-R™ Classic™ Earplug (foam earplug, left),
3M™ Combat Arms™ Single-Ended Earplug (level-dependent earplug, center), and 3M™
PELTOR™ TacticalPro™ Electronic Headset (electronic earmuff, right).
Fackler et al. Page 14
Int J Audiol. Author manuscript; available in PMC 2017 May 05.
Author M
anuscriptA
uthor Manuscript
Author M
anuscriptA
uthor Manuscript
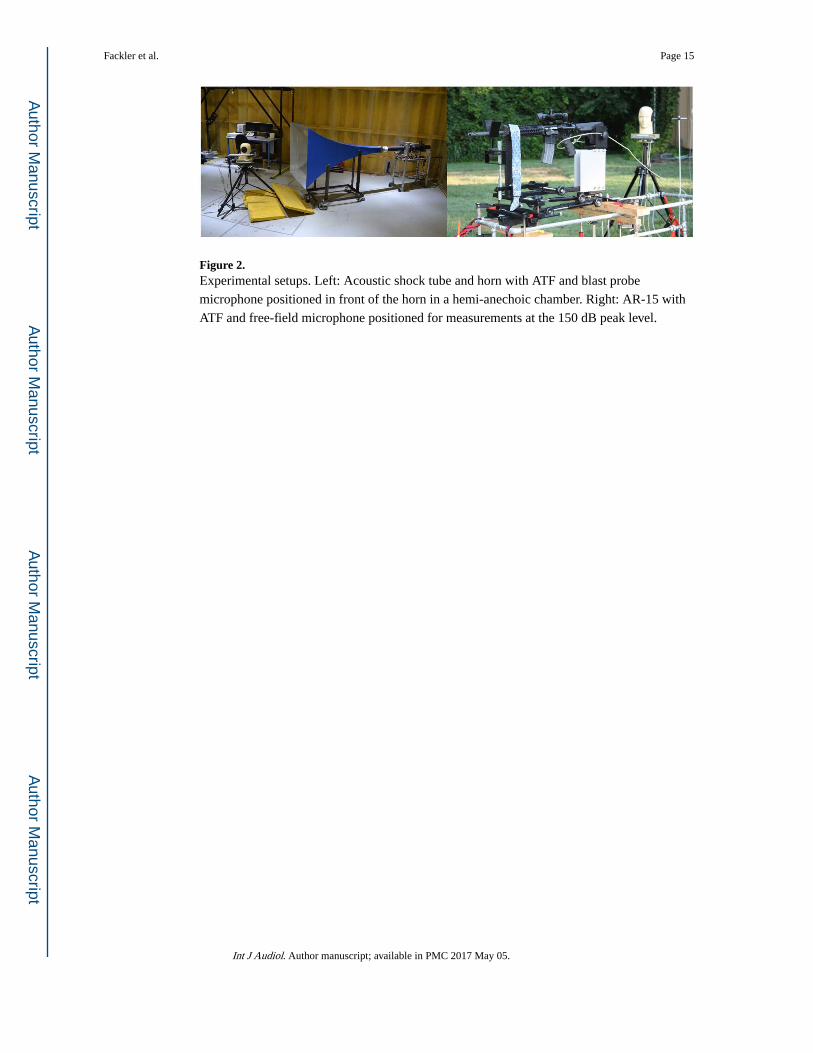
Figure 2. Experimental setups. Left: Acoustic shock tube and horn with ATF and blast probe
microphone positioned in front of the horn in a hemi-anechoic chamber. Right: AR-15 with
ATF and free-field microphone positioned for measurements at the 150 dB peak level.
Fackler et al. Page 15
Int J Audiol. Author manuscript; available in PMC 2017 May 05.
Author M
anuscriptA
uthor Manuscript
Author M
anuscriptA
uthor Manuscript
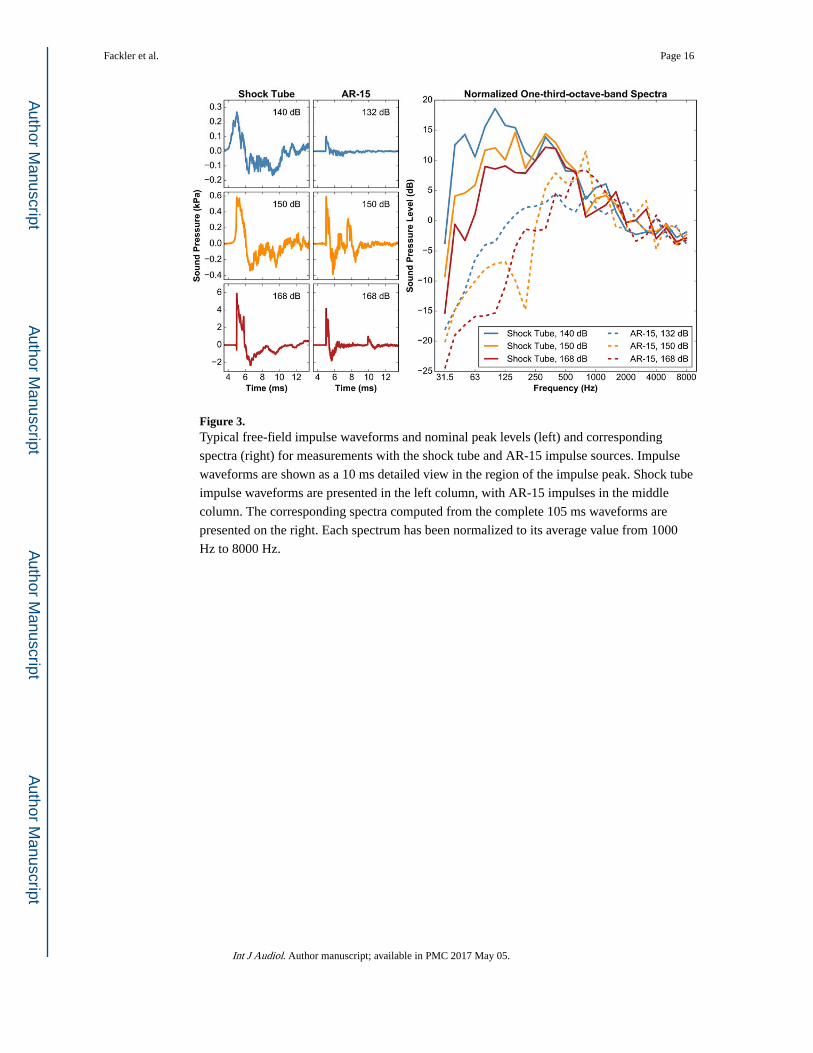
Figure 3. Typical free-field impulse waveforms and nominal peak levels (left) and corresponding
spectra (right) for measurements with the shock tube and AR-15 impulse sources. Impulse
waveforms are shown as a 10 ms detailed view in the region of the impulse peak. Shock tube
impulse waveforms are presented in the left column, with AR-15 impulses in the middle
column. The corresponding spectra computed from the complete 105 ms waveforms are
presented on the right. Each spectrum has been normalized to its average value from 1000
Hz to 8000 Hz.
Fackler et al. Page 16
Int J Audiol. Author manuscript; available in PMC 2017 May 05.
Author M
anuscriptA
uthor Manuscript
Author M
anuscriptA
uthor Manuscript
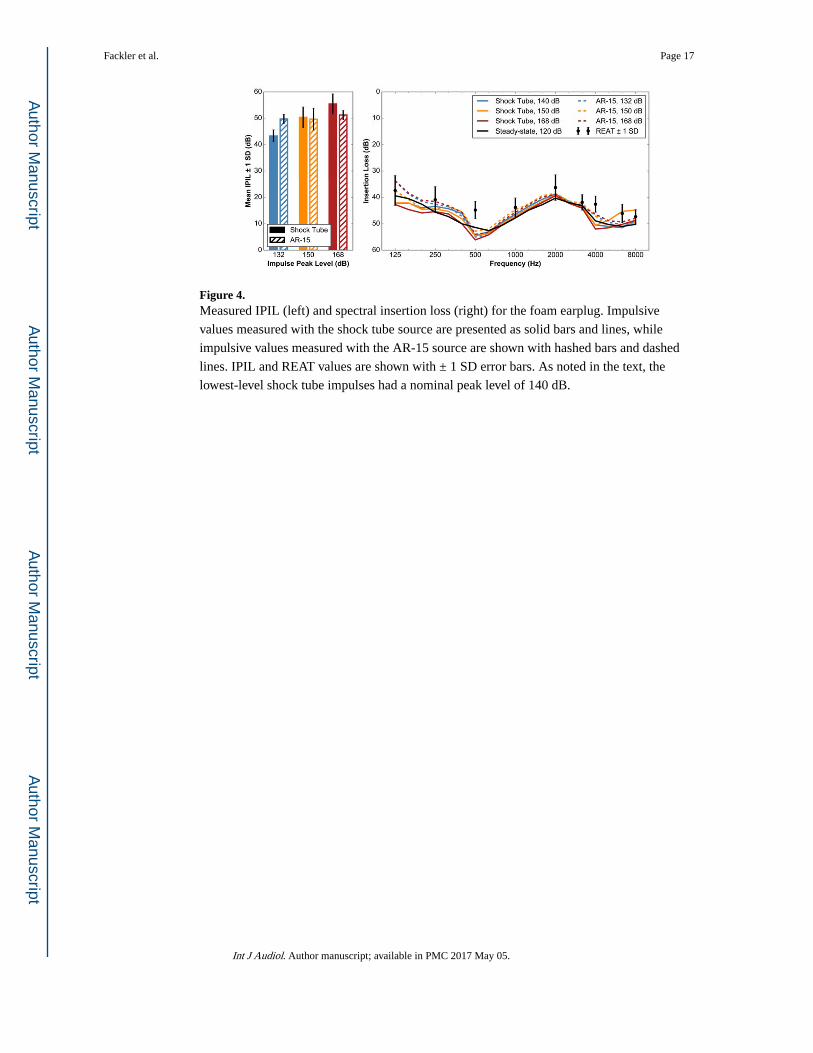
Figure 4. Measured IPIL (left) and spectral insertion loss (right) for the foam earplug. Impulsive
values measured with the shock tube source are presented as solid bars and lines, while
impulsive values measured with the AR-15 source are shown with hashed bars and dashed
lines. IPIL and REAT values are shown with ± 1 SD error bars. As noted in the text, the
lowest-level shock tube impulses had a nominal peak level of 140 dB.
Fackler et al. Page 17
Int J Audiol. Author manuscript; available in PMC 2017 May 05.
Author M
anuscriptA
uthor Manuscript
Author M
anuscriptA
uthor Manuscript

Figure 5. Measured IPIL (left) and spectral insertion loss (right) for the electronic earmuff. Impulsive
values measured with the shock tube source are presented as solid bars and lines, while
impulsive values measured with the AR-15 source are shown with hashed bars and dashed
lines. IPIL and REAT values are shown with ± 1 SD error bars. As noted in the text, the
lowest-level shock tube impulses had a nominal peak level of 140 dB.
Fackler et al. Page 18
Int J Audiol. Author manuscript; available in PMC 2017 May 05.
Author M
anuscriptA
uthor Manuscript
Author M
anuscriptA
uthor Manuscript

Figure 6. Measured IPIL (left) and spectral insertion loss (right) for the level-dependent earplug.
Impulsive values measured with the shock tube source are presented as solid bars and lines,
while impulsive values measured with the AR-15 source are shown with hashed bars and
dashed lines. IPIL and REAT values are shown with ± 1 SD error bars. As noted in the text,
the lowest-level shock tube impulses had a nominal peak level of 140 dB.
Fackler et al. Page 19
Int J Audiol. Author manuscript; available in PMC 2017 May 05.
Author M
anuscriptA
uthor Manuscript
Author M
anuscriptA
uthor Manuscript

Author M
anuscriptA
uthor Manuscript
Author M
anuscriptA
uthor Manuscript
Fackler et al. Page 20
Table 1
Measured IPIL mean values and standard deviations (mean ± 1 SD) in dB.
Device Impulse SourceImpulse Peak Level
132 dB 150 dB 168 dB
Foam EarplugShock Tube 43.3 ± 2.3 50.3 ± 4.0 55.4 ± 3.9
AR-15 49.7 ± 1.8 49.6 ± 4.2 51.2 ± 1.8
Electronic EarmuffShock Tube 21.4 ± 2.2 28.3 ± 3.5 36.7 ± 2.9
AR-15 31.4 ± 1.3 41.2 ± 2.1 44.2 ± 1.3
Level-dependent EarplugShock Tube 12.5 ± 1.5 20.6 ± 1.0 35.7 ± 1.5
AR-15 24.3 ± 0.7 29.8 ± 1.7 36.8 ± 2.0
Int J Audiol. Author manuscript; available in PMC 2017 May 05.