H.G. Infra Engineering Ltd. Harendra Singh Chairman & Managing Director “Thank you for an...
32
H.G. Infra Engineering Ltd Investor Presentation, March 2018 We make people move
Transcript of H.G. Infra Engineering Ltd. Harendra Singh Chairman & Managing Director “Thank you for an...

H.G. Infra Engineering Ltd
Investor Presentation, March 2018
We make people move
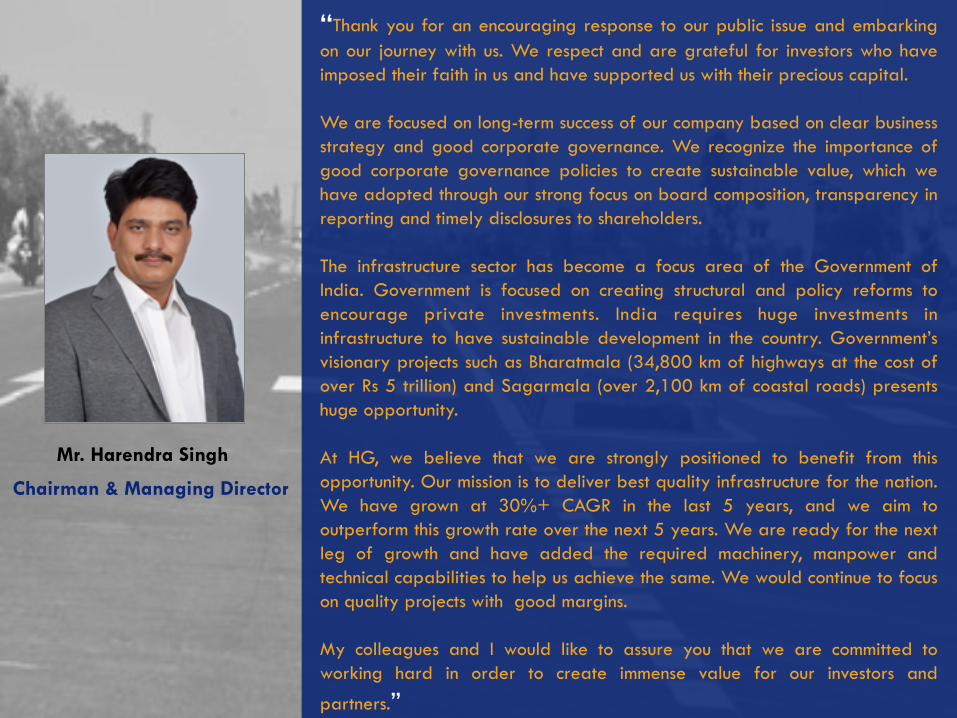
Mr. Harendra Singh
Chairman & Managing Director
“Thank you for an encouraging response to our public issue and embarking on our journey with us. We respect and are grateful for investors who have imposed their faith in us and have supported us with their precious capital. We are focused on long-term success of our company based on clear business strategy and good corporate governance. We recognize the importance of good corporate governance policies to create sustainable value, which we have adopted through our strong focus on board composition, transparency in reporting and timely disclosures to shareholders. The infrastructure sector has become a focus area of the Government of India. Government is focused on creating structural and policy reforms to encourage private investments. India requires huge investments in infrastructure to have sustainable development in the country. Government’s visionary projects such as Bharatmala (34,800 km of highways at the cost of over Rs 5 trillion) and Sagarmala (over 2,100 km of coastal roads) presents huge opportunity. At HG, we believe that we are strongly positioned to benefit from this opportunity. Our mission is to deliver best quality infrastructure for the nation. We have grown at 30%+ CAGR in the last 5 years, and we aim to outperform this growth rate over the next 5 years. We are ready for the next leg of growth and have added the required machinery, manpower and technical capabilities to help us achieve the same. We would continue to focus on quality projects with good margins. My colleagues and I would like to assure you that we are committed to working hard in order to create immense value for our investors and
partners.”

About the Company
Key Strengths and Drivers
Financial Highlights
Growth Strategy
01
02
03
04
Outline
About the Company 01

Company Overview Experienced roads and highways construction company
5
Years of track record in
project execution
15 projects under execution
(21 roads & highways)
27 Number of plant &
machinery
1,000+
States where projects
have been executed
6 Qualified and
experienced employees
2,400+ Order Book (Rs 37,078mn
unexecuted as on Nov 30, 2017 +
Rs 11,624mn L1 orders)
Rs 48,702 mn
4,447
9,703
FY14 FY17
Revenue (30% CAGR)
Financials in Rs mn; standalone numbers All operational data is as on Nov 30, 2017
506
1,198
FY14 FY17
EBITDA (33% CAGR)
109
533
FY14 FY17
PAT (70% CAGR)

Track Record Executed projects across geographies and clients
6
16
7
1 1
1
1 9
3
1
No. of completed projects
No. of ongoing projects
Presence across 6 states Clients
Accreditations and awards
u Letter of appreciation in 2012 from L&T for being the most quality consciousness sub-contractor
u Bonus from PWD for early completion of widening and strengthening of NH-96 Faizabad-Allahabad Road in UP
All operational data is as on Nov 30, 2017
Quality Management Environment Management Health & Safety
Pre-qualified to bid independently for bids by NHAI and MoRTH for contract values of up to Rs 8,000 mn
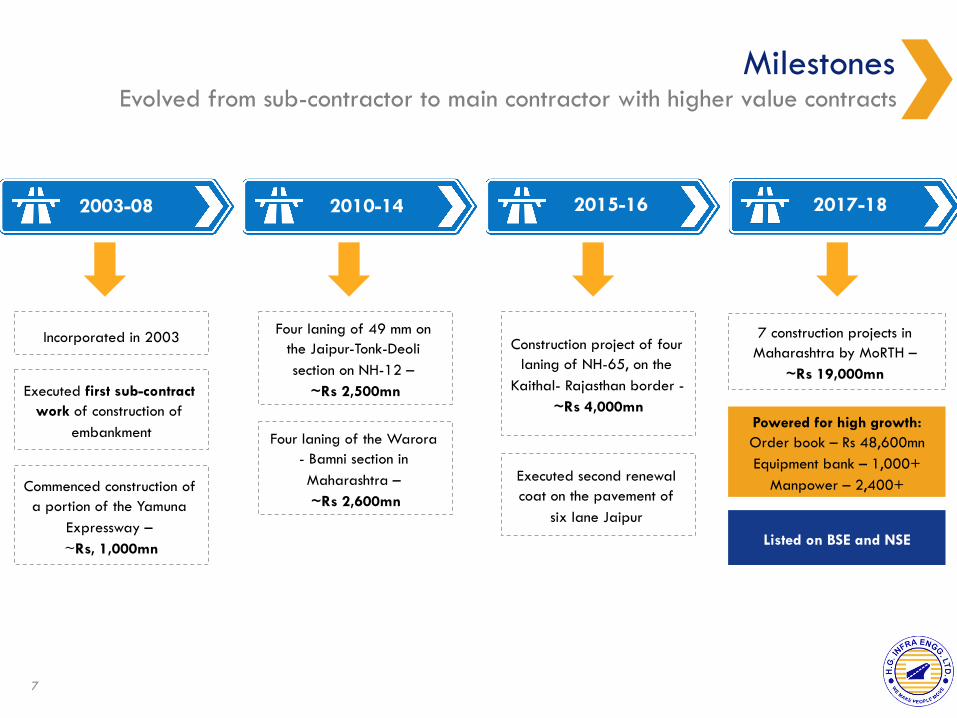
Milestones Evolved from sub-contractor to main contractor with higher value contracts
7
Incorporated in 2003
2003-08 2010-14 2015-16 2017-18
Executed first sub-contract work of construction of
embankment
Commenced construction of a portion of the Yamuna
Expressway – ~Rs, 1,000mn
Four laning of 49 mm on the Jaipur-Tonk-Deoli section on NH-12 –
~Rs 2,500mn
Four laning of the Warora - Bamni section in Maharashtra – ~Rs 2,600mn
Construction project of four laning of NH-65, on the
Kaithal- Rajasthan border - ~Rs 4,000mn
Executed second renewal coat on the pavement of
six lane Jaipur
7 construction projects in Maharashtra by MoRTH –
~Rs 19,000mn
Powered for high growth: Order book – Rs 48,600mn Equipment bank – 1,000+
Manpower – 2,400+
Listed on BSE and NSE
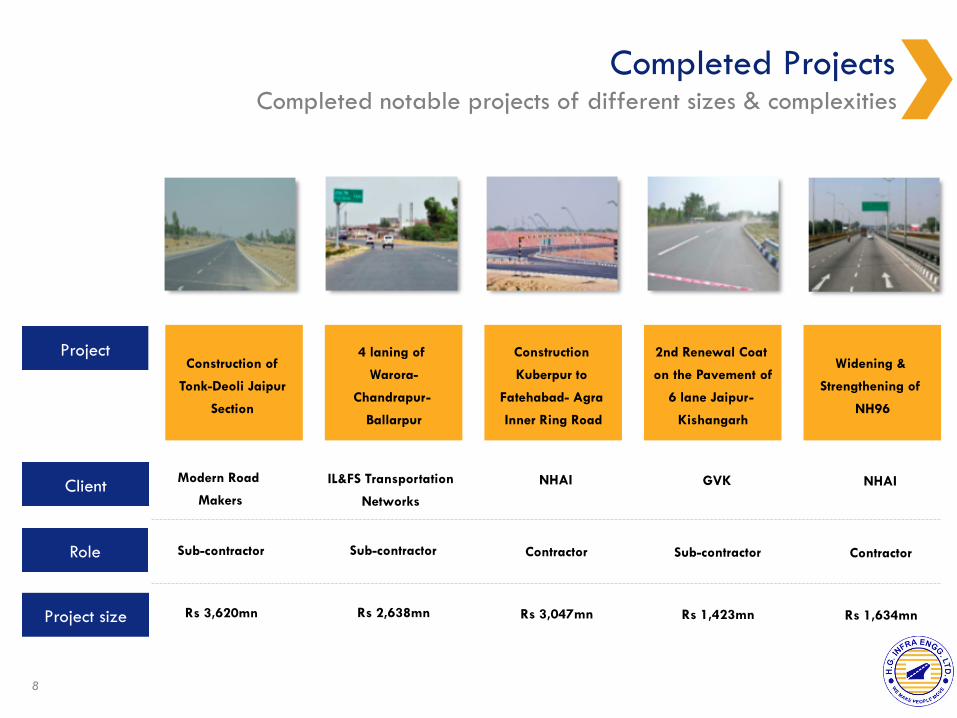
Completed Projects Completed notable projects of different sizes & complexities
8
Project
Client
Role
Project size
Construction of
Tonk-Deoli Jaipur
Section
4 laning of
Warora-
Chandrapur-
Ballarpur
Construction
Kuberpur to
Fatehabad- Agra
Inner Ring Road
2nd Renewal Coat
on the Pavement of
6 lane Jaipur-
Kishangarh
Widening &
Strengthening of
NH96
Modern Road
Makers
IL&FS Transportation
Networks NHAI NHAI GVK
Sub-contractor Sub-contractor Contractor Contractor
Sub-contractor
Rs 3,620mn Rs 2,638mn Rs 1,634mn Rs 3,047mn
Rs 1,423mn
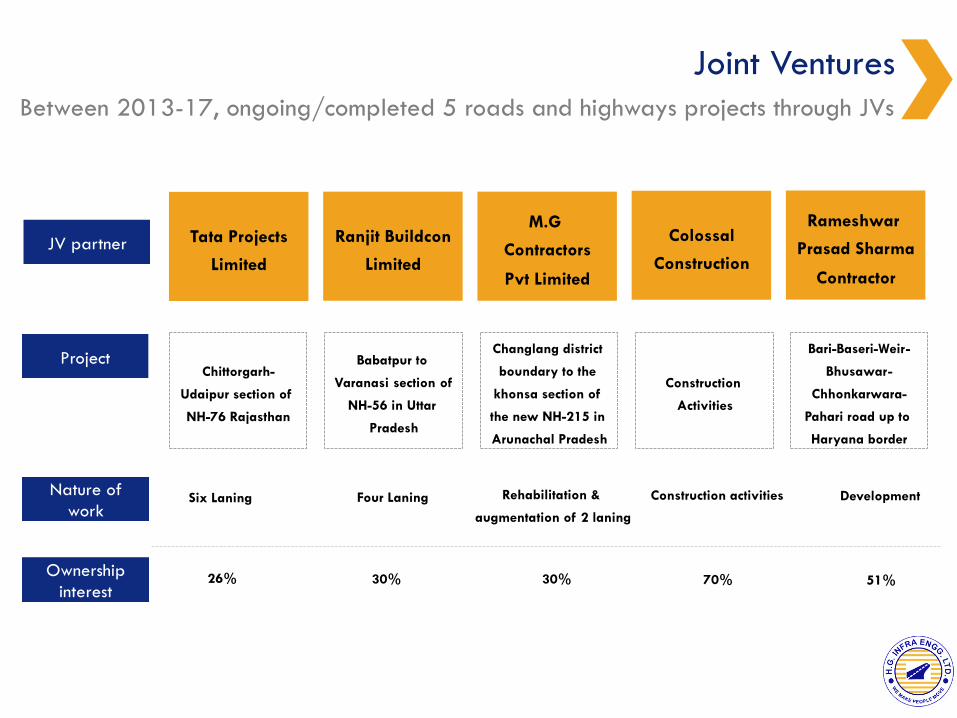
Joint Ventures Between 2013-17, ongoing/completed 5 roads and highways projects through JVs
Project
Nature of work
Ownership interest
Chittorgarh-
Udaipur section of
NH-76 Rajasthan
Babatpur to
Varanasi section of
NH-56 in Uttar
Pradesh
Changlang district
boundary to the
khonsa section of
the new NH-215 in
Arunachal Pradesh
Construction
Activities
Bari-Baseri-Weir-
Bhusawar-
Chhonkarwara-
Pahari road up to
Haryana border
Six Laning Four Laning Development Rehabilitation &
augmentation of 2 laning
Construction activities
51% 30% 70% 26%
JV partner Tata Projects
Limited
Ranjit Buildcon
Limited
M.G
Contractors
Pvt Limited
Colossal
Construction
Rameshwar
Prasad Sharma
Contractor
30%
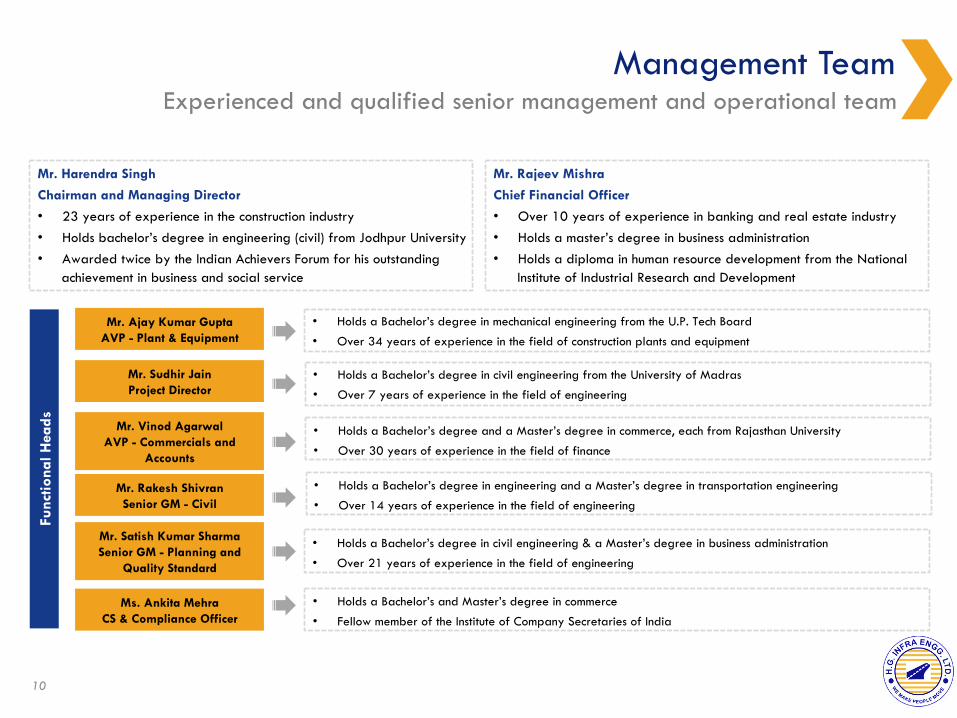
Management Team Experienced and qualified senior management and operational team
10
Func
tiona
l Hea
ds
Mr. Ajay Kumar Gupta AVP - Plant & Equipment
Mr. Sudhir Jain Project Director
Mr. Vinod Agarwal AVP - Commercials and
Accounts
Mr. Rakesh Shivran Senior GM - Civil
Mr. Satish Kumar Sharma Senior GM - Planning and
Quality Standard
Ms. Ankita Mehra CS & Compliance Officer
• Holds a Bachelor’s degree in mechanical engineering from the U.P. Tech Board
• Over 34 years of experience in the field of construction plants and equipment
• Holds a Bachelor’s degree in civil engineering from the University of Madras
• Over 7 years of experience in the field of engineering
• Holds a Bachelor’s degree and a Master’s degree in commerce, each from Rajasthan University
• Over 30 years of experience in the field of finance
• Holds a Bachelor’s degree in engineering and a Master’s degree in transportation engineering
• Over 14 years of experience in the field of engineering
• Holds a Bachelor’s degree in civil engineering & a Master’s degree in business administration
• Over 21 years of experience in the field of engineering
• Holds a Bachelor’s and Master’s degree in commerce
• Fellow member of the Institute of Company Secretaries of India
Mr. Harendra Singh
Chairman and Managing Director
• 23 years of experience in the construction industry • Holds bachelor’s degree in engineering (civil) from Jodhpur University • Awarded twice by the Indian Achievers Forum for his outstanding
achievement in business and social service
Mr. Rajeev Mishra
Chief Financial Officer
• Over 10 years of experience in banking and real estate industry • Holds a master’s degree in business administration • Holds a diploma in human resource development from the National
Institute of Industrial Research and Development

Board of Directors Management supported by independent Board
11
Mr. Vijendra Singh
Whole-time Director
• 23 years of experience in the construction industry • Responsible for the overall functioning of the Company
Mr. Girish Pal Singh
Non-Executive Director
• 23 years of experience in the construction industry • On the Board since the incorporation of the Company
Mr. Ashok Kumar Thakur
Independent Director
• Holds a master’s degree in commerce from Lucknow University • Over 37 years of experience in the banking industry
Mr. Onkar Singh
Independent Director
• Holds a bachelor’s & master’s degree in commerce and philosophy • Over 20 years of experience in the economic administration and rural development sector
Ms. Pooja Hemant Goyal
Independent Director
• Holds a bachelor’s degree in commerce a master’s degree in law • Over 5 years of experience in the legal industry

Key Strengths and Drivers 02

INDUSTRY OPPORTUNITY Increasing investments
Policy support and reforms Insufficient network
DIFFERENTIATED BUSINESS MODEL Evaluation and management skills
Equipment bank Project team
ROBUST ORDER BOOK 4x FY17 revenues
Provides revenue visibility
TO DRIVE GROWTH WITH
SUPERIOR MARGINS

Industry Opportunity Increasing investment in the infrastructure sector with focus on roads & highways
14
27.30 30.93
5.3 5.8
Actual Investment (FY08-FY12) Projected Investment (FY13-FY17)
Total Infrastructure Roads
u Cumulative investments in infrastructure projects from FY12-17
is estimated to be Rs 30.93 tn, up from Rs 27.3 tn in FY08-12
u Private sector is estimated to contribute 39%; 61%
contributed by the Central & State Governments
u Road sector constitutes ~19% of total spend
u Cumulative investments in road sector is expected to have risen
by 11% to Rs 5.8 tn during FY13-FY17
Government’s focus on improving domestic infrastructure leading to increasing investments in the sector (Rs tn)
278 250 243 240 236
486 495 563 677 815
262 271 294 335
381
FY13E FY14E FY15E FY16E FY17E
Centre State Private
Increasing investments in the road sector (Rs bn) .. largely driven by the government’s focus on
encouragement of public private partnerships, speedy
implementation of the National Highways Development
Project, and certain changes in policies
1,025 1,017 1,100
1,252 1,432
Source for industry data: Crisil Research, MoRTH

Industry Opportunity Several factors driving the growth in infrastructure investments
15
Policy changes fueling growth – land availability, fast-
track clearances, revival of stalled projects, etc. þ
Increasing private participation through policies which
are private sector friendly þ
Rise in government investments, reforms and higher
budgetary support þ
Healthy economic growth fuelled by increased
economic activity þ
Backbone of passenger and freight traffic þ
Road Network (FY17)
Length (in Km)
% of total length
% of total traffic
National Highways 103,933 1.71% 40%
State Highways 161,487 2.65%
60%
Other roads 5,820,744 95.64%
Total 6,086,164 100% 100%
NH constitutes a mere 1.7% of the road network but carry about 40% of the total road traffic
Expected investment of Rs 4.1 tn in next five years in NH, up by 2.8 times, as compared to past five years
Source for industry data: Crisil Research, MoRTH
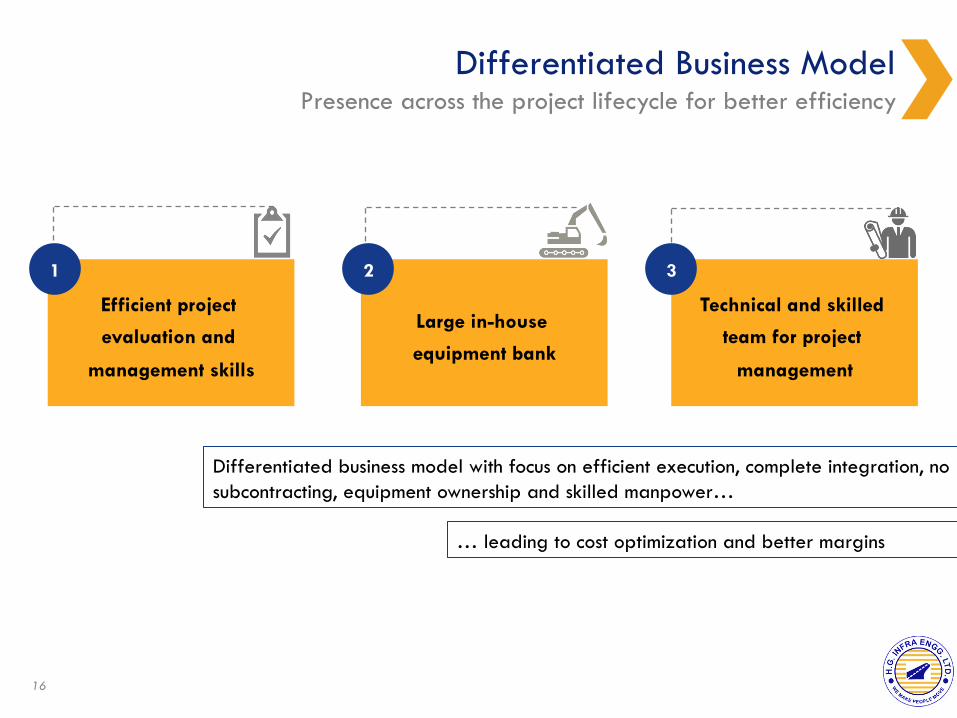
Differentiated Business Model Presence across the project lifecycle for better efficiency
16
Differentiated business model with focus on efficient execution, complete integration, no subcontracting, equipment ownership and skilled manpower…
Efficient project
evaluation and
management skills
Large in-house
equipment bank
Technical and skilled
team for project
management
1 2 3
… leading to cost optimization and better margins

Project Evaluation and Management Presence across the project lifecycle for better efficiency and cost optimization
17
Preliminary project evaluation
In-depth technical studies
Efficient bidding
Project planning and execution
Maintenance
u Focus on selection of projects with favorable execution conditions
u Projects with our hurdle rate of profitability
u In-house team for technical surveys and feasibility studies
u Analyze design parameters and cost involved in the project
u Rational bids at competitive prices based on in-house assessments
u Focus on high quality construction
u Strong internal systems and processes to track the progress and execution
u Experienced execution team to ensure timely and cost effective execution
u In-house team for maintenance related activities; reduces operational cost
1

1,368 1,489 1,984
3,007
4,239
Mar'14 Mar'15 Mar'16 Mar'17 Nov'17
Equipment Bank Invested ~Rs 3,000 mn in plant and machinery in last 4 years
18
Crushers Compactors Graders
Pavers Mixers
Rollers Excavators Dumpers
Loaders
u Owned equipments ensures control over execution
u Ensures availability and quick mobilization
u Eliminate delays and cost over-runs due to untimely break-
downs or non-availability
Gross Block (Rs mn)
Tractors Compressors Sprayers
2
Standalone financials All operational data is as on Nov 30, 2017
Fleet of modern construction equipment totaling 1,064 for large scale execution
Preparing for next leg of growth
Rs 1,200mn+ in 8mFY18
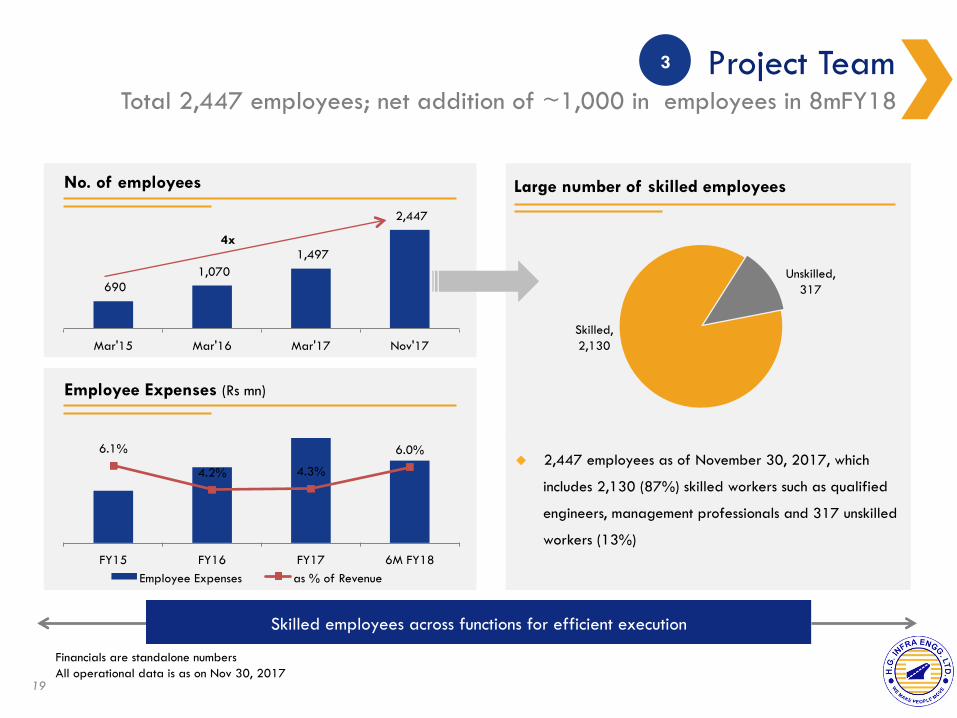
690 1,070
1,497
2,447
Mar'15 Mar'16 Mar'17 Nov'17
Project Team Total 2,447 employees; net addition of ~1,000 in employees in 8mFY18
19
u 2,447 employees as of November 30, 2017, which
includes 2,130 (87%) skilled workers such as qualified
engineers, management professionals and 317 unskilled
workers (13%)
No. of employees
Skilled, 2,130
Unskilled, 317
Skilled employees across functions for efficient execution
Large number of skilled employees
6.1%
4.2% 4.3%
6.0%
FY15 FY16 FY17 6M FY18 Employee Expenses as % of Revenue
Employee Expenses (Rs mn)
3
Financials are standalone numbers All operational data is as on Nov 30, 2017
4x
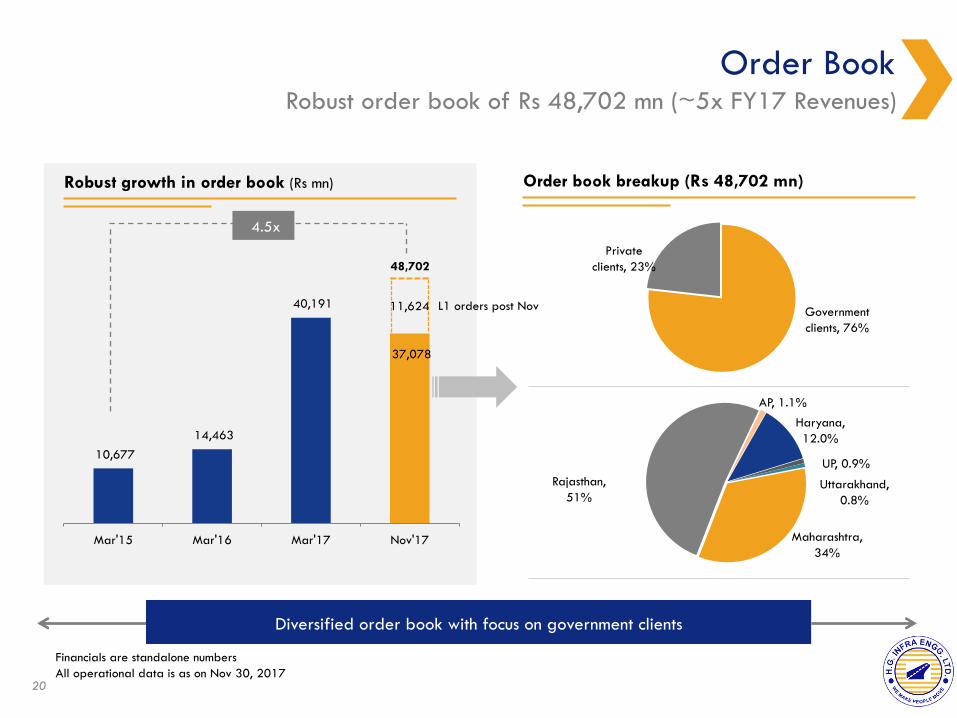
Order Book Robust order book of Rs 48,702 mn (~5x FY17 Revenues)
20
Government clients, 76%
Private clients, 23%
Maharashtra, 34%
Rajasthan, 51%
AP, 1.1%
Haryana, 12.0%
UP, 0.9%
Uttarakhand, 0.8%
10,677 14,463
40,191
37,078
Mar'15 Mar'16 Mar'17 Nov'17
Robust growth in order book (Rs mn)
4.5x
Order book breakup (Rs 48,702 mn)
Diversified order book with focus on government clients
Financials are standalone numbers All operational data is as on Nov 30, 2017
11,624 L1 orders post Nov
48,702
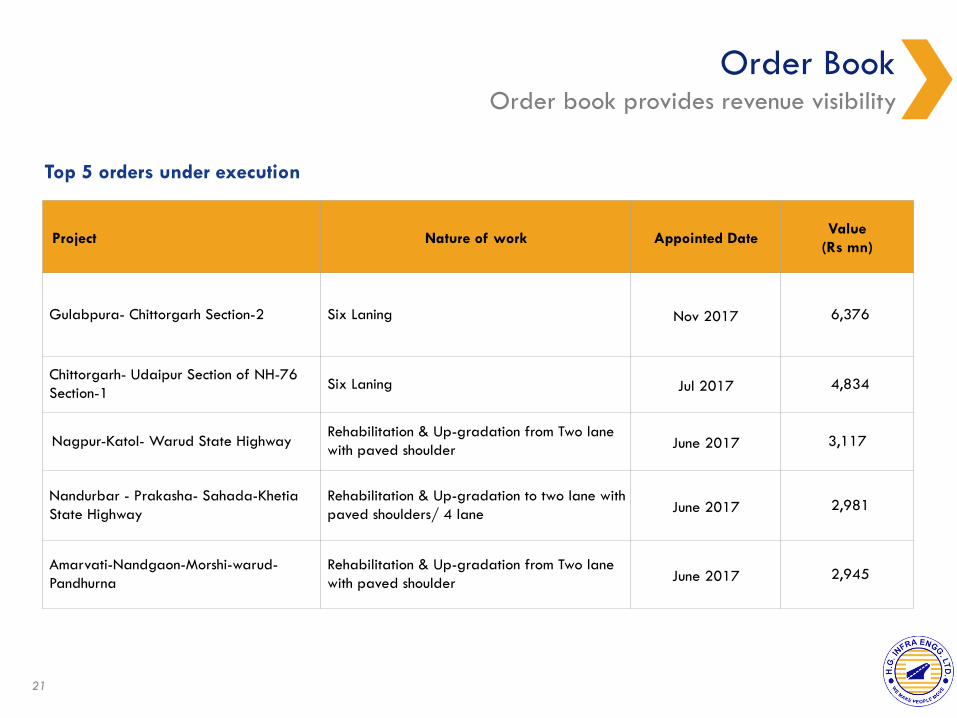
Order Book Order book provides revenue visibility
21
Project Nature of work Appointed Date Value
(Rs mn)
Gulabpura- Chittorgarh Section-2 Six Laning Nov 2017 6,376
Chittorgarh- Udaipur Section of NH-76 Section-1 Six Laning Jul 2017 4,834
Nagpur-Katol- Warud State Highway Rehabilitation & Up-gradation from Two lane with paved shoulder June 2017 3,117
Nandurbar - Prakasha- Sahada-Khetia State Highway
Rehabilitation & Up-gradation to two lane with paved shoulders/ 4 lane June 2017 2,981
Amarvati-Nandgaon-Morshi-warud-Pandhurna
Rehabilitation & Up-gradation from Two lane with paved shoulder June 2017 2,945
Top 5 orders under execution
Growth Strategy 03

Strategy Continue focus on core EPC projects with superior margins
23
Opportunities
Performance
Diversification
Business Focus
§ Focus on road and highways EPC
§ Invest in modern construction equipment
§ Attract and retain talented employees
§ SAP implementation under progress
§ Selectively explore hybrid annuity based model (to the max 25% of portfolio)
§ Diversify beyond roads and highways sector by leveraging existing capabilities
§ Railways, airport runways, and metros and water treatment and sewerage related projects
§ Reduce business concentration in limited geography
§ De-risk by expanding the presence in different states
§ Significant portion of geographic expansion to be in Gujarat, Punjab and MP
§ Focus on profitability through better project selection, timely execution and strict cost controls
§ Continued focus on WC management and cash flow generation
§ Deleverage balance sheet
Financial Highlights 04
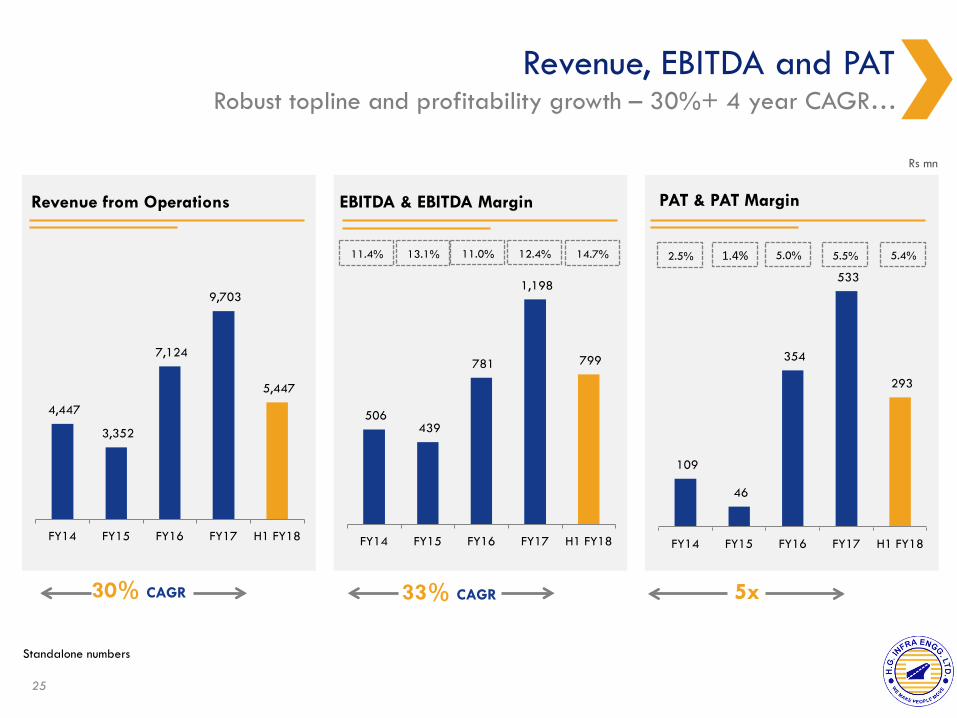
Revenue, EBITDA and PAT Robust topline and profitability growth – 30%+ 4 year CAGR…
25
4,447
3,352
7,124
9,703
5,447
FY14 FY15 FY16 FY17 H1 FY18
Revenue from Operations
30% CAGR
506 439
781
1,198
799
FY14 FY15 FY16 FY17 H1 FY18
109
46
354
533
293
FY14 FY15 FY16 FY17 H1 FY18
11.4%
EBITDA & EBITDA Margin PAT & PAT Margin
5.5% 2.5% 1.4% 5.0% 5.4%
Rs mn
Standalone numbers
33% CAGR
13.1% 14.7% 12.4% 11.0%
5x
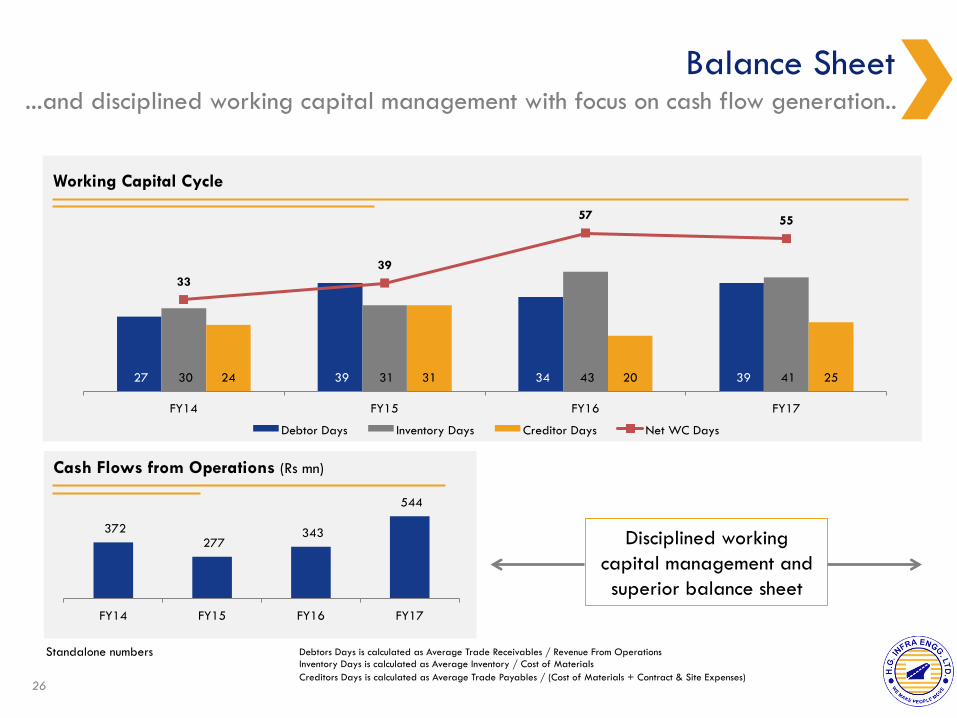
Balance Sheet ...and disciplined working capital management with focus on cash flow generation..
26
27 39 34 39 30 31 43 41 24 31 20 25
33 39
57 55
FY14 FY15 FY16 FY17
Debtor Days Inventory Days Creditor Days Net WC Days
Working Capital Cycle
372 277
343
544
FY14 FY15 FY16 FY17
Cash Flows from Operations (Rs mn)
Disciplined working capital management and superior balance sheet
Standalone numbers Debtors Days is calculated as Average Trade Receivables / Revenue From Operations Inventory Days is calculated as Average Inventory / Cost of Materials Creditors Days is calculated as Average Trade Payables / (Cost of Materials + Contract & Site Expenses)
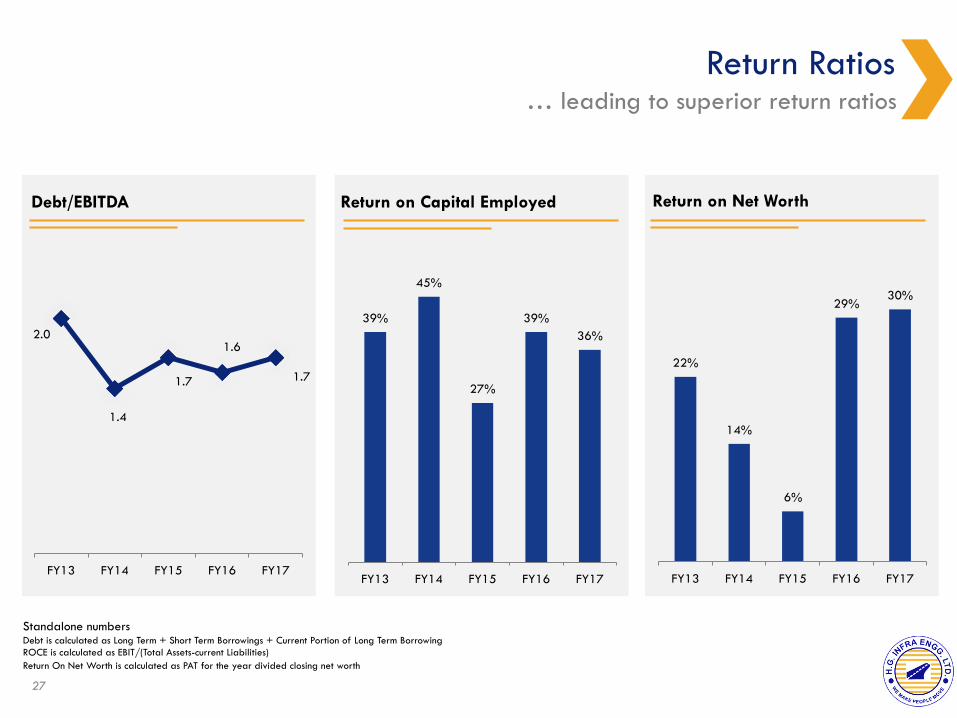
Return Ratios … leading to superior return ratios
27
2.0
1.4
1.7
1.6
1.7
FY13 FY14 FY15 FY16 FY17
Debt/EBITDA
39%
45%
27%
39% 36%
FY13 FY14 FY15 FY16 FY17
22%
14%
6%
29% 30%
FY13 FY14 FY15 FY16 FY17
Return on Capital Employed Return on Net Worth
Standalone numbers Debt is calculated as Long Term + Short Term Borrowings + Current Portion of Long Term Borrowing ROCE is calculated as EBIT/(Total Assets-current Liabilities) Return On Net Worth is calculated as PAT for the year divided closing net worth
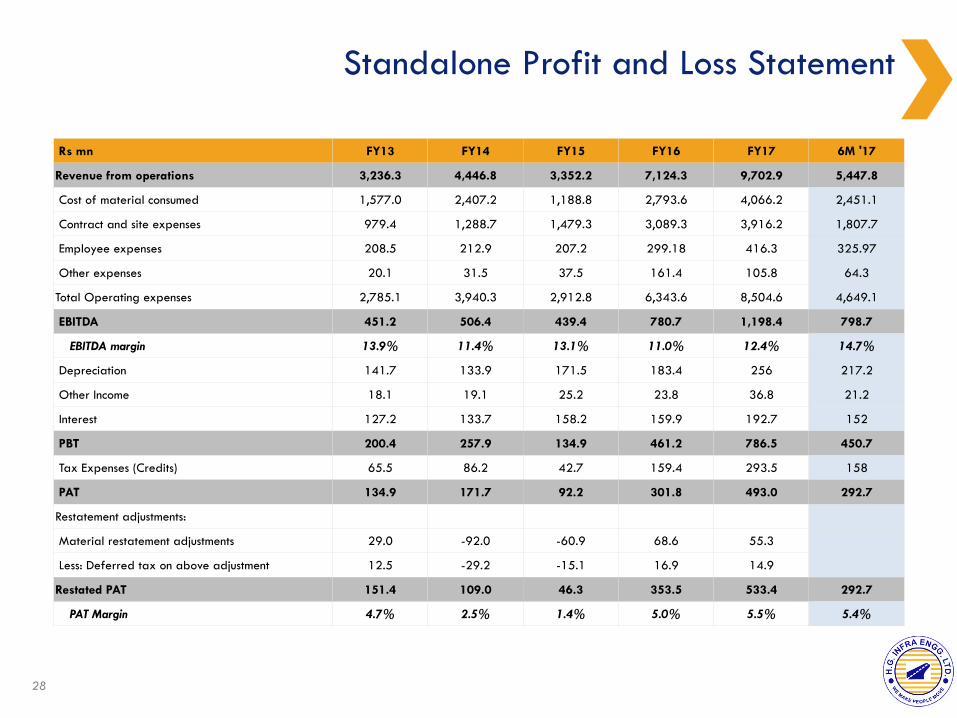
Standalone Profit and Loss Statement
28
Rs mn FY13 FY14 FY15 FY16 FY17 6M '17
Revenue from operations 3,236.3 4,446.8 3,352.2 7,124.3 9,702.9 5,447.8
Cost of material consumed 1,577.0 2,407.2 1,188.8 2,793.6 4,066.2 2,451.1
Contract and site expenses 979.4 1,288.7 1,479.3 3,089.3 3,916.2 1,807.7
Employee expenses 208.5 212.9 207.2 299.18 416.3 325.97
Other expenses 20.1 31.5 37.5 161.4 105.8 64.3
Total Operating expenses 2,785.1 3,940.3 2,912.8 6,343.6 8,504.6 4,649.1
EBITDA 451.2 506.4 439.4 780.7 1,198.4 798.7
EBITDA margin 13.9% 11.4% 13.1% 11.0% 12.4% 14.7%
Depreciation 141.7 133.9 171.5 183.4 256 217.2
Other Income 18.1 19.1 25.2 23.8 36.8 21.2
Interest 127.2 133.7 158.2 159.9 192.7 152
PBT 200.4 257.9 134.9 461.2 786.5 450.7
Tax Expenses (Credits) 65.5 86.2 42.7 159.4 293.5 158
PAT 134.9 171.7 92.2 301.8 493.0 292.7
Restatement adjustments:
Material restatement adjustments 29.0 -92.0 -60.9 68.6 55.3
Less: Deferred tax on above adjustment 12.5 -29.2 -15.1 16.9 14.9
Restated PAT 151.4 109.0 46.3 353.5 533.4 292.7
PAT Margin 4.7% 2.5% 1.4% 5.0% 5.5% 5.4%

Standalone Balance Sheet
29
Rs mn Mar’13 Mar’14 Mar’15 Mar’16 Mar’17 Sep ’17 Share Capital 152.5 152.5 152.5 180.2 180.2 540.6 Reserves 536.5 645.5 691.8 1,045.3 1,578.7 1,511.1 Shareholders' Funds 688.9 797.9 844.3 1,225.5 1,758.9 2,051.6 Secured Loans 91.8 43.7 155.0 284.5 634.8 1,130.1 Deferred Tax Liabilities 38.0 12.8 N.A N.A N.A N.A Other liabilities 23.8 14.5 87.1 88.5 295.4 378.2 Long Term Provisions 1.9 3.2 4.0 5.7 7.5 9.8 Total Non-Current Liabilities 155.6 74.2 246.1 378.6 937.7 1,518.1 Trade Payables 235.2 259.6 198.4 460.2 632.4 1,187.0 Other Current Liabilities 663.1 441.3 557.7 1,089.6 1,048.9 1,892.6 Short Term Provisions 0.9 1.5 3.2 10.2 69.5 137.4 Short Term Borrowings 522.3 573.5 399.9 589.8 932.9 1,428.2 Total Current Liabilities 1,421.5 1,275.9 1,159.2 2,149.8 2,683.6 4,645.2 Total Liabilities 2,265.9 2,148.1 2,249.6 3,753.9 5,380.2 8,214.9
Fixed Assets incl. CWIP 979.5 858.0 836.3 1,209.2 2,050.7 3,426.0 Long Term Loans & Advances 117.1 132.0 153.3 183.9 174.5 210.6 Other Non Current Assets 26.2 83.4 101.0 84.9 84.8 177.9 Total Non-Current Assets 1,122.7 1,073.4 1,090.6 1,478.1 2,309.9 3,814.4 Inventories 186.9 205.0 217.8 432.8 488.9 642.3 Sundry Debtors 357.2 289.9 419.1 926.6 1,131.5 827.0 Cash and Bank 17.0 25.3 14.3 41.1 71.8 19.0 Short term Loans and Advances 317.6 289.2 261.7 547.9 782.5 1,095.9 Other Current Assets 264.6 265.4 246.2 327.5 595.6 1,816.4 Total Current Assets 1,143.2 1,074.8 1,159.0 2,275.9 3,070.3 4,400.5 Total Assets 2,265.9 2,148.1 2,249.6 3,753.9 5,380.2 8,214.9

Consolidated Profit and Loss Statement
30
Rs mn FY14 FY15 FY16 FY17 6M '17
Revenue from operations 4,710.5 3,650.8 7,408.8 10,548.9 5,673.4
Cost of material consumed 2,347.5 1,196.7 2,830.9 4,088.7 2,464.5
Contract and site expenses 1,519.7 1,768.3 3,335.1 4,735.6 2,020.1
Employee expenses 213.0 207.3 299.6 416.6 326.1
Other expenses 32.0 38.8 162.0 106.3 64.4
Total Operating expenses 4,112.1 3,211.1 6,627.6 9,347.2 4,875.1
EBITDA 598.4 439.6 781.3 1,201.8 798.4
EBITDA margin 12.7% 12.0% 10.5% 11.4% 14.1%
Depreciation 133.9 171.5 183.4 256.0 217.2
Other Income 19.1 25.2 24.0 36.9 21.8
Interest 135.6 158.2 159.9 192.7 152.0
PBT 348.0 135.1 462.0 789.9 451.0
Tax Expenses (Credits) 86.2 42.9 160.2 297.0 158.3
PAT 261.8 92.2 301.8 493.0 292.8
Restatement adjustments:
Material restatement adjustments -92.0 -60.9 68.6 55.3 N.A
Less: Deferred tax on above adjustment -29.2 -15.1 16.9 14.9 N.A
Restated PAT 199.0 46.4 353.5 533.3 292.8
PAT Margin 4.2% 1.3% 4.8% 5.1% 5.2%

Consolidated Balance Sheet
31
Rs mn Mar’14 Mar’15 Mar’16 Mar’17 Sep ’17
Share Capital 152.5 152.5 180.2 180.2 540.6
Reserves 645.5 691.8 1045.3 1578.7 1511.1
Shareholders' Funds 798.0 844.3 1225.5 1758.9 2051.7
Long Term Borrowings 43.7 155.0 284.5 634.8 1130.1
Deferred Tax Liabilities 12.8 N.A N.A N.A N.A
Other liabilities 14.5 87.1 88.5 295.4 378.2
Long Term Provisions 3.2 4.0 5.7 7.5 9.8
Total Non-Current Liabilities 74.2 246.1 378.6 937.7 1518.1
Trade Payables 305.4 286.4 512.3 744.9 1212.2
Other Current Liabilities 468.6 630.6 1271.9 1267.0 2014.7
Short Term Provisions 1.5 3.2 4.5 62.1 129.4
Short Term Borrowings 573.5 377.9 589.9 933.0 1428.2
Total Current Liabilities 1349.0 1298.1 2378.5 3007.0 4784.5
Total Liabilities 2221.2 2388.5 3982.6 5703.5 8354.2
Fixed Assets incl. CWIP 858.0 836.3 1210.0 2050.7 3426.0
Long Term Loans & Advances 136.4 163.3 191.9 180.9 304.6
Other Non Current Assets 82.6 100.0 80.3 80.8 173.3
Total Non-Current Assets 1077.0 1099.7 1482.2 2312.3 3903.8
Inventories 205.0 217.9 435.3 492.0 643.0
Sundry Debtors 290.0 420.9 926.6 1127.8 826.9
Cash and Bank 29.8 47.2 43.5 170.3 33.9
Short term Loans and Advances 306.2 293.3 684.5 991.6 1128.1
Other Current Assets 313.4 309.6 410.5 609.4 1818.5
Total Current Assets 1144.4 1288.9 2500.4 3391.1 4450.4
Total Assets 2221.3 2388.5 3982.6 5703.4 8354.2

This presentation and the accompanying slides (the “Presentation”), which have been prepared by
HG Infra Engineering Limited (the “Company”), have been prepared solely for information
purposes and do not constitute any offer, recommendation or invitation to purchase or subscribe for
any securities, and shall not form the basis or be relied on in connection with any contract or
binding commitment whatsoever. No offering of securities of the Company will be made except by
means of a statutory offering document containing detailed information about the Company.
This Presentation has been prepared by the Company based on information and data which the
Company considers reliable, but the Company makes no representation or warranty, express or
implied, whatsoever, and no reliance shall be placed on, the truth, accuracy, completeness, fairness
and reasonableness of the contents of this Presentation. This Presentation may not be all inclusive
and may not contain all of the information that you may consider material. Any liability in respect
of the contents of, or any omission from, this Presentation is expressly excluded.
Certain matters discussed in this Presentation may contain statements regarding the Company’s
market opportunity and business prospects that are individually and collectively forward-looking
statements. Such forward-looking statements are not guarantees of future performance and are
subject to known and unknown risks, uncertainties and assumptions that are difficult to predict.
These risks and uncertainties include, but are not limited to, the performance of the Indian economy
and of the economies of various international markets, the performance of the industry in India and
world-wide, competition, the company’s ability to successfully implement its strategy, the Company’s
future levels of growth and expansion, technological implementation, changes and advancements,
changes in revenue, income or cash flows, the Company’s market preferences and its exposure to
market risks, as well as other risks. The Company’s actual results, levels of activity, performance or
achievements could differ materially and adversely from results expressed in or implied by this
Presentation. The Company assumes no obligation to update any forward-looking information
contained in this Presentation. Any forward-looking statements and projections made by third
parties included in this Presentation are not adopted by the Company and the Company is not
responsible for such third party statements and projections.
Ms. Pooja Dokania [email protected]/ 9920063991 Mr. Rajeev Menon [email protected]/ 9820240512
B/ 1011A, Kanakia Wall Street, Andheri (East), Mumbai
Mr. Rajeev Mishra CFO [email protected]
Disclaimer Company
Investor Relations Advisors: Credo Advisors
www.hginfra.com
III Floor, Sheel Mohar Plaza, A-1, Tilak Marg, C-Scheme, Jaipur- 302001