HfS Blueprint Report - · PDF fileHfS Blueprint Report ... Outsourcing Services Excerpt for...
73
Thriving in the As-A-Service Economy HfS Blueprint Report Progressive Finance & Accounting Business Process Outsourcing Services Excerpt for Infosys March, 2015 Phil Fersht President & CEO, HfS Research [email protected] Hema Santosh Senior Analyst, HfS Research [email protected]
Transcript of HfS Blueprint Report - · PDF fileHfS Blueprint Report ... Outsourcing Services Excerpt for...
Thriving in the As-A-Service Economy
HfS Blueprint Report
Progressive Finance & Accounting Business Process
Outsourcing Services
Excerpt for Infosys
March, 2015
Phil Fersht President & CEO, HfS Research
Hema Santosh Senior Analyst, HfS Research
© 2015 HfS Research Ltd. Proprietary │Page 2
Topic Page
Executive Summary 3
Research Methodology 10
Service Provider Capabilities 19
Multi-Process F&A BPO Market Size and Deal Trends 32
Global F&A BPO Market Size and Forecast 46
Service Provider Profile 57
Appendices 59
About the Authors 70
Table of Contents
Executive Summary
© 2015 HfS Research Ltd. Proprietary │Page 4
The Progressive F&A BPO HfS Blueprint Report is the first of its kind in the series of Blueprints by HfS. Unlike other quadrants and matrices, the HfS Blueprint identifies relevant differentials between service providers across a number of facets under two main categories: innovation and execution.
HfS is emphasizing the focus on “Progressive” F&A BPO, with 47% of the Blueprint scoring being tied to proven innovation capability and performance that is “progressive” for these engagements, beyond the transactional F&A processes.
HfS Blueprint Report ratings are dependent on a broad range of stakeholders with specific weightings based on 1,109 stakeholder interviews from the 2014 State of Outsourcing Survey that covered:
• F&A BPO Enterprise Service Buyers
• F&A BPO Service Providers
• F&A BPO Industry Influencers (sourcing advisors and management consultants)
• HfS Sourcing Executive Council Members with F&A BPO engagements
• HfS Research Analysts with hands-on F&A BPO knowledge and experience
Introduction to the HfS Blueprint Report:
Progressive Finance and Accounting (F&A) BPO
© 2015 HfS Research Ltd. Proprietary │Page 5
LEGACY OUTSOURCING AS-A-SERVICE ECONOMY
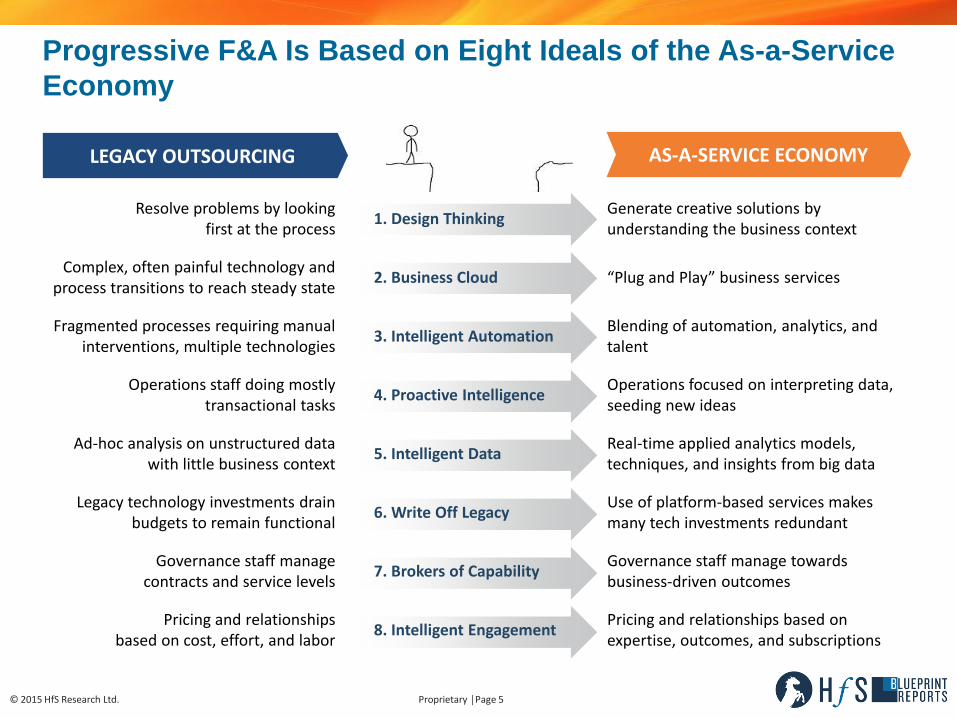
Progressive F&A Is Based on Eight Ideals of the As-a-Service
Economy
Resolve problems by looking first at the process
1. Design Thinking Generate creative solutions by understanding the business context
Complex, often painful technology and process transitions to reach steady state
2. Business Cloud “Plug and Play” business services
Fragmented processes requiring manual interventions, multiple technologies
3. Intelligent Automation Blending of automation, analytics, and talent
Operations staff doing mostly transactional tasks
4. Proactive Intelligence Operations focused on interpreting data, seeding new ideas
Ad-hoc analysis on unstructured data with little business context
5. Intelligent Data Real-time applied analytics models, techniques, and insights from big data
Legacy technology investments drain budgets to remain functional
6. Write Off Legacy Use of platform-based services makes many tech investments redundant
Governance staff manage contracts and service levels
7. Brokers of Capability Governance staff manage towards business-driven outcomes
Pricing and relationships based on cost, effort, and labor
8. Intelligent Engagement Pricing and relationships based on expertise, outcomes, and subscriptions
© 2015 HfS Research Ltd. Proprietary │Page 6
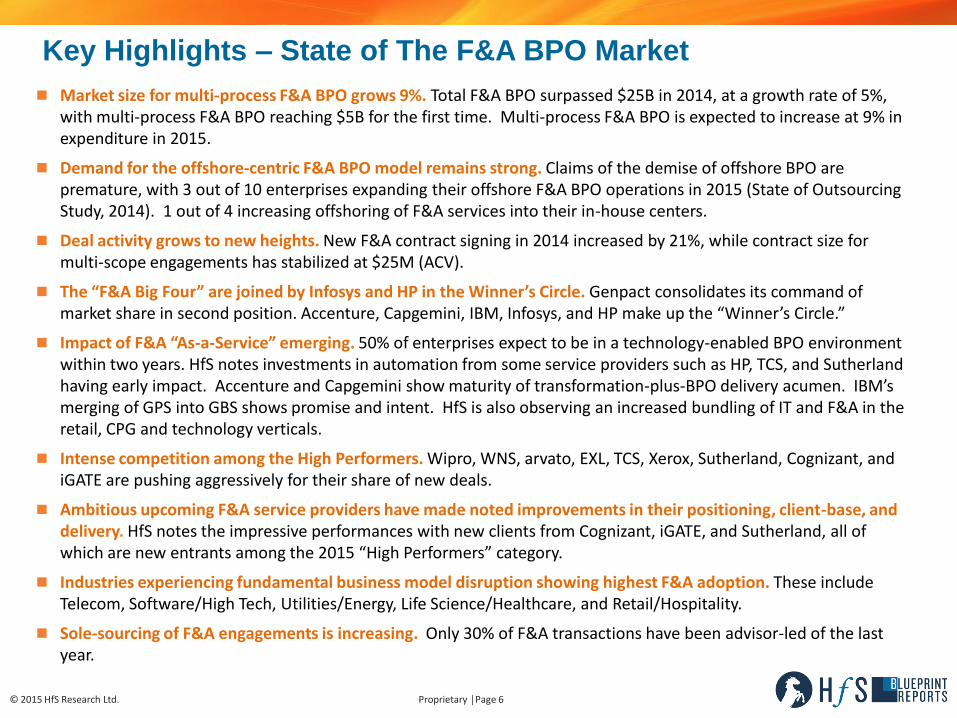
Market size for multi-process F&A BPO grows 9%. Total F&A BPO surpassed $25B in 2014, at a growth rate of 5%, with multi-process F&A BPO reaching $5B for the first time. Multi-process F&A BPO is expected to increase at 9% in expenditure in 2015.
Demand for the offshore-centric F&A BPO model remains strong. Claims of the demise of offshore BPO are premature, with 3 out of 10 enterprises expanding their offshore F&A BPO operations in 2015 (State of Outsourcing Study, 2014). 1 out of 4 increasing offshoring of F&A services into their in-house centers.
Deal activity grows to new heights. New F&A contract signing in 2014 increased by 21%, while contract size for multi-scope engagements has stabilized at $25M (ACV).
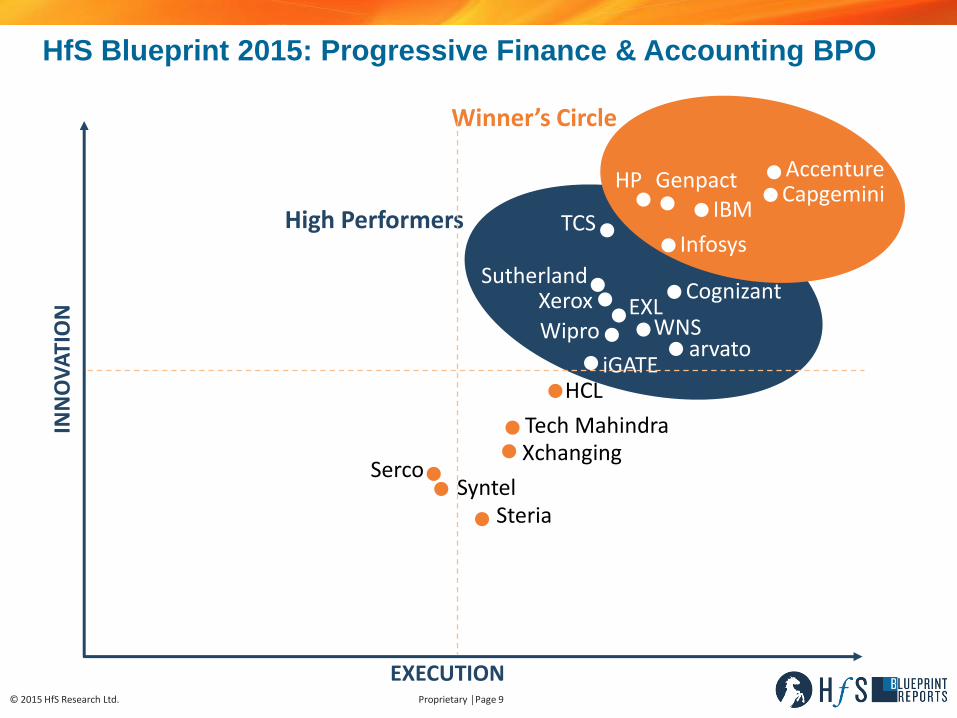
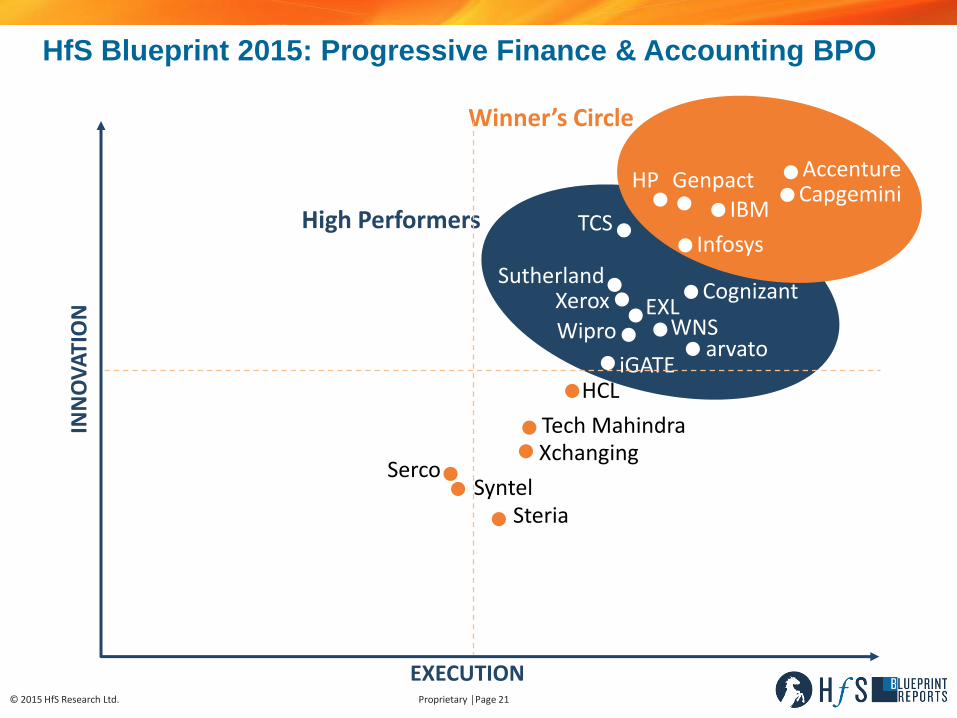
The “F&A Big Four” are joined by Infosys and HP in the Winner’s Circle. Genpact consolidates its command of market share in second position. Accenture, Capgemini, IBM, Infosys, and HP make up the “Winner’s Circle.”
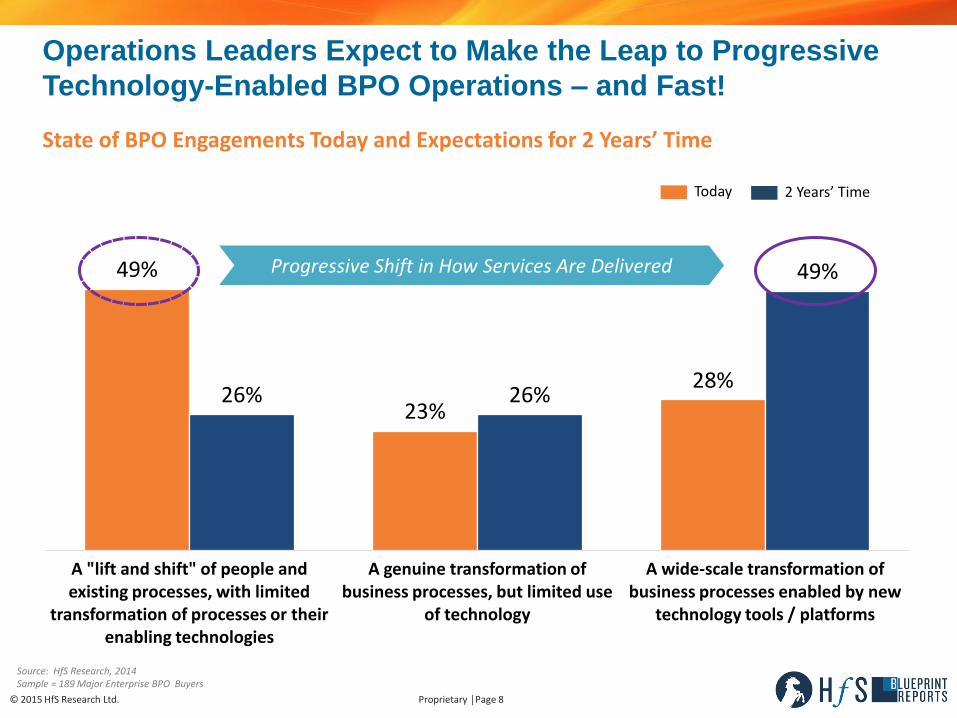
Impact of F&A “As-a-Service” emerging. 50% of enterprises expect to be in a technology-enabled BPO environment within two years. HfS notes investments in automation from some service providers such as HP, TCS, and Sutherland having early impact. Accenture and Capgemini show maturity of transformation-plus-BPO delivery acumen. IBM’s merging of GPS into GBS shows promise and intent. HfS is also observing an increased bundling of IT and F&A in the retail, CPG and technology verticals.
Intense competition among the High Performers. Wipro, WNS, arvato, EXL, TCS, Xerox, Sutherland, Cognizant, and iGATE are pushing aggressively for their share of new deals.
Ambitious upcoming F&A service providers have made noted improvements in their positioning, client-base, and delivery. HfS notes the impressive performances with new clients from Cognizant, iGATE, and Sutherland, all of which are new entrants among the 2015 “High Performers” category.
Industries experiencing fundamental business model disruption showing highest F&A adoption. These include Telecom, Software/High Tech, Utilities/Energy, Life Science/Healthcare, and Retail/Hospitality.
Sole-sourcing of F&A engagements is increasing. Only 30% of F&A transactions have been advisor-led of the last year.
Key Highlights – State of The F&A BPO Market
© 2015 HfS Research Ltd. Proprietary │Page 7
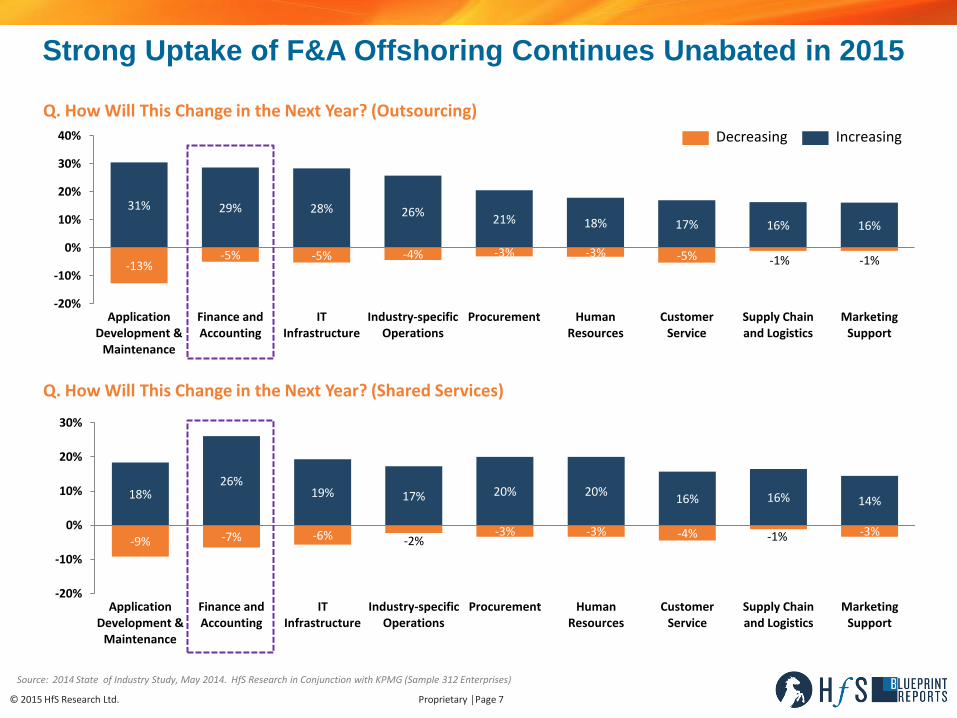
Q. How Will This Change in the Next Year? (Outsourcing)
Q. How Will This Change in the Next Year? (Shared Services)
-13% -5% -5% -4% -3% -3% -5% -1% -1%
31% 29% 28% 26% 21% 18% 17% 16% 16%
-20%
-10%
0%
10%
20%
30%
40%
Application Development &
Maintenance
Finance and Accounting
IT Infrastructure
Industry-specific Operations
Procurement Human Resources
Customer Service
Supply Chain and Logistics
Marketing Support
-9% -7% -6% -2% -3% -3% -4% -1% -3%
18% 26%
19% 17% 20% 20% 16% 16% 14%
-20%
-10%
0%
10%
20%
30%
Application Development &
Maintenance
Finance and Accounting
IT Infrastructure
Industry-specific Operations
Procurement Human Resources
Customer Service
Supply Chain and Logistics
Marketing Support
Strong Uptake of F&A Offshoring Continues Unabated in 2015
Decreasing Increasing
Source: 2014 State of Industry Study, May 2014. HfS Research in Conjunction with KPMG (Sample 312 Enterprises)
© 2015 HfS Research Ltd. Proprietary │Page 8
49%
23%
28% 26% 26%
49%
A "lift and shift" of people and existing processes, with limited
transformation of processes or their enabling technologies
A genuine transformation of business processes, but limited use
of technology
A wide-scale transformation of business processes enabled by new
technology tools / platforms
State of BPO Engagements Today and Expectations for 2 Years’ Time
Progressive Shift in How Services Are Delivered
Operations Leaders Expect to Make the Leap to Progressive
Technology-Enabled BPO Operations – and Fast!
Today 2 Years’ Time
Source: HfS Research, 2014 Sample = 189 Major Enterprise BPO Buyers
© 2015 HfS Research Ltd. Proprietary │Page 9
INN
OV
ATI
ON
EXECUTION
High Performers
Winner’s Circle
Accenture
TCS
Genpact
EXL
Capgemini
Tech Mahindra
Steria
HCL
Serco
iGATE
Xchanging
IBM
Wipro arvato
Infosys
Cognizant
Syntel
WNS Xerox
HP
Sutherland
HfS Blueprint 2015: Progressive Finance & Accounting BPO
Research Methodology
© 2015 HfS Research Ltd. Proprietary │Page 11
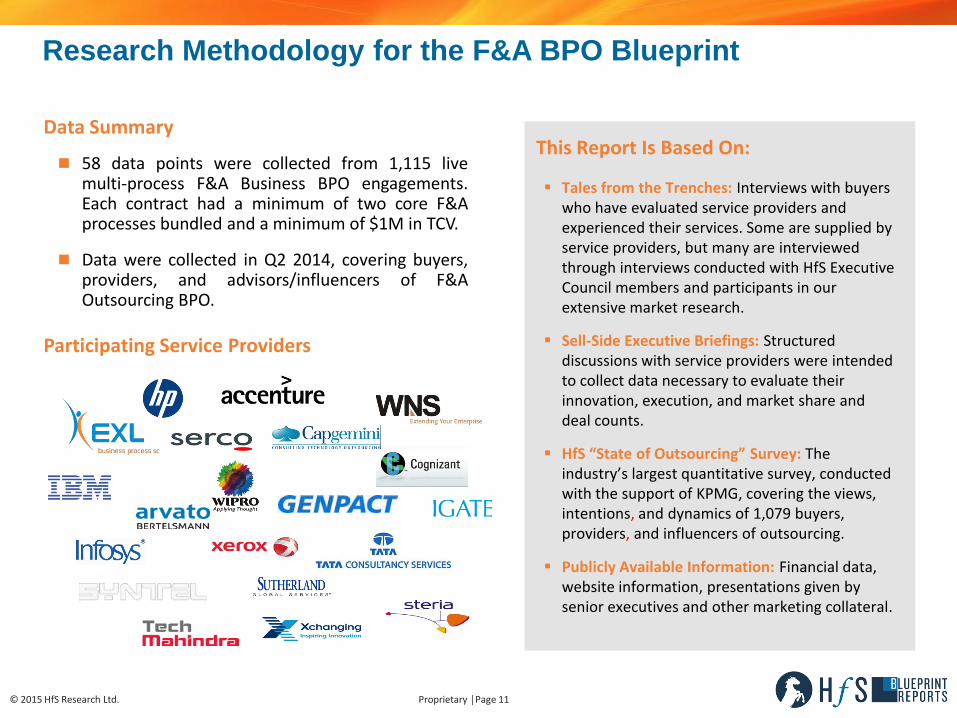
58 data points were collected from 1,115 live multi-process F&A Business BPO engagements. Each contract had a minimum of two core F&A processes bundled and a minimum of $1M in TCV.
Data were collected in Q2 2014, covering buyers, providers, and advisors/influencers of F&A Outsourcing BPO.
Tales from the Trenches: Interviews with buyers
who have evaluated service providers and experienced their services. Some are supplied by service providers, but many are interviewed through interviews conducted with HfS Executive Council members and participants in our extensive market research.
Sell-Side Executive Briefings: Structured discussions with service providers were intended to collect data necessary to evaluate their innovation, execution, and market share and deal counts.
HfS “State of Outsourcing” Survey: The industry’s largest quantitative survey, conducted with the support of KPMG, covering the views, intentions, and dynamics of 1,079 buyers, providers, and influencers of outsourcing.
Publicly Available Information: Financial data, website information, presentations given by senior executives and other marketing collateral.
This Report Is Based On:
Participating Service Providers
Data Summary
Research Methodology for the F&A BPO Blueprint
© 2015 HfS Research Ltd. Proprietary │Page 12
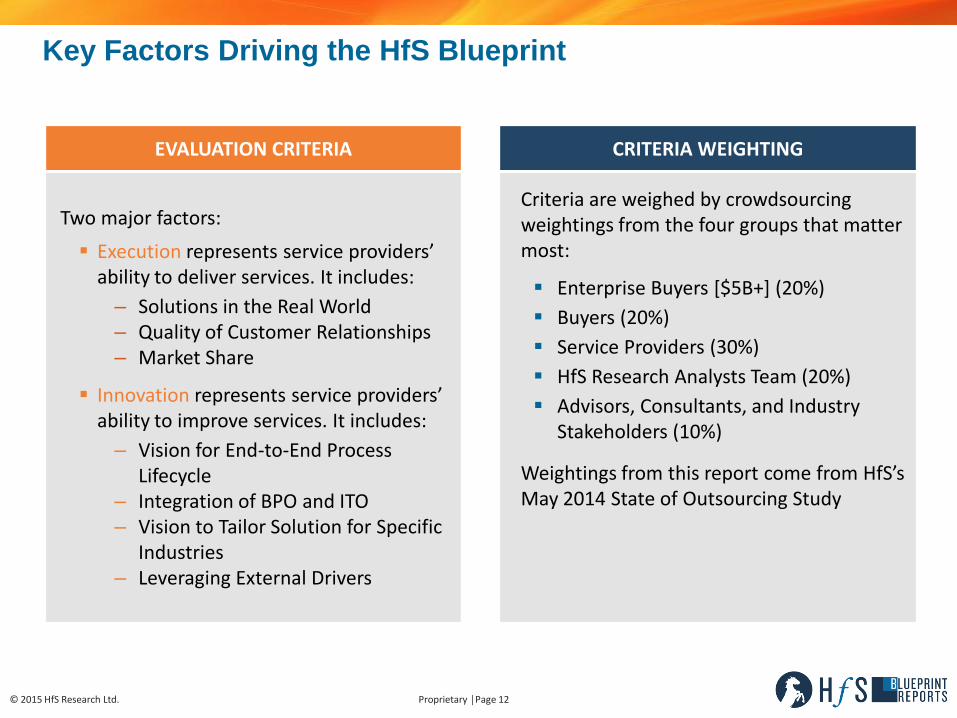
EVALUATION CRITERIA
Two major factors:
Execution represents service providers’ ability to deliver services. It includes:
– Solutions in the Real World – Quality of Customer Relationships – Market Share
Innovation represents service providers’ ability to improve services. It includes:
– Vision for End-to-End Process Lifecycle
– Integration of BPO and ITO – Vision to Tailor Solution for Specific
Industries – Leveraging External Drivers
CRITERIA WEIGHTING
Criteria are weighed by crowdsourcing weightings from the four groups that matter most:
Enterprise Buyers [$5B+] (20%)
Buyers (20%)
Service Providers (30%)
HfS Research Analysts Team (20%)
Advisors, Consultants, and Industry Stakeholders (10%)
Weightings from this report come from HfS’s May 2014 State of Outsourcing Study
Key Factors Driving the HfS Blueprint
© 2015 HfS Research Ltd. Proprietary │Page 13
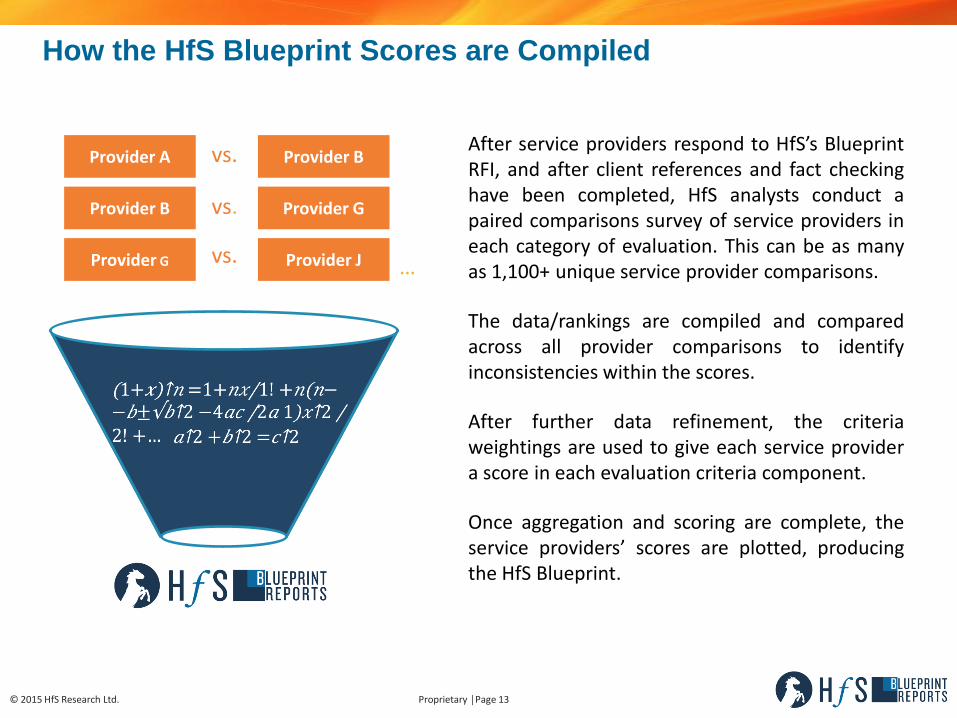
Provider G Provider J
Provider B Provider G
Provider A Provider B
vs.
vs.
vs.
…
After service providers respond to HfS’s Blueprint RFI, and after client references and fact checking have been completed, HfS analysts conduct a paired comparisons survey of service providers in each category of evaluation. This can be as many as 1,100+ unique service provider comparisons.
The data/rankings are compiled and compared across all provider comparisons to identify inconsistencies within the scores.
After further data refinement, the criteria weightings are used to give each service provider a score in each evaluation criteria component.
Once aggregation and scoring are complete, the service providers’ scores are plotted, producing the HfS Blueprint.
How the HfS Blueprint Scores are Compiled
© 2015 HfS Research Ltd. Proprietary │Page 14
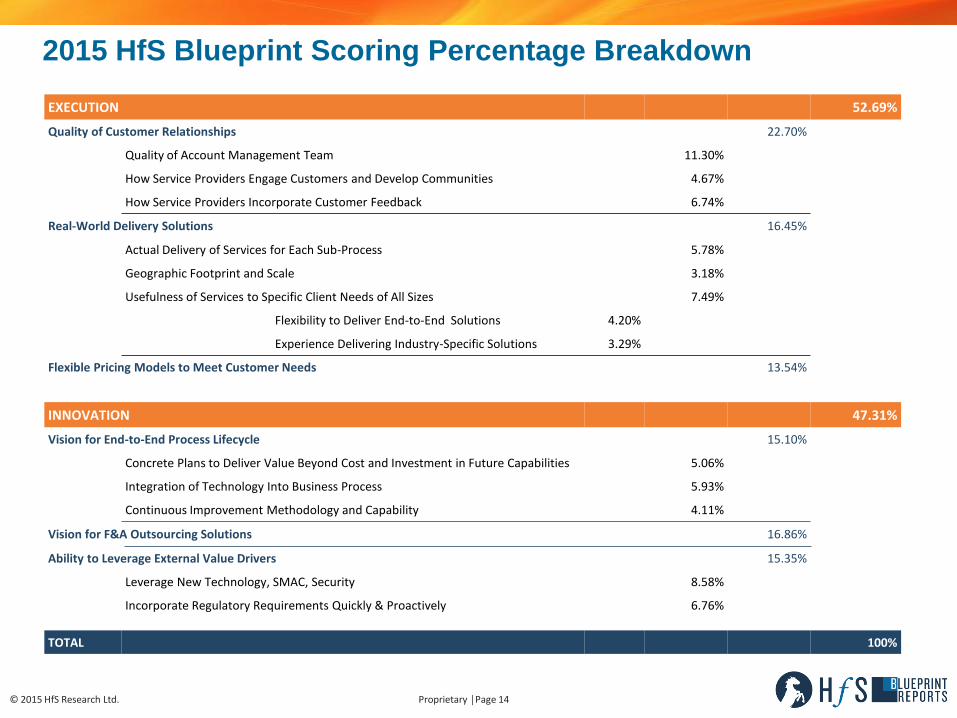
EXECUTION 52.69%
Quality of Customer Relationships 22.70%
Quality of Account Management Team 11.30%
How Service Providers Engage Customers and Develop Communities 4.67%
How Service Providers Incorporate Customer Feedback 6.74%
Real-World Delivery Solutions 16.45%
Actual Delivery of Services for Each Sub-Process 5.78%
Geographic Footprint and Scale 3.18%
Usefulness of Services to Specific Client Needs of All Sizes 7.49%
Flexibility to Deliver End-to-End Solutions 4.20%
Experience Delivering Industry-Specific Solutions 3.29%
Flexible Pricing Models to Meet Customer Needs 13.54%
INNOVATION 47.31%
Vision for End-to-End Process Lifecycle 15.10%
Concrete Plans to Deliver Value Beyond Cost and Investment in Future Capabilities 5.06%
Integration of Technology Into Business Process 5.93%
Continuous Improvement Methodology and Capability 4.11%
Vision for F&A Outsourcing Solutions 16.86%
Ability to Leverage External Value Drivers 15.35%
Leverage New Technology, SMAC, Security 8.58%
Incorporate Regulatory Requirements Quickly & Proactively 6.76%
TOTAL 100%
2015 HfS Blueprint Scoring Percentage Breakdown
© 2015 HfS Research Ltd. Proprietary │Page 15
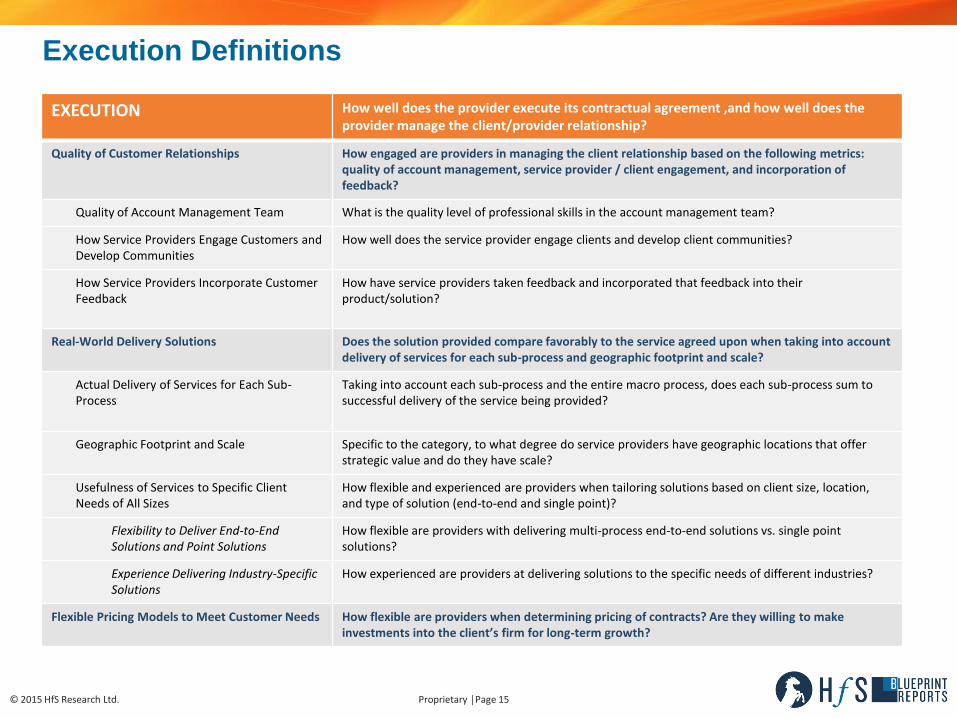
EXECUTION How well does the provider execute its contractual agreement ,and how well does the provider manage the client/provider relationship?
Quality of Customer Relationships How engaged are providers in managing the client relationship based on the following metrics: quality of account management, service provider / client engagement, and incorporation of feedback?
Quality of Account Management Team What is the quality level of professional skills in the account management team?
How Service Providers Engage Customers and Develop Communities
How well does the service provider engage clients and develop client communities?
How Service Providers Incorporate Customer Feedback
How have service providers taken feedback and incorporated that feedback into their product/solution?
Real-World Delivery Solutions Does the solution provided compare favorably to the service agreed upon when taking into account delivery of services for each sub-process and geographic footprint and scale?
Actual Delivery of Services for Each Sub-Process
Taking into account each sub-process and the entire macro process, does each sub-process sum to successful delivery of the service being provided?
Geographic Footprint and Scale Specific to the category, to what degree do service providers have geographic locations that offer strategic value and do they have scale?
Usefulness of Services to Specific Client Needs of All Sizes
How flexible and experienced are providers when tailoring solutions based on client size, location, and type of solution (end-to-end and single point)?
Flexibility to Deliver End-to-End Solutions and Point Solutions
How flexible are providers with delivering multi-process end-to-end solutions vs. single point solutions?
Experience Delivering Industry-Specific Solutions
How experienced are providers at delivering solutions to the specific needs of different industries?
Flexible Pricing Models to Meet Customer Needs How flexible are providers when determining pricing of contracts? Are they willing to make investments into the client’s firm for long-term growth?
Execution Definitions
© 2015 HfS Research Ltd. Proprietary │Page 16
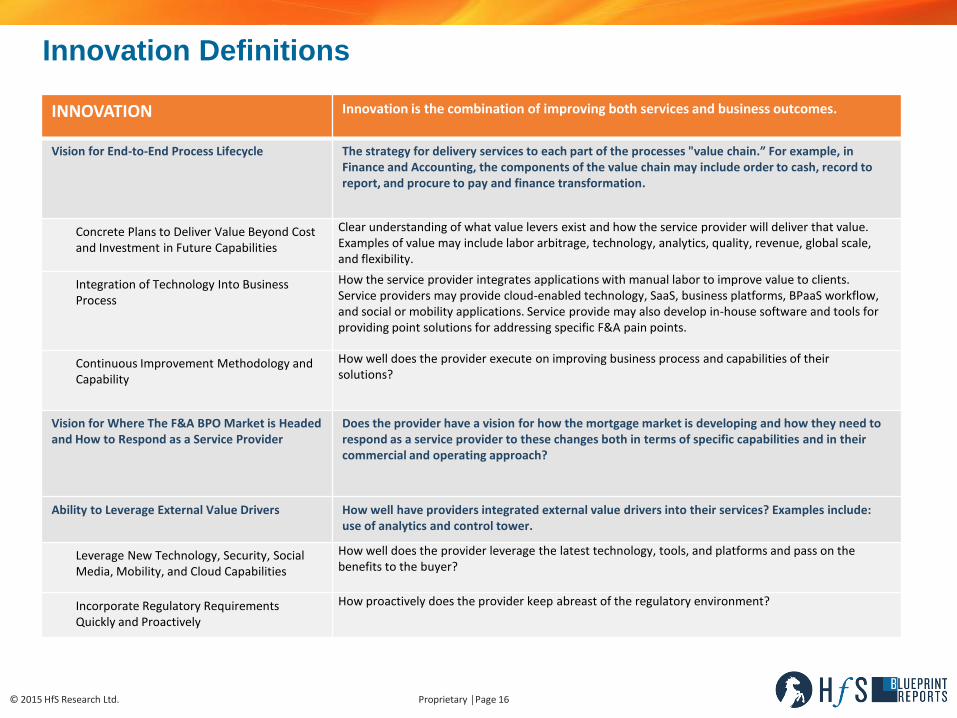
INNOVATION Innovation is the combination of improving both services and business outcomes.
Vision for End-to-End Process Lifecycle The strategy for delivery services to each part of the processes "value chain.” For example, in Finance and Accounting, the components of the value chain may include order to cash, record to report, and procure to pay and finance transformation.
Concrete Plans to Deliver Value Beyond Cost and Investment in Future Capabilities
Clear understanding of what value levers exist and how the service provider will deliver that value. Examples of value may include labor arbitrage, technology, analytics, quality, revenue, global scale, and flexibility.
Integration of Technology Into Business Process
How the service provider integrates applications with manual labor to improve value to clients. Service providers may provide cloud-enabled technology, SaaS, business platforms, BPaaS workflow, and social or mobility applications. Service provide may also develop in-house software and tools for providing point solutions for addressing specific F&A pain points.
Continuous Improvement Methodology and Capability
How well does the provider execute on improving business process and capabilities of their solutions?
Vision for Where The F&A BPO Market is Headed and How to Respond as a Service Provider
Does the provider have a vision for how the mortgage market is developing and how they need to respond as a service provider to these changes both in terms of specific capabilities and in their commercial and operating approach?
Ability to Leverage External Value Drivers How well have providers integrated external value drivers into their services? Examples include: use of analytics and control tower.
Leverage New Technology, Security, Social Media, Mobility, and Cloud Capabilities
How well does the provider leverage the latest technology, tools, and platforms and pass on the benefits to the buyer?
Incorporate Regulatory Requirements Quickly and Proactively
How proactively does the provider keep abreast of the regulatory environment?
Innovation Definitions
© 2015 HfS Research Ltd. Proprietary │Page 17
STR
ATE
GIC
IMP
OR
TAN
CE
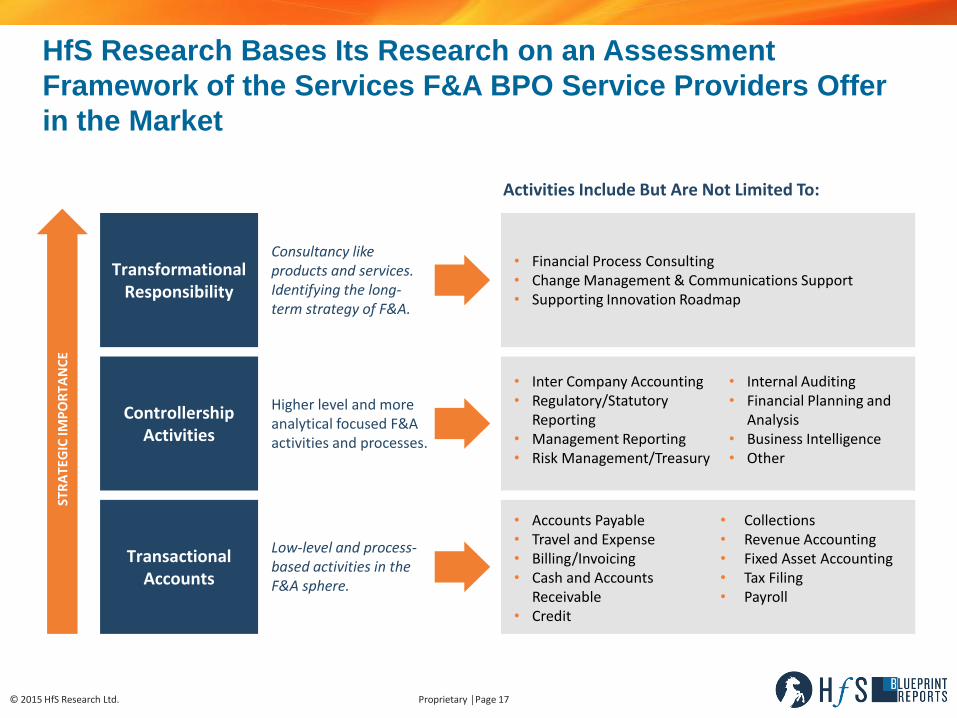
• Accounts Payable • Travel and Expense • Billing/Invoicing • Cash and Accounts
Receivable • Credit
• Collections • Revenue Accounting • Fixed Asset Accounting • Tax Filing • Payroll
• Inter Company Accounting • Regulatory/Statutory
Reporting • Management Reporting • Risk Management/Treasury
• Internal Auditing • Financial Planning and
Analysis • Business Intelligence • Other
• Financial Process Consulting • Change Management & Communications Support • Supporting Innovation Roadmap
Transactional Accounts
Controllership Activities
Transformational Responsibility
Low-level and process-based activities in the F&A sphere.
Higher level and more analytical focused F&A activities and processes.
Consultancy like products and services. Identifying the long-term strategy of F&A.
Activities Include But Are Not Limited To:
HfS Research Bases Its Research on an Assessment
Framework of the Services F&A BPO Service Providers Offer
in the Market
© 2015 HfS Research Ltd. Proprietary │Page 18
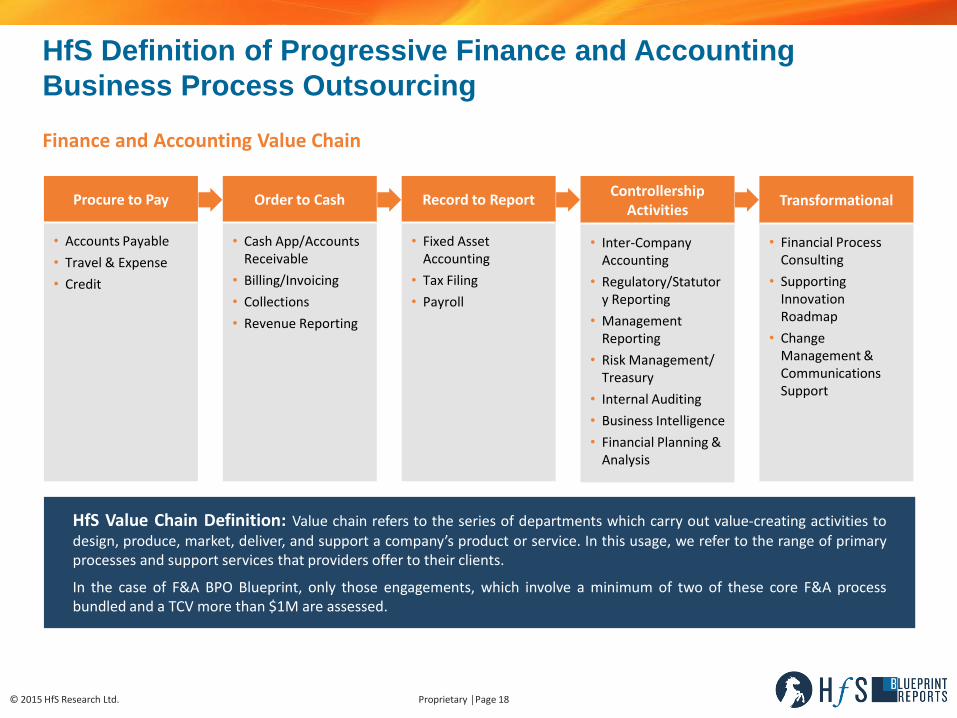
Procure to Pay
• Accounts Payable
• Travel & Expense
• Credit
Order to Cash
• Cash App/Accounts Receivable
• Billing/Invoicing
• Collections
• Revenue Reporting
Record to Report
• Fixed Asset Accounting
• Tax Filing
• Payroll
Controllership Activities
• Inter-Company Accounting
• Regulatory/Statutory Reporting
• Management Reporting
• Risk Management/ Treasury
• Internal Auditing
• Business Intelligence
• Financial Planning & Analysis
Transformational
• Financial Process Consulting
• Supporting Innovation Roadmap
• Change Management & Communications Support
Finance and Accounting Value Chain
HfS Value Chain Definition: Value chain refers to the series of departments which carry out value-creating activities to design, produce, market, deliver, and support a company’s product or service. In this usage, we refer to the range of primary processes and support services that providers offer to their clients.
In the case of F&A BPO Blueprint, only those engagements, which involve a minimum of two of these core F&A process bundled and a TCV more than $1M are assessed.
HfS Definition of Progressive Finance and Accounting
Business Process Outsourcing
Service Provider Capabilities
© 2015 HfS Research Ltd. Proprietary │Page 20
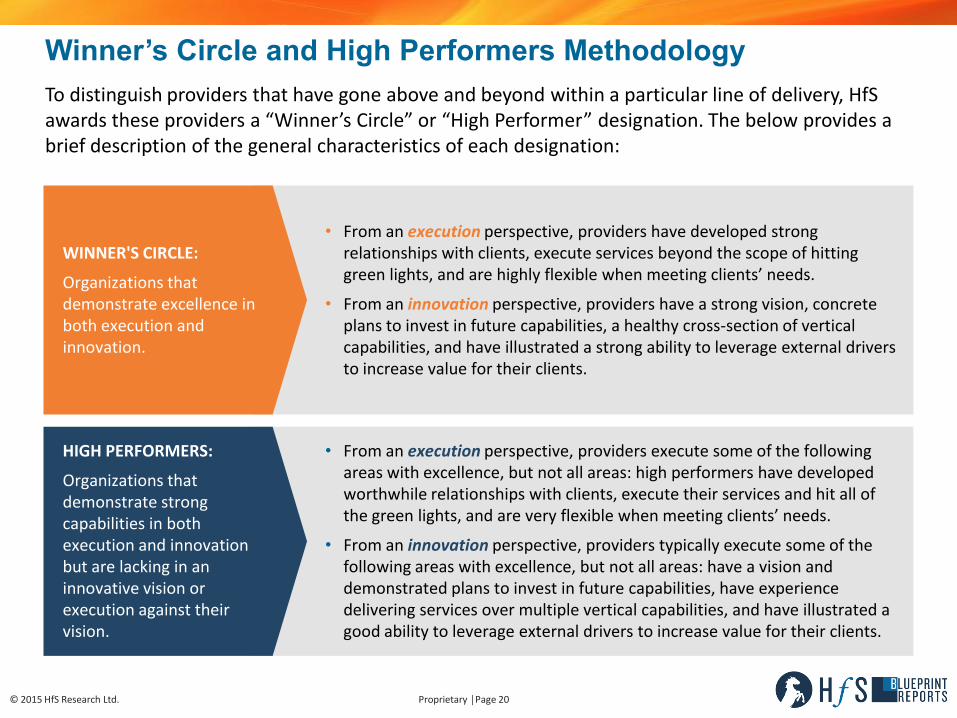
To distinguish providers that have gone above and beyond within a particular line of delivery, HfS awards these providers a “Winner’s Circle” or “High Performer” designation. The below provides a brief description of the general characteristics of each designation:
Winner’s Circle and High Performers Methodology
WINNER'S CIRCLE:
Organizations that demonstrate excellence in both execution and innovation.
• From an execution perspective, providers have developed strong relationships with clients, execute services beyond the scope of hitting green lights, and are highly flexible when meeting clients’ needs.
• From an innovation perspective, providers have a strong vision, concrete plans to invest in future capabilities, a healthy cross-section of vertical capabilities, and have illustrated a strong ability to leverage external drivers to increase value for their clients.
HIGH PERFORMERS:
Organizations that demonstrate strong capabilities in both execution and innovation but are lacking in an innovative vision or execution against their vision.
• From an execution perspective, providers execute some of the following areas with excellence, but not all areas: high performers have developed worthwhile relationships with clients, execute their services and hit all of the green lights, and are very flexible when meeting clients’ needs.
• From an innovation perspective, providers typically execute some of the following areas with excellence, but not all areas: have a vision and demonstrated plans to invest in future capabilities, have experience delivering services over multiple vertical capabilities, and have illustrated a good ability to leverage external drivers to increase value for their clients.
© 2015 HfS Research Ltd. Proprietary │Page 21
INN
OV
ATI
ON
EXECUTION
High Performers
Winner’s Circle
Accenture
TCS
Genpact
EXL
Capgemini
Tech Mahindra
Steria
HCL
Serco
iGATE
Xchanging
IBM
Wipro arvato
Infosys
Cognizant
Syntel
WNS Xerox
HP
Sutherland
HfS Blueprint 2015: Progressive Finance & Accounting BPO
© 2015 HfS Research Ltd. Proprietary │Page 22
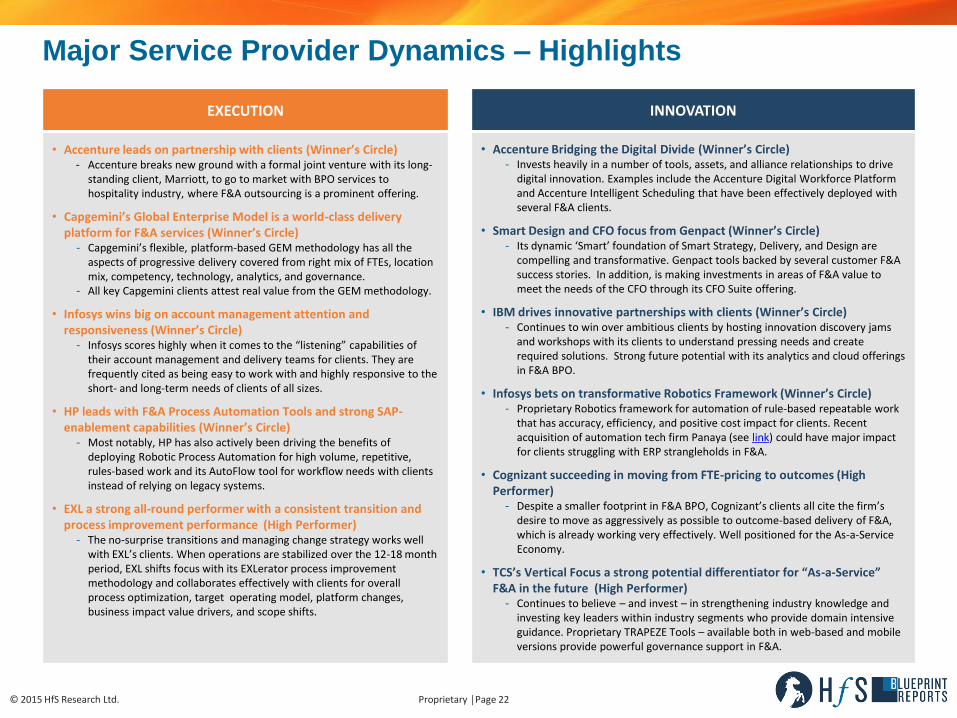
EXECUTION
• Accenture leads on partnership with clients (Winner’s Circle) - Accenture breaks new ground with a formal joint venture with its long-
standing client, Marriott, to go to market with BPO services to hospitality industry, where F&A outsourcing is a prominent offering.
• Capgemini’s Global Enterprise Model is a world-class delivery platform for F&A services (Winner’s Circle)
- Capgemini’s flexible, platform-based GEM methodology has all the aspects of progressive delivery covered from right mix of FTEs, location mix, competency, technology, analytics, and governance.
- All key Capgemini clients attest real value from the GEM methodology.
• Infosys wins big on account management attention and responsiveness (Winner’s Circle)
- Infosys scores highly when it comes to the “listening” capabilities of their account management and delivery teams for clients. They are frequently cited as being easy to work with and highly responsive to the short- and long-term needs of clients of all sizes.
• HP leads with F&A Process Automation Tools and strong SAP-enablement capabilities (Winner’s Circle)
- Most notably, HP has also actively been driving the benefits of deploying Robotic Process Automation for high volume, repetitive, rules-based work and its AutoFlow tool for workflow needs with clients instead of relying on legacy systems.
• EXL a strong all-round performer with a consistent transition and process improvement performance (High Performer)
- The no-surprise transitions and managing change strategy works well with EXL’s clients. When operations are stabilized over the 12-18 month period, EXL shifts focus with its EXLerator process improvement methodology and collaborates effectively with clients for overall process optimization, target operating model, platform changes, business impact value drivers, and scope shifts.
INNOVATION
• Accenture Bridging the Digital Divide (Winner’s Circle) - Invests heavily in a number of tools, assets, and alliance relationships to drive
digital innovation. Examples include the Accenture Digital Workforce Platform and Accenture Intelligent Scheduling that have been effectively deployed with several F&A clients.
• Smart Design and CFO focus from Genpact (Winner’s Circle) - Its dynamic ‘Smart’ foundation of Smart Strategy, Delivery, and Design are
compelling and transformative. Genpact tools backed by several customer F&A success stories. In addition, is making investments in areas of F&A value to meet the needs of the CFO through its CFO Suite offering.
• IBM drives innovative partnerships with clients (Winner’s Circle) - Continues to win over ambitious clients by hosting innovation discovery jams
and workshops with its clients to understand pressing needs and create required solutions. Strong future potential with its analytics and cloud offerings in F&A BPO.
• Infosys bets on transformative Robotics Framework (Winner’s Circle) - Proprietary Robotics framework for automation of rule-based repeatable work
that has accuracy, efficiency, and positive cost impact for clients. Recent acquisition of automation tech firm Panaya (see link) could have major impact for clients struggling with ERP strangleholds in F&A.
• Cognizant succeeding in moving from FTE-pricing to outcomes (High Performer)
- Despite a smaller footprint in F&A BPO, Cognizant’s clients all cite the firm’s desire to move as aggressively as possible to outcome-based delivery of F&A, which is already working very effectively. Well positioned for the As-a-Service Economy.
• TCS’s Vertical Focus a strong potential differentiator for “As-a-Service” F&A in the future (High Performer)
- Continues to believe – and invest – in strengthening industry knowledge and investing key leaders within industry segments who provide domain intensive guidance. Proprietary TRAPEZE Tools – available both in web-based and mobile versions provide powerful governance support in F&A.
Major Service Provider Dynamics – Highlights
© 2015 HfS Research Ltd. Proprietary │Page 23
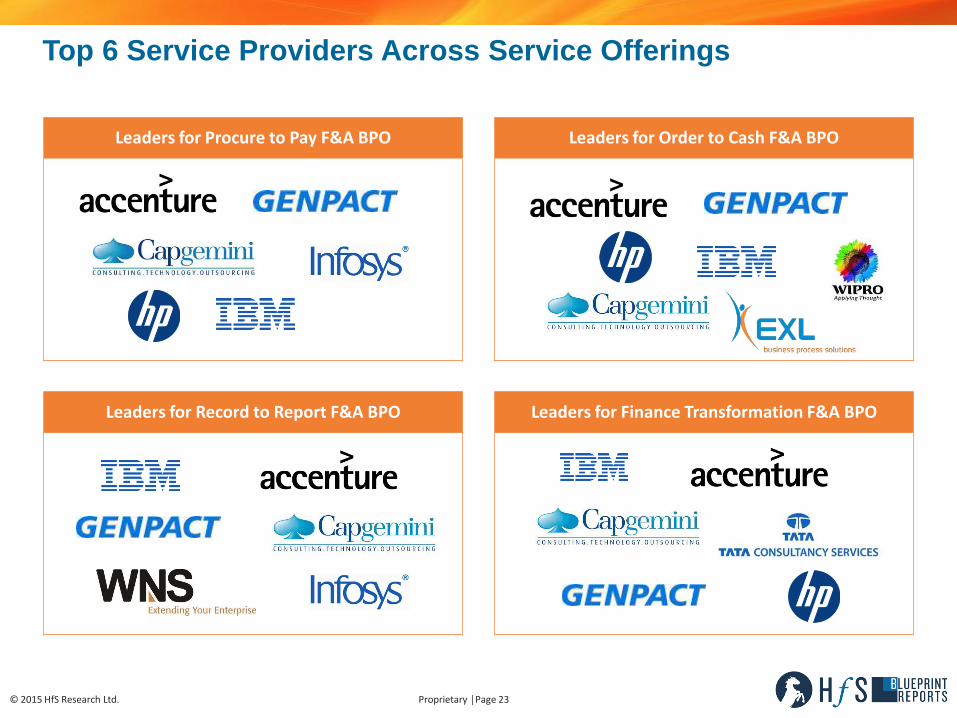
Leaders for Procure to Pay F&A BPO
Top 6 Service Providers Across Service Offerings
Leaders for Order to Cash F&A BPO
Leaders for Record to Report F&A BPO Leaders for Finance Transformation F&A BPO
© 2015 HfS Research Ltd. Proprietary │Page 24
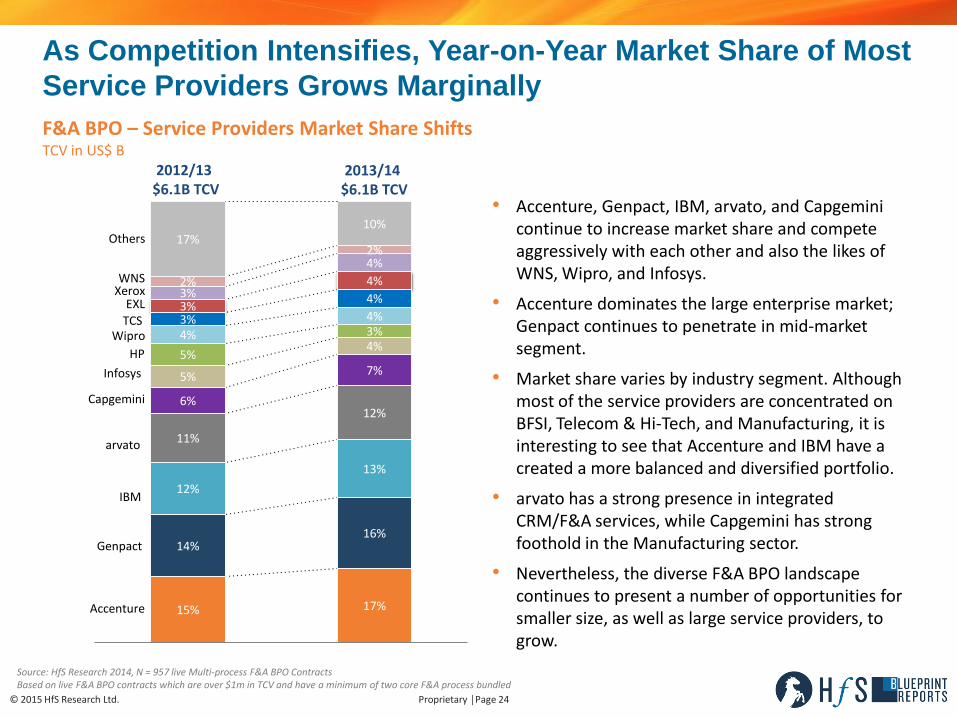
F&A BPO – Service Providers Market Share Shifts TCV in US$ B
2012/13 $6.1B TCV
Source: HfS Research 2014, N = 957 live Multi-process F&A BPO Contracts Based on live F&A BPO contracts which are over $1m in TCV and have a minimum of two core F&A process bundled
15% 17%
14% 16%
12%
13%
11%
12% 6%
7% 5%
4% 5%
3% 4%
4% 3%
4% 3%
4% 3%
4%
2%
2% 17%
10%
Infosys
TCS
WNS
Others
Accenture
Genpact
IBM
arvato
Capgemini
HP
Wipro
EXL Xerox
As Competition Intensifies, Year-on-Year Market Share of Most
Service Providers Grows Marginally
• Accenture, Genpact, IBM, arvato, and Capgemini continue to increase market share and compete aggressively with each other and also the likes of WNS, Wipro, and Infosys.
• Accenture dominates the large enterprise market; Genpact continues to penetrate in mid-market segment.
• Market share varies by industry segment. Although most of the service providers are concentrated on BFSI, Telecom & Hi-Tech, and Manufacturing, it is interesting to see that Accenture and IBM have a created a more balanced and diversified portfolio.
• arvato has a strong presence in integrated CRM/F&A services, while Capgemini has strong foothold in the Manufacturing sector.
• Nevertheless, the diverse F&A BPO landscape continues to present a number of opportunities for smaller size, as well as large service providers, to grow.
2013/14 $6.1B TCV
© 2015 HfS Research Ltd. Proprietary │Page 25
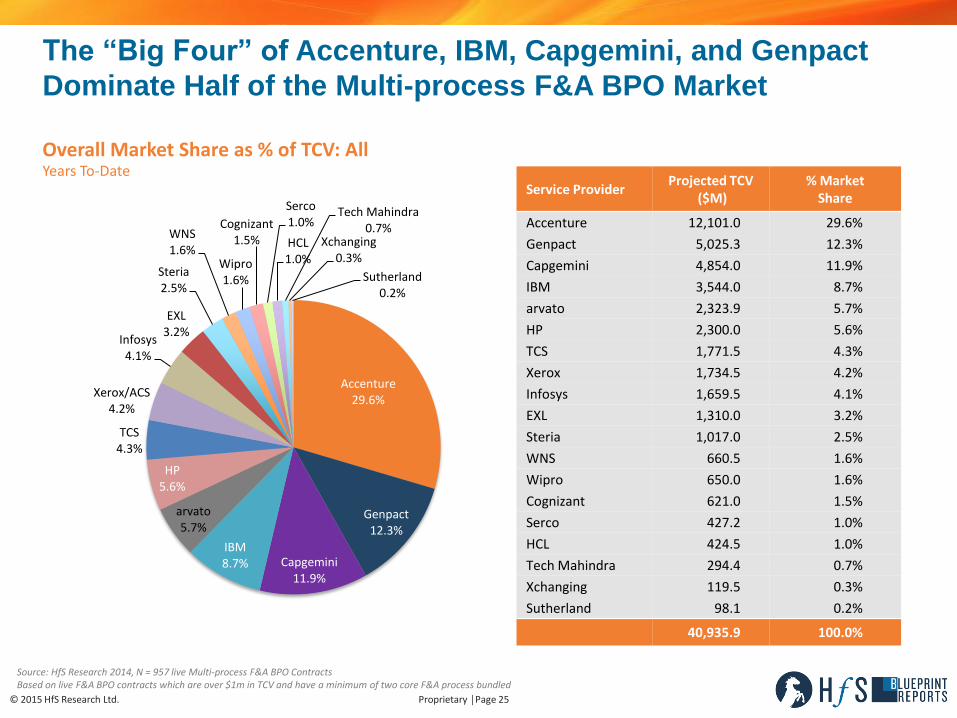
Overall Market Share as % of TCV: All Years To-Date
Service Provider Projected TCV
($M) % Market
Share
Accenture 12,101.0 29.6%
Genpact 5,025.3 12.3%
Capgemini 4,854.0 11.9%
IBM 3,544.0 8.7%
arvato 2,323.9 5.7%
HP 2,300.0 5.6%
TCS 1,771.5 4.3%
Xerox 1,734.5 4.2%
Infosys 1,659.5 4.1%
EXL 1,310.0 3.2%
Steria 1,017.0 2.5%
WNS 660.5 1.6%
Wipro 650.0 1.6%
Cognizant 621.0 1.5%
Serco 427.2 1.0%
HCL 424.5 1.0%
Tech Mahindra 294.4 0.7%
Xchanging 119.5 0.3%
Sutherland 98.1 0.2%
40,935.9 100.0%
Source: HfS Research 2014, N = 957 live Multi-process F&A BPO Contracts Based on live F&A BPO contracts which are over $1m in TCV and have a minimum of two core F&A process bundled
Accenture 29.6%
Genpact 12.3%
Capgemini 11.9%
IBM 8.7%
arvato 5.7%
HP 5.6%
TCS 4.3%
Xerox/ACS 4.2%
Infosys 4.1%
EXL 3.2%
Steria 2.5%
WNS 1.6%
Wipro 1.6%
Cognizant 1.5%
Serco 1.0%
HCL 1.0%
Tech Mahindra 0.7%
Xchanging 0.3%
Sutherland 0.2%
The “Big Four” of Accenture, IBM, Capgemini, and Genpact
Dominate Half of the Multi-process F&A BPO Market
© 2015 HfS Research Ltd. Proprietary │Page 26
Source: HfS Research 2014, N = 957 live Multi-process F&A BPO Contracts Based on live F&A BPO contracts which are over $1m in TCV and have a minimum of two core F&A process bundled
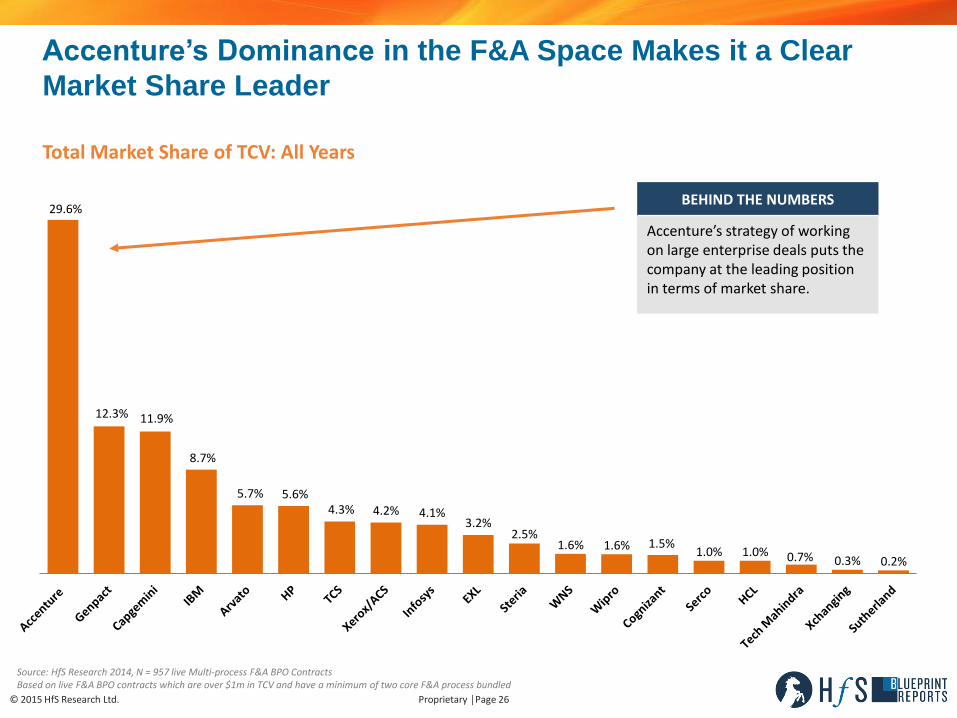
29.6%
12.3% 11.9%
8.7%
5.7% 5.6% 4.3% 4.2% 4.1%
3.2% 2.5%
1.6% 1.6% 1.5% 1.0% 1.0% 0.7% 0.3% 0.2%
Accenture’s Dominance in the F&A Space Makes it a Clear
Market Share Leader
Total Market Share of TCV: All Years
BEHIND THE NUMBERS
Accenture’s strategy of working on large enterprise deals puts the company at the leading position in terms of market share.
© 2015 HfS Research Ltd. Proprietary │Page 27
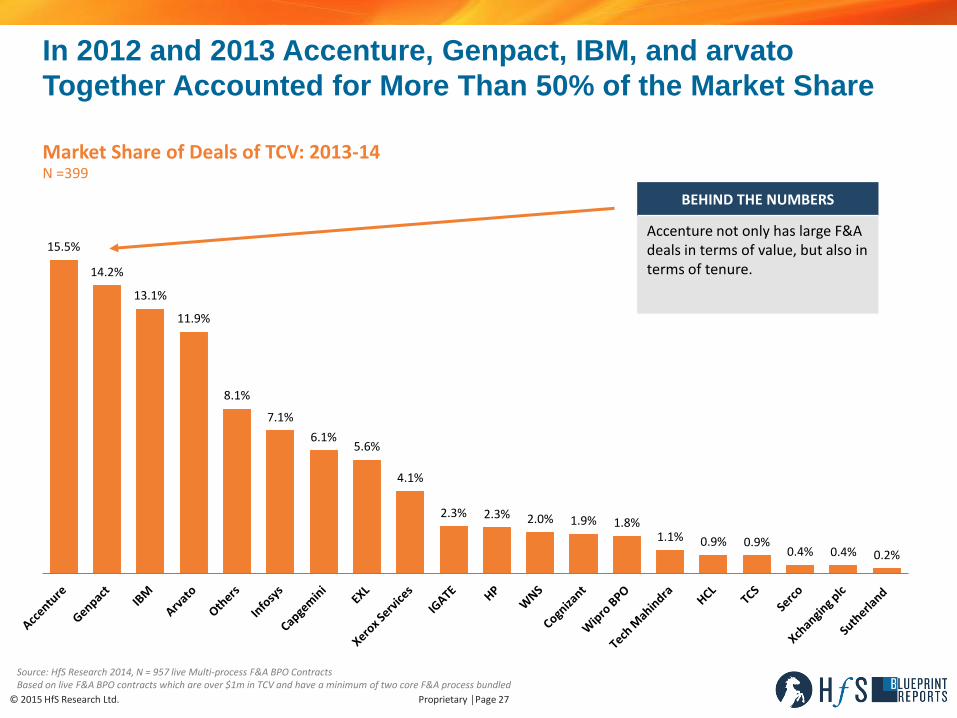
Source: HfS Research 2014, N = 957 live Multi-process F&A BPO Contracts Based on live F&A BPO contracts which are over $1m in TCV and have a minimum of two core F&A process bundled
15.5%
14.2%
13.1%
11.9%
8.1%
7.1%
6.1% 5.6%
4.1%
2.3% 2.3% 2.0% 1.9% 1.8% 1.1% 0.9% 0.9%
0.4% 0.4% 0.2%
In 2012 and 2013 Accenture, Genpact, IBM, and arvato
Together Accounted for More Than 50% of the Market Share
Market Share of Deals of TCV: 2013-14 N =399
BEHIND THE NUMBERS
Accenture not only has large F&A deals in terms of value, but also in terms of tenure.
© 2015 HfS Research Ltd. Proprietary │Page 28
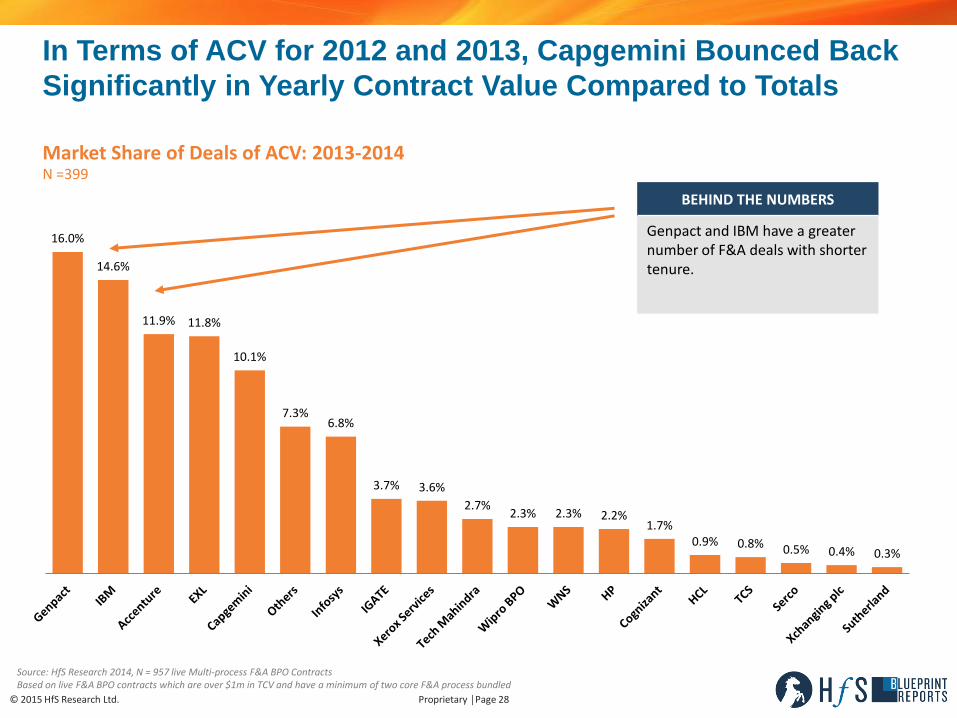
Source: HfS Research 2014, N = 957 live Multi-process F&A BPO Contracts Based on live F&A BPO contracts which are over $1m in TCV and have a minimum of two core F&A process bundled
16.0%
14.6%
11.9% 11.8%
10.1%
7.3% 6.8%
3.7% 3.6%
2.7% 2.3% 2.3% 2.2%
1.7% 0.9% 0.8% 0.5% 0.4% 0.3%
In Terms of ACV for 2012 and 2013, Capgemini Bounced Back
Significantly in Yearly Contract Value Compared to Totals
Market Share of Deals of ACV: 2013-2014 N =399
BEHIND THE NUMBERS
Genpact and IBM have a greater number of F&A deals with shorter tenure.
© 2015 HfS Research Ltd. Proprietary │Page 29
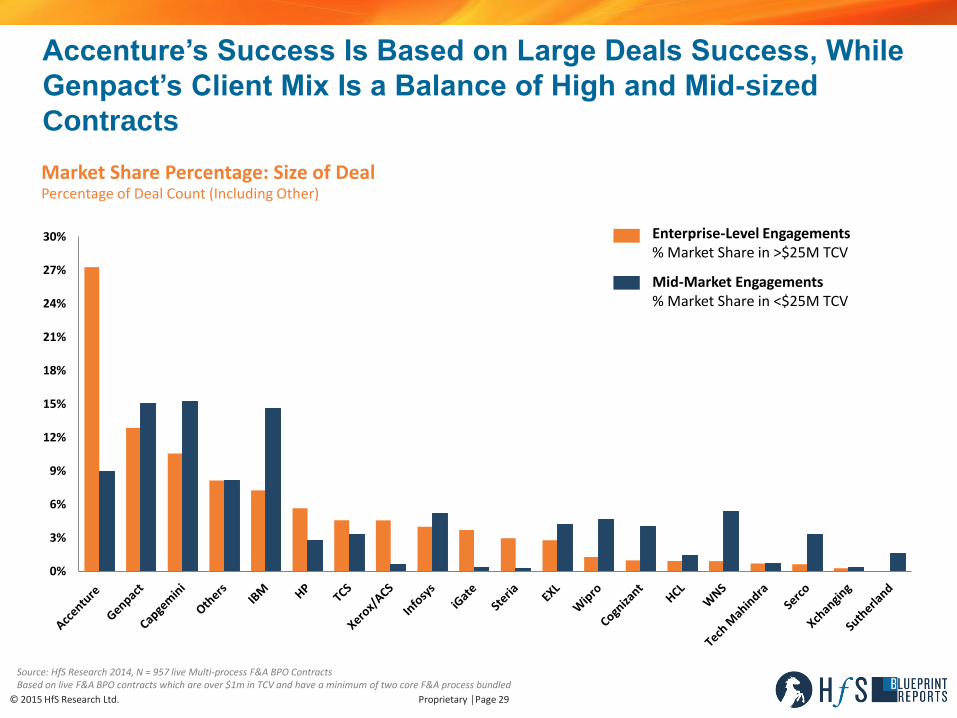
0%
3%
6%
9%
12%
15%
18%
21%
24%
27%
30%
Market Share Percentage: Size of Deal Percentage of Deal Count (Including Other)
Source: HfS Research 2014, N = 957 live Multi-process F&A BPO Contracts Based on live F&A BPO contracts which are over $1m in TCV and have a minimum of two core F&A process bundled
Accenture’s Success Is Based on Large Deals Success, While
Genpact’s Client Mix Is a Balance of High and Mid-sized
Contracts
Enterprise-Level Engagements % Market Share in >$25M TCV
Mid-Market Engagements % Market Share in <$25M TCV
© 2015 HfS Research Ltd. Proprietary │Page 30
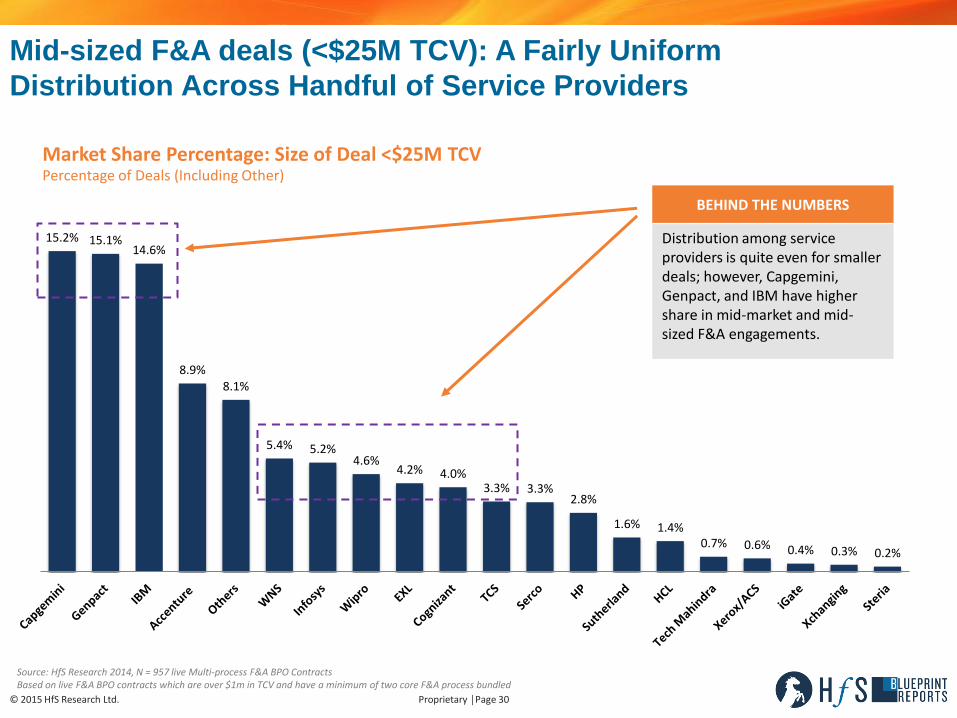
15.2% 15.1% 14.6%
8.9% 8.1%
5.4% 5.2% 4.6%
4.2% 4.0% 3.3% 3.3%
2.8%
1.6% 1.4% 0.7% 0.6% 0.4% 0.3% 0.2%
Mid-sized F&A deals (<$25M TCV): A Fairly Uniform
Distribution Across Handful of Service Providers
Market Share Percentage: Size of Deal <$25M TCV Percentage of Deals (Including Other)
Source: HfS Research 2014, N = 957 live Multi-process F&A BPO Contracts Based on live F&A BPO contracts which are over $1m in TCV and have a minimum of two core F&A process bundled
BEHIND THE NUMBERS
Distribution among service providers is quite even for smaller deals; however, Capgemini, Genpact, and IBM have higher share in mid-market and mid-sized F&A engagements.
© 2015 HfS Research Ltd. Proprietary │Page 31
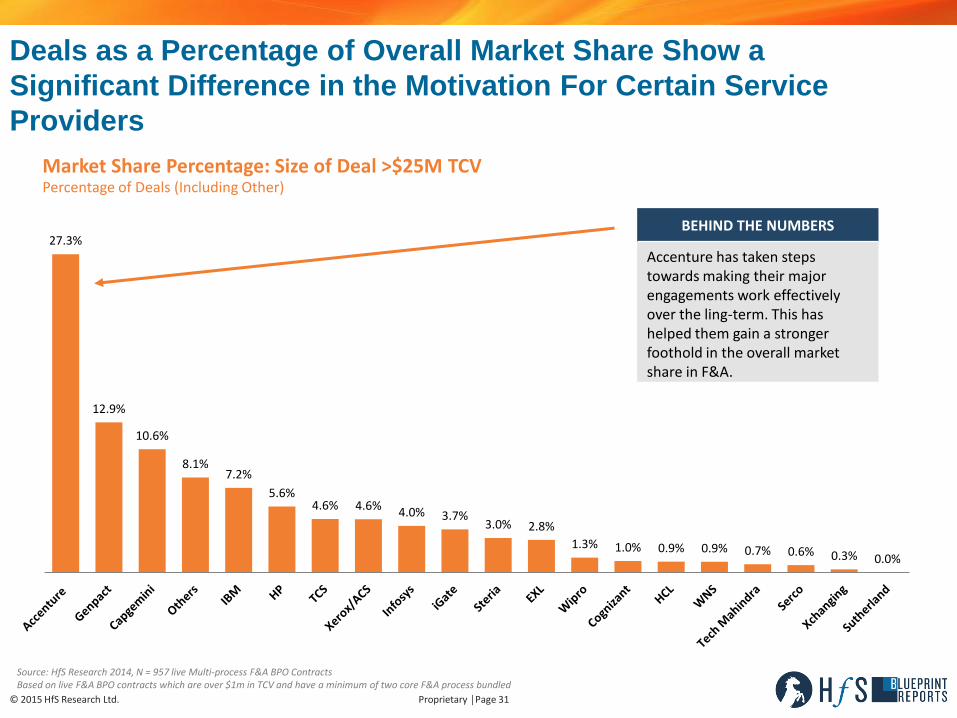
Deals as a Percentage of Overall Market Share Show a
Significant Difference in the Motivation For Certain Service
Providers
Source: HfS Research 2014, N = 957 live Multi-process F&A BPO Contracts Based on live F&A BPO contracts which are over $1m in TCV and have a minimum of two core F&A process bundled
27.3%
12.9%
10.6%
8.1% 7.2%
5.6% 4.6% 4.6%
4.0% 3.7% 3.0% 2.8%
1.3% 1.0% 0.9% 0.9% 0.7% 0.6% 0.3% 0.0%
BEHIND THE NUMBERS
Accenture has taken steps towards making their major engagements work effectively over the ling-term. This has helped them gain a stronger foothold in the overall market share in F&A.
Market Share Percentage: Size of Deal >$25M TCV Percentage of Deals (Including Other)
Multi-Process F&A BPO
Market Size and Deal Trends
© 2015 HfS Research Ltd. Proprietary │Page 33
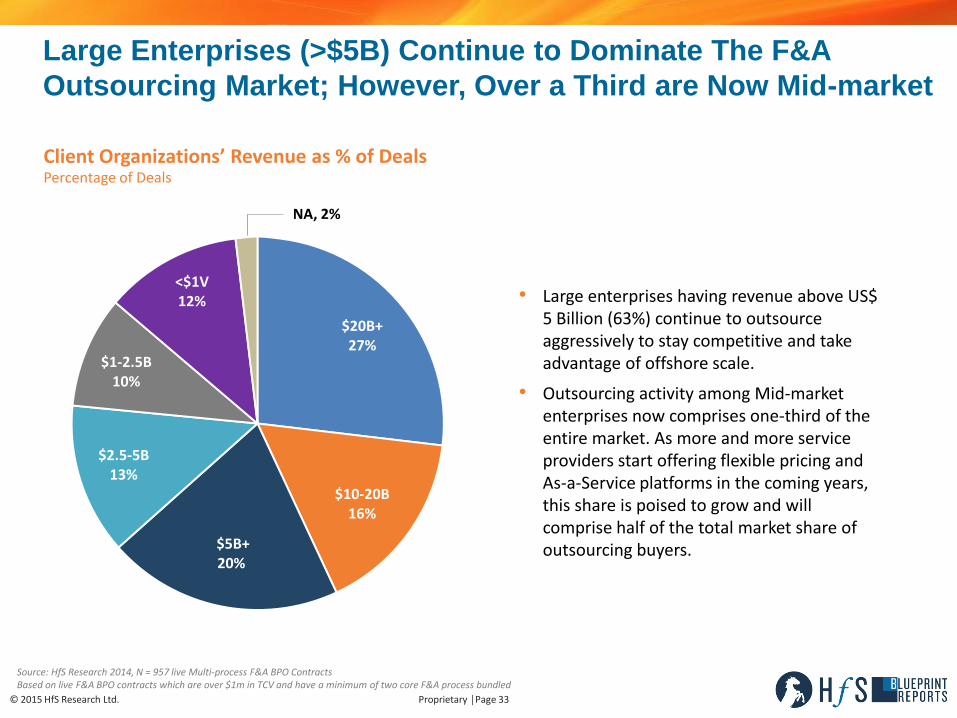
Large Enterprises (>$5B) Continue to Dominate The F&A
Outsourcing Market; However, Over a Third are Now Mid-market
Client Organizations’ Revenue as % of Deals Percentage of Deals
Source: HfS Research 2014, N = 957 live Multi-process F&A BPO Contracts Based on live F&A BPO contracts which are over $1m in TCV and have a minimum of two core F&A process bundled
$20B+ 27%
$10-20B 16%
$5B+ 20%
$2.5-5B 13%
$1-2.5B 10%
<$1V 12%
NA, 2%
• Large enterprises having revenue above US$ 5 Billion (63%) continue to outsource aggressively to stay competitive and take advantage of offshore scale.
• Outsourcing activity among Mid-market enterprises now comprises one-third of the entire market. As more and more service providers start offering flexible pricing and As-a-Service platforms in the coming years, this share is poised to grow and will comprise half of the total market share of outsourcing buyers.
© 2015 HfS Research Ltd. Proprietary │Page 34
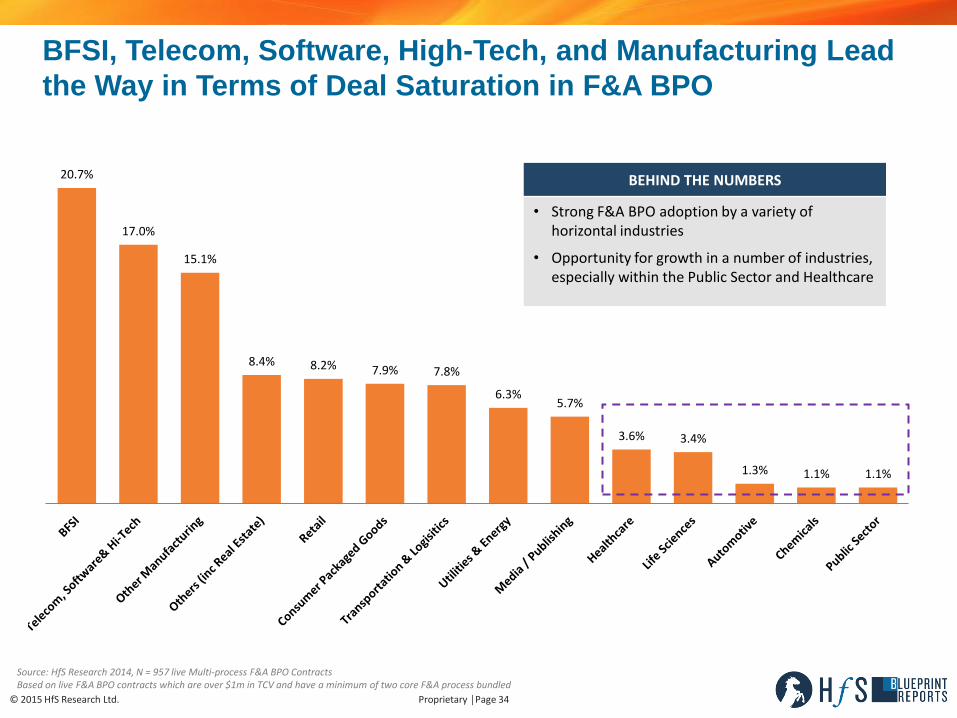
20.7%
17.0%
15.1%
8.4% 8.2% 7.9% 7.8%
6.3% 5.7%
3.6% 3.4%
1.3% 1.1% 1.1%
BFSI, Telecom, Software, High-Tech, and Manufacturing Lead
the Way in Terms of Deal Saturation in F&A BPO
Source: HfS Research 2014, N = 957 live Multi-process F&A BPO Contracts Based on live F&A BPO contracts which are over $1m in TCV and have a minimum of two core F&A process bundled
BEHIND THE NUMBERS
• Strong F&A BPO adoption by a variety of horizontal industries
• Opportunity for growth in a number of industries, especially within the Public Sector and Healthcare
© 2015 HfS Research Ltd. Proprietary │Page 35
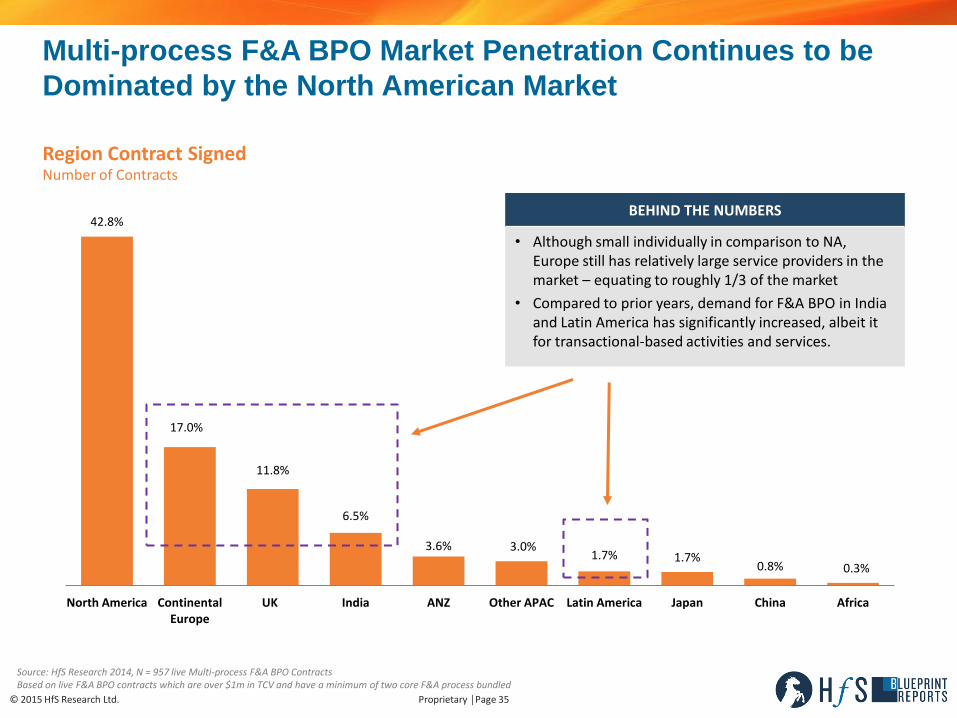
42.8%
17.0%
11.8%
6.5%
3.6% 3.0% 1.7% 1.7%
0.8% 0.3%
North America Continental Europe
UK India ANZ Other APAC Latin America Japan China Africa
Region Contract Signed Number of Contracts
Source: HfS Research 2014, N = 957 live Multi-process F&A BPO Contracts Based on live F&A BPO contracts which are over $1m in TCV and have a minimum of two core F&A process bundled
Multi-process F&A BPO Market Penetration Continues to be
Dominated by the North American Market
BEHIND THE NUMBERS
• Although small individually in comparison to NA, Europe still has relatively large service providers in the market – equating to roughly 1/3 of the market
• Compared to prior years, demand for F&A BPO in India and Latin America has significantly increased, albeit it for transactional-based activities and services.
© 2015 HfS Research Ltd. Proprietary │Page 36
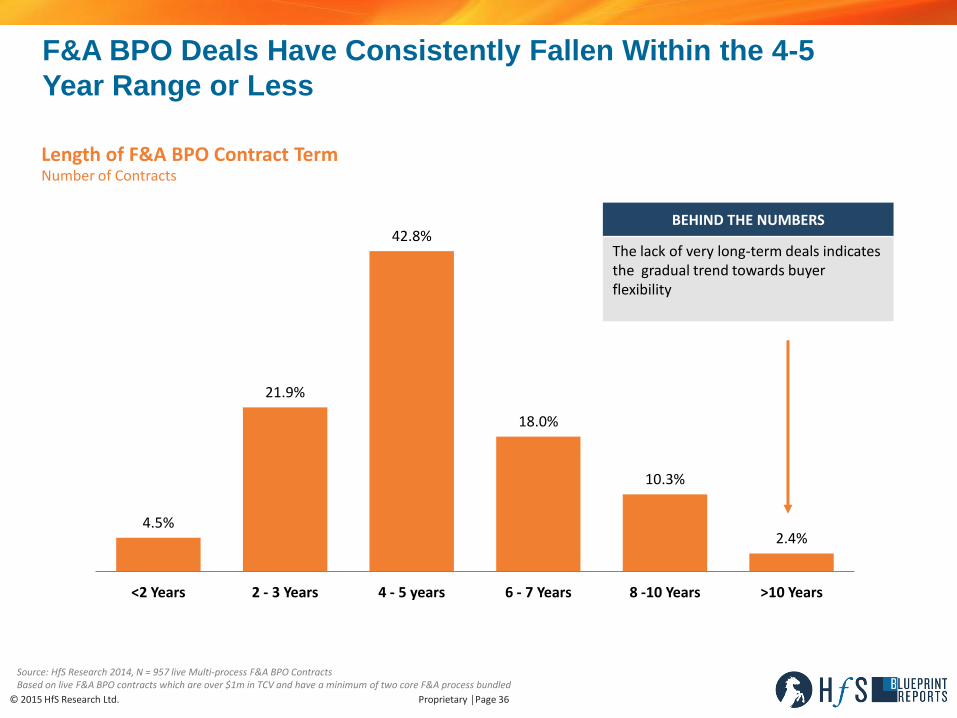
4.5%
21.9%
42.8%
18.0%
10.3%
2.4%
<2 Years 2 - 3 Years 4 - 5 years 6 - 7 Years 8 -10 Years >10 Years
F&A BPO Deals Have Consistently Fallen Within the 4-5
Year Range or Less
Length of F&A BPO Contract Term Number of Contracts
Source: HfS Research 2014, N = 957 live Multi-process F&A BPO Contracts Based on live F&A BPO contracts which are over $1m in TCV and have a minimum of two core F&A process bundled
BEHIND THE NUMBERS
The lack of very long-term deals indicates the gradual trend towards buyer flexibility
© 2015 HfS Research Ltd. Proprietary │Page 37
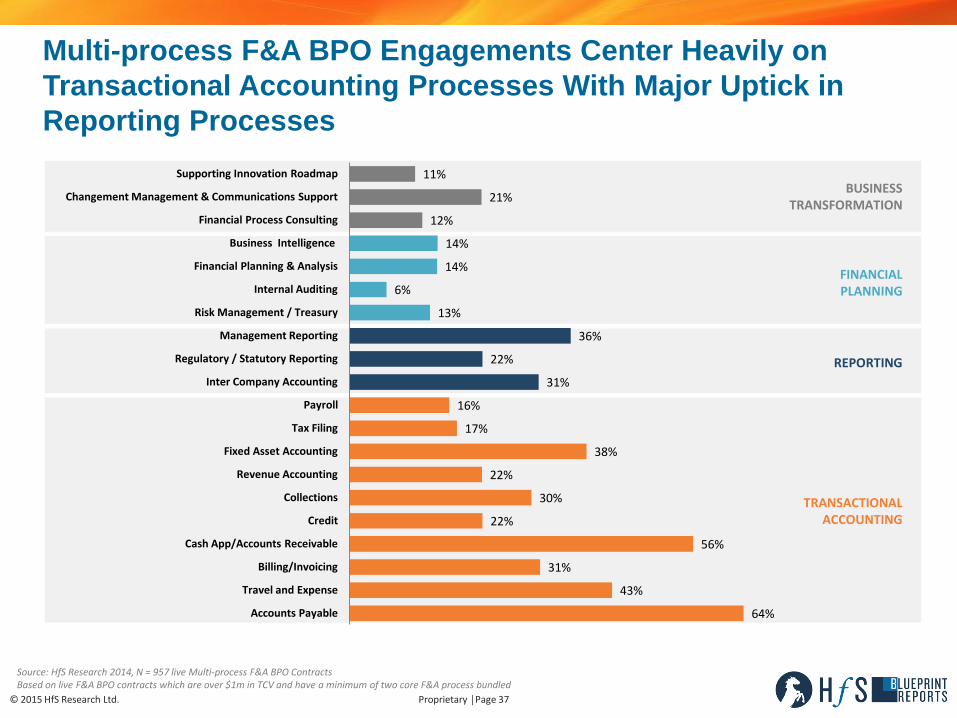
Multi-process F&A BPO Engagements Center Heavily on
Transactional Accounting Processes With Major Uptick in
Reporting Processes
Source: HfS Research 2014, N = 957 live Multi-process F&A BPO Contracts Based on live F&A BPO contracts which are over $1m in TCV and have a minimum of two core F&A process bundled
TRANSACTIONAL ACCOUNTING
REPORTING
64%
43%
31%
56%
22%
30%
22%
38%
17%
16%
31%
22%
36%
13%
6%
14%
14%
12%
21%
11%
Accounts Payable
Travel and Expense
Billing/Invoicing
Cash App/Accounts Receivable
Credit
Collections
Revenue Accounting
Fixed Asset Accounting
Tax Filing
Payroll
Inter Company Accounting
Regulatory / Statutory Reporting
Management Reporting
Risk Management / Treasury
Internal Auditing
Financial Planning & Analysis
Business Intelligence
Financial Process Consulting
Changement Management & Communications Support
Supporting Innovation Roadmap
FINANCIAL PLANNING
BUSINESS TRANSFORMATION
© 2015 HfS Research Ltd. Proprietary │Page 38
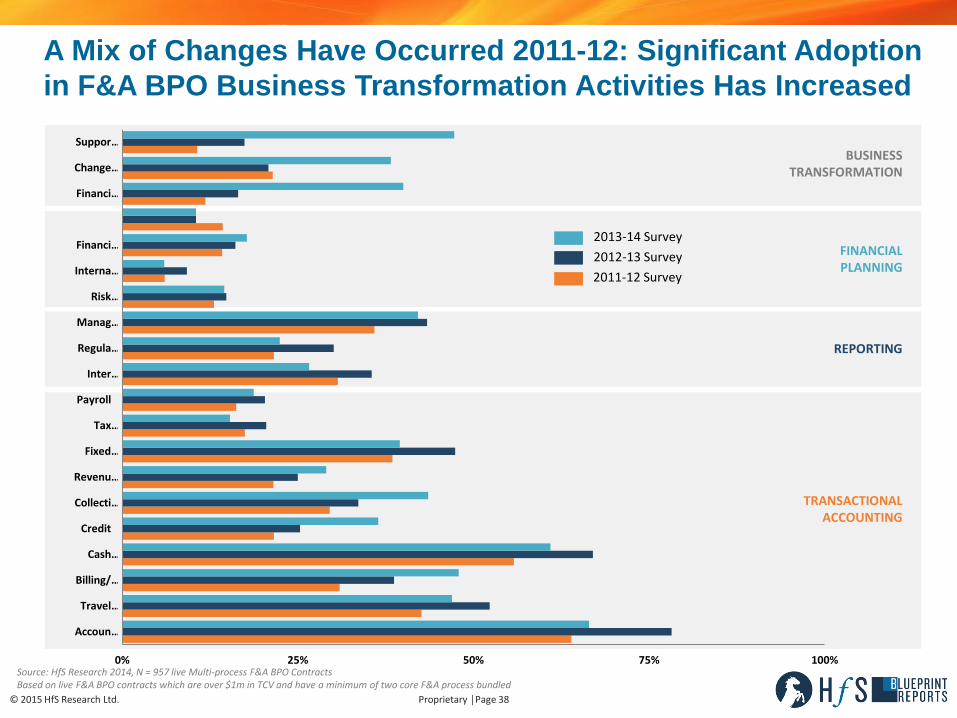
TRANSACTIONAL ACCOUNTING
REPORTING
FINANCIAL PLANNING
BUSINESS TRANSFORMATION
A Mix of Changes Have Occurred 2011-12: Significant Adoption
in F&A BPO Business Transformation Activities Has Increased
Source: HfS Research 2014, N = 957 live Multi-process F&A BPO Contracts Based on live F&A BPO contracts which are over $1m in TCV and have a minimum of two core F&A process bundled
2011-12 Survey
2012-13 Survey
2013-14 Survey
0% 25% 50% 75% 100%
Accoun…
Travel …
Billing/…
Cash …
Credit
Collecti…
Revenu…
Fixed …
Tax …
Payroll
Inter …
Regula…
Manag…
Risk …
Interna…
Financi…
Financi…
Change…
Suppor…
© 2015 HfS Research Ltd. Proprietary │Page 39
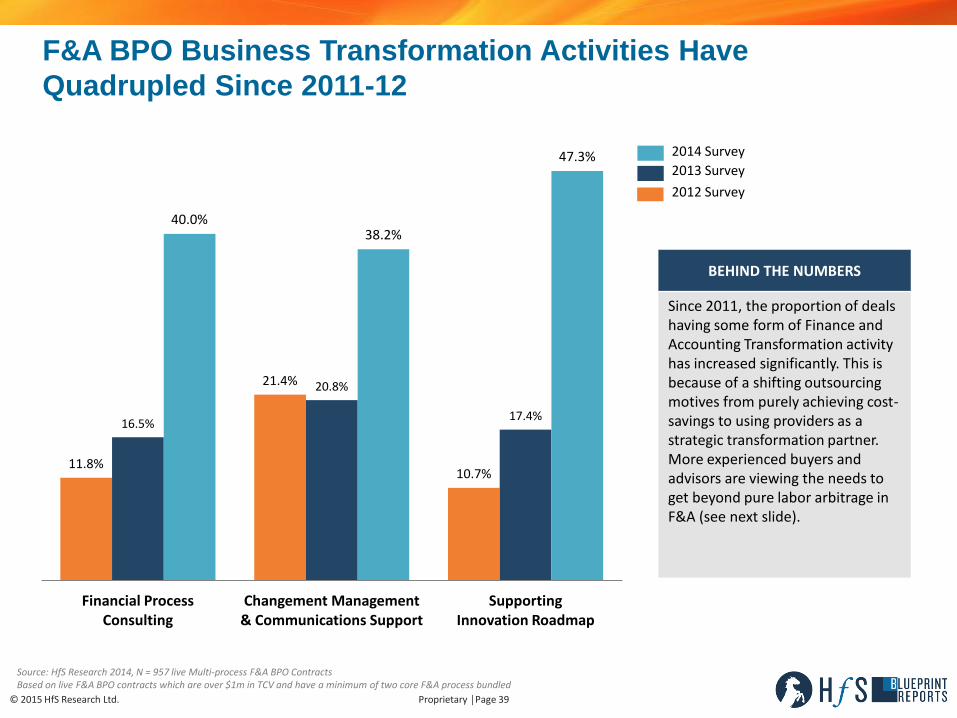
11.8%
21.4%
10.7%
16.5%
20.8%
17.4%
40.0% 38.2%
47.3%
Financial Process Consulting
Changement Management & Communications Support
Supporting Innovation Roadmap
2012 Survey
2013 Survey
2014 Survey
Source: HfS Research 2014, N = 957 live Multi-process F&A BPO Contracts Based on live F&A BPO contracts which are over $1m in TCV and have a minimum of two core F&A process bundled
F&A BPO Business Transformation Activities Have
Quadrupled Since 2011-12
BEHIND THE NUMBERS
Since 2011, the proportion of deals having some form of Finance and Accounting Transformation activity has increased significantly. This is because of a shifting outsourcing motives from purely achieving cost-savings to using providers as a strategic transformation partner. More experienced buyers and advisors are viewing the needs to get beyond pure labor arbitrage in F&A (see next slide).
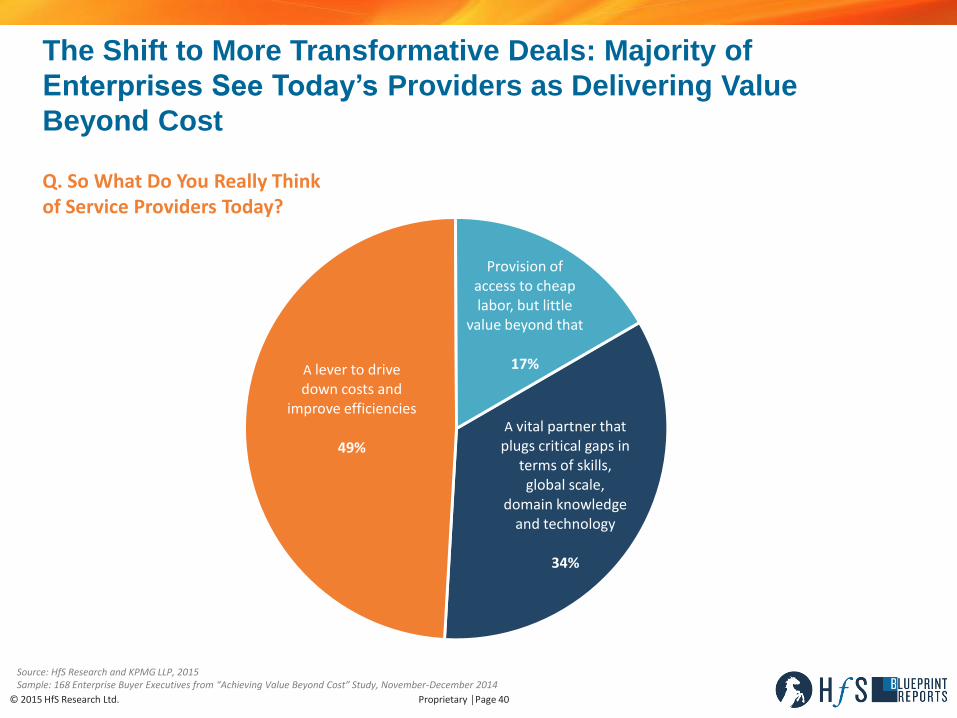
© 2015 HfS Research Ltd. Proprietary │Page 40
A vital partner that plugs critical gaps in
terms of skills, global scale,
domain knowledge and technology
34%
A lever to drive down costs and
improve efficiencies
49%
Provision of access to cheap labor, but little
value beyond that
17%
Q. So What Do You Really Think of Service Providers Today?
The Shift to More Transformative Deals: Majority of
Enterprises See Today’s Providers as Delivering Value
Beyond Cost
Source: HfS Research and KPMG LLP, 2015 Sample: 168 Enterprise Buyer Executives from “Achieving Value Beyond Cost” Study, November-December 2014
© 2015 HfS Research Ltd. Proprietary │Page 41
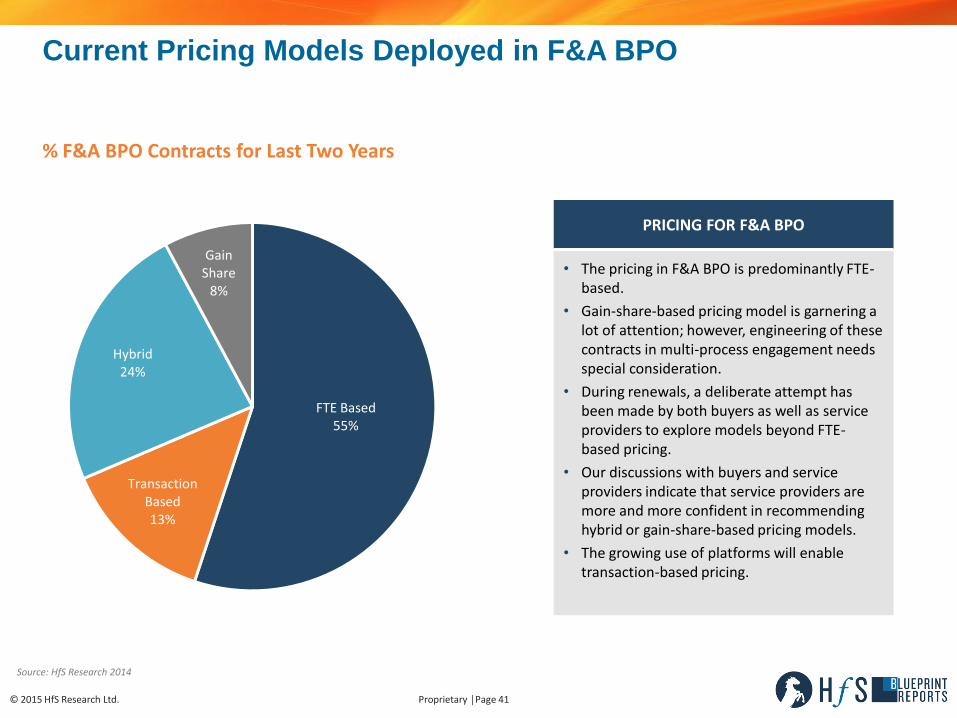
FTE Based 55%
Transaction Based 13%
Hybrid 24%
Gain Share
8%
PRICING FOR F&A BPO
• The pricing in F&A BPO is predominantly FTE-based.
• Gain-share-based pricing model is garnering a lot of attention; however, engineering of these contracts in multi-process engagement needs special consideration.
• During renewals, a deliberate attempt has been made by both buyers as well as service providers to explore models beyond FTE-based pricing.
• Our discussions with buyers and service providers indicate that service providers are more and more confident in recommending hybrid or gain-share-based pricing models.
• The growing use of platforms will enable transaction-based pricing.
Current Pricing Models Deployed in F&A BPO
Source: HfS Research 2014
% F&A BPO Contracts for Last Two Years
© 2015 HfS Research Ltd. Proprietary │Page 42
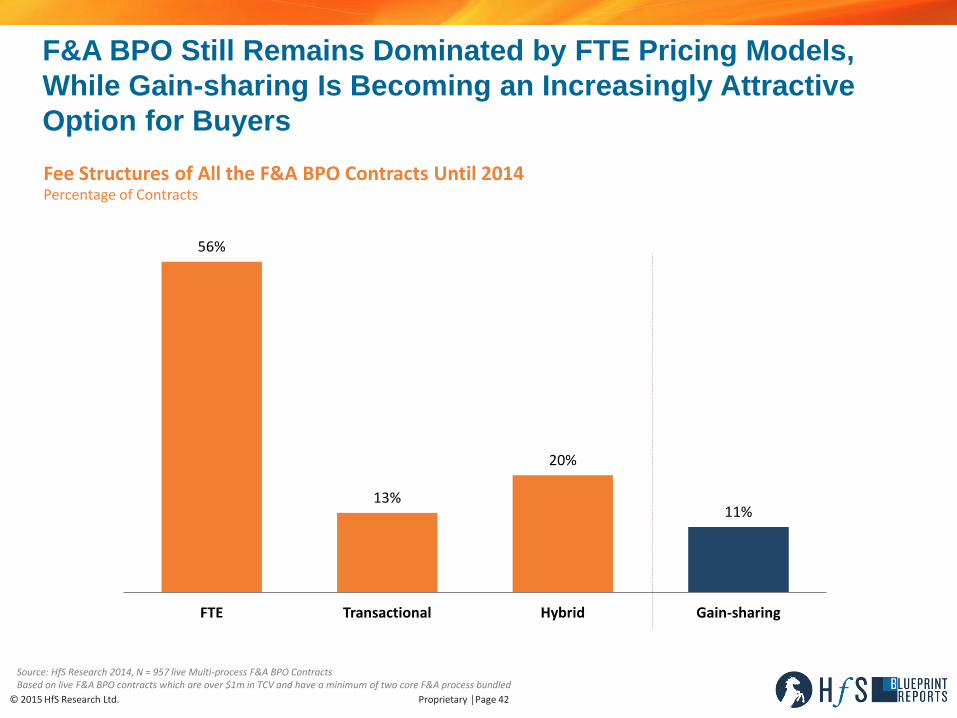
56%
13%
20%
11%
FTE Transactional Hybrid Gain-sharing
Fee Structures of All the F&A BPO Contracts Until 2014 Percentage of Contracts
Source: HfS Research 2014, N = 957 live Multi-process F&A BPO Contracts Based on live F&A BPO contracts which are over $1m in TCV and have a minimum of two core F&A process bundled
F&A BPO Still Remains Dominated by FTE Pricing Models,
While Gain-sharing Is Becoming an Increasingly Attractive
Option for Buyers
© 2015 HfS Research Ltd. Proprietary │Page 43
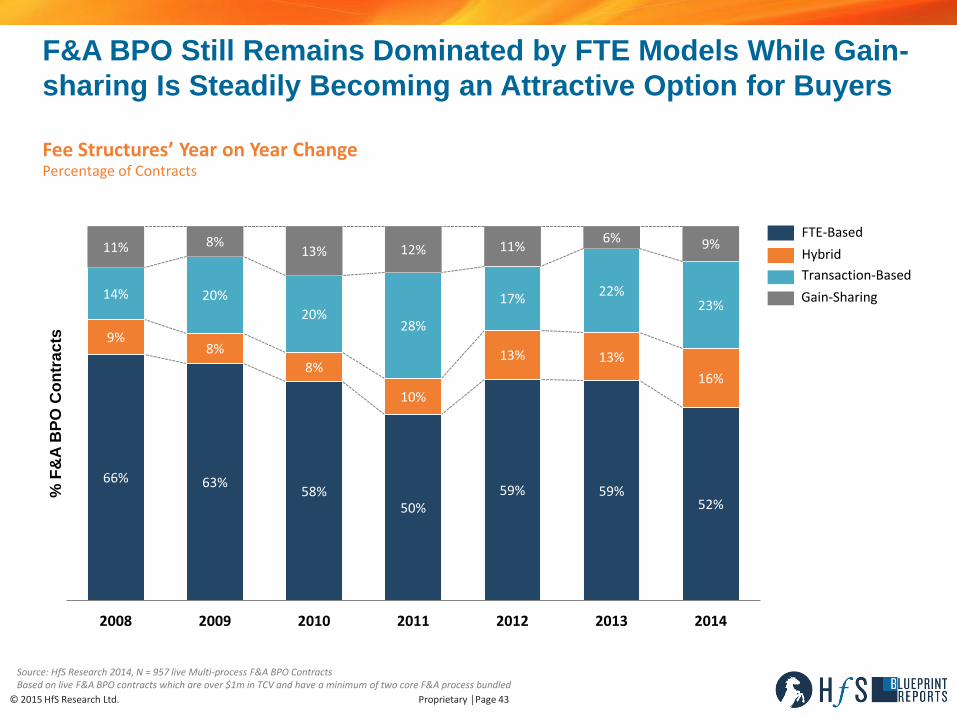
Fee Structures’ Year on Year Change Percentage of Contracts
66% 63% 58%
50% 59% 59%
52%
9% 8%
8%
10%
13% 13%
16%
14% 20%
20% 28%
17% 22%
23%
11% 8% 13% 12% 11%
6% 9%
2008 2009 2010 2011 2012 2013 2014
% F
&A
BP
O C
on
tra
cts
Source: HfS Research 2014, N = 957 live Multi-process F&A BPO Contracts Based on live F&A BPO contracts which are over $1m in TCV and have a minimum of two core F&A process bundled
F&A BPO Still Remains Dominated by FTE Models While Gain-
sharing Is Steadily Becoming an Attractive Option for Buyers
Transaction-Based
Hybrid
FTE-Based
Gain-Sharing
© 2015 HfS Research Ltd. Proprietary │Page 44
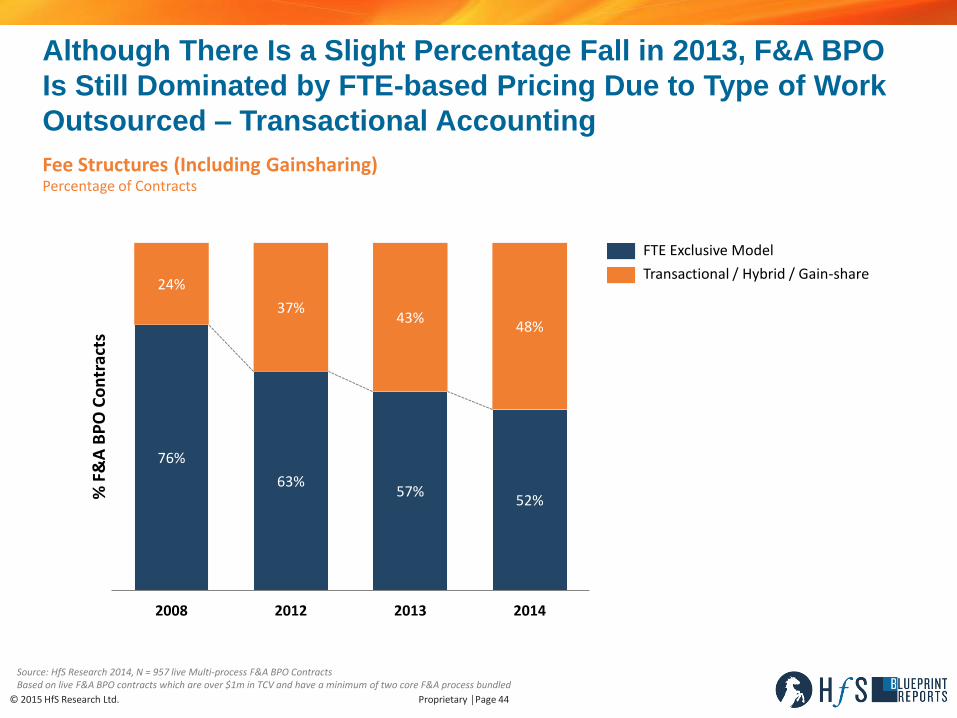
Fee Structures (Including Gainsharing) Percentage of Contracts
76%
63% 57%
52%
24%
37% 43%
48%
2008 2012 2013 2014
% F
&A
BP
O C
on
trac
ts
Source: HfS Research 2014, N = 957 live Multi-process F&A BPO Contracts Based on live F&A BPO contracts which are over $1m in TCV and have a minimum of two core F&A process bundled
Although There Is a Slight Percentage Fall in 2013, F&A BPO
Is Still Dominated by FTE-based Pricing Due to Type of Work
Outsourced – Transactional Accounting
Transactional / Hybrid / Gain-share
FTE Exclusive Model
© 2015 HfS Research Ltd. Proprietary │Page 45
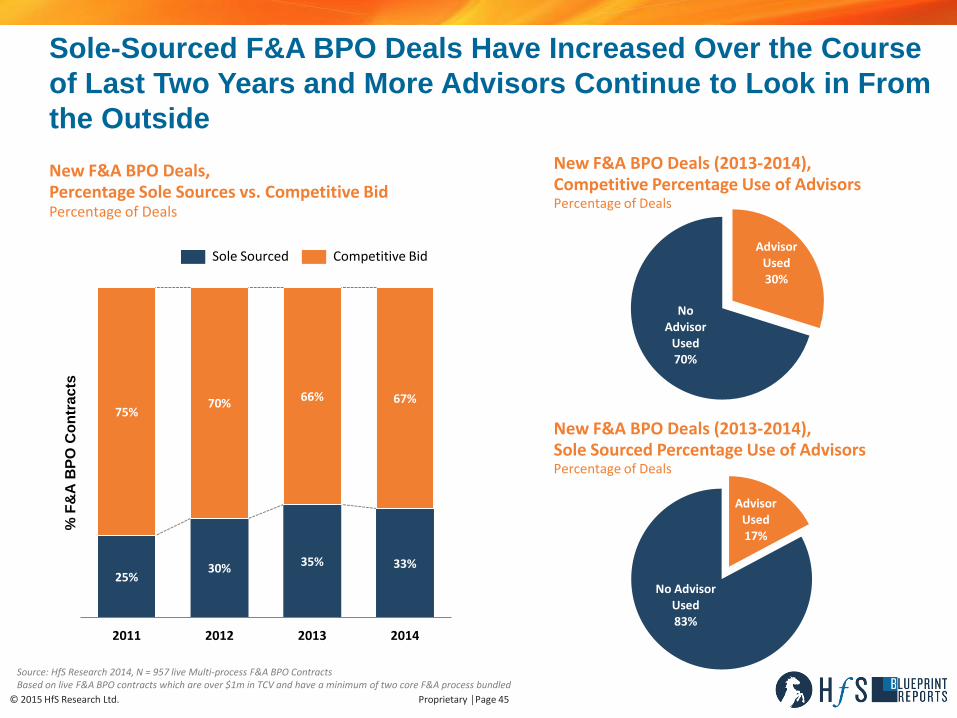
Advisor Used 17%
No Advisor Used 83%
Advisor Used 30%
No Advisor
Used 70%
Sole-Sourced F&A BPO Deals Have Increased Over the Course
of Last Two Years and More Advisors Continue to Look in From
the Outside
New F&A BPO Deals, Percentage Sole Sources vs. Competitive Bid Percentage of Deals
New F&A BPO Deals (2013-2014), Competitive Percentage Use of Advisors Percentage of Deals
New F&A BPO Deals (2013-2014), Sole Sourced Percentage Use of Advisors Percentage of Deals
Source: HfS Research 2014, N = 957 live Multi-process F&A BPO Contracts Based on live F&A BPO contracts which are over $1m in TCV and have a minimum of two core F&A process bundled
25% 30%
35% 33%
75% 70%
66% 67%
2011 2012 2013 2014
% F
&A
BP
O C
on
tra
cts
Competitive Bid Sole Sourced

Global F&A BPO Market
Size and Forecast
© 2015 HfS Research Ltd. Proprietary │Page 47
Updated December, 2014
Market sizing based on service provider financials to Q2 2014
Sizing methodology
• HfS’s market sizing relies on a consistent primary methodology that is used for each service category. HfS’s primary method is a supply side model that builds market dimensions by estimating revenues from the most significant service providers in each category. This is augmented by spending models and contract tracking for each specific market.
Forecasting methodology
• HfS’s forecasting combines historic revenue growth projections, contract run rate projections, demand side survey data, supply side survey data, and economic projections.
Size and forecast updated quarterly
IT Services and BPO Market Sizing 2014–2018
Scope and Method
© 2015 HfS Research Ltd. Proprietary │Page 48
HfS’s main onward forecast assumptions:
• Global GDP growth for 2014/2015 will be at least 1.6%, up from approx. 0.2% in 2013.
• Overall, an approx. 95% renewal rate on existing outsourcing deals – renewal with existing or new provider (rate of insource set at 5%).
• Renewal rates at approx. average 85% of original contract value (varies by type).
• Discretionary spending with existing outsourcing projects will drive additional revenues as the economic pressures ease.
• We currently have a volume prediction of 10% for overall outsourcing during 2014.
• We anticipate that platform-based BPO (BPaaS) and cloud-based offering will help drive new outsourcing in small and mid-sized organizations in the next 2 years and beyond; however, do not anticipate the top-tier service providers to enter the mid-market until at least 2016.
• New projects and long-term contracts in the emerging areas of mobility and analytics will provide additional growth, albeit at modest spending compared to broad-based application and infrastructure services.
Main Assumptions
© 2015 HfS Research Ltd. Proprietary │Page 49
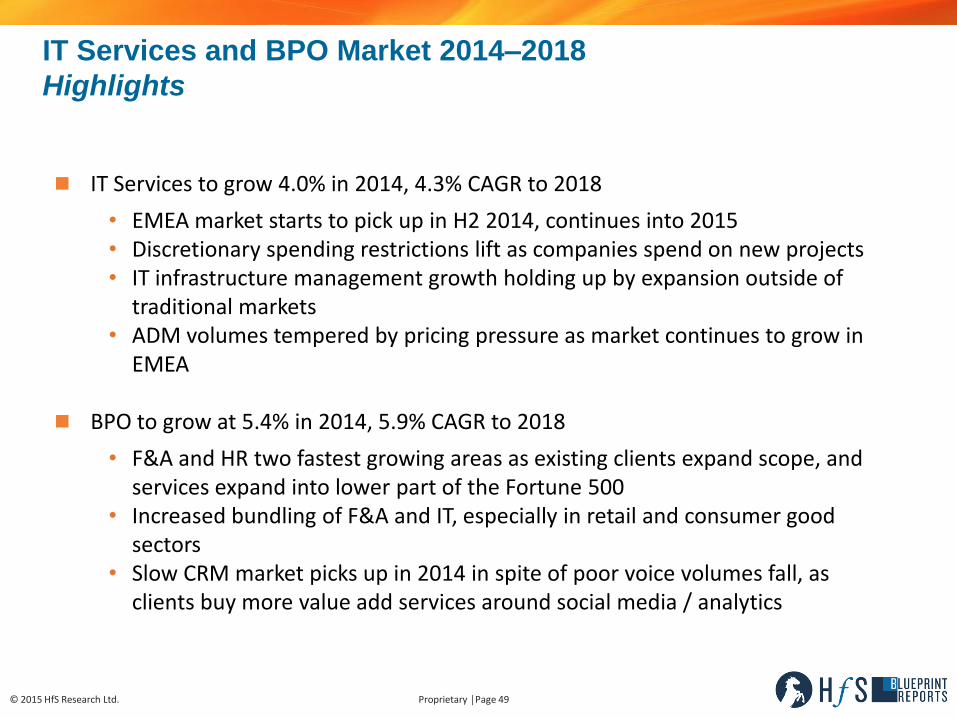
IT Services to grow 4.0% in 2014, 4.3% CAGR to 2018
• EMEA market starts to pick up in H2 2014, continues into 2015 • Discretionary spending restrictions lift as companies spend on new projects • IT infrastructure management growth holding up by expansion outside of
traditional markets • ADM volumes tempered by pricing pressure as market continues to grow in
EMEA
BPO to grow at 5.4% in 2014, 5.9% CAGR to 2018
• F&A and HR two fastest growing areas as existing clients expand scope, and services expand into lower part of the Fortune 500
• Increased bundling of F&A and IT, especially in retail and consumer good sectors
• Slow CRM market picks up in 2014 in spite of poor voice volumes fall, as clients buy more value add services around social media / analytics
IT Services and BPO Market 2014–2018
Highlights
© 2015 HfS Research Ltd. Proprietary │Page 50
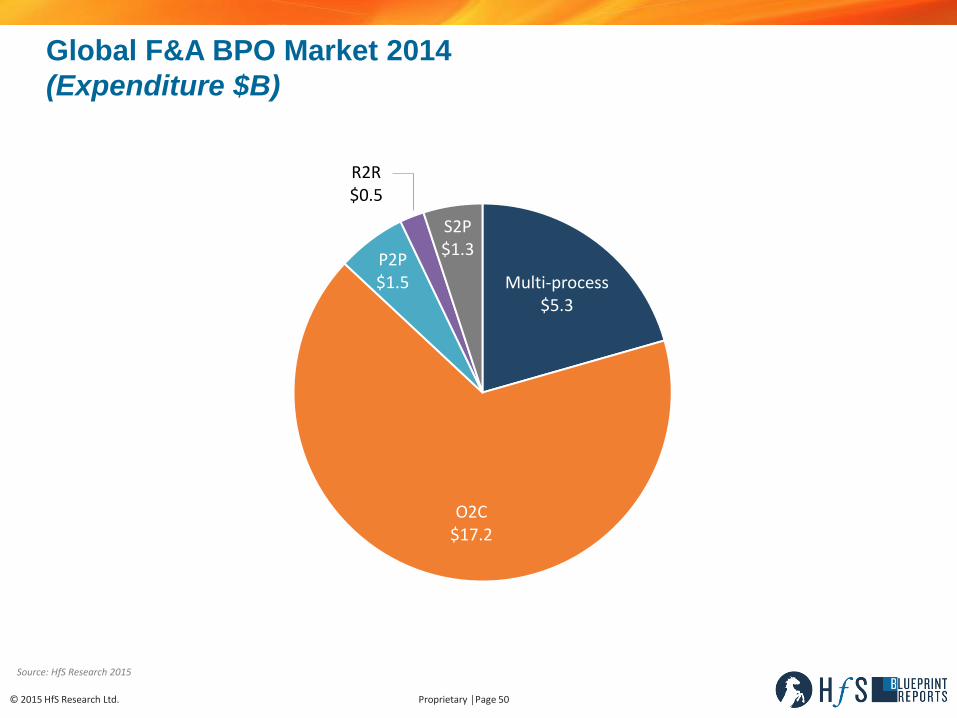
Global F&A BPO Market 2014
(Expenditure $B)
Multi-process $5.3
O2C $17.2
P2P $1.5
R2R $0.5
S2P $1.3
Source: HfS Research 2015
© 2015 HfS Research Ltd. Proprietary │Page 51
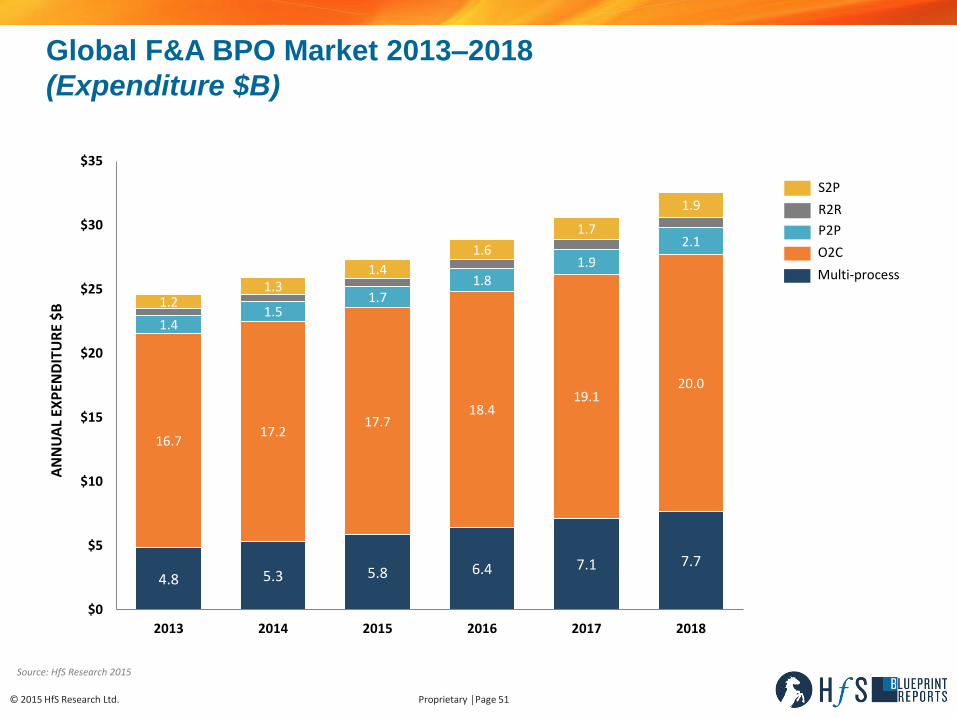
Global F&A BPO Market 2013–2018
(Expenditure $B)
4.8 5.3 5.8 6.4 7.1 7.7
16.7 17.2
17.7 18.4
19.1 20.0
1.4 1.5
1.7 1.8
1.9
2.1
1.2 1.3
1.4
1.6
1.7
1.9
$0
$5
$10
$15
$20
$25
$30
$35
2013 2014 2015 2016 2017 2018
AN
NU
AL
EXP
END
ITU
RE
$B
Source: HfS Research 2015
P2P
R2R
S2P
O2C
Multi-process
© 2015 HfS Research Ltd. Proprietary │Page 52
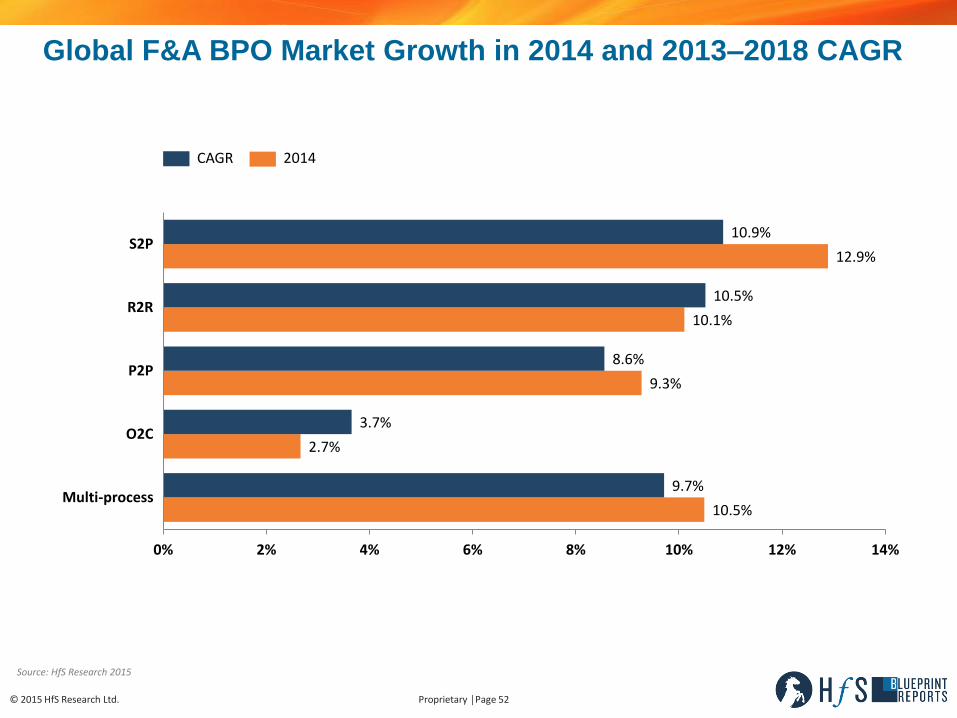
Global F&A BPO Market Growth in 2014 and 2013–2018 CAGR
10.5%
2.7%
9.3%
10.1%
12.9%
9.7%
3.7%
8.6%
10.5%
10.9%
0% 2% 4% 6% 8% 10% 12% 14%
Multi-process
O2C
P2P
R2R
S2P
Source: HfS Research 2015
2014 CAGR
© 2015 HfS Research Ltd. Proprietary │Page 53
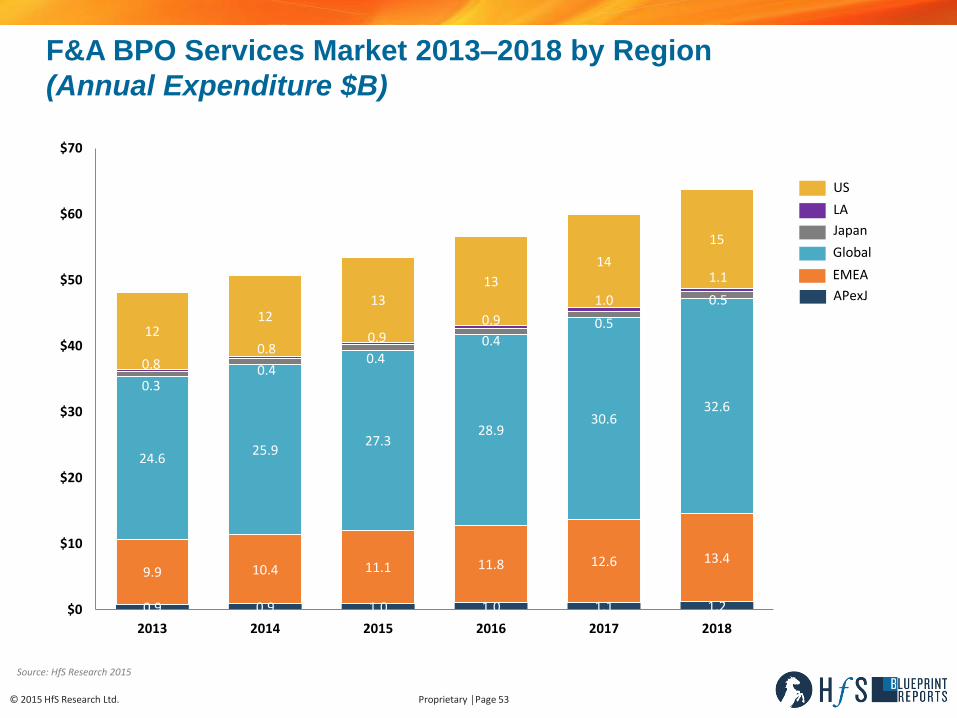
F&A BPO Services Market 2013–2018 by Region
(Annual Expenditure $B)
0.9 0.9 1.0 1.0 1.1 1.2
9.9 10.4 11.1 11.8 12.6 13.4
24.6 25.9
27.3 28.9
30.6 32.6
0.8 0.8
0.9 0.9
1.0
1.1
0.3 0.4
0.4 0.4
0.5
0.5
12 12
13
13
14
15
$0
$10
$20
$30
$40
$50
$60
$70
2013 2014 2015 2016 2017 2018
Source: HfS Research 2015
Japan
LA
US
Global
EMEA
APexJ
© 2015 HfS Research Ltd. Proprietary │Page 54
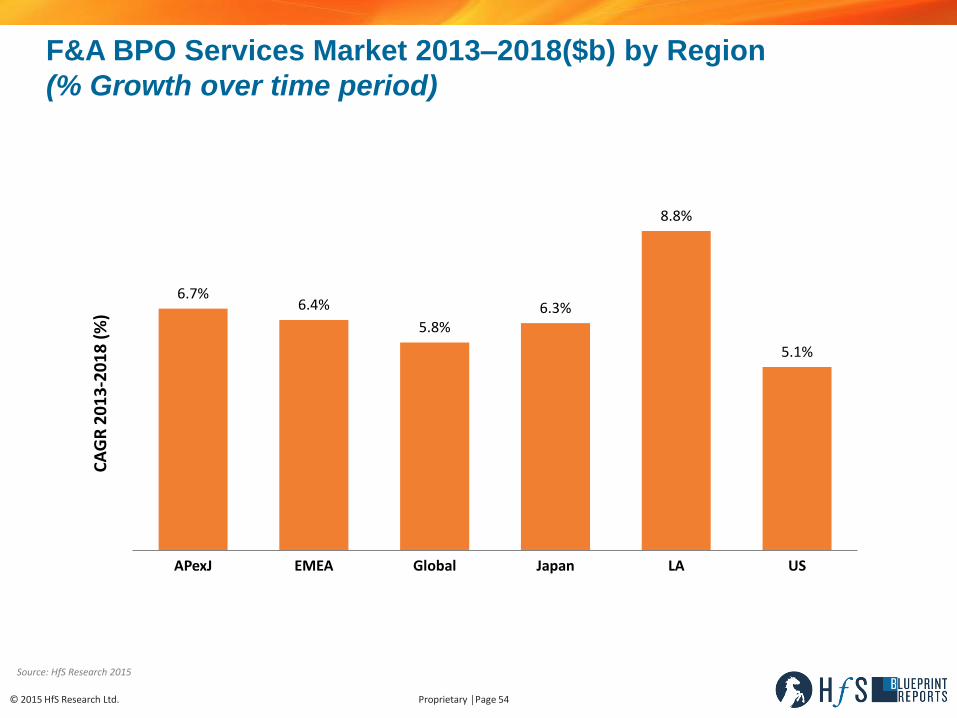
F&A BPO Services Market 2013–2018($b) by Region
(% Growth over time period)
6.7% 6.4%
5.8% 6.3%
8.8%
5.1%
APexJ EMEA Global Japan LA US
CA
GR
20
13
-20
18
(%
)
Source: HfS Research 2015
© 2015 HfS Research Ltd. Proprietary │Page 55
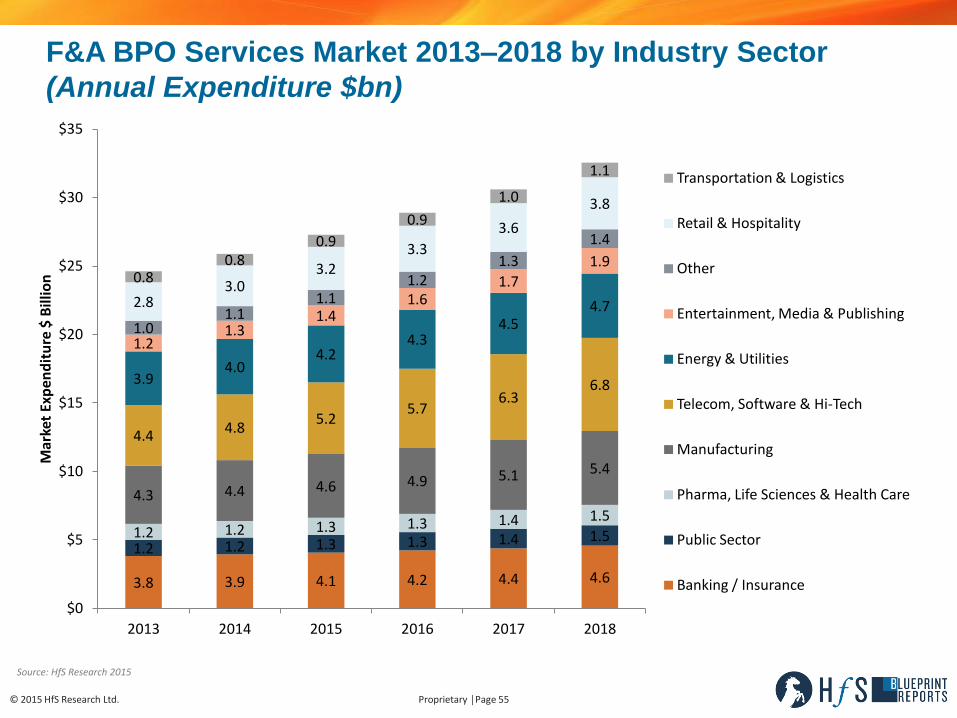
F&A BPO Services Market 2013–2018 by Industry Sector
(Annual Expenditure $bn)
3.8 3.9 4.1 4.2 4.4 4.6
1.2 1.2 1.3 1.3 1.4 1.5 1.2 1.2 1.3 1.3 1.4 1.5
4.3 4.4 4.6 4.9 5.1 5.4
4.4 4.8
5.2 5.7
6.3 6.8 3.9
4.0 4.2
4.3 4.5
4.7
1.2 1.3
1.4 1.6
1.7
1.9
1.0 1.1
1.1 1.2
1.3
1.4
2.8 3.0
3.2 3.3
3.6
3.8
0.8 0.8
0.9
0.9
1.0
1.1
$0
$5
$10
$15
$20
$25
$30
$35
2013 2014 2015 2016 2017 2018
Mar
ket
Exp
end
itu
re $
Bill
ion
Transportation & Logistics
Retail & Hospitality
Other
Entertainment, Media & Publishing
Energy & Utilities
Telecom, Software & Hi-Tech
Manufacturing
Pharma, Life Sciences & Health Care
Public Sector
Banking / Insurance
Source: HfS Research 2015
© 2015 HfS Research Ltd. Proprietary │Page 56
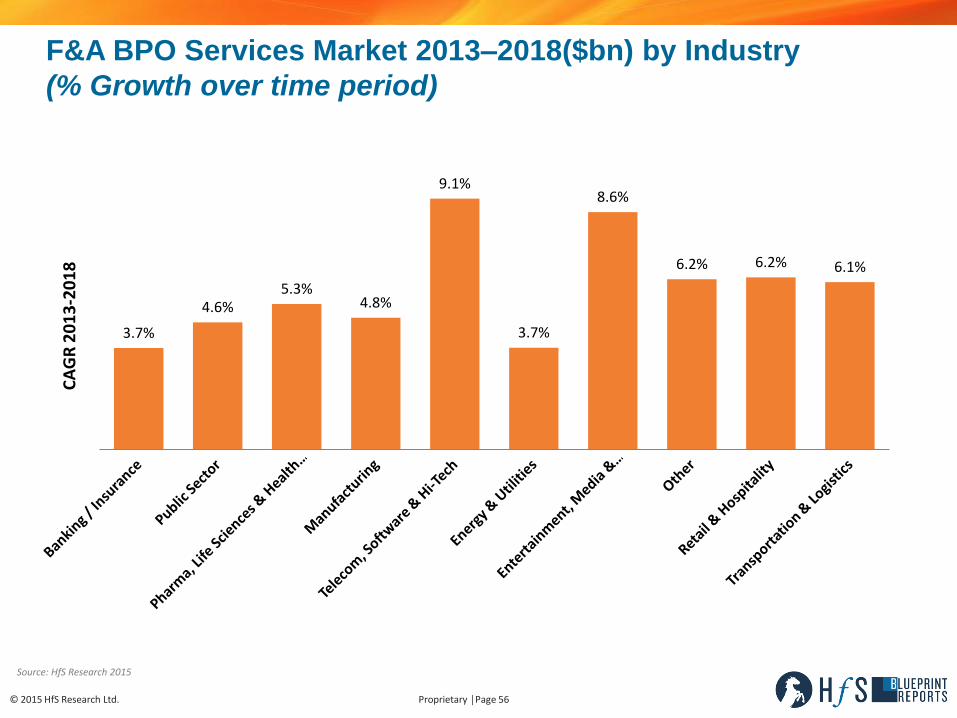
F&A BPO Services Market 2013–2018($bn) by Industry
(% Growth over time period)
3.7%
4.6% 5.3%
4.8%
9.1%
3.7%
8.6%
6.2% 6.2% 6.1%
CA
GR
20
13
-20
18
Source: HfS Research 2015
Service Provider Profile
© 2015 HfS Research Ltd. Proprietary │Page 58
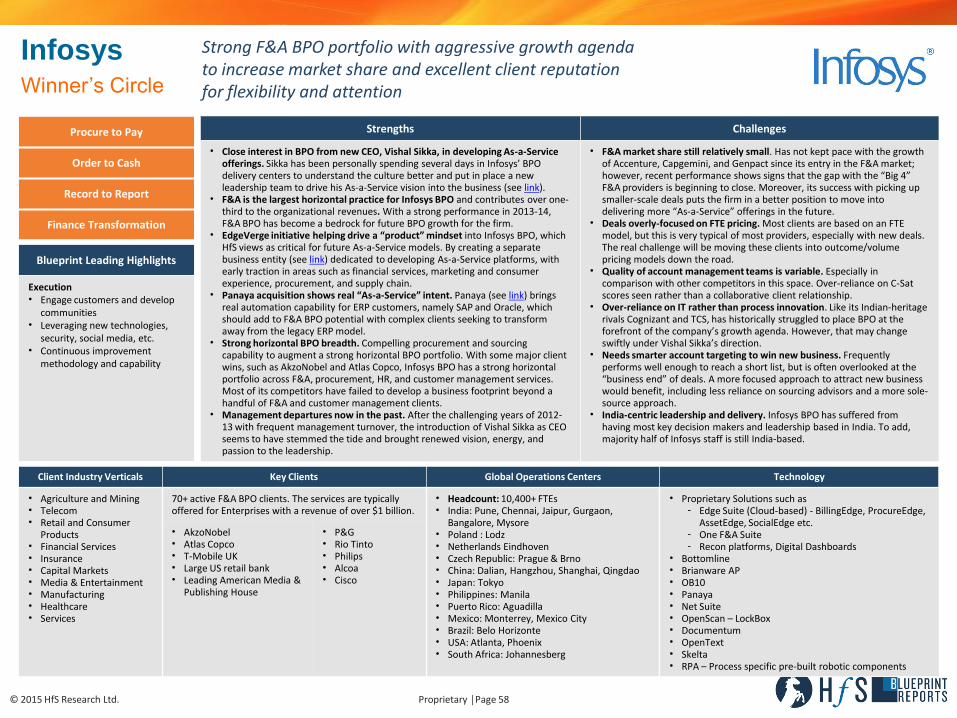
Infosys
Strong F&A BPO portfolio with aggressive growth agenda to increase market share and excellent client reputation for flexibility and attention
Client Industry Verticals Key Clients Global Operations Centers Technology
• Agriculture and Mining • Telecom • Retail and Consumer
Products • Financial Services • Insurance • Capital Markets • Media & Entertainment • Manufacturing • Healthcare • Services
70+ active F&A BPO clients. The services are typically offered for Enterprises with a revenue of over $1 billion.
• Headcount: 10,400+ FTEs • India: Pune, Chennai, Jaipur, Gurgaon,
Bangalore, Mysore • Poland : Lodz • Netherlands Eindhoven • Czech Republic: Prague & Brno • China: Dalian, Hangzhou, Shanghai, Qingdao • Japan: Tokyo • Philippines: Manila • Puerto Rico: Aguadilla • Mexico: Monterrey, Mexico City • Brazil: Belo Horizonte • USA: Atlanta, Phoenix • South Africa: Johannesberg
• Proprietary Solutions such as - Edge Suite (Cloud-based) - BillingEdge, ProcureEdge,
AssetEdge, SocialEdge etc. - One F&A Suite - Recon platforms, Digital Dashboards
• Bottomline • Brianware AP • OB10 • Panaya • Net Suite • OpenScan – LockBox • Documentum • OpenText • Skelta • RPA – Process specific pre-built robotic components
• AkzoNobel • Atlas Copco • T-Mobile UK • Large US retail bank • Leading American Media &
Publishing House
• P&G • Rio Tinto • Philips • Alcoa • Cisco
Strengths Challenges
• Close interest in BPO from new CEO, Vishal Sikka, in developing As-a-Service offerings. Sikka has been personally spending several days in Infosys’ BPO delivery centers to understand the culture better and put in place a new leadership team to drive his As-a-Service vision into the business (see link).
• F&A is the largest horizontal practice for Infosys BPO and contributes over one-third to the organizational revenues. With a strong performance in 2013-14, F&A BPO has become a bedrock for future BPO growth for the firm.
• EdgeVerge initiative helping drive a “product” mindset into Infosys BPO, which HfS views as critical for future As-a-Service models. By creating a separate business entity (see link) dedicated to developing As-a-Service platforms, with early traction in areas such as financial services, marketing and consumer experience, procurement, and supply chain.
• Panaya acquisition shows real “As-a-Service” intent. Panaya (see link) brings real automation capability for ERP customers, namely SAP and Oracle, which should add to F&A BPO potential with complex clients seeking to transform away from the legacy ERP model.
• Strong horizontal BPO breadth. Compelling procurement and sourcing capability to augment a strong horizontal BPO portfolio. With some major client wins, such as AkzoNobel and Atlas Copco, Infosys BPO has a strong horizontal portfolio across F&A, procurement, HR, and customer management services. Most of its competitors have failed to develop a business footprint beyond a handful of F&A and customer management clients.
• Management departures now in the past. After the challenging years of 2012-13 with frequent management turnover, the introduction of Vishal Sikka as CEO seems to have stemmed the tide and brought renewed vision, energy, and passion to the leadership.
• F&A market share still relatively small. Has not kept pace with the growth of Accenture, Capgemini, and Genpact since its entry in the F&A market; however, recent performance shows signs that the gap with the “Big 4” F&A providers is beginning to close. Moreover, its success with picking up smaller-scale deals puts the firm in a better position to move into delivering more “As-a-Service” offerings in the future.
• Deals overly-focused on FTE pricing. Most clients are based on an FTE model, but this is very typical of most providers, especially with new deals. The real challenge will be moving these clients into outcome/volume pricing models down the road.
• Quality of account management teams is variable. Especially in comparison with other competitors in this space. Over-reliance on C-Sat scores seen rather than a collaborative client relationship.
• Over-reliance on IT rather than process innovation. Like its Indian-heritage rivals Cognizant and TCS, has historically struggled to place BPO at the forefront of the company’s growth agenda. However, that may change swiftly under Vishal Sikka’s direction.
• Needs smarter account targeting to win new business. Frequently performs well enough to reach a short list, but is often overlooked at the “business end” of deals. A more focused approach to attract new business would benefit, including less reliance on sourcing advisors and a more sole-source approach.
• India-centric leadership and delivery. Infosys BPO has suffered from having most key decision makers and leadership based in India. To add, majority half of Infosys staff is still India-based.
Blueprint Leading Highlights
Execution • Engage customers and develop
communities • Leveraging new technologies,
security, social media, etc. • Continuous improvement
methodology and capability
Procure to Pay
Order to Cash
Record to Report
Finance Transformation
Winner’s Circle
Thriving in the As-A-Service Economy
Appendices:
IT Services and BPO Market Definitions, 2015
© 2015 HfS Research Ltd. Proprietary │Page 60
BPO can be defined as the contracting out of a business function within an organization to a third-party service provider. To be classified as "outsourcing" rather than just a professional service or point service engagement, the service provider will take over management responsibility for the process or set of processes.
The BPO market can be segmented into two main parts:
• The outsourcing of horizontal or cross-industry business processes, essentially business functions that exist across most organizations, such as finance and HR.
• The outsourcing of vertical or industry-specific business processes, for example: the claims management process for insurance companies and payment processing for banks
BPO
© 2015 HfS Research Ltd. Proprietary │Page 61
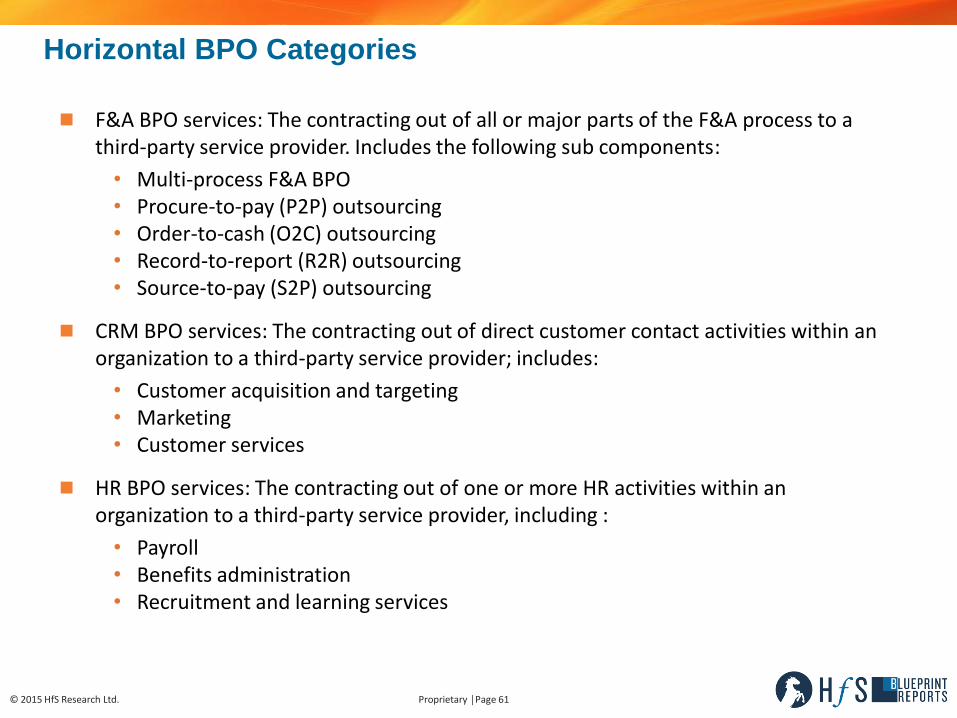
F&A BPO services: The contracting out of all or major parts of the F&A process to a third-party service provider. Includes the following sub components:
• Multi-process F&A BPO • Procure-to-pay (P2P) outsourcing • Order-to-cash (O2C) outsourcing • Record-to-report (R2R) outsourcing • Source-to-pay (S2P) outsourcing
CRM BPO services: The contracting out of direct customer contact activities within an organization to a third-party service provider; includes:
• Customer acquisition and targeting • Marketing • Customer services
HR BPO services: The contracting out of one or more HR activities within an organization to a third-party service provider, including :
• Payroll • Benefits administration • Recruitment and learning services
Horizontal BPO Categories
© 2015 HfS Research Ltd. Proprietary │Page 62
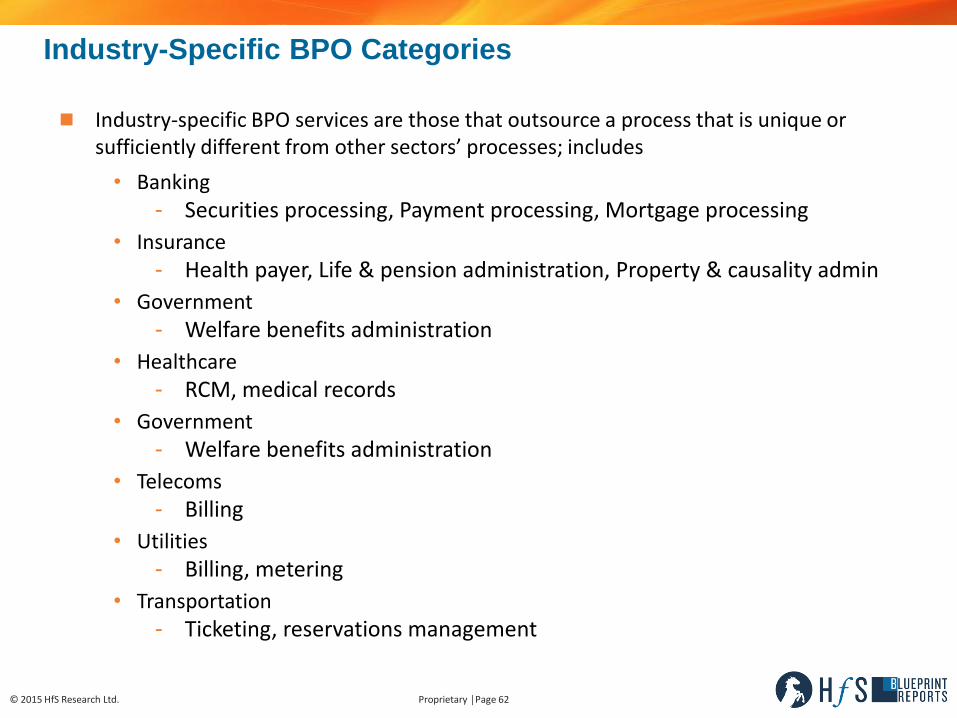
Industry-specific BPO services are those that outsource a process that is unique or sufficiently different from other sectors’ processes; includes
• Banking - Securities processing, Payment processing, Mortgage processing
• Insurance - Health payer, Life & pension administration, Property & causality admin
• Government - Welfare benefits administration
• Healthcare - RCM, medical records
• Government - Welfare benefits administration
• Telecoms - Billing
• Utilities - Billing, metering
• Transportation - Ticketing, reservations management
Industry-Specific BPO Categories
© 2015 HfS Research Ltd. Proprietary │Page 63
HfS segments IT services market into 3 distinct groups:
• Professional services • IT Management services • Other services (support and training)
IT Services
© 2015 HfS Research Ltd. Proprietary │Page 64
IT professional services include two main subgroups: consulting and deployment and implementation services.
IT consulting services are advisory services that aim to provide organizations with plans and strategies on the most effective way to use technology in support of their overriding business and organizational objectives. Services include benchmarking and needs assessment, IT process improvement, IT design, IT support planning, and IT strategy planning.
Deployment and implementation services include the release, installation and activation, and integration of custom software or a software package.
Professional Services
© 2015 HfS Research Ltd. Proprietary │Page 65
HfS' market sizing relies on using a consistent primary methodology for each service category. The primary method is a supply-side model that builds market dimensions by estimating revenues from the most significant service providers in each category.
HfS' primary market sizing method relies on the accuracy of its service provider models. These models generate the service provider revenue estimates by primary service category and geography. They are based on a number of different sources, including:
• Financial reports published by the individual companies, for example SEC filings and annual reports; • Presentations and reports from financial analysts; • Benchmarks of typical buying behavior in key industries; • Service provider responses to financial questionnaires; • Government data and data published by industry associations, which provide data on IT industries
and education; • HfS' contracts database, which provides analysis of service providers contracting activity; • Interviews with service buyers across different industries and company sizes • Executive-level interviews from the service provider community are conducted by HfS analysts as
part of the ongoing research agenda across the service categories. Insights and information relating to revenue performance gathered in this exercise are used as part of the estimation process;
• Estimations can be validated by service category by comparing them with other ratios. For example, taking the number of clients a service provider has in a particular service line multiplied by the average contract value or looking at expected revenue per employee for a service type multiplied by the number of people working in a particular service category;
• Market expertise of the HfS analysts
Market Sizing Method
© 2015 HfS Research Ltd. Proprietary │Page 66
We review the output from the revenue database to ensure that revenues by service category are in line with the published data. We remove any double counting between service categories and verify that the total revenues by geography (and industry where applicable) match the analysts’ expectations based on all of the information we have.
Analysts review the service provider data for each market; the database provides a ranking of service providers that HfS tracks. Each analyst estimates the revenue made up by the vendors that is not included in the database. The estimation method varies by service category but is based on the analysts’ understanding of the structure of the market and the portion of the market that is tracked in the database. Some markets will have a greater portion of vendors in the database, such as the US market for multi-process F&A outsourcing, which largely encompasses large deals from a pool of well-known and closely tracked providers. Other markets, such as the US professional services market, have a much larger number of small providers and thus a smaller fraction is captured in our database.
Market Sizing Method
© 2015 HfS Research Ltd. Proprietary │Page 67
To help ensure that this part of the exercise is as accurate as possible, HfS uses supplementary methods to triangulate the data in its market sizing. This helps check that revenues are not over- or under-estimated and that the overall market size is accurate.
To supplement the primary method, HfS uses demand-side models for each primary market category. HfS has a database of over 10,000 demand-side interviews collected every 12 months. These interviews enable HfS to build an analysis of service demand by major industry and geography.
For the main IT and BPO outsourcing categories (ITO, HRO, CRM, etc.), HfS has an extensive database of BPO engagements gathered from mid-market and enterprise-level service providers. We analyze these data and convert them into monthly run-rate figures for each engagement. Taking into account these deals and estimates for signings that are missing from the contract database gives HfS another dimension for estimating of the size of each of these sourcing markets. It also gives valuable insight into the nature of the current market, showing deal-size trends and the maturity of outsourcing within industry sectors. This method is also an important part of the forecast process for some markets.
Market Sizing Method
© 2015 HfS Research Ltd. Proprietary │Page 68
Forecasting technology, IT services, and BPO with traditional history-based methods are notoriously problematic when either historical values don't exist or future events don't have any direct correlation with past data. To overcome these shortcomings, HfS selects from a bank of different forecast methods to predict different markets; the starting point for the market forecast is the primary sizing method. HfS predicts the likely future revenue growth of each supplier by reviewing regional data, direct interaction between HfS analysts and service providers, and predictions made in financial reports. This gives HfS a firm basis for its short-term forecast (12-24 months), which is then extrapolated using additional methods for the full five-year forecast period.
HfS Research market forecasting uses the following factors :
• Application of market momentum from existing outsourcing deals; • Time series forecast growth from existing deal signings provides the base forecast; • Application of likely growth by industry from current economic growth forecasts; • Assumption forecast based on the likely relationship between economic growth
and outsourcing markets; • Assumption and cross impact with key drivers and inhibitors in each market.
Market Forecasting Method
© 2015 HfS Research Ltd. Proprietary │Page 69
Market Forecasting Method
For each forecast, HfS provides our view of the weightings of the main factors impacting each forecast, dividing these into four main categories:
• Economic and market structural growth indicators: Analysts look at the historical connections between different services market and economic growth and then use current economic forecasts and past correlations between economic growth and services market growth to predict future services market growth. Analysts determine what factors are changing the structure of the market now and in the future and try to predict major changes in the way the market is going to operate and how they are likely to impact the forecast. For example, is the SME market going to take off in the forecast period? Is the cloud going to fundamentally change the take up of a particular services market?
• Customer intention growth indicators: As part of its ongoing research, HfS asks buyers about spending intentions. This information is consolidated and used as a guide to forecast growth, particularly by industry and by region.
• Service provider growth indicators: As part of its ongoing research, HfS asks service providers about likely growth within their markets. It also tracks vendors’ revenue performance. HfS consolidates this information and uses it as a guide, particularly to forecast growth in different service lines and regions.
• Analyst’s view: How does the analyst view market growth in the forecast period, taking into account all of these indicators?

About the Authors
© 2015 HfS Research Ltd. Proprietary │Page 71
Phil Fersht, President and CEO, HfS Research
Overview
20 years’ business experience in the global IT and business process outsourcing and shared services industry
Industry analyst, author, speaker, strategist, and blogger Advised on 100s of global IT services, BPO, and shared services
engagements Facilitates the largest global network of enterprise services ad operations
professionals
Previous Experience
Practice Lead, IT Services & BPO Research, Gartner, Inc. Global BPO Marketplace Leader, Deloitte Consulting Consulting Practice Lead, IDC Asia/Pacific IT Markets Practice Lead, IDC Europe
Education
• BS with Honors in European Business & Technology, Coventry University, United Kingdom
• Diplôme Universitaire de Technologie in Business & Technology from the University of Grenoble, France
© 2015 HfS Research Ltd. Proprietary │Page 72
Hema Santosh, Senior Research Analyst – Bangalore, India
Overview
Hema Santosh is a senior analyst at HfS supporting research in finance and accounting and related business services, captives, and global in-house centers.
Over 14 years of research experience supporting leadership on strategic and critical business decisions.
Previous Experience
She has held senior research positions for organizations such as Information Services Group, Accenture, Wipro, and ITFinity Solutions.
Her journey as a research professional has evolved over 14 years by working across facets of MIS, business planning, market forecasting, market analysis, competitive intelligence, and large strategic initiatives for the organizations she has worked with.
Education
• Bachelor’s degree in Commerce from the University of Mumbai • MBA specializing in Marketing from Manipal University • Certificate in full-time “Management Program for Women Entrepreneurs”
from the Indian Institute of Management (IIM), Bangalore
© 2015 HfS Research Ltd. Proprietary │Page 73
About HfS Research
HfS Research is the leading analyst authority and global network for IT and business services, with a specific focus on global business services, digital transformation, and outsourcing. HfS serves the research, governance, and services strategy needs of business operations and IT leaders across finance, supply chain, human resources, marketing, and core industry functions. The firm provides insightful and meaningful analyst coverage of best business practices and innovations that impact successful business outcomes, such as the digital transformation of operations, cloud-based business platforms, services talent development strategies, process automation and outsourcing, mobility, analytics, and social collaboration. HfS applies its acclaimed Blueprint Methodology to evaluate the performance of service and technology in terms of innovating and executing against those business outcomes.
HfS educates and facilitates discussions among the world's largest knowledge community of enterprise services professionals, currently comprising 150,000 subscribers and members. HfS Research facilitates the HfS Sourcing Executive Council, the acclaimed elite group of sourcing practitioners from leading organizations that meets bi-annually to share the future direction of the global services industry and to discuss the future enterprise operations framework. HfS provides sourcing executive council members with the HfS Governance Academy and Certification Program to help its clients improve the governance of their global business services and vendor relationships.
In 2010 and 2011, HfS Research's Founder and CEO, Phil Fersht, was named “Analyst of the Year” by the International Institute of Analyst Relations (IIAR), the premier body of analyst-facing professionals, and achieved the distinctive award of being voted the research analyst industry's Most Innovative Analyst Firm in 2012.
In 2013, HfS was named first in rising influence among leading analyst firms, according to the 2013 Analyst Value Survey, and second out of the 44 leading industry analyst firms in the 2013 Analyst Value Index.
Now in its seventh year of publication, HfS Research’s acclaimed blog “Horses for Sources” is widely recognized as the most widely read and revered destination for unfettered collective insight, research, and open debate about sourcing industry issues and developments. Horses for Sources today receives over a million web visits a year.
To learn more about HfS Research, please email [email protected].