HFM Reporting Dimensions - Poltrona Frau Groupintranet.poltronafraugroup.com/hyperion/Tutorial...
15
Page 1 of 15 Chapter 2 – Dimensions 1. Introduction Now we can see the structure of dimensions of Oracle Hyperion Financial Management System. 1 EIGHT STANDARD DIMENSIONS FOUR CUSTOM DIMENSIONS Scenario Period Year View Entity Value Account Intercompany Partner SBU Geographical Area Nature Brand HFM Reporting Dimensions There are 12 dimensions in HFM: each data must be loaded and analyzed by their combination. 2 Dimensions Dimensions describe your organization’s data. ACCOUNT E.B.I.T. Gross Contribution Margin Gross Profit Commission Payables Operative Expenses Depreciation & Amortization Other fixed cost of structure ENTITY GROUP 001 007 008 009 011 012 017 ....... PERIOD Quarter 1 January February March ....... Transportati on Salaries
Transcript of HFM Reporting Dimensions - Poltrona Frau Groupintranet.poltronafraugroup.com/hyperion/Tutorial...
Page 1 of 15
Chapter 2 – Dimensions
1. Introduction
Now we can see the structure of dimensions of Oracle Hyperion Financial Management System.
1
EIGHT STANDARD DIMENSIONS
FOUR CUSTOM DIMENSIONS
Scenario
Period
Year
View
Entity
Value
Account
IntercompanyPartner
SBU
Geographical
Area
Nature
Brand
HFM Reporting Dimensions
There are 12 dimensions in HFM: each data must be loaded and analyzed by their combination.
2
Dimensions
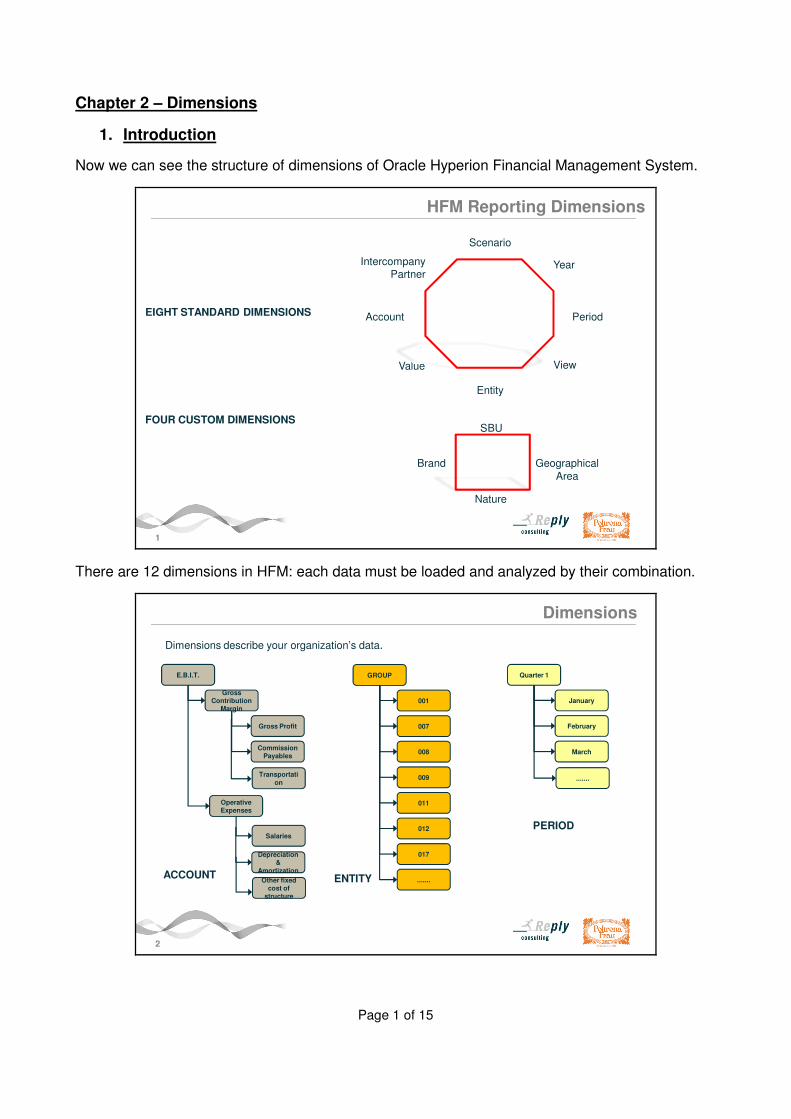
Dimensions describe your organization’s data.
ACCOUNT
E.B.I.T.
Gross Contribution
Margin
Gross Profit
Commission Payables
Operative Expenses
Depreciation &
Amortization
Other fixed cost of
structure
ENTITY
GROUP
001
007
008
009
011
012
017
.......
PERIOD
Quarter 1
January
February
March
.......Transportati
on
Salaries
Page 2 of 15
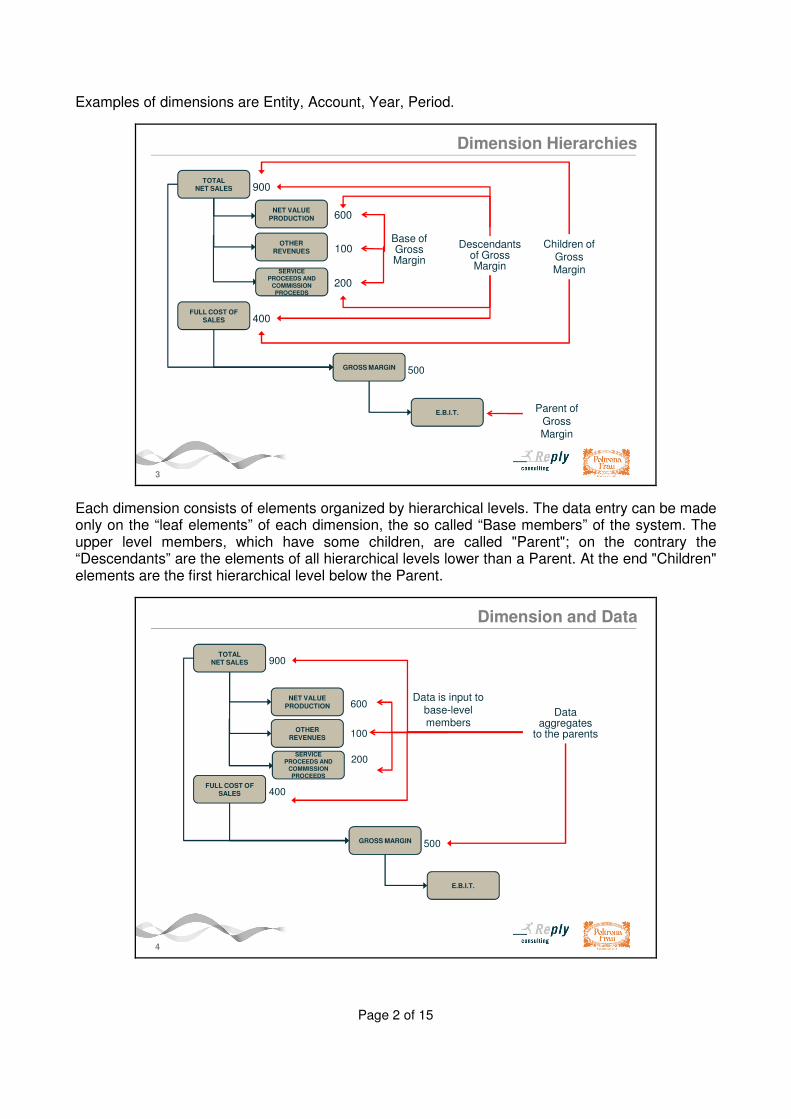
Examples of dimensions are Entity, Account, Year, Period.
3
Dimension Hierarchies
E.B.I.T.
GROSS MARGIN
FULL COST OF SALES
TOTAL NET SALES
NET VALUE
PRODUCTION
OTHER REVENUES
Parent of
Gross Margin
600
200
400
900
500
Descendants of Gross Margin
Base of Gross Margin
Children of Gross MarginSERVICE
PROCEEDS AND COMMISSION PROCEEDS
100
Each dimension consists of elements organized by hierarchical levels. The data entry can be made only on the “leaf elements” of each dimension, the so called “Base members” of the system. The upper level members, which have some children, are called "Parent"; on the contrary the “Descendants” are the elements of all hierarchical levels lower than a Parent. At the end "Children" elements are the first hierarchical level below the Parent.
4
E.B.I.T.
GROSS MARGIN
FULL COST OF SALES
TOTAL NET SALES
NET VALUE PRODUCTION
OTHER REVENUES
600
200
400
900
500
Data is input to base-level members
Data aggregates
to the parents
SERVICE PROCEEDS AND
COMMISSION PROCEEDS
100
Dimension and Data
Page 3 of 15
An important concept of HFM is the “Point of View” (called “POV”): it defines the intersection of the 12 dimensions that we are using while analyzing a given data. It is mandatory to select the desired item for the navigable dimensions in all data forms or Management Reports; the other dimensions will have fixed elements already defined (in rows / columns or set in the “POV”).
Now we can look at the individual dimensions, starting from Scenario, Year, Period and View.
2. Scenario, Year, Period, View
5
Scenario
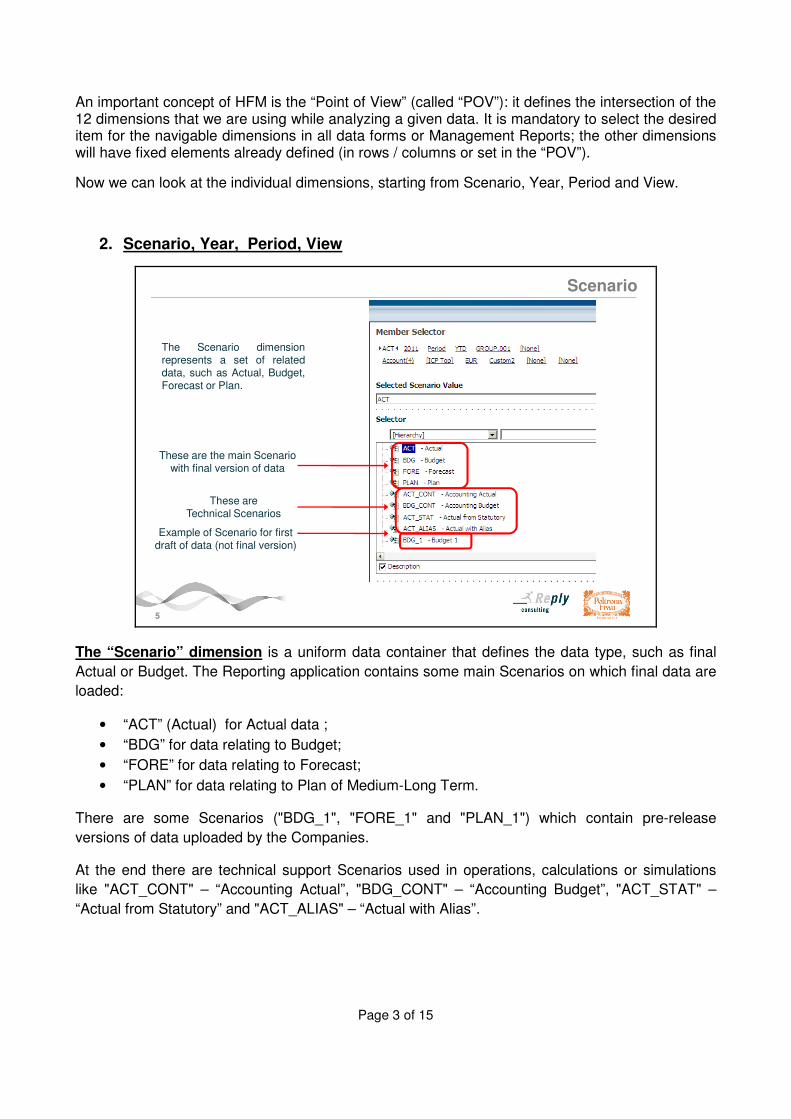
These are the main Scenario with final version of data
These areTechnical Scenarios
Example of Scenario for first draft of data (not final version)
The Scenario dimensionrepresents a set of relateddata, such as Actual, Budget,Forecast or Plan.
The “Scenario” dimension is a uniform data container that defines the data type, such as final
Actual or Budget. The Reporting application contains some main Scenarios on which final data are
loaded:
• “ACT” (Actual) for Actual data ;
• “BDG” for data relating to Budget;
• “FORE” for data relating to Forecast;
• “PLAN” for data relating to Plan of Medium-Long Term.
There are some Scenarios ("BDG_1", "FORE_1" and "PLAN_1") which contain pre-release
versions of data uploaded by the Companies.
At the end there are technical support Scenarios used in operations, calculations or simulations
like "ACT_CONT" – “Accounting Actual”, "BDG_CONT" – “Accounting Budget”, "ACT_STAT" –
“Actual from Statutory” and "ACT_ALIAS" – “Actual with Alias”.
Page 4 of 15
6
Year
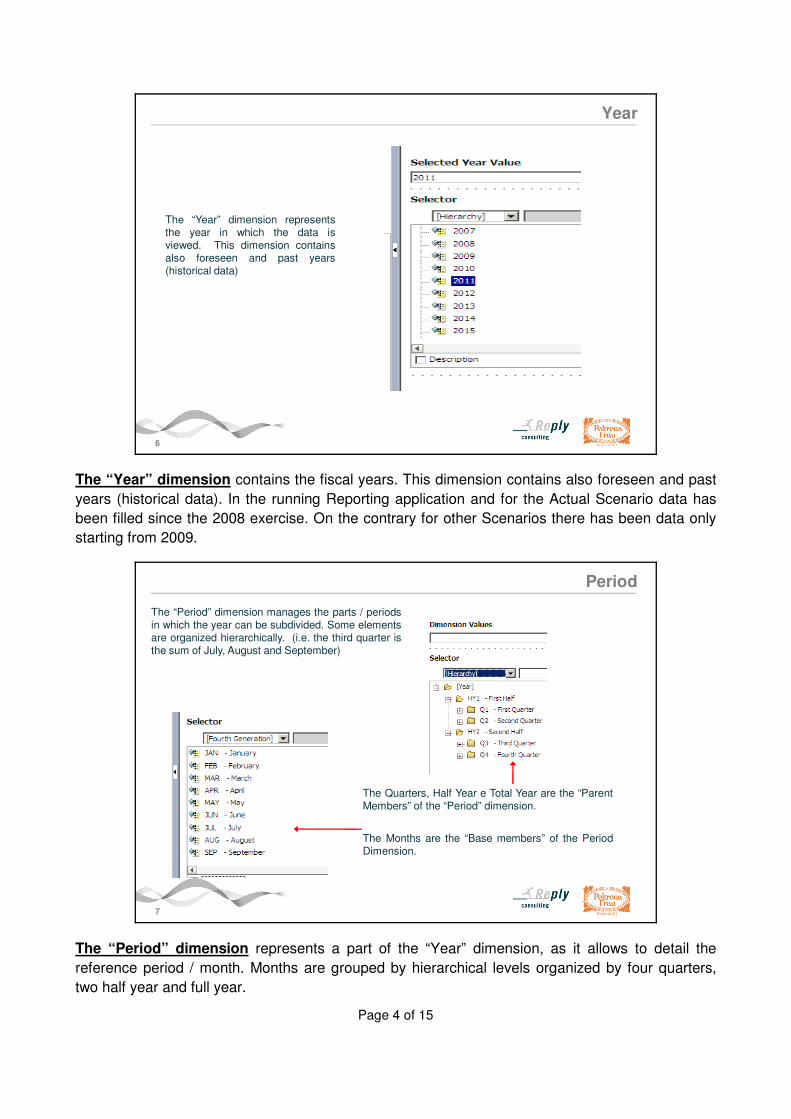
The “Year” dimension representsthe year in which the data isviewed. This dimension containsalso foreseen and past years(historical data)
The “Year” dimension contains the fiscal years. This dimension contains also foreseen and past
years (historical data). In the running Reporting application and for the Actual Scenario data has
been filled since the 2008 exercise. On the contrary for other Scenarios there has been data only
starting from 2009.
7
Period
The “Period” dimension manages the parts / periodsin which the year can be subdivided. Some elementsare organized hierarchically. (i.e. the third quarter isthe sum of July, August and September)
The Months are the “Base members” of the PeriodDimension.
The Quarters, Half Year e Total Year are the “ParentMembers” of the “Period” dimension.
The “Period” dimension represents a part of the “Year” dimension, as it allows to detail the
reference period / month. Months are grouped by hierarchical levels organized by four quarters,
two half year and full year.
Page 5 of 15
8
View
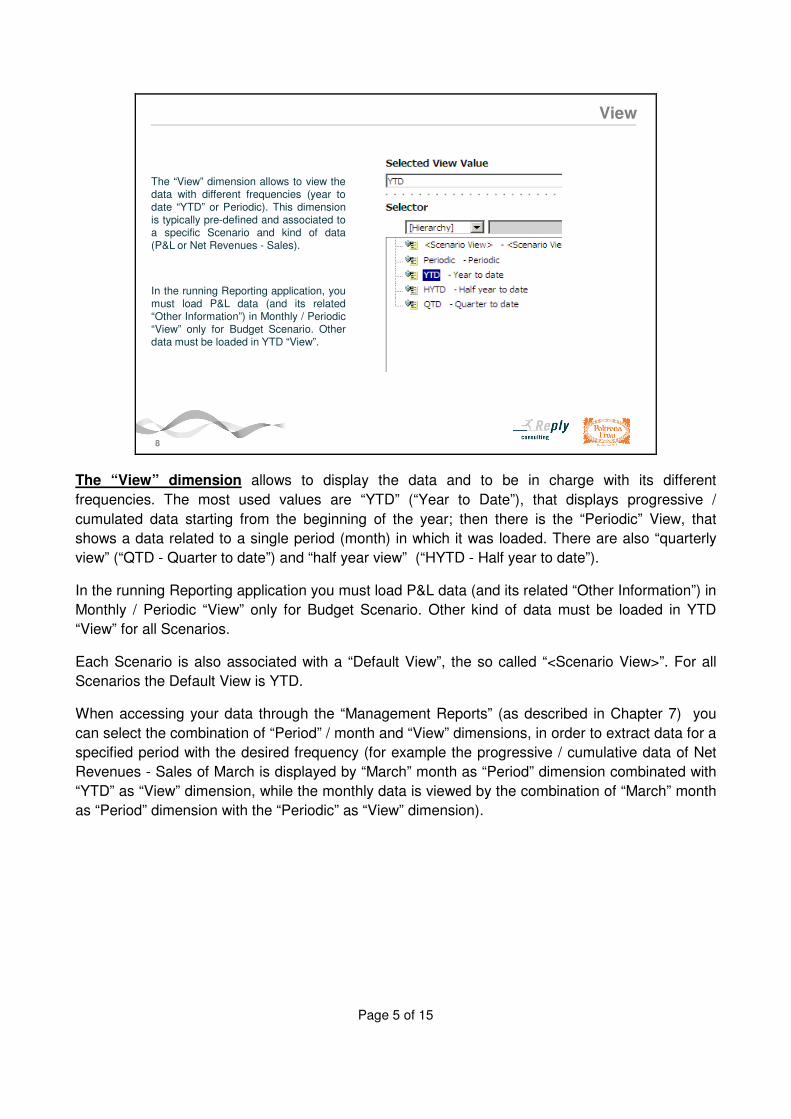
The “View” dimension allows to view thedata with different frequencies (year todate “YTD” or Periodic). This dimensionis typically pre-defined and associated toa specific Scenario and kind of data(P&L or Net Revenues - Sales).
In the running Reporting application, youmust load P&L data (and its related“Other Information”) in Monthly / Periodic“View” only for Budget Scenario. Otherdata must be loaded in YTD “View”.
The “View” dimension allows to display the data and to be in charge with its different
frequencies. The most used values are “YTD” (“Year to Date”), that displays progressive /
cumulated data starting from the beginning of the year; then there is the “Periodic” View, that
shows a data related to a single period (month) in which it was loaded. There are also “quarterly
view” (“QTD - Quarter to date”) and “half year view” (“HYTD - Half year to date”).
In the running Reporting application you must load P&L data (and its related “Other Information”) in
Monthly / Periodic “View” only for Budget Scenario. Other kind of data must be loaded in YTD
“View” for all Scenarios.
Each Scenario is also associated with a “Default View”, the so called “<Scenario View>”. For all
Scenarios the Default View is YTD.
When accessing your data through the “Management Reports” (as described in Chapter 7) you
can select the combination of “Period” / month and “View” dimensions, in order to extract data for a
specified period with the desired frequency (for example the progressive / cumulative data of Net
Revenues - Sales of March is displayed by “March” month as “Period” dimension combinated with
“YTD” as “View” dimension, while the monthly data is viewed by the combination of “March” month
as “Period” dimension with the “Periodic” as “View” dimension).
Page 6 of 15
3. ENTITY e ICP
9
Entity
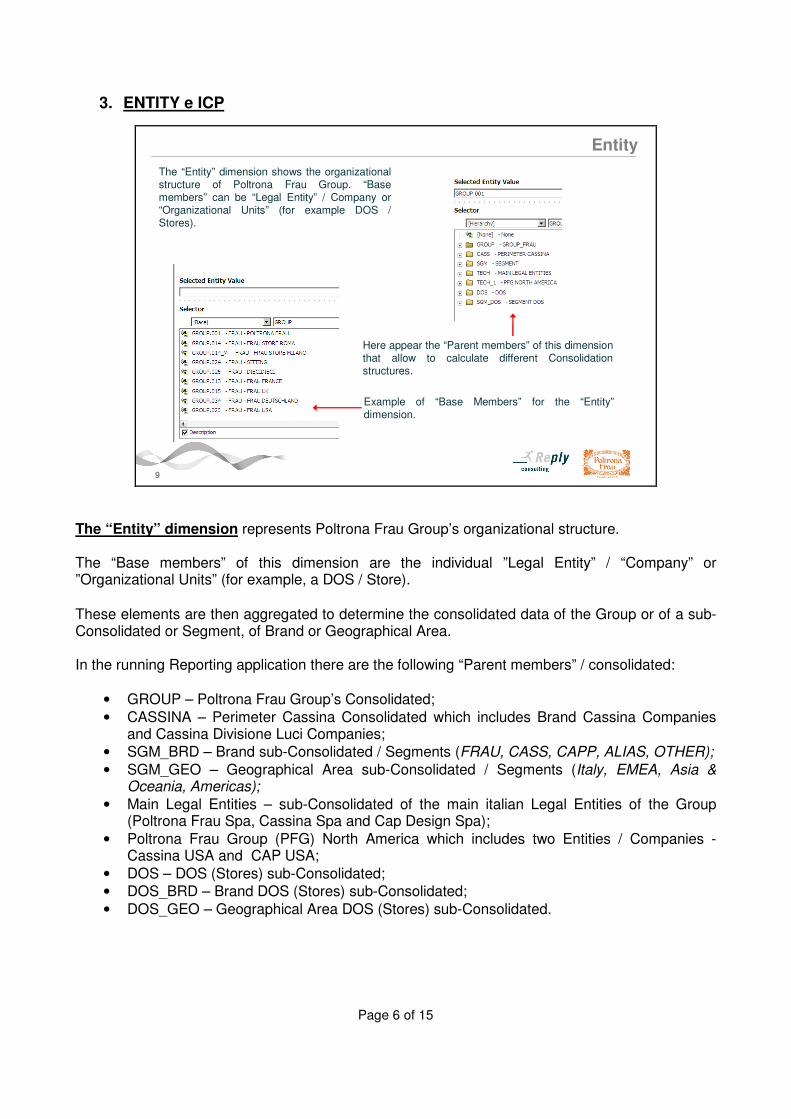
The “Entity” dimension shows the organizationalstructure of Poltrona Frau Group. “Basemembers” can be “Legal Entity” / Company or“Organizational Units” (for example DOS /Stores).
Example of “Base Members” for the “Entity”dimension.
Here appear the “Parent members” of this dimensionthat allow to calculate different Consolidationstructures.
The “Entity” dimension represents Poltrona Frau Group’s organizational structure. The “Base members” of this dimension are the individual ”Legal Entity” / “Company” or ”Organizational Units” (for example, a DOS / Store).
These elements are then aggregated to determine the consolidated data of the Group or of a sub-Consolidated or Segment, of Brand or Geographical Area. In the running Reporting application there are the following “Parent members” / consolidated:
• GROUP – Poltrona Frau Group’s Consolidated;
• CASSINA – Perimeter Cassina Consolidated which includes Brand Cassina Companies and Cassina Divisione Luci Companies;
• SGM_BRD – Brand sub-Consolidated / Segments (FRAU, CASS, CAPP, ALIAS, OTHER);
• SGM_GEO – Geographical Area sub-Consolidated / Segments (Italy, EMEA, Asia & Oceania, Americas);
• Main Legal Entities – sub-Consolidated of the main italian Legal Entities of the Group (Poltrona Frau Spa, Cassina Spa and Cap Design Spa);
• Poltrona Frau Group (PFG) North America which includes two Entities / Companies - Cassina USA and CAP USA;
• DOS – DOS (Stores) sub-Consolidated;
• DOS_BRD – Brand DOS (Stores) sub-Consolidated;
• DOS_GEO – Geographical Area DOS (Stores) sub-Consolidated.
Page 7 of 15
10
ICP
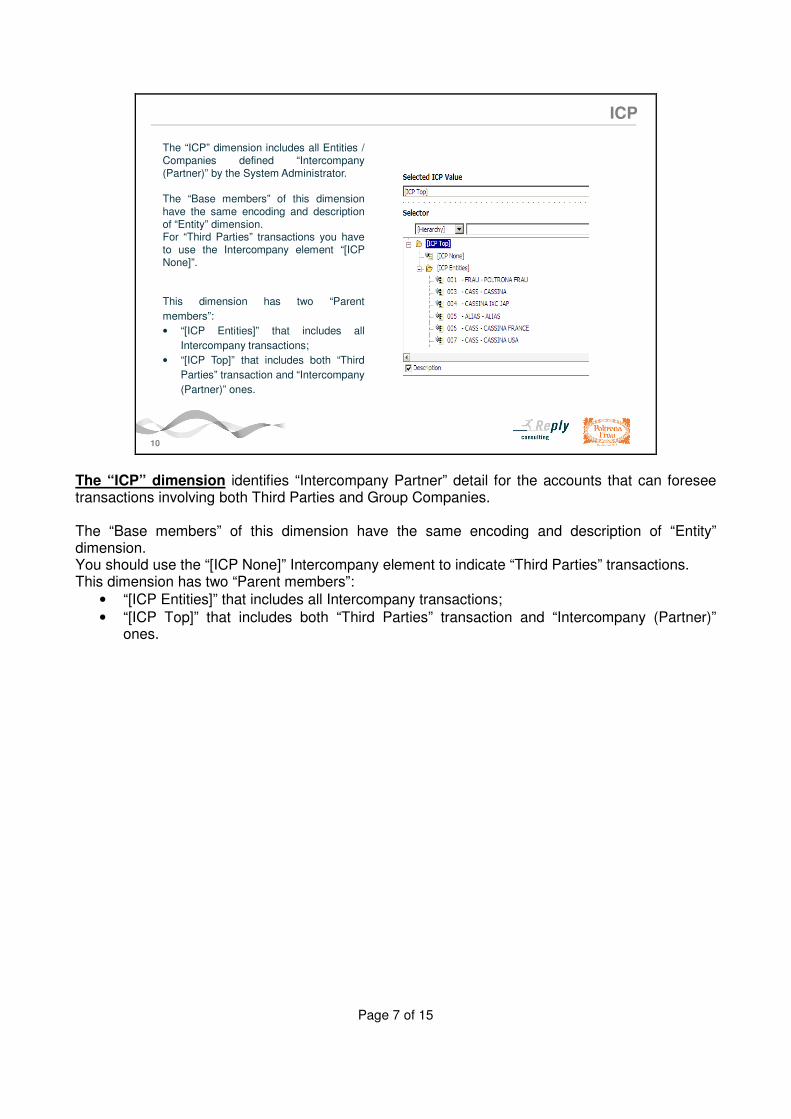
The “ICP” dimension includes all Entities /Companies defined “Intercompany(Partner)” by the System Administrator.
The “Base members” of this dimensionhave the same encoding and descriptionof “Entity” dimension.For “Third Parties” transactions you haveto use the Intercompany element “[ICPNone]”.
This dimension has two “Parent
members”:
• “[ICP Entities]” that includes all
Intercompany transactions;
• “[ICP Top]” that includes both “Third
Parties” transaction and “Intercompany
(Partner)” ones.
The “ICP” dimension identifies “Intercompany Partner” detail for the accounts that can foresee transactions involving both Third Parties and Group Companies. The “Base members” of this dimension have the same encoding and description of “Entity” dimension. You should use the “[ICP None]” Intercompany element to indicate “Third Parties” transactions. This dimension has two “Parent members”:
• “[ICP Entities]” that includes all Intercompany transactions;
• “[ICP Top]” that includes both “Third Parties” transaction and “Intercompany (Partner)” ones.
Page 8 of 15
4. Account
11
Account
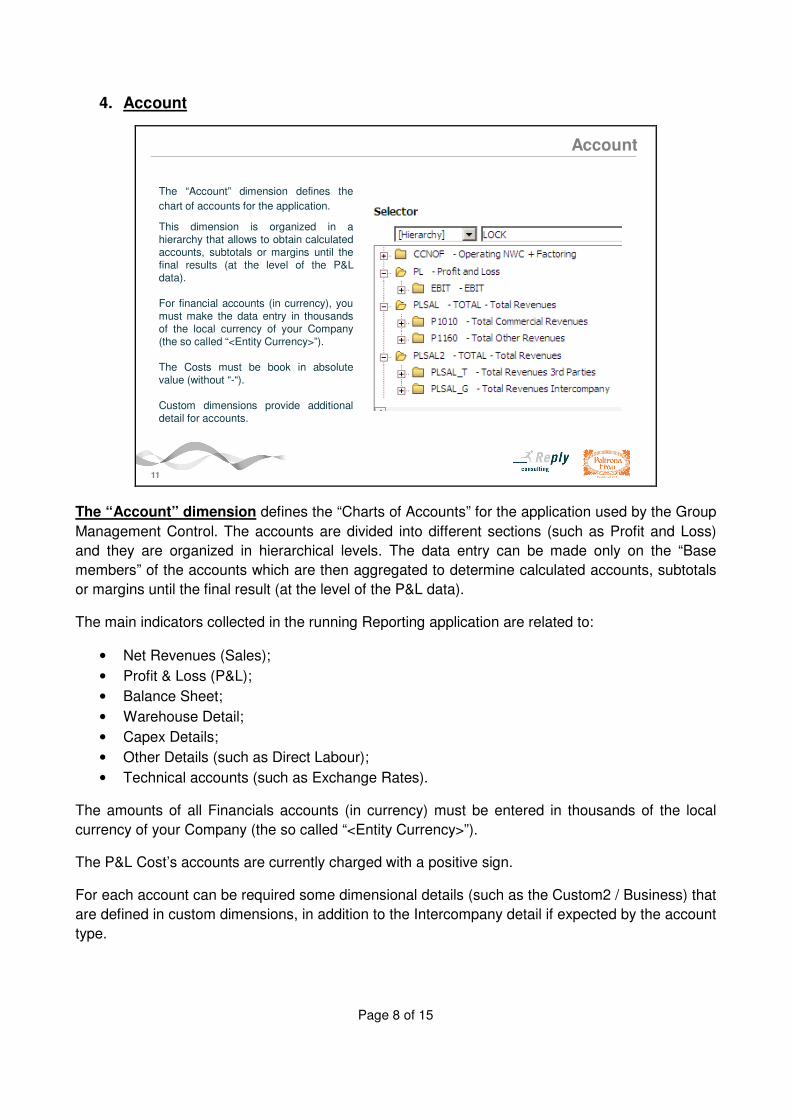
The “Account” dimension defines the
chart of accounts for the application.
This dimension is organized in ahierarchy that allows to obtain calculatedaccounts, subtotals or margins until thefinal results (at the level of the P&Ldata).
For financial accounts (in currency), youmust make the data entry in thousandsof the local currency of your Company(the so called “<Entity Currency>”).
The Costs must be book in absolutevalue (without “-“).
Custom dimensions provide additionaldetail for accounts.
The “Account” dimension defines the “Charts of Accounts” for the application used by the Group
Management Control. The accounts are divided into different sections (such as Profit and Loss)
and they are organized in hierarchical levels. The data entry can be made only on the “Base
members” of the accounts which are then aggregated to determine calculated accounts, subtotals
or margins until the final result (at the level of the P&L data).
The main indicators collected in the running Reporting application are related to:
• Net Revenues (Sales);
• Profit & Loss (P&L);
• Balance Sheet;
• Warehouse Detail;
• Capex Details;
• Other Details (such as Direct Labour);
• Technical accounts (such as Exchange Rates).
The amounts of all Financials accounts (in currency) must be entered in thousands of the local
currency of your Company (the so called “<Entity Currency>”).
The P&L Cost’s accounts are currently charged with a positive sign.
For each account can be required some dimensional details (such as the Custom2 / Business) that
are defined in custom dimensions, in addition to the Intercompany detail if expected by the account
type.
Page 9 of 15
5. Custom Dimensions: Brand, Business and Geographical Area
12
Custom 1 - Brand
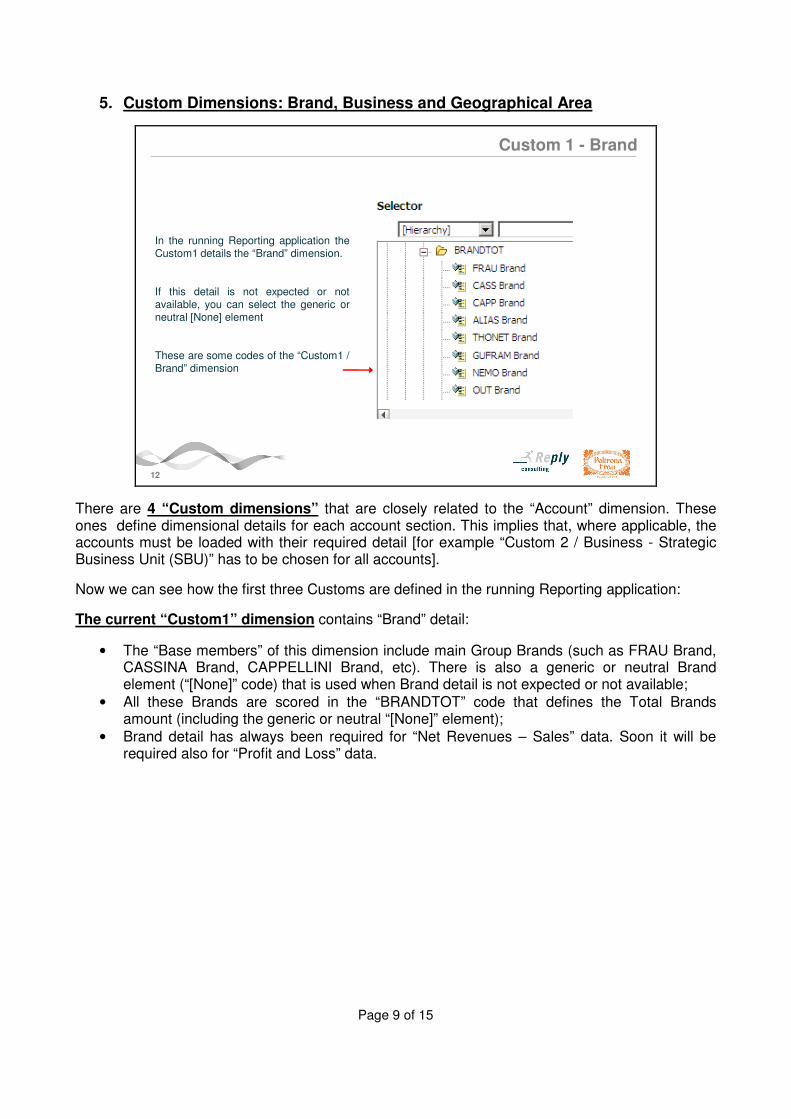
In the running Reporting application theCustom1 details the “Brand” dimension.
If this detail is not expected or notavailable, you can select the generic orneutral [None] element
These are some codes of the “Custom1 /Brand” dimension
There are 4 “Custom dimensions” that are closely related to the “Account” dimension. These ones define dimensional details for each account section. This implies that, where applicable, the accounts must be loaded with their required detail [for example “Custom 2 / Business - Strategic Business Unit (SBU)” has to be chosen for all accounts].
Now we can see how the first three Customs are defined in the running Reporting application:
The current “Custom1” dimension contains “Brand” detail:
• The “Base members” of this dimension include main Group Brands (such as FRAU Brand, CASSINA Brand, CAPPELLINI Brand, etc). There is also a generic or neutral Brand element (“[None]” code) that is used when Brand detail is not expected or not available;
• All these Brands are scored in the “BRANDTOT” code that defines the Total Brands amount (including the generic or neutral “[None]” element);
• Brand detail has always been required for “Net Revenues – Sales” data. Soon it will be required also for “Profit and Loss” data.
Page 10 of 15
13
Custom 2 – Strategic Business Unit
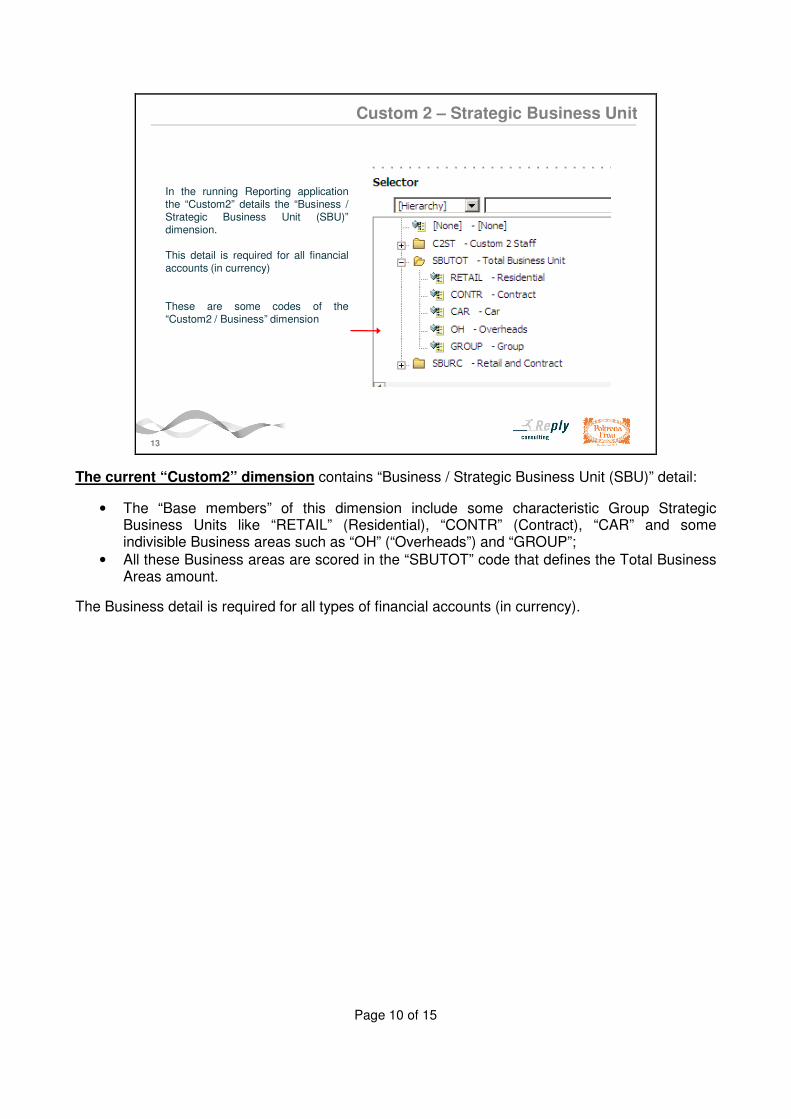
In the running Reporting applicationthe “Custom2” details the “Business /Strategic Business Unit (SBU)”dimension.
This detail is required for all financialaccounts (in currency)
These are some codes of the“Custom2 / Business” dimension
The current “Custom2” dimension contains “Business / Strategic Business Unit (SBU)” detail:
• The “Base members” of this dimension include some characteristic Group Strategic Business Units like “RETAIL” (Residential), “CONTR” (Contract), “CAR” and some indivisible Business areas such as “OH” (“Overheads”) and “GROUP”;
• All these Business areas are scored in the “SBUTOT” code that defines the Total Business Areas amount.
The Business detail is required for all types of financial accounts (in currency).
Page 11 of 15
14
Custom 3 – Geographical Area
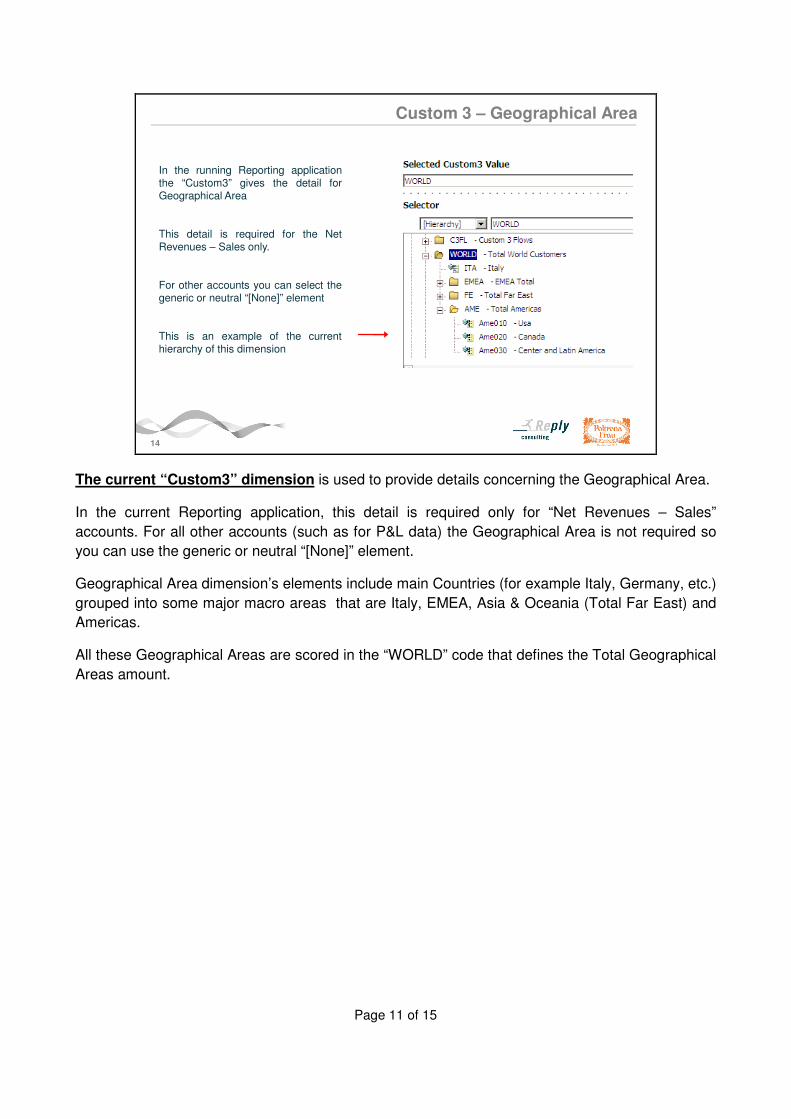
In the running Reporting applicationthe “Custom3” gives the detail forGeographical Area
This detail is required for the NetRevenues – Sales only.
For other accounts you can select thegeneric or neutral “[None]” element
This is an example of the currenthierarchy of this dimension
The current “Custom3” dimension is used to provide details concerning the Geographical Area.
In the current Reporting application, this detail is required only for “Net Revenues – Sales”
accounts. For all other accounts (such as for P&L data) the Geographical Area is not required so
you can use the generic or neutral “[None]” element.
Geographical Area dimension’s elements include main Countries (for example Italy, Germany, etc.)
grouped into some major macro areas that are Italy, EMEA, Asia & Oceania (Total Far East) and
Americas.
All these Geographical Areas are scored in the “WORLD” code that defines the Total Geographical
Areas amount.
Page 12 of 15
6. Custom 4 / Nature and Value
15
Custom 4 - Nature
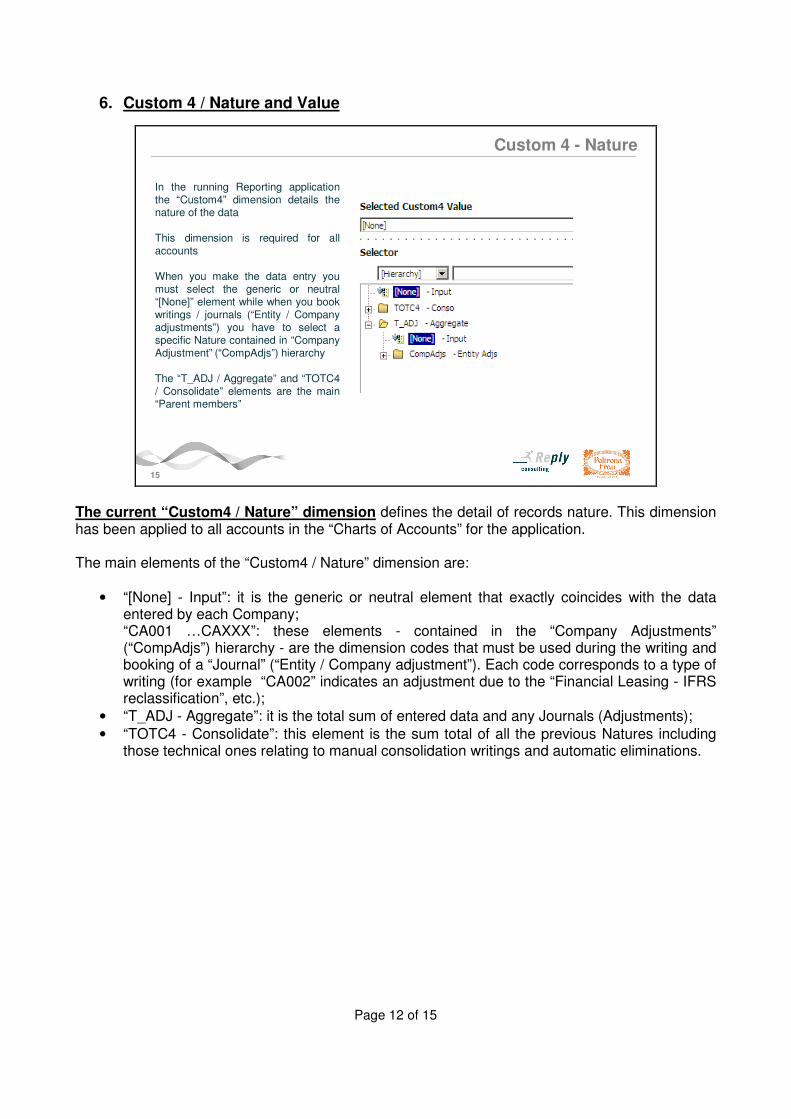
In the running Reporting applicationthe “Custom4” dimension details thenature of the data
This dimension is required for allaccounts
When you make the data entry youmust select the generic or neutral“[None]” element while when you bookwritings / journals (“Entity / Companyadjustments”) you have to select aspecific Nature contained in “CompanyAdjustment” (“CompAdjs”) hierarchy
The “T_ADJ / Aggregate” and “TOTC4/ Consolidate” elements are the main“Parent members”
The current “Custom4 / Nature” dimension defines the detail of records nature. This dimension has been applied to all accounts in the “Charts of Accounts” for the application. The main elements of the “Custom4 / Nature” dimension are:
• “[None] - Input”: it is the generic or neutral element that exactly coincides with the data entered by each Company; “CA001 …CAXXX”: these elements - contained in the “Company Adjustments” (“CompAdjs”) hierarchy - are the dimension codes that must be used during the writing and booking of a “Journal” (“Entity / Company adjustment”). Each code corresponds to a type of writing (for example “CA002” indicates an adjustment due to the “Financial Leasing - IFRS reclassification”, etc.);
• “T_ADJ - Aggregate”: it is the total sum of entered data and any Journals (Adjustments);
• “TOTC4 - Consolidate”: this element is the sum total of all the previous Natures including those technical ones relating to manual consolidation writings and automatic eliminations.
Page 13 of 15
16
Value
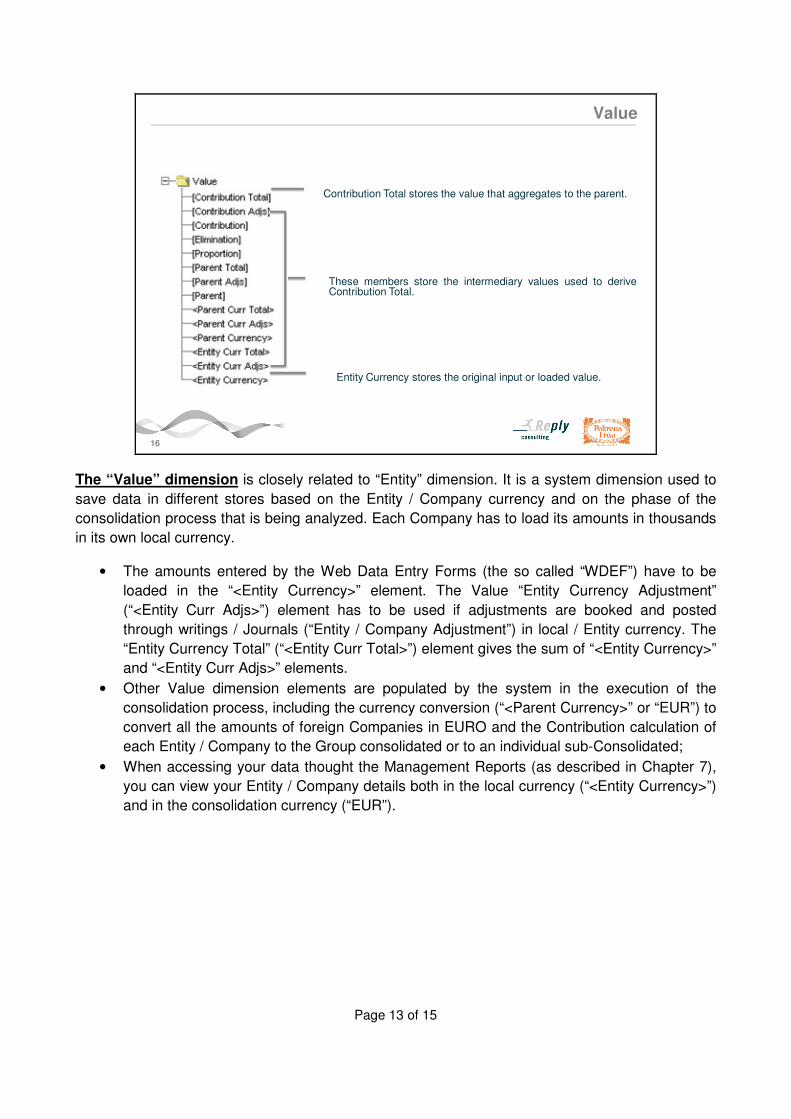
Entity Currency stores the original input or loaded value.
Contribution Total stores the value that aggregates to the parent.
These members store the intermediary values used to deriveContribution Total.
The “Value” dimension is closely related to “Entity” dimension. It is a system dimension used to
save data in different stores based on the Entity / Company currency and on the phase of the
consolidation process that is being analyzed. Each Company has to load its amounts in thousands
in its own local currency.
• The amounts entered by the Web Data Entry Forms (the so called “WDEF”) have to be
loaded in the “<Entity Currency>” element. The Value “Entity Currency Adjustment”
(“<Entity Curr Adjs>”) element has to be used if adjustments are booked and posted
through writings / Journals (“Entity / Company Adjustment”) in local / Entity currency. The
“Entity Currency Total” (“<Entity Curr Total>”) element gives the sum of “<Entity Currency>”
and “<Entity Curr Adjs>” elements.
• Other Value dimension elements are populated by the system in the execution of the
consolidation process, including the currency conversion (“<Parent Currency>” or “EUR”) to
convert all the amounts of foreign Companies in EURO and the Contribution calculation of
each Entity / Company to the Group consolidated or to an individual sub-Consolidated;
• When accessing your data thought the Management Reports (as described in Chapter 7),
you can view your Entity / Company details both in the local currency (“<Entity Currency>”)
and in the consolidation currency (“EUR”).
Page 14 of 15
17
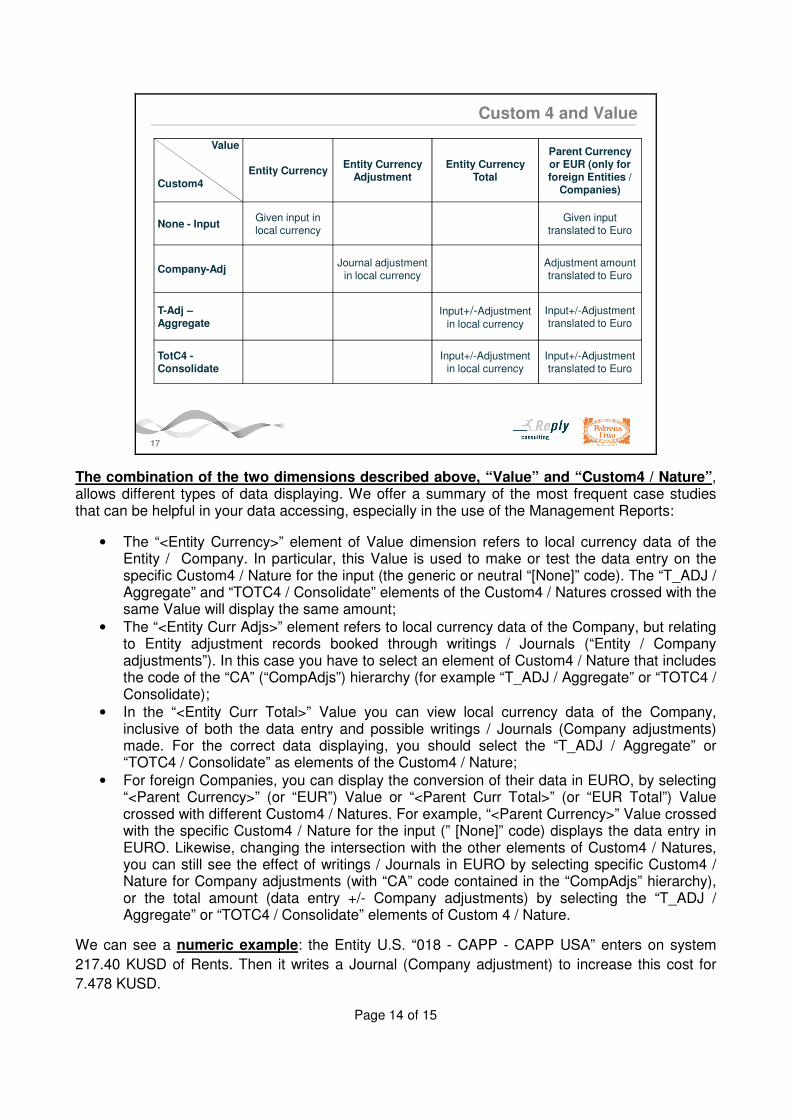
Custom 4 and Value
Value
Custom4
Entity CurrencyEntity Currency
AdjustmentEntity Currency
Total
Parent Currency or EUR (only for foreign Entities /
Companies)
None - InputGiven input in local currency
Given input translated to Euro
Company-AdjJournal adjustment
in local currencyAdjustment amount translated to Euro
T-Adj –Aggregate
Input+/-Adjustment
in local currency
Input+/-Adjustment translated to Euro
TotC4 -Consolidate
Input+/-Adjustment in local currency
Input+/-Adjustment translated to Euro
The combination of the two dimensions described above, “Value” and “Custom4 / Nature”, allows different types of data displaying. We offer a summary of the most frequent case studies that can be helpful in your data accessing, especially in the use of the Management Reports:
• The “<Entity Currency>” element of Value dimension refers to local currency data of the Entity / Company. In particular, this Value is used to make or test the data entry on the specific Custom4 / Nature for the input (the generic or neutral “[None]” code). The “T_ADJ / Aggregate” and “TOTC4 / Consolidate” elements of the Custom4 / Natures crossed with the same Value will display the same amount;
• The “<Entity Curr Adjs>” element refers to local currency data of the Company, but relating to Entity adjustment records booked through writings / Journals (“Entity / Company adjustments”). In this case you have to select an element of Custom4 / Nature that includes the code of the “CA” (“CompAdjs”) hierarchy (for example “T_ADJ / Aggregate” or “TOTC4 / Consolidate);
• In the “<Entity Curr Total>” Value you can view local currency data of the Company, inclusive of both the data entry and possible writings / Journals (Company adjustments) made. For the correct data displaying, you should select the “T_ADJ / Aggregate” or “TOTC4 / Consolidate” as elements of the Custom4 / Nature;
• For foreign Companies, you can display the conversion of their data in EURO, by selecting “<Parent Currency>” (or “EUR”) Value or “<Parent Curr Total>” (or “EUR Total”) Value crossed with different Custom4 / Natures. For example, “<Parent Currency>” Value crossed with the specific Custom4 / Nature for the input (” [None]” code) displays the data entry in EURO. Likewise, changing the intersection with the other elements of Custom4 / Natures, you can still see the effect of writings / Journals in EURO by selecting specific Custom4 / Nature for Company adjustments (with “CA” code contained in the “CompAdjs” hierarchy), or the total amount (data entry +/- Company adjustments) by selecting the “T_ADJ / Aggregate” or “TOTC4 / Consolidate” elements of Custom 4 / Nature.
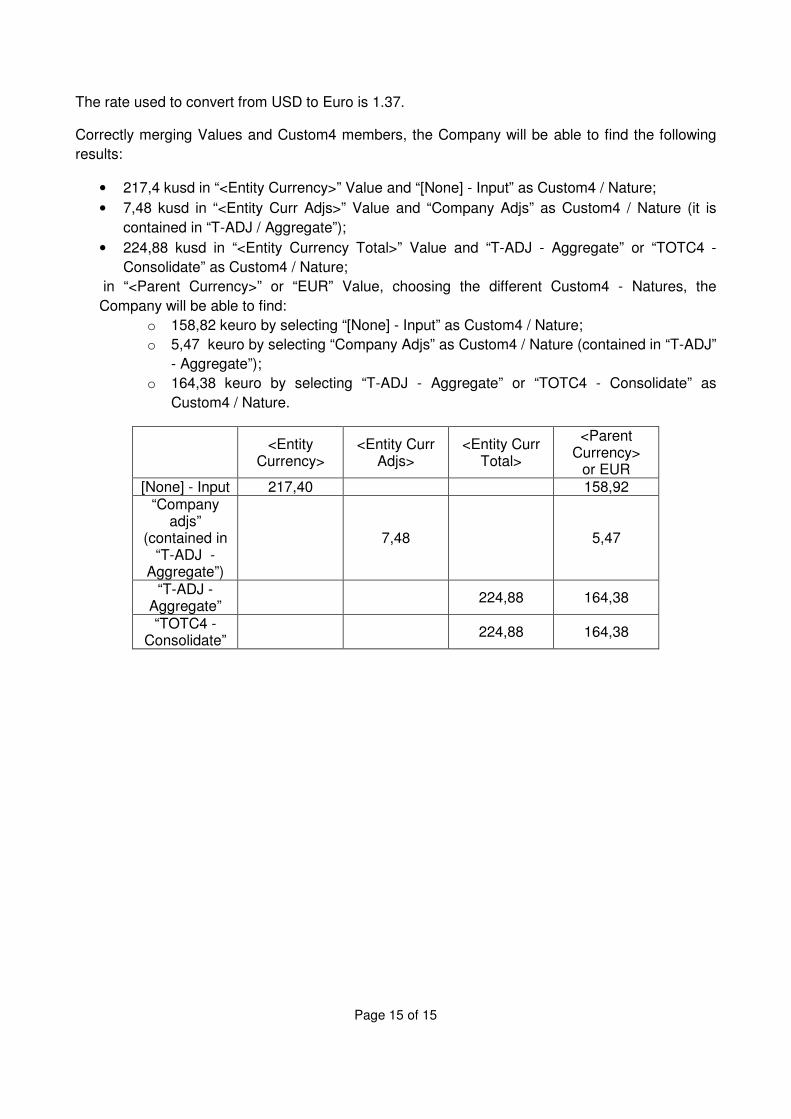
We can see a numeric example: the Entity U.S. “018 - CAPP - CAPP USA” enters on system
217.40 KUSD of Rents. Then it writes a Journal (Company adjustment) to increase this cost for
7.478 KUSD.
Page 15 of 15
The rate used to convert from USD to Euro is 1.37.
Correctly merging Values and Custom4 members, the Company will be able to find the following
results:
• 217,4 kusd in “<Entity Currency>” Value and “[None] - Input” as Custom4 / Nature;
• 7,48 kusd in “<Entity Curr Adjs>” Value and “Company Adjs” as Custom4 / Nature (it is
contained in “T-ADJ / Aggregate”);
• 224,88 kusd in “<Entity Currency Total>” Value and “T-ADJ - Aggregate” or “TOTC4 -
Consolidate” as Custom4 / Nature;
in “<Parent Currency>” or “EUR” Value, choosing the different Custom4 - Natures, the
Company will be able to find:
o 158,82 keuro by selecting “[None] - Input” as Custom4 / Nature;
o 5,47 keuro by selecting “Company Adjs” as Custom4 / Nature (contained in “T-ADJ”
- Aggregate”);
o 164,38 keuro by selecting “T-ADJ - Aggregate” or “TOTC4 - Consolidate” as
Custom4 / Nature.
<Entity
Currency> <Entity Curr
Adjs> <Entity Curr
Total>
<Parent Currency>
or EUR [None] - Input 217,40 158,92
“Company adjs”
(contained in “T-ADJ -
Aggregate”)
7,48 5,47
“T-ADJ - Aggregate”
224,88 164,38
“TOTC4 - Consolidate”
224,88 164,38