Heterogeneous Catalysis in the different Reactor Types on ...
159
Heterogeneous Catalysis in the different Reactor Types on the Examples of Ethyl Benzene to Styrene, Methane Dehydroaromatization and Propylene Carbonate/Methanol Transesterification Von der Fakultät für Mathematik, Informatik und Naturwissenschaften der Rheinisch- Westfälischen Technischen Hochschule Aachen zur Erlangung des akademischen Grades eines Doktors der Ingenieurwissenschaften genehmigte Dissertation vorgelegt von Diplom-Ingenieur Dimitri Mousko aus Novomoskovsk, Russland Referent: Universitätsprofessor Dr. rer. nat. W. F. Hölderich Korreferent: Universitätsprofessor Dr.-Ing. M. Modigell Tag der mündlichen Prüfung: 09.07.2009 Diese Dissertation ist auf den Internetseiten der Hochschulbibliothek online verfügbar.
Transcript of Heterogeneous Catalysis in the different Reactor Types on ...

Heterogeneous Catalysis in the different Reactor Types on the
Examples of Ethyl Benzene to Styrene, Methane
Dehydroaromatization and Propylene Carbonate/Methanol
Transesterification
Von der Fakultät für Mathematik, Informatik und Nat urwissenschaften der Rheinisch-
Westfälischen Technischen Hochschule Aachen zur Erlangung des akademischen
Grades eines Doktors der Ingenieurwissenschaften genehmigte Dissertation
vorgelegt von
Diplom-Ingenieur
Dimitri Mousko
aus Novomoskovsk, Russland
Referent: Universitätsprofessor Dr. rer. nat. W. F. Hölderich
Korreferent: Universitätsprofessor Dr.-Ing. M. Modigell
Tag der mündlichen Prüfung: 09.07.2009 Diese Dissertation ist auf den Internetseiten der Hochschulbibliothek online verfügbar.

This work was carried out at the chair for Technical Chemistry and Heterogeneous Catalysis
of RWTH Aachen, Germany, between January 2004 and December 2006.
I would like to acknowledge many people for helping me during my doctoral work.
Especially I wish to thank my advisor, Prof. Dr. Wolfgang Hölderich, for his generous time
and commitment. Throughout my doctoral work he encouraged me to develop independent
way of thinking and research skills. He continually stimulated my analytical thinking and
greatly assisted me with scientific writing.
I thank my second examiner Prof. Dr. Modigell for taking on the task of reviewing this thesis.
I thank my third examiner Prof. Dr. Raabe for a friendly participation on the doctoral
examination.
I thank Prof. Dr. Weinhold for taking on the task to be a chairman at the examination.
Also I thank DOW Chemicals, ENI Technology and COST Program of the European Union
for the financial support during performing this work.
This dissertation would not have been possible without the technical support of the analytic
team. Mrs. E. Biener, Mrs. H. Fickers-Boltz, Mrs. M. Naegler, Mrs. N. Mager, Mr. M.Gilliam
and Mr. Vaessen are greatly appreciated for the competent support and nice work atmosphere.
I am extremely grateful for the assistance and advices I received from Dr. John Niederer and
Dr. Michael Valkenberg.
I extend many thanks to all my colleagues and friends, who provided very nice and friendly
atmosphere and supported me with advices and actions, especially Hans Schuster, Christophe
Duquenne, Jose-Maria Menendez-Torre, Sergio Sabater, Rani Jha, Philipp Klement, Stefan
Kujath, Adrian Crossman and many other people.
Finally, I would like to thank my family. I am especially grateful to my mother who supported
and encouraged me over years. I thank my wife Elena who was constant source of support
and enthusiasm.
Of course, despite all the assistance provided by Prof. Dr. Hölderich and others, I alone
remain responsible for the content of the following, including any errors or omissions which
may unintentionally remain.

To my family

Abbreviations used:
BET – Brunauer, Emmett and Teller, surface area and pore size distribution analysis
DMC – Dimethyl Carbonate
DMS – Dimethyl Sulfate
DPC – Diphenyl Carbonate
DSC – Differential Scanning Calorimetry
DTG – Differential Thermogravimetry
EC – Ethylene Carbonate
EG – Ethylene Glycol
EO – Ethylene Oxide
GC – Gas Chromatography
GC-MS – Gas Chromatography with Mass Spectrometry analysis
GTL – Gas To Liquids
HEMC – HydroxyEthyl Methyl Carbonate
HPMC – HydroxyPropyl Methyl Carbonate
ICP-AES – Inductively Coupled Plasma Atomic Emission Spectrophotometry
MDA – Methane DehydroAromatization
MeOH – Methanol
MFV – Minimal Fluidization Velocity
PC – Propylene Carbonate
PG – Propylene Glycol
PhOH – Phenol
PO – Propylene Oxide
TGA – Thermogravimetric Analysis
TOS – Time On Stream
VHSV – Volume Hourly Space Velocity
WHSV – Weight Hourly Space Velocity
XRD – X-Ray Diffraction analysis
Figures II
Figure 1: Secondary building units and their symbols. Number in parenthesis is occurrence frequency. _________________________________________________________________ 7 Figure 2: Pore structure of zeolite Y ____________________________________________ 8 Figure 3: Pore structure of ZSM-5.zeolite: (a) basic unit; (b) linked chains; (c) three-dimensional framework; (d) channel system _______________________________________ 9 Figure 4: Zeolite market by different segments – 1999 _____________________________ 10 Figure 5: Reactant selectivity _________________________________________________ 11 Figure 6: Product selectivity __________________________________________________ 11 Figure 7: Restricted transition-state selectivity ___________________________________ 11 Figure 8: Fluidization regimes ________________________________________________ 12 Figure 9: Pressure drop over superficial gas velocity ______________________________ 13 Figure 10: Heat transfer coefficient (bed/wall) over superficial gas velocity at different regimes __________________________________________________________________ 14 Figure 11: Proved natural gas reserves at the end 2005 ____________________________ 21 Figure 12: Distribution of proved natural gas reserves at the end 2005 ________________ 21 Figure 13: Natural gas production by area at the end 2005 _________________________ 22 Figure 14: Natural gas consumption by area at the end 2005 ________________________ 22 Figure 15: Sectoral worldwide natural gas consumption in 1973 and in 2004 ___________ 24 Figure 16: Distribution of a number of published papers to the topic “methane dehydroaromatization” over the years __________________________________________ 26 Figure 17: Riser-reactor set up ________________________________________________ 44 Figure 18: Riser reactor set up picture, shown without isolation and cooling trap ________ 45 Figure 19: Liquid products distribution. 20 mol.% of EB, 600°C. _____________________ 48 Figure 20: Gaseous products distribution. 20 mol.% of EB, 600°C. ___________________ 49 Figure 21: Liquid products distribution. 40 mol.% of EB, 600°C. _____________________ 50 Figure 22: Liquid side products formation at different styrene formation levels, 600°C. ___ 50 Figure 23: Influence of the EB concentration in the feed, 0.68 s GRT and 600°C. ________ 51 Figure 24: Gas products distribution at 600 and 700°C, 0.7 s GRT, only ethane as a feed _ 52 Figure 25: Gaseous product distribution. 20 mol.% of EB, 600°C ____________________ 53 Figure 26: Gas product distribution at 0.7 and 1 s GRT. 700°C, only ethane as a feed ____ 54 Figure 27: Gas products distribution with and without water adding. 1 s GRT, 700°C. ____ 55 Figure 28: Water experiment and blank experiment. 1 s GRT, 700°C. _________________ 56 Figure 30: P&I diagram of the fluidized bed reactor system _________________________ 58 Figure 31: Fluidized bed reactor set up _________________________________________ 59 Figure 32: Aromatic formation rate. 973K, WHSV=2.0 h -1, fixed-bed reactor ___________ 61 Figure 33: Aromatic distribution. 973K, WHSV=2.0 h-1, fixed-bed reactor _____________ 61 Figure 34: Yield of the aromatic in mol.% and its distribution during 16 reaction cycles. 973K, fixed bed reactor ______________________________________________________ 62 Figure 35: X-Ray diffraction of the fresh Mo/HZSM-5 and the spent catalyst after having undergone 16 reaction cycles _________________________________________________ 62 Figure 36: TGA analysis of used catalyst. Mass loss, DSC and DTG, air, 2K/min ________ 64 Figure 37: Methane conversion in fluidized bed reactor. Three reaction cycles are shown. 973K, WHSV=1.44 h-1 _______________________________________________________ 66 Figure 38: Aromatic formation rate in mmol “C”/g*h for fluidized bed reactor. Three reaction cycles are shown. 973K, WHSV=1.44 h-1 _________________________________ 66 Figure 39: Aromatic distribution in mol.% for fluidized bed reactor. First reaction cycle is shown, 973K. ______________________________________________________________ 67 Figure 40: Aromatic distribution in fluidized bed reactor. Third reaction cycle is shown, 973K. ____________________________________________________________________ 67 Figure 41: Particles size distribution of used catalyst after 92 hours under fluidized conditions and fresh catalyst particles. __________________________________________ 70

Figures III
Figure 42: Comparison of formation rate of aromatic in fixed and fluidized bed reactors. 700°C (973 K), WHSV=1.4 h-1, VHSV=2000 mlCH4/g Cat*h __________________________ 72 Figure 43: TGA coke analysis after use in fixed and fluidized bed reactors. _____________ 73 Figure 44: Formation rate of aromatic at different WSHV levels, 700°C, VHSV in ml CH4/g cat*h ____________________________________________________________________ 76 Figure 45: Conversion of methane at different WHSV levels, 700°C, VHSV in ml CH4/g cat*h _________________________________________________________________________ 77 Figure 46: Temperatures of two mass loss processes (Peak 1 and Peak 2) and total mass loss in wt.% ___________________________________________________________________ 78 Figure 47: H/C molar ratio of the coke after reactions at different WHSV level. _________ 78 Figure 48: Total aromatic yield for the conversion of methane over Mo/HZSM-5 for reaction temperatures of 700°C, 725°C, 800°C and 850°C. ________________________________ 80 Figure 49: Coke total mass loss (secondary axe), peaks mass loss temperatures and H/C ratio of the coke (secondary axe) at different reaction temperatures. _______________________ 80 Figure 50: Total aromatic yield for the conversion of methane over Mo/HZSM-5 for reaction conditions of 3.7g CH4/g Cat*h with varying amounts of carbon dioxide added to the methane feed. Each reaction has been performed with a fresh catalytic bed ___________________ 82 Figure 51: Molar aromatic distribution of benzene for reaction conditions of 3.7 gCH4/g cat*h with varying amounts of carbon dioxide added to the methane feed. Each reaction has been performed with a fresh catalytic bed _______________________________________ 82 Figure 52: Comparison of aromatic formation rate in fluidized and fixed bed reactors, 700°C, 3 mol.% of CO2 in the feed, WHSV=1.4 h-1 ______________________________________ 83 Figure 53: Aromatic distribution during the fluidized bed experiment, 3 mol.% of CO2 ___ 84 Figure 54: Physical mixtures of Mo2C and HZSM-5, Mo/HZSM-5 results are given for comparison. Yields of aromatic in mol.% Conditions: methane WHSV=4.3 h-1, 700°C, aromatic selectivity=100%. __________________________________________________ 85 Figure 55: Flow sheet diagram of fixed bed reactor for propylene carbonate/methanol transesterification __________________________________________________________ 87 Figure 56: Fixed-bed reactor set up ____________________________________________ 87 Figure 57: Overview on MgO-CaO-SrO-BaO activity. PC conversion, selectivity to DMC, DMC yield, PG selectivity and PG yield are shown. _______________________________ 91 Figure 58: CO2-TPD analysis of MgO __________________________________________ 91 Figure 59: CO2-TPD analysis of SrO ___________________________________________ 92 Figure 60: CO2-TPD analysis of BaO __________________________________________ 92 Figure 61: CO2-TPD analysis of CaO __________________________________________ 93 Figure 62: Response surface using quadratic model _______________________________ 95 Figure 63: Response surface using cubic model ___________________________________ 95 Figure 64: GC of the reaction mixture after blank experiment (300°C, 1s reaction time). __ 98 Figure 65: Compounds found in the reaction mixture if HZSM-5 was used as catalyst. Reaction conditions: 300°C, 3s contact time. _____________________________________ 99 Figure 66: DMC yield at different contact times, 300°C ___________________________ 101 Figure 67: DMC selectivity at different contact times, 300°C _______________________ 101 Figure 68: DMC yield at different contact times, 330°C ___________________________ 103 Figure 69: DMC selectivity at different contact times, 330°C _______________________ 102 Figure 70: PC conversion at different contact times, 330°C ________________________ 102 Figure 71: PC conversion at different temperatures, 0.15 s contact time ______________ 104 Figure 72: DMC selectivity at different temperatures, 0.15 s contact time _____________ 104 Figure 73: DMC yield at different temperatures, 0.15 s contact time _________________ 105 Figure 74: PC conversion, 0.3 s contact time, 330°C______________________________ 108 Figure 75: DMC selectivity, 0.3 s contact time, 330°C ____________________________ 109
Figures IV
Figure 76: PC conversion and DMC selectivity as a function of Si/Al ratio, 0.3 s contact time, 330°C. Average values after 120 min reaction time are given. ______________________ 110 Figure 77: PC conversion, 0.3 s contact time, 330°C______________________________ 111 Figure 78: DMC selectivity, 0.3 s contact time, 330°C ____________________________ 111 Figure 79: PC conversion, 0.3 s contact time, 330°C______________________________ 112 Figure 80: DMC selectivity, 0.3 s contact time, 330°C ____________________________ 113 Figure 81: DMC yield, 0.3 s contact time, 330°C_________________________________ 113 Figure 82: PC conversion, 0.3 s contact time, 330°C______________________________ 115 Figure 83: DMC selectivity, 0.3 s contact time, 330°C ____________________________ 115 Figure 84: PC conversion, 0.3 s contact time, 330°C______________________________ 117 Figure 85: DMC selectivity, 0.3 s contact time, 330°C ____________________________ 117 Figure 86: PC conversion, 0.3 s contact time, 330°C______________________________ 119 Figure 87: DMC selectivity, 0.3 s contact time, 330°C ____________________________ 119 Figure 88: DMC selectivity, 0.3 s contact time, 330°C ____________________________ 121 Figure 89: DMC selectivity, 0.3 s contact time, 330°C ____________________________ 121 Figure 90: DMC selectivity, 0.3 s contact time, 330°C ____________________________ 122 Figure 91: Side products formation at 0.25 and 0.31 s contact time. __________________ 123 Figure 92: Process flow and instrumentation diagram of the MDA fixed bed reactor system ________________________________________________________________________ 131 Figure 93: P&I diagram of fixed bed reactor for propylene carbonate/methanol transesterification _________________________________________________________ 132 Figure 94: Fixed-bed reactor set up for DMC production __________________________ 133 Figure 95: Process flow and instrumentation diagram of the fluidized bed reactor system 135 Figure 96: An example of detected MFV and ideal curve __________________________ 135 Figure 97: Fluidized bed reactor set up.________________________________________ 136 Figure 98: Riser reactor set up _______________________________________________ 138 Figure 99: Riser reactor set up picture, shown without insulation and cooling trap ______ 139
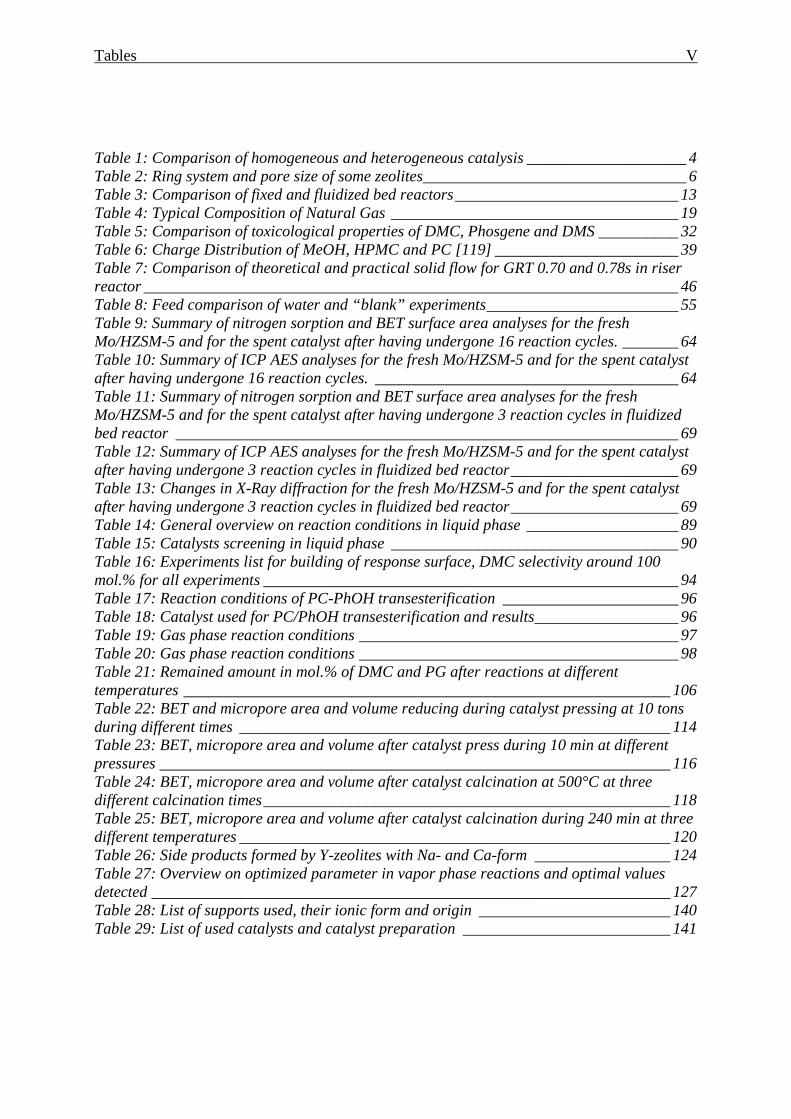
Tables V
Table 1: Comparison of homogeneous and heterogeneous catalysis ____________________ 4 Table 2: Ring system and pore size of some zeolites_________________________________ 6 Table 3: Comparison of fixed and fluidized bed reactors ____________________________ 13 Table 4: Typical Composition of Natural Gas ____________________________________ 19 Table 5: Comparison of toxicological properties of DMC, Phosgene and DMS __________ 32 Table 6: Charge Distribution of MeOH, HPMC and PC [119] _______________________ 39 Table 7: Comparison of theoretical and practical solid flow for GRT 0.70 and 0.78s in riser reactor ___________________________________________________________________ 46 Table 8: Feed comparison of water and “blank” experiments ________________________ 55 Table 9: Summary of nitrogen sorption and BET surface area analyses for the fresh Mo/HZSM-5 and for the spent catalyst after having undergone 16 reaction cycles. _______ 64 Table 10: Summary of ICP AES analyses for the fresh Mo/HZSM-5 and for the spent catalyst after having undergone 16 reaction cycles. ______________________________________ 64 Table 11: Summary of nitrogen sorption and BET surface area analyses for the fresh Mo/HZSM-5 and for the spent catalyst after having undergone 3 reaction cycles in fluidized bed reactor _______________________________________________________________ 69 Table 12: Summary of ICP AES analyses for the fresh Mo/HZSM-5 and for the spent catalyst after having undergone 3 reaction cycles in fluidized bed reactor _____________________ 69 Table 13: Changes in X-Ray diffraction for the fresh Mo/HZSM-5 and for the spent catalyst after having undergone 3 reaction cycles in fluidized bed reactor _____________________ 69 Table 14: General overview on reaction conditions in liquid phase ___________________ 89 Table 15: Catalysts screening in liquid phase ____________________________________ 90 Table 16: Experiments list for building of response surface, DMC selectivity around 100 mol.% for all experiments ____________________________________________________ 94 Table 17: Reaction conditions of PC-PhOH transesterification ______________________ 96 Table 18: Catalyst used for PC/PhOH transesterification and results __________________ 96 Table 19: Gas phase reaction conditions ________________________________________ 97 Table 20: Gas phase reaction conditions ________________________________________ 98 Table 21: Remained amount in mol.% of DMC and PG after reactions at different temperatures _____________________________________________________________ 106 Table 22: BET and micropore area and volume reducing during catalyst pressing at 10 tons during different times ______________________________________________________ 114 Table 23: BET, micropore area and volume after catalyst press during 10 min at different pressures ________________________________________________________________ 116 Table 24: BET, micropore area and volume after catalyst calcination at 500°C at three different calcination times ___________________________________________________ 118 Table 25: BET, micropore area and volume after catalyst calcination during 240 min at three different temperatures ______________________________________________________ 120 Table 26: Side products formed by Y-zeolites with Na- and Ca-form _________________ 124 Table 27: Overview on optimized parameter in vapor phase reactions and optimal values detected _________________________________________________________________ 127 Table 28: List of supports used, their ionic form and origin ________________________ 140 Table 29: List of used catalysts and catalyst preparation __________________________ 141
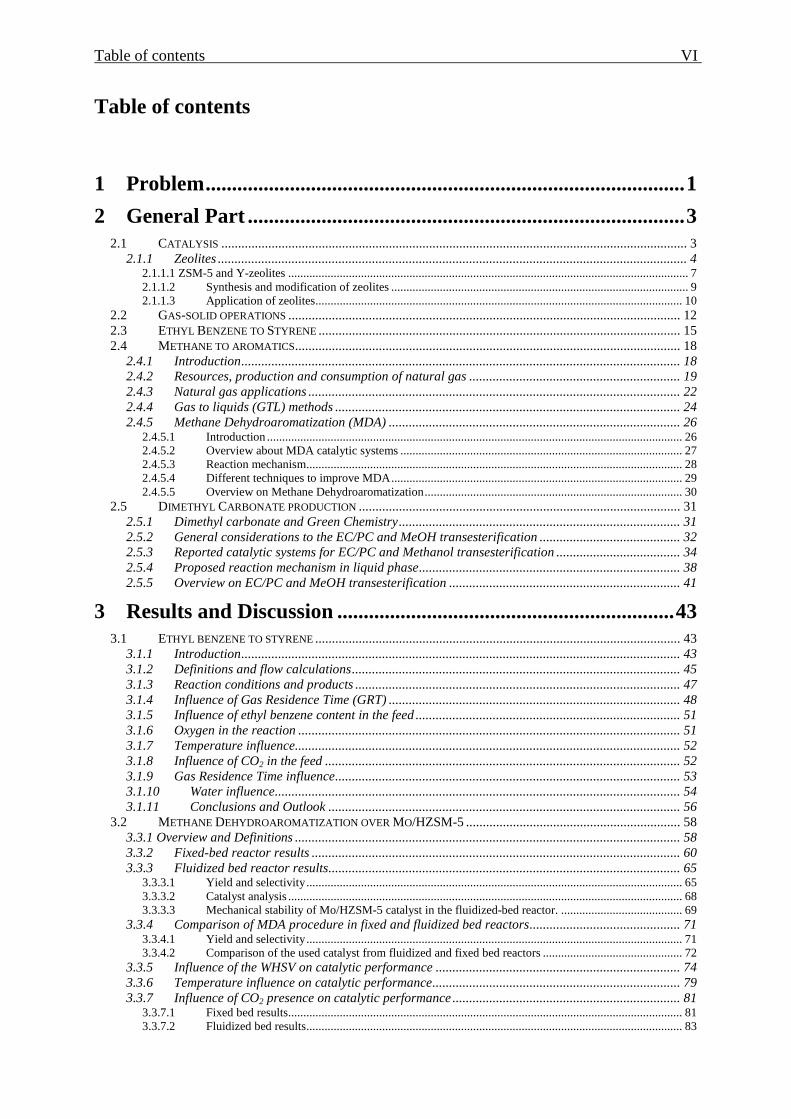
Table of contents VI
Table of contents
1 Problem ........................................................................................... 1
2 General Part ................................................................................... 3
2.1 CATALYSIS ........................................................................................................................................... 3 2.1.1 Zeolites ............................................................................................................................................ 4
2.1.1.1 ZSM-5 and Y-zeolites .................................................................................................................................... 7 2.1.1.2 Synthesis and modification of zeolites .................................................................................................. 9 2.1.1.3 Application of zeolites ......................................................................................................................... 10
2.2 GAS-SOLID OPERATIONS ..................................................................................................................... 12 2.3 ETHYL BENZENE TO STYRENE ............................................................................................................ 15 2.4 METHANE TO AROMATICS ................................................................................................................... 18
2.4.1 Introduction ................................................................................................................................... 18 2.4.2 Resources, production and consumption of natural gas ............................................................... 19 2.4.3 Natural gas applications ............................................................................................................... 22 2.4.4 Gas to liquids (GTL) methods ....................................................................................................... 24 2.4.5 Methane Dehydroaromatization (MDA) ....................................................................................... 26
2.4.5.1 Introduction ......................................................................................................................................... 26 2.4.5.2 Overview about MDA catalytic systems ............................................................................................. 27 2.4.5.3 Reaction mechanism ............................................................................................................................ 28 2.4.5.4 Different techniques to improve MDA ................................................................................................ 29 2.4.5.5 Overview on Methane Dehydroaromatization ..................................................................................... 30
2.5 DIMETHYL CARBONATE PRODUCTION ................................................................................................ 31 2.5.1 Dimethyl carbonate and Green Chemistry .................................................................................... 31 2.5.2 General considerations to the EC/PC and MeOH transesterification .......................................... 32 2.5.3 Reported catalytic systems for EC/PC and Methanol transesterification ..................................... 34 2.5.4 Proposed reaction mechanism in liquid phase .............................................................................. 38 2.5.5 Overview on EC/PC and MeOH transesterification ..................................................................... 41
3 Results and Discussion ................................................................ 43
3.1 ETHYL BENZENE TO STYRENE ............................................................................................................. 43 3.1.1 Introduction ................................................................................................................................... 43 3.1.2 Definitions and flow calculations .................................................................................................. 45 3.1.3 Reaction conditions and products ................................................................................................. 47 3.1.4 Influence of Gas Residence Time (GRT) ....................................................................................... 48 3.1.5 Influence of ethyl benzene content in the feed ............................................................................... 51 3.1.6 Oxygen in the reaction .................................................................................................................. 51 3.1.7 Temperature influence................................................................................................................... 52 3.1.8 Influence of CO2 in the feed .......................................................................................................... 52 3.1.9 Gas Residence Time influence ....................................................................................................... 53 3.1.10 Water influence ......................................................................................................................... 54 3.1.11 Conclusions and Outlook ......................................................................................................... 56
3.2 METHANE DEHYDROAROMATIZATION OVER MO/HZSM-5 ................................................................ 58 3.3.1 Overview and Definitions ................................................................................................................... 58 3.3.2 Fixed-bed reactor results .............................................................................................................. 60 3.3.3 Fluidized bed reactor results ......................................................................................................... 65
3.3.3.1 Yield and selectivity ............................................................................................................................ 65 3.3.3.2 Catalyst analysis .................................................................................................................................. 68 3.3.3.3 Mechanical stability of Mo/HZSM-5 catalyst in the fluidized-bed reactor. ........................................ 69
3.3.4 Comparison of MDA procedure in fixed and fluidized bed reactors ............................................. 71 3.3.4.1 Yield and selectivity ............................................................................................................................ 71 3.3.4.2 Comparison of the used catalyst from fluidized and fixed bed reactors .............................................. 72
3.3.5 Influence of the WHSV on catalytic performance ......................................................................... 74 3.3.6 Temperature influence on catalytic performance .......................................................................... 79 3.3.7 Influence of CO2 presence on catalytic performance .................................................................... 81
3.3.7.1 Fixed bed results .................................................................................................................................. 81 3.3.7.2 Fluidized bed results ............................................................................................................................ 83
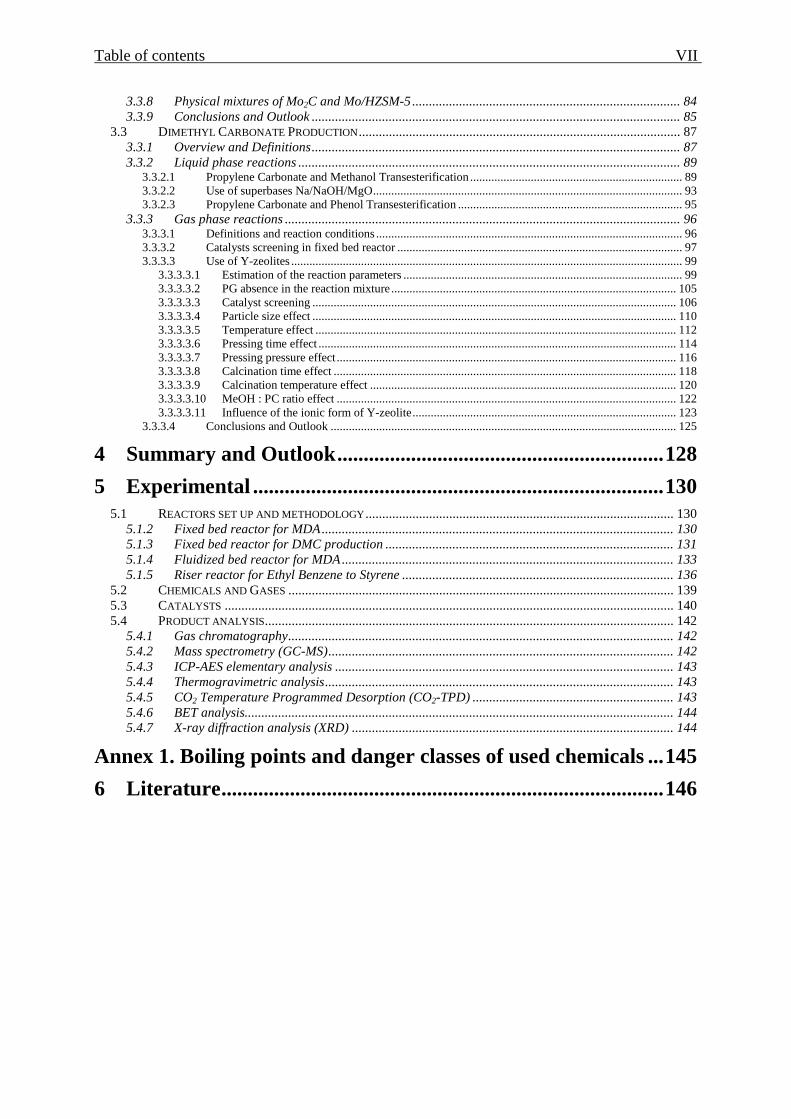
Table of contents VII
3.3.8 Physical mixtures of Mo2C and Mo/HZSM-5 ................................................................................ 84 3.3.9 Conclusions and Outlook .............................................................................................................. 85
3.3 DIMETHYL CARBONATE PRODUCTION ................................................................................................ 87 3.3.1 Overview and Definitions .............................................................................................................. 87 3.3.2 Liquid phase reactions .................................................................................................................. 89
3.3.2.1 Propylene Carbonate and Methanol Transesterification ...................................................................... 89 3.3.2.2 Use of superbases Na/NaOH/MgO ...................................................................................................... 93 3.3.2.3 Propylene Carbonate and Phenol Transesterification .......................................................................... 95
3.3.3 Gas phase reactions ...................................................................................................................... 96 3.3.3.1 Definitions and reaction conditions ..................................................................................................... 96 3.3.3.2 Catalysts screening in fixed bed reactor .............................................................................................. 97 3.3.3.3 Use of Y-zeolites ................................................................................................................................. 99
3.3.3.3.1 Estimation of the reaction parameters ............................................................................................ 99 3.3.3.3.2 PG absence in the reaction mixture .............................................................................................. 105 3.3.3.3.3 Catalyst screening ........................................................................................................................ 106 3.3.3.3.4 Particle size effect ........................................................................................................................ 110 3.3.3.3.5 Temperature effect ....................................................................................................................... 112 3.3.3.3.6 Pressing time effect ...................................................................................................................... 114 3.3.3.3.7 Pressing pressure effect ................................................................................................................ 116 3.3.3.3.8 Calcination time effect ................................................................................................................. 118 3.3.3.3.9 Calcination temperature effect ..................................................................................................... 120 3.3.3.3.10 MeOH : PC ratio effect ................................................................................................................ 122 3.3.3.3.11 Influence of the ionic form of Y-zeolite ....................................................................................... 123
3.3.3.4 Conclusions and Outlook .................................................................................................................. 125
4 Summary and Outlook .............................................................. 128
5 Experimental .............................................................................. 130
5.1 REACTORS SET UP AND METHODOLOGY ............................................................................................ 130 5.1.2 Fixed bed reactor for MDA ......................................................................................................... 130 5.1.3 Fixed bed reactor for DMC production ...................................................................................... 131 5.1.4 Fluidized bed reactor for MDA ................................................................................................... 133 5.1.5 Riser reactor for Ethyl Benzene to Styrene ................................................................................. 136
5.2 CHEMICALS AND GASES ................................................................................................................... 139 5.3 CATALYSTS ...................................................................................................................................... 140 5.4 PRODUCT ANALYSIS .......................................................................................................................... 142
5.4.1 Gas chromatography ................................................................................................................... 142 5.4.2 Mass spectrometry (GC-MS) ....................................................................................................... 142 5.4.3 ICP-AES elementary analysis ..................................................................................................... 143 5.4.4 Thermogravimetric analysis ........................................................................................................ 143 5.4.5 CO2 Temperature Programmed Desorption (CO2-TPD) ............................................................ 143 5.4.6 BET analysis................................................................................................................................ 144 5.4.7 X-ray diffraction analysis (XRD) ................................................................................................ 144
Annex 1. Boiling points and danger classes of used chemicals ... 145
6 Literature .................................................................................... 146
Problem 1
1 Problem
Within the framework of the United Nations Conference on Environment and Development,
held in Rio de Janeiro in 1992 and ten years later in 2002 in the „Johannesburg Declaration on
Sustainable Development“ it was agreed that the protection of the environment as well as
social and economic development are fundamental to sustainable development [1]. Among
other things it was decided to minimize the environmentally harmful effect of the chemical
industry.
The problem of sustainable development was recognized by the scientific society and a
concept of “green chemistry” was born. Green chemistry is a chemical philosophy
encouraging the design of products and processes that reduce or eliminate the use and
generation of hazardous substances.
Paul Anastas, and John C. Warner developed 12 principles of green chemistry [2], which help
to explain what the definition means in practice. The principles cover such concepts as:
• the design of processes to maximize the amount of raw material that ends up in the
product;
• the use of safe, environmentally benign solvents where ever possible;
• the design of energy efficient processes;
• the best form of waste disposal, aiming not to create it in the first place.
Attempts are being made not only to quantify the greenness of a chemical process but also to
evaluate it in other variables such as chemical yield, the price of reaction components, safety
in handling chemicals, hardware demands, energy profile and ease of product workup and
purification. In one quantitative study [3], the reduction of nitrobenzene to aniline receives 64
points out of 100 marking it as an acceptable synthesis overall whereas a synthesis of an
amide using HMDS (Hexamethyldisilizane) is only described as adequate with combined 32
points.
Technical progress and environment-aware policies set a variety of challenges that make
“green solutions” economically attractive. The development of new green processes is
unthinkable without use of new effective catalytic systems, primarily heterogeneous.

Problem 2
One of the objectives of this work is to find the way to produce the “green” reagent, dimethyl
carbonate (DMC), through transesterification of propylene carbonate (PC) and methanol in
the vapor phase. The reaction conditions and the catalyst preparation procedure have to be
optimized. The importance of DMC for the development of variety of green syntheses is
widely described, e.g. [4, 5, 6, 7, 8, 9, 10, 11, 12].
Another environmental problem should be considered in this work. During crude oil
production considerable amount of associated gas is coming out. Due to the difficulties of its
use – primary because of the transportation problem – it is just burning out on the wells. This
leads to the enormous loss of the energy. The share of flared gas in total gas output varies
among main oil-producing regions and nations. According to various estimates around 10-13
bcf (approx. 0.28-0.37 billion m3) of associated gas is flared daily in the world [13]. With the
growing share of natural gas in global energy consumption and moreover the growing
environmental problems, there is increasingly higher interest in associated gas utilization
issues. One of the approaches to utilize the associated gas is the direct conversion of methane
to the liquid hydrocarbons like benzene and toluene. Molybdenum loaded HZSM-5 was
suggested as a suitable catalyst for this reaction. In this work investigations of Mo/HZSM-5
catalyst for the heterogeneous dehydroaromatization of methane have to be done. Comparison
of fixed and fluidized bed reactors as well as influence of different factors has to be
investigated and optimal conditions for performing of the reaction have to be found.
Furthermore some problems of a new route to styrene production as developed by DOW Co.
have to be investigated. During the operation of a plant some questions of the reaction
performing appeared. It concerns e.g. source of the oxygen in the reaction and its dependence
from the gas residence times and temperature. Also the influence of the ethane and water
presence in the feed on the catalyst activity has to be investigated. The reactions have to be
performed heterogeneously in a riser reactor.
Different types of reactors for heterogeneous catalysis have to be applied in this work – fixed
and fluidized bed rectors as well as a riser reactor (which is a modification of the fluidized
bed reactor).
General Part - Catalysis 3
2 General Part
2.1 Catalysis
Catalysis is the acceleration (increase in reaction rate) of a chemical reaction by means of a
substance, called catalyst, which is itself not consumed by the overall reaction. A catalyst
decreases the activation energy of a chemical reaction. Catalysts participate in reactions but
are neither reactants nor products of the reaction they catalyze. An exception is the process of
autocatalysis where the product of a reaction helps to accelerate the same reaction. They work
by providing an alternative pathway for the reaction to occur, thus reducing the activation
energy and increasing the reaction rate.
The phrase “catalysis” was coined by Jöns Jakob Berzelius in 1835 who was the first to note
that certain chemicals speed up a reaction. Other early chemists involved in catalysis were
Alexander Mitscherlich who in 1831 referred to contact processes and Johann Wolfgang
Döbereiner who spoke of contact action and whose lighter based on hydrogen and a platinum
sponge became a huge commercial success in the 1820’s.
There are many theories about how catalysis works. They can be divided in three big groups:
geometric, electronic and chemical theories. Geometric theories concentrate on the
coordination between geometrical configuration of atoms of the catalyst’s active sites and
atoms of reactants. Electronic theories say that chemisorption is conditioned by electronic
interaction concerned to the charge transfer. Chemical theories consider catalyst as a chemical
substance, which forms chemical bonds with reactants in form of transition complex with its
following release and forming of reaction products and the catalyst returns in its previous
state. This last theory is considered now as most adequate.
Catalysts can be either heterogeneous or homogeneous. Biocatalysts are often seen as a
separate group. Heterogeneous catalysts are present in different phases from the reactants,
whereas homogeneous catalysts are in the same phase.
Table 1 gives an overview on advantages and disadvantages of each kind of catalysis.
Conditioned by this differences special reactor types are used for each type of catalysis. The
most usual reactors for homogeneous reactions are continuous or batch tank and tubular
reactors with intensive stirring. For heterogeneous reactions most suitable reactor types are
fixed and fluidized bed reactors (see also Chapter 2.2).

General Part - Catalysis 4
Table 1: Comparison of homogeneous and heterogeneous catalysis
Catalysis
Homogeneous Heterogeneous
Selectivity often better different
Activity very high only active sites
Service time - often much higher
Thermostability low much high
Reaction conditions mild (50 – 200°C) hard (> 250°C)
Diffusion problems almost not present present
Reproducibility easy often difficult
Understanding of reaction
mechanism easy often difficult
Catalysts deactivation often strong often slow
Catalysts separation difficult and costly easy
Catalysts preparation difficult and often costly often easy and cheap
2.1.1 Zeolites
Zeolites are crystalline aluminosilicate minerals that have a micro-porous structure. The term
was originally coined in the 18th century by a Swedish mineralogist named Axel Fredrik
Cronstedt who observed, upon rapidly heating a natural mineral that the stones began to dance
about as the water evaporated [14]. Using the Greek words, which mean "stone that boils", he
called this material zeolite.
More than 150 zeolite types have been synthesized and 48 naturally occurring zeolites are
known. Natural zeolites are formed where volcanic rocks and ash layers react with alkaline
groundwater. Zeolites also crystallized in post-depositional environments over periods
ranging from thousands to millions of years in shallow marine basins. Naturally occurring
zeolites are rarely pure and are contaminated with varying degrees by other minerals, metals,
quartz or other zeolites. For this reason, naturally occurring zeolites are excluded from many
important commercial applications where uniformity and purity are essential.
Synthetic zeolites hold some key advantages over their natural analogue. The synthetics can,
of course, be manufactured in a uniform, phase-pure state. It is also possible to manufacture
desirable zeolite structures, which do not appear in nature. Zeolite A is a well-known
example. Since the principal raw materials used to manufacture zeolites are silica and
alumina, which are among the most abundant mineral components on earth, the potential to
General Part - Catalysis 5
supply zeolites is virtually unlimited. Finally, zeolite manufacturing processes engineered by
man require significantly less time than the 50 to 50,000 years prescribed by nature.
Disadvantages include the inability to create crystals with dimensions of a comparable size to
their natural counterparts.
Zeolites are three-dimensional, crystalline compounds, which are built from AlO4 and SiO4
tetrahedra, each oxygen of which is shared between two tetrahedrons. The net negative charge
on the tectosilicate framework is balanced by the incorporation of cations (interchannel
cations) in approx. 2 to 10 Å cages or channels. This feature can also be observed in feldspar
and feldspathoid minerals. But in contrast to this feldspar and feldspathoid minerals the
zeolite aluminosilicate framework contain open cavities and open channels (i.e. they have
lower densities) through which ions can be either extracted or introduced.
Their compositions are represented by the structural Formula 1:
Mx/n (xAlO2 · ySiO2) · zH2O (1)
Where M represents exchangeable interchannel cation (e.g. Na+, K+, Ca2+, Ba2+, Sr2+, Mg2+,
Fe2+ or NH4+) and n is the charge on this cation, z is the number of moles of interchannel
molecular water, and x and y are the stoichiometric coefficients for AlO2 and SiO2 in
tetrahedral sites, respectively. The quantity x/n represents the stoichiometry of the
interchannel cations, necessary for maintaining charge balance in the tectosilicate lattices of
zeolites. An additional feature, which differentiated the zeolites still further from the feldspar
and feldspathoid minerals, is the presence of water molecules within the structural channels.
These are relatively loosely bound to the framework and cations, and like the cations they can
be removed and replaced without disrupting framework bonds (DEER et al. 1992).
There are many classifications and nomenclatures for the zeolites have been suggested.
However, as stated by Nickel & Mandarino (1987): “It is probably not desirable to formulate
rigid rules to define whether or not a compositional or crystallographic difference is
sufficiently large to require a new mineral name, and each new mineral proposal must be
considered on its own merits”. So every kind of rules for nomenclature of zeolite minerals
should be viewed as guidelines rather than as being rigidly prescriptive.
Currently, three basic classification schemes are used widely for zeolite structures. Two of
these are based upon specifically defined aspects of crystal structure, whereas the third has a

General Part - Catalysis 6
more historical basis, placing zeolites with similar properties (e.g. morphology) into the same
group (ARMBRUSTER & GUNTER 2001). The first structural classification of zeolites is
based on the framework topology, with distinct framework receiving a three-letter code
(MEIER et al. 1996). The second structural method for the classification of zeolites is based
on a concept termed “secondary building units” (SBU). The primary building unit for zeolites
is the tetrahedron and the SBUs are the geometric arrangements of tetrahedra (BRECK 1974,
ARMBRUSTER & GUNTER 2001), see Figure 1 [15]. Quite often, these SBUs tend to
control the morphology of the zeolites. The third broad classification scheme is similar to the
SBU classification of BRECK (1974), except that it includes some historical context of how
the zeolites were discovered and named. This scheme uses a combination of zeolite group
names which have specific SBUs and is the widely used by geologists.
Furthermore, widely used is follow pore containing materials classification based on the pores
size (d): microporous (d < 20 Å), mesoporous (20 Å < d <500 Å) and macroporous (500 Å <
d) materials. According to this classification zeolites have mostly microporous and
mesoporous character, see Table 2.
Table 2 represents some zeolites, their ring system and pores size.
Table 2: Ring system and pore size of some zeolites
Zeolite Ringsystem Pore size in Å Pores size
classification
Zeolite A 8-Ring 4.1 Microporous
ZSM-5 10-Ring 5.4 x 5.6 and 5.1 x 5.5 Microporous
Mordenite 12-Ring 6.7 x 7.0 Microporous
Faujasite, zeolite X, Y 12-Ring 7.4 Microporous
Beta 12-Ring 5.5 x 5.5 and 7.6 x 6.4 Microporous
MCM 41, MCM 48 - 16 to 100 Mesoporous
General Part - Catalysis 7
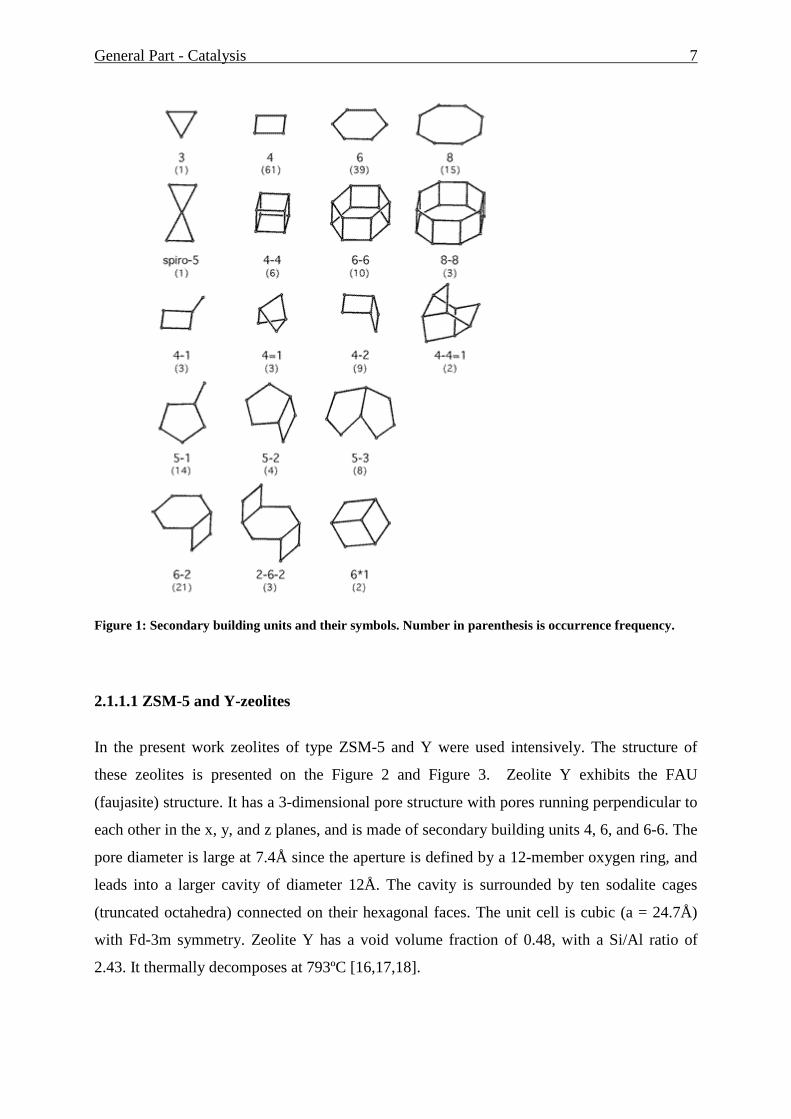
Figure 1: Secondary building units and their symbols. Number in parenthesis is occurrence frequency.
2.1.1.1 ZSM-5 and Y-zeolites
In the present work zeolites of type ZSM-5 and Y were used intensively. The structure of
these zeolites is presented on the Figure 2 and Figure 3. Zeolite Y exhibits the FAU
(faujasite) structure. It has a 3-dimensional pore structure with pores running perpendicular to
each other in the x, y, and z planes, and is made of secondary building units 4, 6, and 6-6. The
pore diameter is large at 7.4Å since the aperture is defined by a 12-member oxygen ring, and
leads into a larger cavity of diameter 12Å. The cavity is surrounded by ten sodalite cages
(truncated octahedra) connected on their hexagonal faces. The unit cell is cubic (a = 24.7Å)
with Fd-3m symmetry. Zeolite Y has a void volume fraction of 0.48, with a Si/Al ratio of
2.43. It thermally decomposes at 793ºC [16,17,18].

General Part - Catalysis 8
Zeolite Y, like zeolite A, is synthesized in a gelling process. Sources of alumina (sodium
aluminate) and silica (sodium silicate) are mixed in alkaline (NaOH) aqueous solution to give
a gel. The gel is then usually heated to 70-300ºC to crystallize the zeolite. The zeolite is
present in Na+ form and must be converted to acid form. To prevent disintegration of the
structure from acid attack, it is first converted to the NH4+ form before being converted to
acidic form. If a hydrogenation metal such as platinum is needed, it is deposited via
impregnation or ion exchange [18].
The most important use of zeolite Y is as a cracking catalyst. It is used in the acidic form in
petroleum refinery catalytic cracking units to increase the yield of gasoline and diesel fuel
from crude oil feedstock by cracking heavy paraffin into gasoline grade naphtha. Zeolite Y
has displaced zeolite X in this use because it is both more active and more stable at high
temperatures due to the higher Si/Al ratio. It is also used in the hydrocracking units as a
platinum/palladium support to increase aromatic content of reformulated refinery products
[18, 19, 20].
Figure 2: Pore structure of zeolite Y
ZSM-5 has MFI structure. It has two types of pores, both formed by 10-membered oxygen
rings. The first of these pores is straight and elliptical in cross section, the second pores
intersect the straight pores at right angles, in a zigzag pattern and are circular in cross section
– see Figure 3 (d). This unique two-dimensional pore structure allows a molecule to move
from one point in the catalyst to anywhere else in the particle. The large openings are the
elliptical, straight pores in ZSM-5.
The ZSM-5 zeolite catalyst is used in the industry for many reactions (at least 31 correspond
to the [20]). It’s most famous application is MTG- and MTO-processes as well as
isomerization, hydrocracking and aromatization reactions [20].

General Part - Catalysis 9
Figure 3: Pore structure of ZSM-5.zeolite: (a) basic unit; (b) linked chains; (c) three-dimensional framework; (d) channel system
2.1.1.2 Synthesis and modification of zeolites
There are several types of synthetic zeolites which are formed by a process of slow
crystallization of a silica-alumina gel in the presence of alkalis and organic templates. One of
the important process to carry out zeolite synthesis is sol-gel processing. The product
properties depend on reaction mixture composition, pH of the system, operating temperature,
pre-reaction 'seeding' time, reaction time as well as templates used, such as organic amines
and organic quaternary ammonium salts. In sol-gel process, other elements (metals, metal
oxides) can be easily incorporated. The silicalite sol formed by the hydrothermal method is
very stable. Also the ease of scaling up this process makes it a favorite route for zeolite
synthesis.
After synthesis zeolites can be modified by different methods, too. Most common are ionic
exchange, impregnation, treating by acids, steaming, heating up, deformation and passivation
of surface.
The strength and number of acidic sites of zeolite are tunable. The more Al is incorporated in
the SiO4 lattice the more acid sites will be present in zeolite. On the other hand the increased
number of acidic sites leads to the decreasing of their strength. Therefore Si/Al ratio is a
compromise between number and strength of acid sites. Another method is an isomorphous
substitution, which is the exchange of central atoms of tetrahedral lattice (Si and Al) by other
elements, which have the charge of two, three, four or five. E.g. Al can be substituted by Be,
Co, B, Fe, Ga, Cr, Ti; Si by Ge, P.

General Part - Catalysis 10
2.1.1.3 Application of zeolites
The zeolite market showing the different market segments is presented in the Figure 4 [21].
As can be seen, the catalytic application of zeolites is only a small segment of about 8%, but
zeolite catalysts contribute 55% to the market on a cash base. The products obtained by using
these catalysts have a value, which is several magnitudes higher than that of the catalysts
themselves, thus making them extremely important for many processes.
Natural zeolites are mainly used in building construction (cements) or in paper industry
(fillers for paper). Other applications of these materials are as cat litter, sewage water
treatment and in agriculture or animal nutrition.
Figure 4: Zeolite market by different segments – 1999
Around 90% of processes in the chemical industry use catalysts and around 80% of them are
heterogeneously catalyzed. The growth in catalyst sales is increasing at between 5% and 10%
per year. More than 40% of all industrial processes are catalyzed by zeolites [20]. Approx. 74
different zeolites are used nowadays for the industrial processes [20]. The world largest
catalytic process is FCC process (Fluid Catalytic Cracking), which uses modified Y-zeolite
[19, 20].
Catalysis is not the largest market segment of zeolites but it is the most valuable one. Zeolites
are very efficient and selective catalysts for various reactions, especially in the petrochemical
industry. The selectivity of zeolites is due to the limited pore sizes, which only allow specific
molecules either to enter the pores (reactant selectivity – Figure 5) or to leave the pores

General Part - Catalysis 11
(product selectivity – Figure 6) depending on their size. Furthermore, not every transition
state during a reaction might be possible, thus, forcing a reaction only into one direction
(restricted transition-state selectivity – Figure 7).
Figure 5: Reactant selectivity
Figure 6: Product selectivity
Figure 7: Restricted transition-state selectivity
General Part – Gas-solid Operations 12
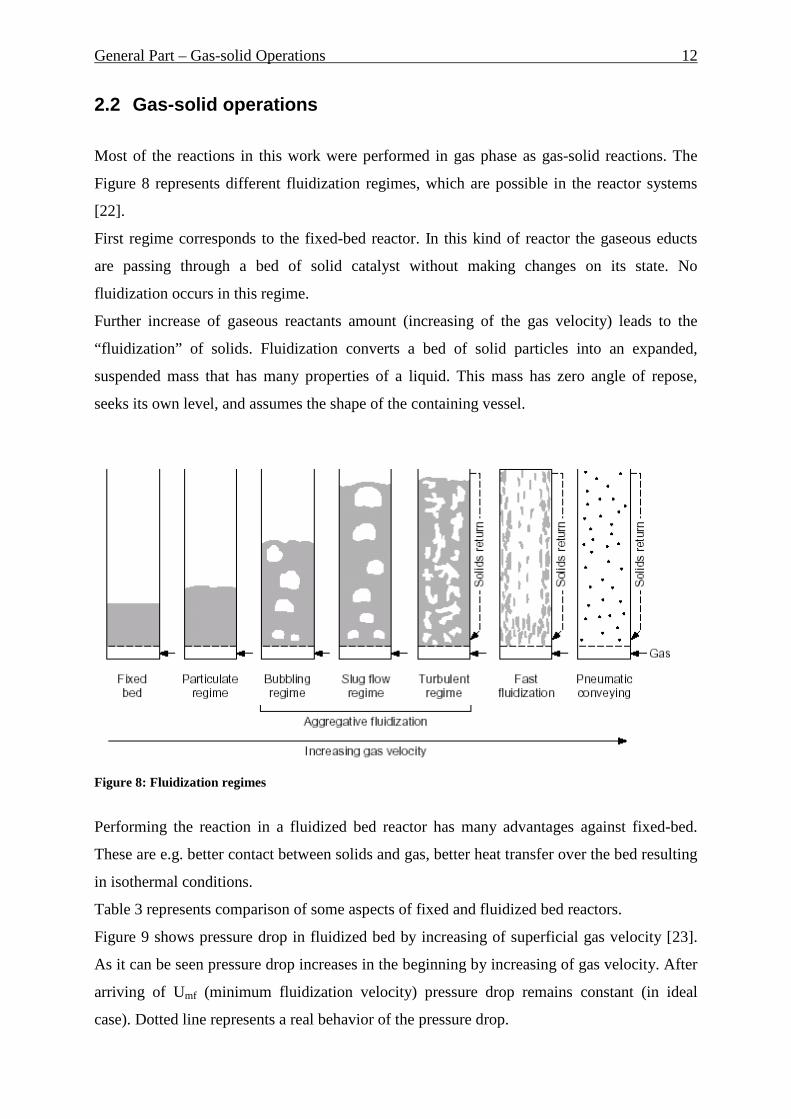
2.2 Gas-solid operations
Most of the reactions in this work were performed in gas phase as gas-solid reactions. The
Figure 8 represents different fluidization regimes, which are possible in the reactor systems
[22].
First regime corresponds to the fixed-bed reactor. In this kind of reactor the gaseous educts
are passing through a bed of solid catalyst without making changes on its state. No
fluidization occurs in this regime.
Further increase of gaseous reactants amount (increasing of the gas velocity) leads to the
“fluidization” of solids. Fluidization converts a bed of solid particles into an expanded,
suspended mass that has many properties of a liquid. This mass has zero angle of repose,
seeks its own level, and assumes the shape of the containing vessel.
Figure 8: Fluidization regimes
Performing the reaction in a fluidized bed reactor has many advantages against fixed-bed.
These are e.g. better contact between solids and gas, better heat transfer over the bed resulting
in isothermal conditions.
Table 3 represents comparison of some aspects of fixed and fluidized bed reactors.
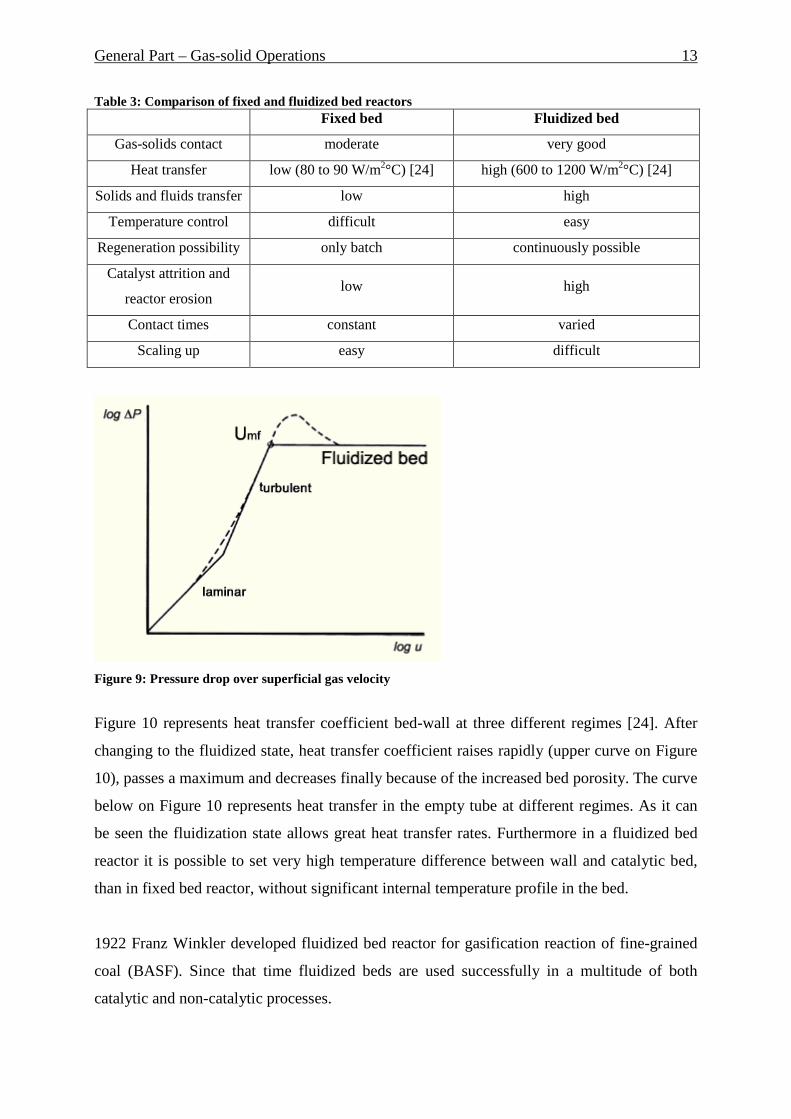
Figure 9 shows pressure drop in fluidized bed by increasing of superficial gas velocity [23].
As it can be seen pressure drop increases in the beginning by increasing of gas velocity. After
arriving of Umf (minimum fluidization velocity) pressure drop remains constant (in ideal
case). Dotted line represents a real behavior of the pressure drop.
General Part – Gas-solid Operations 13
Table 3: Comparison of fixed and fluidized bed reactors Fixed bed Fluidized bed
Gas-solids contact moderate very good
Heat transfer low (80 to 90 W/m2°C) [24] high (600 to 1200 W/m2°C) [24]
Solids and fluids transfer low high
Temperature control difficult easy
Regeneration possibility only batch continuously possible
Catalyst attrition and
reactor erosion low high
Contact times constant varied
Scaling up easy difficult
Figure 9: Pressure drop over superficial gas velocity
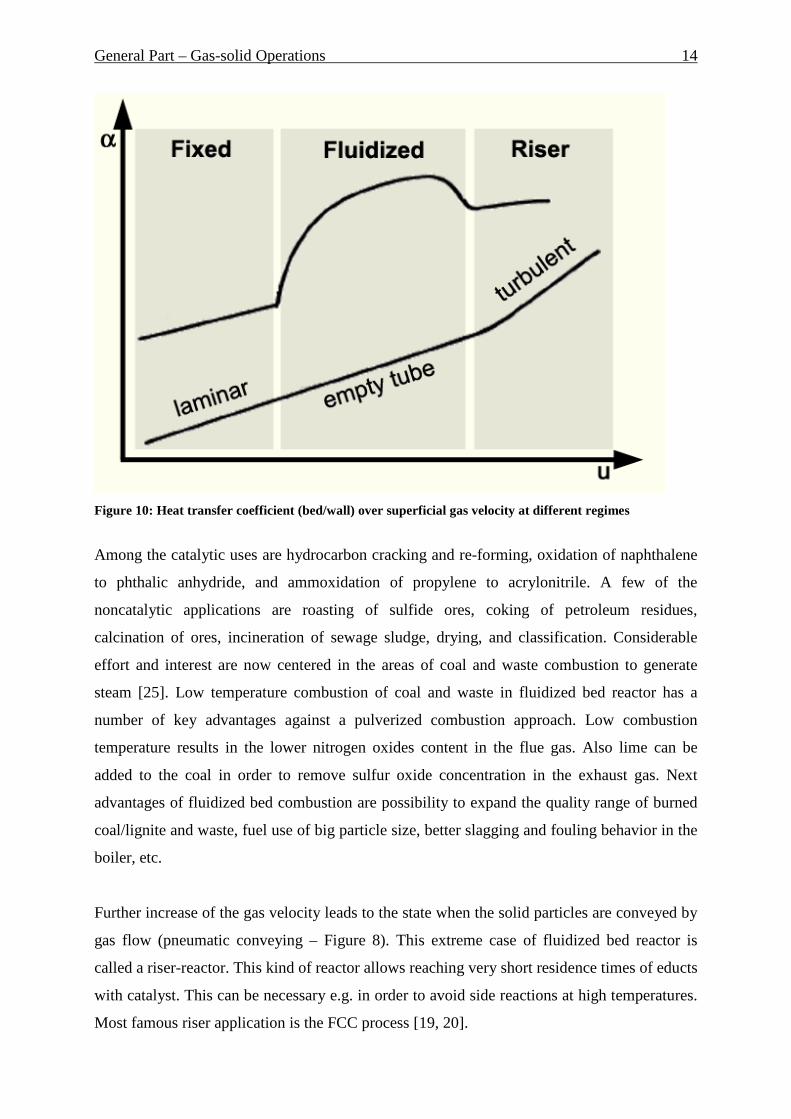
Figure 10 represents heat transfer coefficient bed-wall at three different regimes [24]. After
changing to the fluidized state, heat transfer coefficient raises rapidly (upper curve on Figure
10), passes a maximum and decreases finally because of the increased bed porosity. The curve
below on Figure 10 represents heat transfer in the empty tube at different regimes. As it can
be seen the fluidization state allows great heat transfer rates. Furthermore in a fluidized bed
reactor it is possible to set very high temperature difference between wall and catalytic bed,
than in fixed bed reactor, without significant internal temperature profile in the bed.
1922 Franz Winkler developed fluidized bed reactor for gasification reaction of fine-grained
coal (BASF). Since that time fluidized beds are used successfully in a multitude of both
catalytic and non-catalytic processes.
General Part – Gas-solid Operations 14
Figure 10: Heat transfer coefficient (bed/wall) over superficial gas velocity at different regimes
Among the catalytic uses are hydrocarbon cracking and re-forming, oxidation of naphthalene
to phthalic anhydride, and ammoxidation of propylene to acrylonitrile. A few of the
noncatalytic applications are roasting of sulfide ores, coking of petroleum residues,
calcination of ores, incineration of sewage sludge, drying, and classification. Considerable
effort and interest are now centered in the areas of coal and waste combustion to generate
steam [25]. Low temperature combustion of coal and waste in fluidized bed reactor has a
number of key advantages against a pulverized combustion approach. Low combustion
temperature results in the lower nitrogen oxides content in the flue gas. Also lime can be
added to the coal in order to remove sulfur oxide concentration in the exhaust gas. Next
advantages of fluidized bed combustion are possibility to expand the quality range of burned
coal/lignite and waste, fuel use of big particle size, better slagging and fouling behavior in the
boiler, etc.
Further increase of the gas velocity leads to the state when the solid particles are conveyed by
gas flow (pneumatic conveying – Figure 8). This extreme case of fluidized bed reactor is
called a riser-reactor. This kind of reactor allows reaching very short residence times of educts
with catalyst. This can be necessary e.g. in order to avoid side reactions at high temperatures.
Most famous riser application is the FCC process [19, 20].

General Part – Ethyl Benzene to Styrene 15
2.3 Ethyl Benzene to Styrene
In 1996, world production capacity for styrene was near 19.2 million metric tons per year.
Dow Chemical is the world's largest producer with a total capacity of 1.8 million metric tons
in the USA, Canada, and Europe [26].
Styrene is used as a monomer to make plastics such as polystyrene (nearly 65% of all
styrene), Acrylonitrile Butadiene Styrene (ABS), Expandable Polystyrene (EPS), Unsaturated
Polyesters (UPE), Styrene Acrylonitrile (SAN), Methacrylate Butadiene Styrene (MBS),
Styrene Butadiene Rubber (SBR), Styrene Isobutadiene (SB Copolymers). These materials
are used in rubber, plastic, insulation, fiberglass, pipes, automobile parts, food containers,
carpet backing etc.
Many different techniques have been investigated to manufacture styrene. The following
methods have been used or seriously considered for commercial production:
(1) dehydrogenation of ethylbenzene;
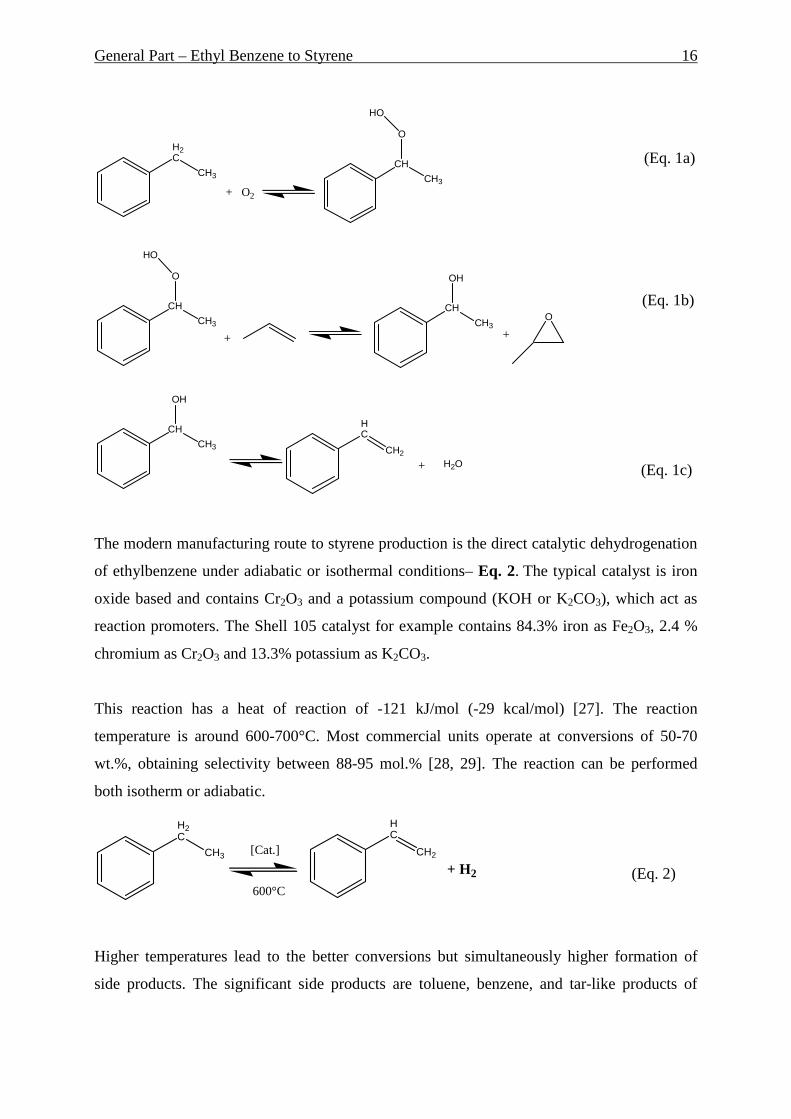
(2) oxidation of ethylbenzene to ethylbenzene hydroperoxide, which reacts with
propylene to give a-phenylethanol and propylene oxide, after which the alcohol is
dehydrated to styrene (known as POSM process for Propylene Oxide / Styrene
Monomer), see Eq. 1(a,b,c);
(3) oxidative conversion of ethylbenzene to a-phenylethanol via acetophenone and
subsequent dehydratation of the alcohol;
(4) side-chain chlorination of ethylbenzene followed by dehydrochlorination, see Eq.1;
(5) side-chain chlorination of ethylbenzene, hydrolysis to the corresponding alcohols,
followed by dehydration;
(6) extraction of styrene from pyrolysis-mixture.
The first two methods are the only commercially utilized routes to styrene: dehydrogenation
of ethylbenzene accounts for over 90% of the total world production. Methods 4 and 5,
involving chlorine, have generally suffered from the high cost of the raw materials and from
the chlorinated contaminants in the monomer. Manufacture of styrene directly from petroleum
streams (method 6) is depending on the capacity of pyrolysis plants and is very costly and
difficult.
General Part – Ethyl Benzene to Styrene 16
(Eq. 1a)
(Eq. 1b)
(Eq. 1c)
The modern manufacturing route to styrene production is the direct catalytic dehydrogenation
of ethylbenzene under adiabatic or isothermal conditions– Eq. 2. The typical catalyst is iron
oxide based and contains Cr2O3 and a potassium compound (KOH or K2CO3), which act as
reaction promoters. The Shell 105 catalyst for example contains 84.3% iron as Fe2O3, 2.4 %
chromium as Cr2O3 and 13.3% potassium as K2CO3.
This reaction has a heat of reaction of -121 kJ/mol (-29 kcal/mol) [27]. The reaction
temperature is around 600-700°C. Most commercial units operate at conversions of 50-70
wt.%, obtaining selectivity between 88-95 mol.% [28, 29]. The reaction can be performed
both isotherm or adiabatic.
(Eq. 2)
Higher temperatures lead to the better conversions but simultaneously higher formation of
side products. The significant side products are toluene, benzene, and tar-like products of
H2C
CH3
CH
CH3
O
HO
+ O2
H2C
CH3
HC
CH2
+ H2
[Cat.]
600°C
CH
CH3
O
HO
+
CH
CH3
OH
+
O
CH
CH3
OH
+
HC
CH2
H2O

General Part – Ethyl Benzene to Styrene 17
styrene polymerization. In order to avoid formation of side products the following operations
can be applied [29]:
- performing the reaction at lower pressure (0.1-0.5 bar),
- dilution of reaction mixture by water steam,
- fast cooling of reaction mixture.
Typically, 2.5-3 kg steam is required for each kilogram of ethylbenzene to ensure sufficiently
high temperatures throughout the reactor. Steam has several roles in this reaction. It is the
source of heat for powering the endothermic reaction and it continuously removes coke that
tends to form on the iron oxide catalyst through the water/gas shift reaction shown in Eq.3.
C + 2H2O � CO2 + 2H2 (3)
The potassium promoter on the catalyst is present to enhance this decoking reaction. The
steam injected with the reactor feed also dilutes the concentration of the reactant and products
in the reaction mixture, shifting the position of chemical equilibrium towards products. The
separation of styrene from the remaining ethylbenzene requires tall distillation towers and
high reflux ratios, because styrene and ethylbenzene have similar boiling points (145°C for
styrene, 136°C for ethylbenzene). Distillation and separation of the crude styrene into product
styrene is also complicated by the fact that the temperatures involved in the distillation of
styrene initiate the polymerization of the styrene. To prevent this, early styrene plants added
elemental sulfur to inhibit the rate of polymerization. During the 1970's additive chemicals
consisting of phenol based retarders were developed. The more recently developed free
radical inhibitor chemicals are now added prior to distillation. These additives limit the rate of
polymerization and allow the separation and purification of the product styrene.
Also many other lab scale routes for styrene production are possible, but that technical
realization seems to be difficult due to the polished and refined ethyl benzene
dehydrogenation route, described before. Examples of alternative routes are oxyalcylation of
benzene by ethane and oxygen, methylation of toluene, co-processing of ethyl benzene and
nitrobenzene to styrene and aniline, butadiene cyclodehydrogenation etc. [29, 30]. A typical
laboratory synthesis of styrene entails the decarboxylation of cinnamic acid.
This work investigates an alternative process where ethane and ethyl benzene react to styrene,
ethene and hydrogen over a catalyst consisting of Ga2O3/Pt/K2O/SiO2 on alumina [31].
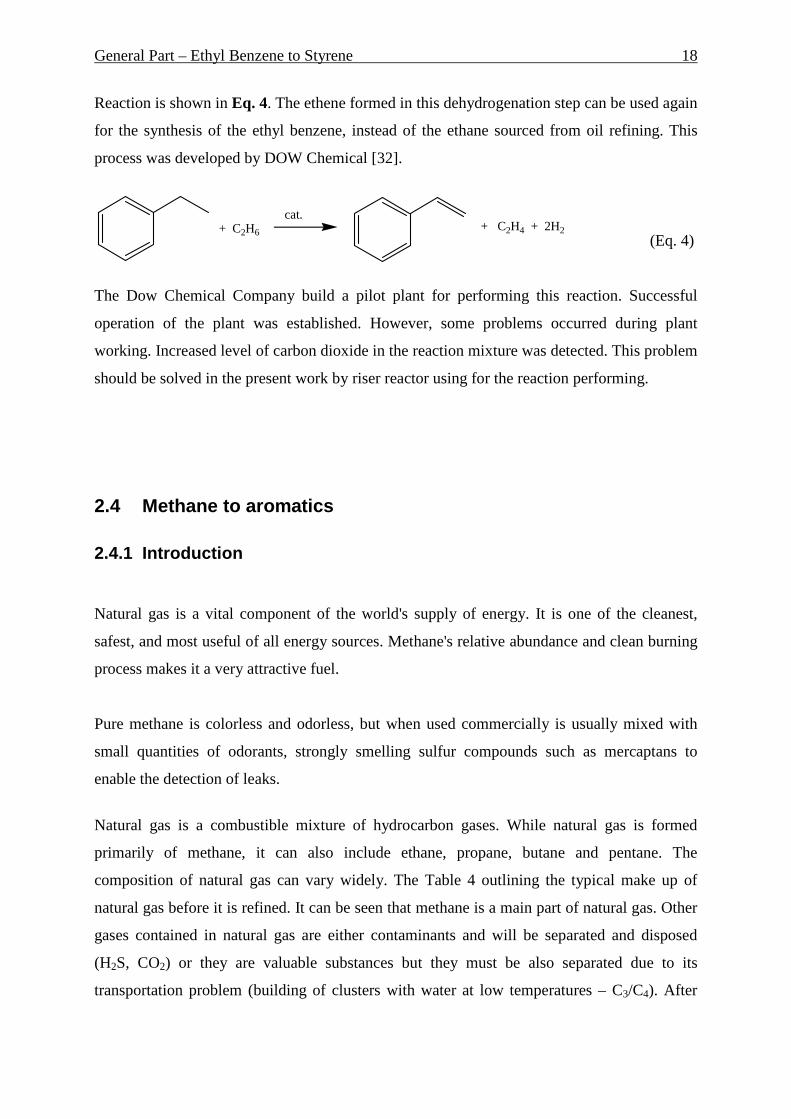
General Part – Ethyl Benzene to Styrene 18
Reaction is shown in Eq. 4. The ethene formed in this dehydrogenation step can be used again
for the synthesis of the ethyl benzene, instead of the ethane sourced from oil refining. This
process was developed by DOW Chemical [32].
(Eq. 4)
The Dow Chemical Company build a pilot plant for performing this reaction. Successful
operation of the plant was established. However, some problems occurred during plant
working. Increased level of carbon dioxide in the reaction mixture was detected. This problem
should be solved in the present work by riser reactor using for the reaction performing.
2.4 Methane to aromatics
2.4.1 Introduction
Natural gas is a vital component of the world's supply of energy. It is one of the cleanest,
safest, and most useful of all energy sources. Methane's relative abundance and clean burning
process makes it a very attractive fuel.
Pure methane is colorless and odorless, but when used commercially is usually mixed with
small quantities of odorants, strongly smelling sulfur compounds such as mercaptans to
enable the detection of leaks.
Natural gas is a combustible mixture of hydrocarbon gases. While natural gas is formed
primarily of methane, it can also include ethane, propane, butane and pentane. The
composition of natural gas can vary widely. The Table 4 outlining the typical make up of
natural gas before it is refined. It can be seen that methane is a main part of natural gas. Other
gases contained in natural gas are either contaminants and will be separated and disposed
(H2S, CO2) or they are valuable substances but they must be also separated due to its
transportation problem (building of clusters with water at low temperatures – C3/C4). After
+ C2H6
cat.+ C2H4 + 2H2

General Part – Methane to Aromatics 19
transporting of the gas almost only methane is present in it and very often “methane” is used
as a synonym for “natural gas”.
Natural gas is considered “dry” when it is almost pure methane and/or ethane (C1-C2), having
had most of the other commonly associated hydrocarbons removed. When other hydrocarbons
are present (mostly C3-C4 fraction), the natural gas is “wet”. Also natural gas can be ”sweet”
or “sour” depends on the hydrogen sulfide/carbon dioxide content.
Methane is a greenhouse gas with a global warming potential of 23 over 100 years [33], i.e.
when averaged over 100 years each kg of CH4 warms the earth 23 times as much as the same
mass of CO2.
Because natural gas is a “gas” and not a liquid or solid, it is difficult to transport from the
areas that produce it to the areas that consume it. Natural gas pipelines are economical, but are
impractical across oceans. Converting methane to compounds which are more easily
transported, such as CNG (Compressed Natural Gas)/LNG (Liquefied Natural Gas) or liquid
hydrocarbons is an active area of research.
Table 4: Typical Composition of Natural Gas Name Formula Content
Methane CH4 70-90%
Ethane C2H6
0-20% Propane C3H8
Butane C4H10
Carbon Dioxide CO2 0-8%
Oxygen O2 0-0.2%
Nitrogen N2 0-5%
Hydrogen sulfide H2S 0-5%
Rare gases A, He, Ne, Xe trace
2.4.2 Resources, production and consumption of natu ral gas
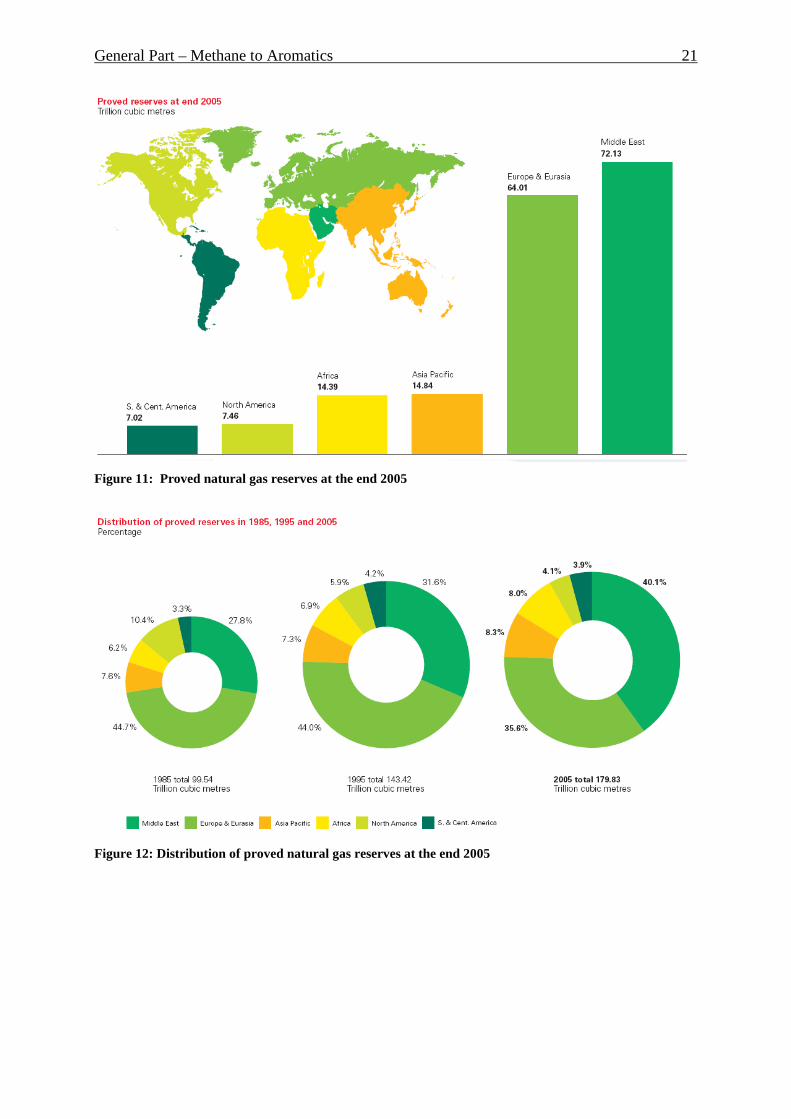
The resources of natural gas are distributed erratically over our planet. Figure 11 [34]
represents proved natural gas reserves at the end of 2003. As it can be seen, Middle East with

General Part – Methane to Aromatics 20
71 trillion cubic meters has the biggest reserves. Following Europe and Eurasia have 62
trillion m3. Asia and Pacific region as well as Africa have around 13 trillion m3 of gas. And
North and South America have 7 trillion m3 of gas respectively. Figure 12 represents relative
distribution of the reserves in percent and increase of the proved resources during last 20
years. From year 1985 world natural gas reserves grew up from around 99 up to 180 trillion
m3. Because of the relative cheap crude oil in the past no intensive investigations of new
natural gas deposits were done. The growing crude oil prices in the recent time and its limited
reserves will make natural gas as well as a coal the main energy source in the foreseeable
future. Some authors propose that the oil production peak is already arrived and by the end of
the first decade of the 21st Century production will have commenced its inevitable long-term
decline from resource constraints [35].
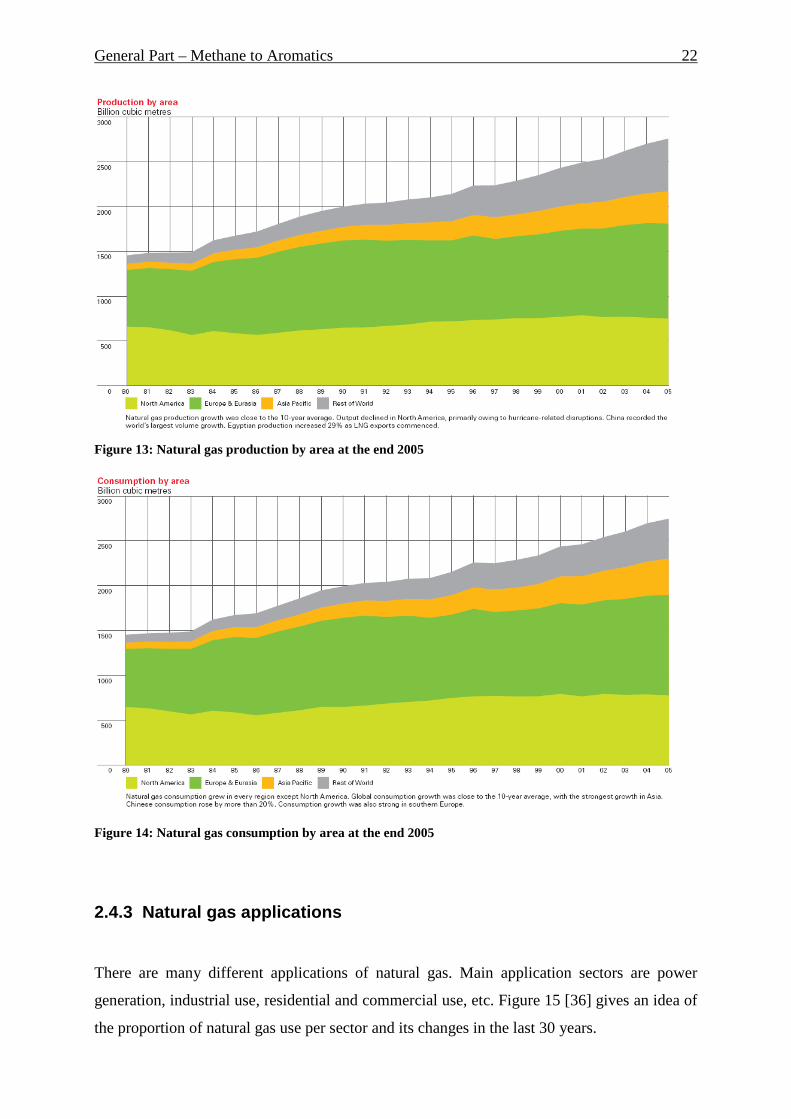
Natural gas world production is shown on the Figure 13 [34]. It is clearly to see its growing
tendency. Especially South and Central America showed the strongest increase of gas
production.
The consumption of the natural gas in North America and Europe was relative stable over last
decades as shown on Figure 14 [34]. The intensive economical grow in the recent time of the
Asian region as well as of the “rest of the world” is embodied in the increased gas
consumption (this grow can be seen more clearly on the oil consumption, but the tendency is
clear).
General Part – Methane to Aromatics 21
Figure 11: Proved natural gas reserves at the end 2005
Figure 12: Distribution of proved natural gas reserves at the end 2005
General Part – Methane to Aromatics 22
Figure 13: Natural gas production by area at the end 2005
Figure 14: Natural gas consumption by area at the end 2005
2.4.3 Natural gas applications
There are many different applications of natural gas. Main application sectors are power
generation, industrial use, residential and commercial use, etc. Figure 15 [36] gives an idea of
the proportion of natural gas use per sector and its changes in the last 30 years.

General Part – Methane to Aromatics 23
Industrial use includes a variety of applications like power generation, heating and cooling
processes, waste treatment and incineration, metals preheating (particularly for iron and steel),
drying and dehumidification, glass melting, food processing, and fueling industrial boilers.
Natural gas may also be used as a feedstock for the manufacturing of a number of chemicals
and products. Gases such as butane, ethane, and propane may be extracted from natural gas to
be used as a feedstock for such products as fertilizers and pharmaceutical products.
In addition to these uses, there are a number of innovative and industry specific uses of
natural gas. Natural gas desiccant systems, which are used for dehumidification, are
increasingly popular in the plastics, pharmaceutical, candy, and even recycling industries. In
each of these industries, moisture filled air can lead to damage of the end product during its
manufacture.
Natural gas absorption systems are also being used extensively in industry to heat and cool
water in an efficient, economical, and environmentally sound way. These industrial
absorption systems are very similar to those used in commercial settings.
Other sectors comprise agricultural commercial and public service, residential and non-
specific use. Here should be mentioned many applications of natural gas for heating, cooling
and cooking in households, public and private enterprises.
Transportation: According to the Natural Gas Vehicle Coalition, there are currently more
than 2.5 million Natural Gas Vehicles (NGVs) on the road worldwide. Natural gas vehicles
are much cleaner burning than traditionally fueled vehicles. NGVs as they exist today are best
suited for large fleets of vehicles that drive many miles a day. Taxicabs, transit and school
buses, airport shuttles, construction vehicles, garbage trucks, delivery vehicles, and public
works vehicles are all well suited to natural gas fueling. Because these vehicles are centrally
maintained and fueled, it is economical and beneficial to convert to natural gas.
Natural gas vehicles have suffered in the past from limited driving range and limited storage
space, due to the volume of the CNG that must be carried on-board. However, research is
currently underway to develop a mid-sized NGV, with similar range and storage space as its
gasoline powered counterpart.

General Part – Methane to Aromatics 24
Figure 15: Sectoral worldwide natural gas consumption in 1973 and in 2004
2.4.4 Gas to liquids (GTL) methods
Due to the difficulties of transport, storage and use of the gaseous methane a lot of
investigations were devoted its conversion to the liquid hydrocarbons. These methods can be
divided into the direct and indirect methods.
Indirect Methods that use conversion of methane to carbon monoxide and hydrogen
(syngas). This can be realized through three reactions: steaming reforming, dry reforming and
partial oxidation. To date, the only large-scale process for natural gas conversion is steam
reforming, see Eq. 5.
The first description of a process for the conversion of hydrocarbons with steam was
published in 1868 using CaO as a medium, resulting in the formation of CaCO3 and hydrogen
[37]. In 1890 Mond and Langer improved the process by using a nickel catalyst [38], and it
was subsequently used, in combination with Fischer-Tropsch technology (s. Eq. 6), by
Germany in World War II and South Africa during the Apartheid era for the synthesis of
chemicals such as fuels and alcohols. The process is highly endothermic and current industrial
catalysts are usually based on nickel [39].

General Part – Methane to Aromatics 25
Syngas is used for consequently followed synthesis of methanol - see Eq. 7. Methanol can be
used for production of variety of valuable products: methyl t-butyl ether, dimethyl ether,
gasoline, ethylene etc.
Another way of syngas use is mentioned above Fischer-Tropsch synthesis - see Eq. 6.
Different hydrocarbons can be produced over this route depend on the reaction conditions.
224 3HCOOHCH +→+ (Eq. 5)
OnHHCHnnCO nn 2222)12( +→++ + (Eq. 6)
OHCHHCO 322 →+ (Eq. 7)
GTL Direct Methods comprise follow possibilities:
- Oxidative coupling of methane to ethylene (OCM);
- Direct oxidation of methane, forming methanol and formaldehyde;
- Non-oxidative direct conversion of methane to aromatics.
Oxidative coupling of methane started in the early 1980s and quickly bloomed from the mid-
1980s to the mid-1990s [40]. However, no catalysts could reach a C2+ yield higher than 25%
and selectivity to C2+ higher than 80%, which are the main criteria for industrial application of
the OCM, and the research passion on the topic was gradually weakened.
Continuous direct oxidation of methane to methanol [41, 42] or formaldehyde [43] can be
performed with maximum of yields around 8% and 4%, respectively. A batch process giving
methanol yield more than 50% was recently described but it still has crucial drawbacks due to
the need for a mercury catalyst and the consumption of sulfuric acid, leading to sulfur dioxide
which then needs to be converted back to sulfuric acid [44].
Non-oxidative direct conversion of methane to aromatics was observed first time in 1993 [45]
and is very promising way to produce aromatics and hydrogen. Industrial use of this route is
hindered by low yields and short catalyst service time. This topic will be discussed very
intensive in the next chapter.
General Part – Methane to Aromatics 26
So, each alternative has its own set of limitations and extensive utilization of methane for the
production of fuels and chemicals appears to be near, but current economic uncertainties limit
the amount of research activity and the implementation of emerging technologies.
2.4.5 Methane Dehydroaromatization (MDA)
2.4.5.1 Introduction
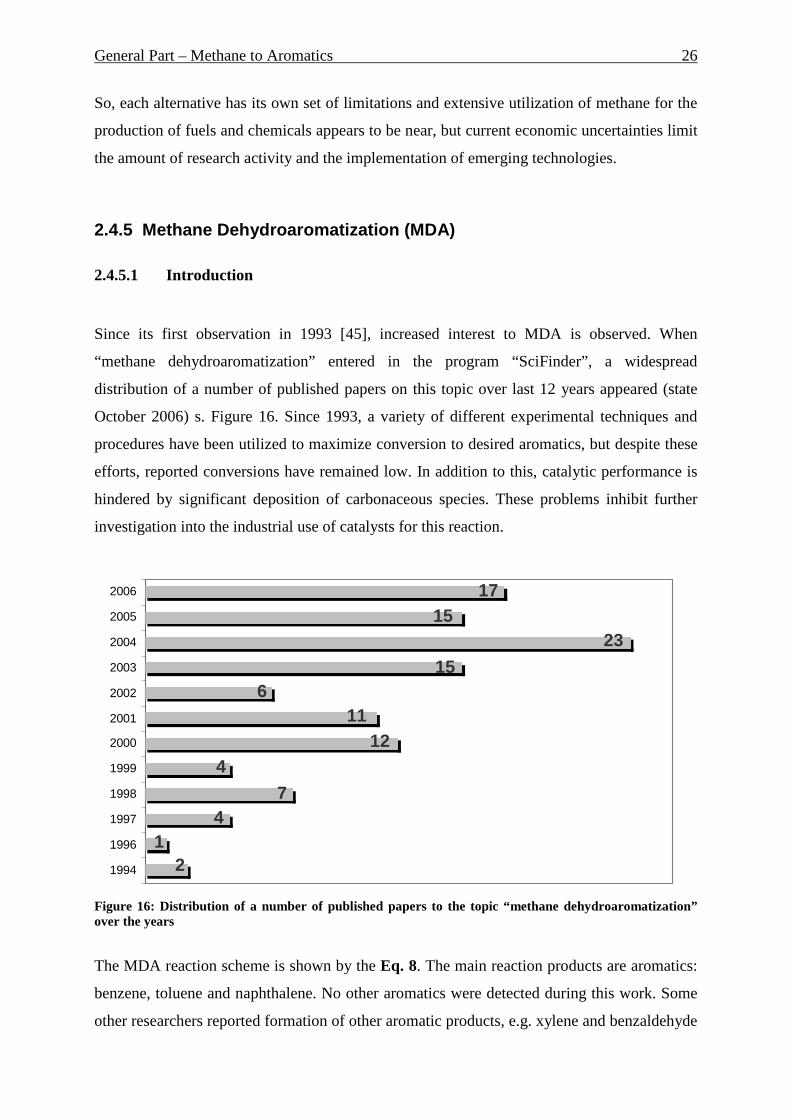
Since its first observation in 1993 [45], increased interest to MDA is observed. When
“methane dehydroaromatization” entered in the program “SciFinder”, a widespread
distribution of a number of published papers on this topic over last 12 years appeared (state
October 2006) s. Figure 16. Since 1993, a variety of different experimental techniques and
procedures have been utilized to maximize conversion to desired aromatics, but despite these
efforts, reported conversions have remained low. In addition to this, catalytic performance is
hindered by significant deposition of carbonaceous species. These problems inhibit further
investigation into the industrial use of catalysts for this reaction.
23
6
74
12
412
11
15
1517
0 5 10 15 20 25
2006
2005
2004
2003
2002
2001
2000
1999
1998
1997
1996
1994
Figure 16: Distribution of a number of published papers to the topic “methane dehydroaromatization” over the years
The MDA reaction scheme is shown by the Eq. 8. The main reaction products are aromatics:
benzene, toluene and naphthalene. No other aromatics were detected during this work. Some
other researchers reported formation of other aromatic products, e.g. xylene and benzaldehyde
General Part – Methane to Aromatics 27
[46, 47, 48]. The most desired benzene can be produced with high selectivity up to 95 mol.%.
The naphthalene follows with 5 to 50 mol.% selectivity and only few percent of the toluene
can be produced. Ethane and hydrogen are main gaseous products of this reaction. Presence of
small amounts of ethane indirectly indicates the formation of C2-species during reaction. Also
traces of ethene could be detected. Strong formation of carboneous deposits on the used
catalyst is still a big problem for the industrial application of MDA.
The aromatic formation becomes significant at temperatures over around 700°C. An increased
temperature favors the reaction rate but causes irreversible deactivation of the catalyst due to
the Mo leaching.
cokeHHCHCHCHCCH 242810107665Mo/HZSM
4 +++++ → − (Eq. 8)
2.4.5.2 Overview about MDA catalytic systems
Since its first observation in 1993 [45] with Mo/HZSM-5 much research and suggestion in
order to improve this catalytic system were done. The investigations were concerned both on
the incorporated in the HZSM-5 lattice metal and on the HZSM-5 support itself, as well on
the different pretreatment/activation techniques.
For example in [49, 50] authors describe effective use of W/HZSM-5 for MDA. Additional
incorporation of Zn (or Mn, La, Zr) improves activity and heat-resistance of catalyst.
Use of Rh/HZSM-5 for MDA was described in [51]. Only hydrogen and coke were found as
main reaction products. However, addition of Rh to 6 wt.% Mo/HZSM-5, described in [52],
improves the stability of the catalyst at longer TOS (longer than 25h), if hydrogen was used as
co-feed (6%).
Promotional effect of Cr was detected in [53]. Much better methane conversion (approx. 12%
vs. 8 %) was obtained if Cr/Mo molar ratio of 0.07 instead only Mo was used.
Addition of small amount of Ga to Mo/HZSM-5 improves catalytic performance [54]. Yield
of C2-C11 hydrocarbons increased from 7.84 to 8.96%.

General Part – Methane to Aromatics 28
Liu found remarkable increase of naphthalene and benzene formation if Co- and Fe-modified
Mo/HZSM-5 was used for MDA [55]. Optimal concentration of these metals was found.
Re/HZSM-5 can be used for MDA at lower temperatures (858K) as shown by Wang et al
[56].
In [57] authors studied addition of Pd and Ru to Mo/HZSM-5. Pd leaded to strong formation
of polyaromatic species, causing a high deactivation rate. Thereagainst Ru favored stability of
the reaction, hindering coke formation.
Conversion of methane over different transition metal ions on HZSM-5 was investigated in
[58]. It was detected that the activity decreases in the order: Mo>W>Fe>V>Cr.
Positive effect of silanation of HZSM-5 zeolite support is described in [59, 60]. This kind of
pre-treatment can improve both activity and stability of catalyst [59]. Additionally to this
selectivity to benzene can be improved greatly (over 90%) [60].
Also another zeolite types can be used for MDA. For example Mo/HMCM-22 is described as
high selective benzene formation catalyst for MDA [61] as well as HZSM-11, HZSM-8,
HMCM-41, HMCM-22, HMCM-49, H-beta, HY and H-mordenite [62, 63, 64, 65, 66, 67, 68,
69, 70].
2.4.5.3 Reaction mechanism
The exact reaction mechanism is still under debate. It is generally accepted that Mo/HZSM-5
is a bifunctional catalyst [71, 72, 73, 74, 75].
Briefly, the Mo-species are well dispersed on/in HZSM-5 after calcinations and they are
reduced by methane in the initial period of reaction to form MoCx and/or MoCxOy species,
which are responsible for the activation of C-H bond of methane and formation of C2Hy
species (y<4) [73, 74, 75]. After that, due to the unique channel structure of HZSM-5,
together with its Brönsted acid sites and the suitable pore size of 0.53 nm x 0.56 nm, which is
close to the kinetic diameter of benzene molecule, aromatization of the C2 intermediates can

General Part – Methane to Aromatics 29
proceed easily [70, 76]. Since either ethylene or ethane aromatization proceed easily in the
temperature range 573-873 K over HZSM-5, it is clear, that methane dehydrogenation and
dimerization to the C2 species is the rate-determining process.
Even in the first steps of MDA investigations a very important role of reduced MoCxOy
species was noticed, e.g. [62, 77]. This carbide clusters species have been formed from Mo
oxide and/or MoOx precursors during the induction period (contact with CH4 at temperatures
about 950-1000 K). MoCxOy species are proposed to be responsible for the cleavage of C-H
bond of methane, first step in the MDA reaction. Different techniques like TGA, TPD, XRD,
XPS, XAS, EXAFS, XANES, 1H, 27Al and 13C MAS NMR, FTIR, ISS, HRTEM, EPR,
RE2PI et al. were successfully applied in order to detect and characterize this active Mo
species.
Mentioned above MoOx precursors are formed from Mo during
calcination/activation/regeneration period, which is normally done in air/oxygen atmosphere
at temperatures about 850 K. Very important observations about this procedure was done by
Liu et al. and Iglesia et al. in [73] and [78] respectively. The authors found that during this
step Mo species interact with and replace the Brönsted acid sites in the channels of the
HZSM-5 zeolite with a stoichometry of 1:1. Around 18 h of air pretreatment is necessary to
complete this process. After that time all of Mo species are associated with the Brönsted acid
sites. Important is the fact that only associated Mo species are active in the MDA. Also that
observation, that Brönsted acid sites are responsible not only for aromatization of C2 species,
but also for the coke formation plays significant role for creation of effective MDA catalyst.
2.4.5.4 Different techniques to improve MDA
Many different techniques are suggested in order to improve catalysts activity and/or stability,
as well as selectivity to desired products like benzene. There are e.g.:
- different routes for catalysts preparation;
- use of different Si/Al ratios of HZSM-5 [79];
- different kinds of catalyst pretreatment (hydrothermal post-synthesis [80], silanation
[59, 60], pretreatment with HCl [79], use of different calcination temperatures [81],
atmospheres and times [82], steam pretreatment [83]);

General Part – Methane to Aromatics 30
- different reaction temperatures [84];
- use of co-feeds such as hydrogen [85], CO2/CO [84, 86, 87, 88, 89, 90], oxygen [91],
dimethyl ether [92], NO [93, 94] etc.;
2.4.5.5 Overview on Methane Dehydroaromatization
Despite much research on this reaction and a number of suggested catalytic systems MDA
reaction remain to be performed only in the labor scale. The main reasons for this are the low
methane conversions and relative short catalyst service time.
The best catalyst for MDA was reported a Mo/HZSM-5 with the optimum range of Mo
loading of 4-6 wt.% [71, 75]. Catalyst is active for MDA at the reaction temperatures above
650°C. The methane conversion grows proportionally to the temperature increase. However,
irreversible catalyst deactivation occurs at the temperatures above 800°C. Normally MDA
reaction will be performed at 700°C. Mo/HZSM-5 is very selective to the aromatic products –
benzene, toluene and naphthalene. Typically no side products can be detected in the reaction
mixture (except formed coke). Longer TOS favors better aromatic selectivity.
Catalyst can be regenerated by oxidizing of the formed coke after reaction. Regeneration
procedure using hydrogen was suggested also, e.g. [85].
Different kind of catalyst preparation and catalyst pretreatment allow some improving of the
catalyst activity but the coking problem is necessarily remaining.

General Part – Dimethyl Carbonate production 31
2.5 Dimethyl Carbonate production
2.5.1 Dimethyl carbonate and Green Chemistry
A lot of investigations are devoted nowadays to find an effective and simple route to produce
a Dimethyl Carbonate (DMC). There are many reasons that make DMC really attractive as a
“Green Chemistry” reagent.
First of all DMC is non-toxic for humans and environment and has rapid biodegradability.
E.g. its oral LD50 is 13000 mg/kg. Its versatile methylation and carbonylation properties open
many routes for clean and effective organic syntheses. Depending on the conditions it can be
a very effective methylating agent instead of toxic dimethylsulfate or carboxymethylating
agents as substitute for poisonous phosgene, e.g. [95, 96, 97, 98]. Comparison of toxicological
properties of these substances is given in Table 5. As it can be seen, compared with phosgene
or DMS, DMC has much less toxicity and is not a mutagenic substance.
Also DMC found many applications in other areas: as octane enhancer ((M+R)/2 octane
number = 105, high oxygen content of 53 wt.%); as expanding system for polyurethane
foams; as lubricant for the cold-rolling of steel, as synthetic lubricant and high-performance
functional fluid; as a solvent in a process for deasphalting and demetalling of crude oil
residues; as electrolyte in batteries due to the its high dielectric constant etc. [99, 100].
There is few new synthesis routes developed instead of old phosgene route presented in Eq. 9.
2ROH + COCl2 ↔ (RO)2CO + 2HCl (Eq. 9)
Eq. 10 represents DMC synthesis route based on Oxidative Carbonilation of alcohols. This
reaction can be performed in liquid and gas phase.
2 ROH + CO + ½ O2 ↔ (RO)2CO + H2O (Eq. 10)
Since 1983 EniChem has an industrial plant in operation to produce DMC via this route in the
liquid phase in the presence of copper chloride catalysts [101]. No industrial applications of
gas phase catalytic systems are known despite there are many investigations carried out [100].
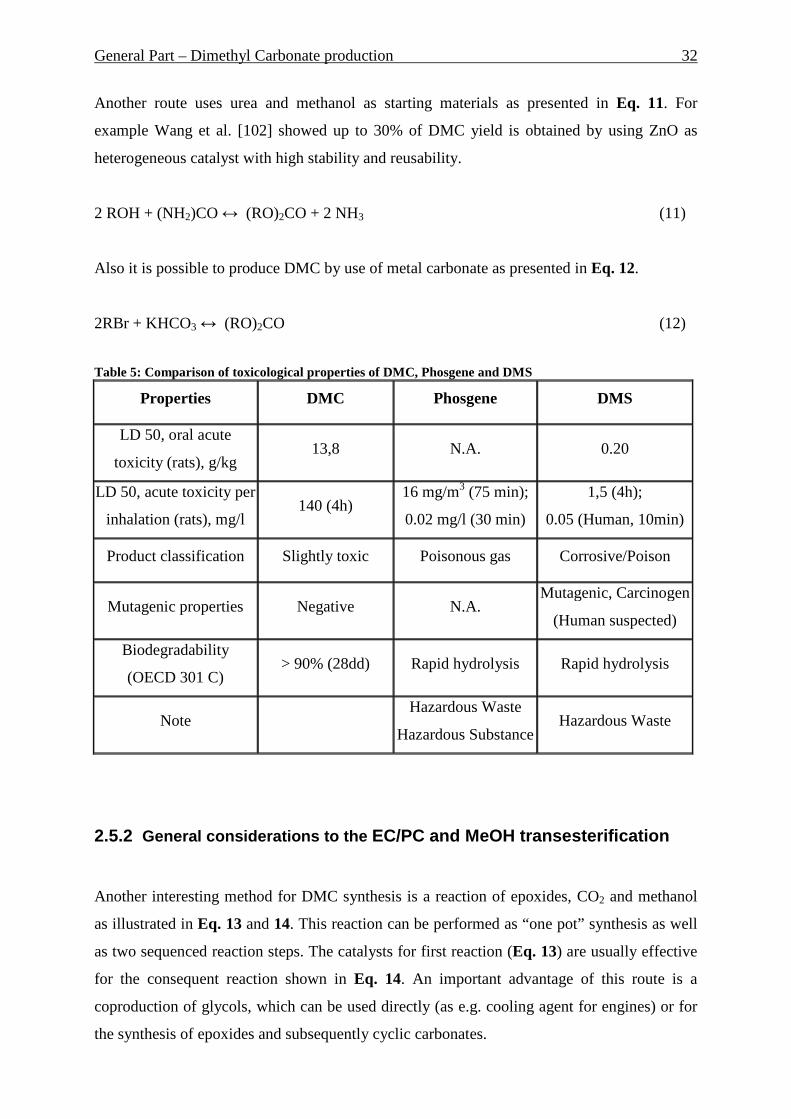
General Part – Dimethyl Carbonate production 32
Another route uses urea and methanol as starting materials as presented in Eq. 11. For
example Wang et al. [102] showed up to 30% of DMC yield is obtained by using ZnO as
heterogeneous catalyst with high stability and reusability.
2 ROH + (NH2)CO ↔ (RO)2CO + 2 NH3 (11)
Also it is possible to produce DMC by use of metal carbonate as presented in Eq. 12.
2RBr + KHCO3 ↔ (RO)2CO (12)
Table 5: Comparison of toxicological properties of DMC, Phosgene and DMS
Properties DMC Phosgene DMS
LD 50, oral acute
toxicity (rats), g/kg 13,8 N.A. 0.20
LD 50, acute toxicity per
inhalation (rats), mg/l 140 (4h)
16 mg/m3 (75 min);
0.02 mg/l (30 min)
1,5 (4h);
0.05 (Human, 10min)
Product classification Slightly toxic Poisonous gas Corrosive/Poison
Mutagenic properties Negative N.A. Mutagenic, Carcinogen
(Human suspected)
Biodegradability
(OECD 301 C) > 90% (28dd) Rapid hydrolysis Rapid hydrolysis
Note Hazardous Waste
Hazardous Substance Hazardous Waste
2.5.2 General considerations to the EC/PC and MeOH transesterification
Another interesting method for DMC synthesis is a reaction of epoxides, CO2 and methanol
as illustrated in Eq. 13 and 14. This reaction can be performed as “one pot” synthesis as well
as two sequenced reaction steps. The catalysts for first reaction (Eq. 13) are usually effective
for the consequent reaction shown in Eq. 14. An important advantage of this route is a
coproduction of glycols, which can be used directly (as e.g. cooling agent for engines) or for
the synthesis of epoxides and subsequently cyclic carbonates.
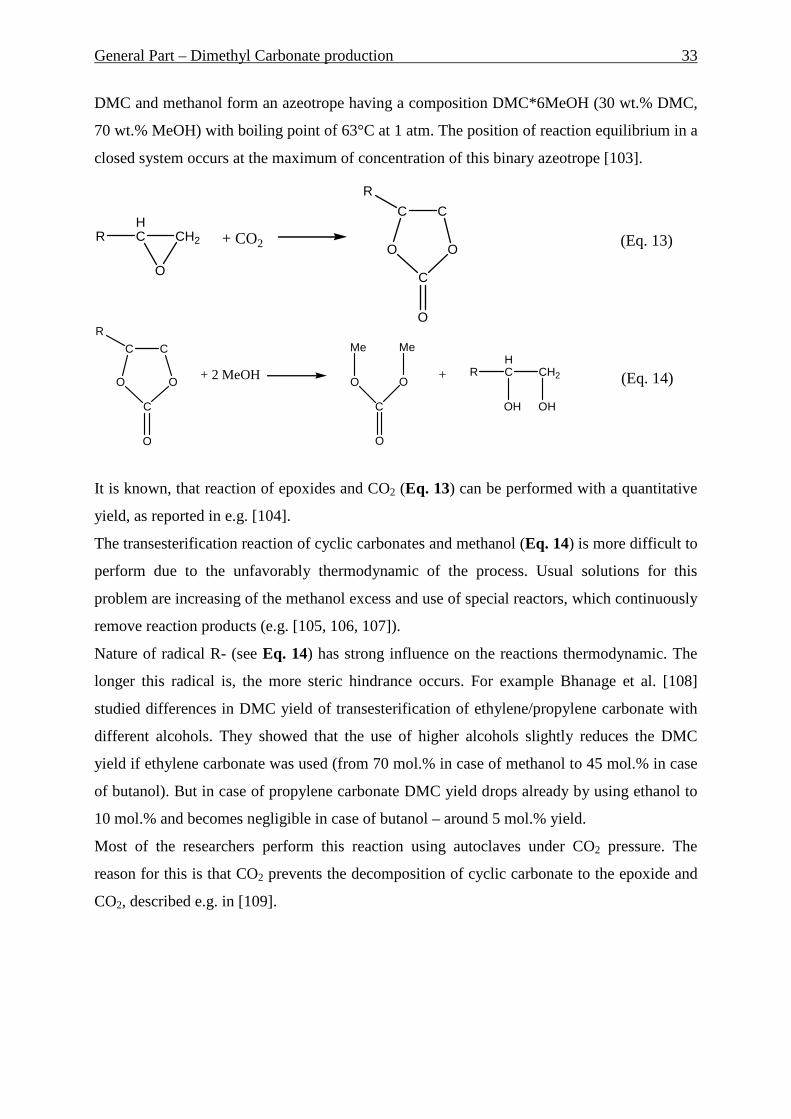
General Part – Dimethyl Carbonate production 33
DMC and methanol form an azeotrope having a composition DMC*6MeOH (30 wt.% DMC,
70 wt.% MeOH) with boiling point of 63°C at 1 atm. The position of reaction equilibrium in a
closed system occurs at the maximum of concentration of this binary azeotrope [103].
(Eq. 13)
(Eq. 14)
It is known, that reaction of epoxides and CO2 (Eq. 13) can be performed with a quantitative
yield, as reported in e.g. [104].
The transesterification reaction of cyclic carbonates and methanol (Eq. 14) is more difficult to
perform due to the unfavorably thermodynamic of the process. Usual solutions for this
problem are increasing of the methanol excess and use of special reactors, which continuously
remove reaction products (e.g. [105, 106, 107]).
Nature of radical R- (see Eq. 14) has strong influence on the reactions thermodynamic. The
longer this radical is, the more steric hindrance occurs. For example Bhanage et al. [108]
studied differences in DMC yield of transesterification of ethylene/propylene carbonate with
different alcohols. They showed that the use of higher alcohols slightly reduces the DMC
yield if ethylene carbonate was used (from 70 mol.% in case of methanol to 45 mol.% in case
of butanol). But in case of propylene carbonate DMC yield drops already by using ethanol to
10 mol.% and becomes negligible in case of butanol – around 5 mol.% yield.
Most of the researchers perform this reaction using autoclaves under CO2 pressure. The
reason for this is that CO2 prevents the decomposition of cyclic carbonate to the epoxide and
CO2, described e.g. in [109].
RHC CH2
O
+ CO2
C C
OO
C
O
R
C C
OO
C
O
R
C
O
OO
Me Me
RHC CH2
OH OH
+ 2 MeOH +
General Part – Dimethyl Carbonate production 34
2.5.3 Reported catalytic systems for EC/PC and Meth anol
transesterification
A number of different catalytic systems for transesterification of EC/PC and MeOH have
been reported.
Knifton and Duranleau [104] described eight classes of catalysts, suitable for
transesterification of Ethylene Carbonate (EC) and Methanol. These were:
(a) macroreticular and gel-type exchange resins with tertiary amine groupings bounded to a
polymer backbone;
(b) ion-exchange resins with quaternary ammonium functional groups;
(c) zirconium, titanium and tin homogeneous catalysts;
(d) homogeneous Group VB and VIB compounds;
(e) alkali metal silicates on silica;
(f) ammonium-exchanged zeolites such as LZY-82;
(g) acidic resins bearing sulfonic acid and carboxylic acid functional groups;
(h) tertiary phosphine polymer catalysts.
They found that bases are more effective than acids for this reaction.
Conversion of EC was typically around 50-60% (MeOH:DMC ratio 4:1), DMC and EG
selectivity around 98-99%. Reaction conditions: 60-150°C, 100 psi, tubular steel reactor.
Bayer and DOW patented the use of inorganic base such as alkali metal alkoxide, carbonates
or hydroxide etc. as catalyst [110, 111]. Bayer also patented the use of organic base, tertiary
amine, as catalyst [112].
Tatsumi et al. [113] described use of titanium silicate molecular sieve, TS-1, exchanged with
an aqueous solution of K2CO3 as a heterogeneous catalyst for transesterification of ethylene
carbonate and methanol. Around 68 % of EC conversion and 57 % DMC yield were reported.
Reaction conditions: MeOH:EC molar ratio = 4:1, 89 mg catalyst, 31 mmol EC, 124 mmol
MeOH, 3h reaction time.
Man Seok Han et al. [114] made a comparison of the activity of KOH, NaOH, LiOH and
K2CO3 homogeneous catalysts. LiOH showed the highest activity with 61.94 mol.% EC

General Part – Dimethyl Carbonate production 35
conversion and 61.52 mol.% DMC yield. Reaction rate by using of LiOH was 2.538 *102
(dm3/mol)0.21/min at 298 K.
Reaction conditions: MeOH:EC molar ratio = 4:1, 25°C, pressure 50 psig by N2, 0.1 g of
catalyst, reaction time 1h.
Jiang et al. [115] reported that follow homogeneous catalysts are active for transesterification
of propylene carbonate and methanol: IIA group oxide, IA group hydroxide, carbonate and
salt. The optimal reaction conditions were as follows: temp. 333-353K, reaction time 1 h,
dosage of catalyst 1.0-2.5%, ratio of allyl carbonate to methanol 1:5.
Watanabe et al. [116] reported about successful use of hydrotalcites for transesterification of
ethylene carbonate and MeOH. Especially Mg-Al hydrotalcite-type with low Al concentration
in brucite-like layers and high OH- proportion in the interlaced anions gave 70 mol.% of EC
conversion and 58 mol.% of DMC yield. Reaction conditions: 89 mg of catalyst, 2.72 g of
EC, 3.96 g of MeOH, MeOH:EC molar ratio = 4:1, the mixture was refluxed for 3 h.
Zhao et al. [117] tried to catalyze PC/MeOH transesterification by using KX zeolites. Very
low activity of pure KX/NaX was detected, indicating that the basicity of alkali cation-
exchanged zeolite is not enough for catalyzing transesterification. Addition of
KOH/K2CO3/KNO3/KCl to the KX zeolite improved catalytic activity of the catalyst, but this
activity was mainly related to the introduction of known homogeneous alkali metal
compounds.
Bhanage et al. [118] found that smectites (one of the layered clay minerals) containing Mg
and/or Ni are excellent heterogeneous catalysts for the EC/MeOH transesterification. Both
DMC and EG selectivity were very high. Around 75 mol.% of EC conversion and 90 mol.%
selectivity to the DMC and EG was achieved. Catalytic performance was dependent upon the
amount of alkali metals introduced in the lattice. Reaction conditions: 50 ml stainless
autoclave, EC 25 mmol, MeOH 200 mmol, MeOH:EC molar ratio = 8:1, catalyst 0.45g,
150°C, 1MPa of CO2, reaction time 4h. The dependence of catalytic activity of alkali metal
load allows supposing that leaching of alkali metal will be a main problem for this catalyst
and the catalyst has mainly homogeneous character. Unfortunately no information about
reusability of the catalyst is given.

General Part – Dimethyl Carbonate production 36
Wei et al. [119] used CaO as a heterogeneous catalyst for PC/MeOH transesterification. Many
factors like MeOH:PC ratio, catalyst concentration, temperature, addition method were
investigated. It was found that increased catalyst concentration above 0.6 wt.% doesn’t
increase PC conversion, but decreases DMC selectivity. Temperature around 30°C was found
as optimum. Up to 72 mol.% of PC conversion and 90 mol.% of DMC selectivity was
reported. Reaction conditions: MeOH:PC molar ratio = 10:1, 30°C, 0.61 wt.% catalyst
concentration. Reaction equilibrium was reached after 30 min reaction time. Reaction
mechanism was proposed which can be seen in the next Chapter 2.5.4. Unfortunately, no
information about reusability of the CaO catalyst was given. In another work of these authors
[120] they mentioned that “ultra fine CaO prepared from CaCO3 is difficult to filter from the
products and reuse”.
So Wei et al. [120] tried to bring CaO on the stable carrier using CaO/carbon composites.
Lower activity at room temperature of CaO/C was observed. If temperature was increased to
50°C, reaction equilibrium was reached after around 1h reaction time (around 40 mol.% PC
conversion and DMC yield). If particle size 0.18-0.28 mm was chosen, catalyst can be reused
at least two times without deactivation. Thereagainst bigger particle size of the catalyst leads
to the fast catalyst deactivation (in case of 0.4-0.9 mm – only 10% PC conversion during first
reuse). Reaction conditions: MeOH:PC molar ratio=4:1, catalyst load 1.8wt.%, particle size
0.18-0.28 mm, stirring speed 1000 rpm, 323 K (50°C).
Furthermore, Wei et al. [121] published investigations about influence of base strength and
basicity of catalyst on catalytic behavior. They proposed that increase of the base strength
lead to lower reaction temperature needed. On the other hand very strong base strength can
have negative influence on the DMC selectivity due to the promotion of PC polymerization,
described in [119]. Increasing of basicity leads to the reducing of induction period and also
increases reaction rate. Very small effect of DMC selectivity decrease was observed.
Feng et al. [122] reported about immobilized tertiary amine, which was covalently bonded, to
the surface of mesoporous MCM-41 molecular sieve. Strong influence of the reaction
temperature, pressure and LHSV was detected. By temperature increase from 110°C to 160°C
EC conversion increases from 25 mol.% to 42 mol.%. After 160°C no further EC conversion
occurs. Also increase of pressure until 1.0 MPa favors the EC conversion. Pressure more than
1.0 MPa has no positive influence. Thereagainst increase of LHSV has negative effect due to

General Part – Dimethyl Carbonate production 37
reduced residence time. Immobilized catalyst exhibited excellent stability and was used for
100h without any obvious loss of activity. Reaction conditions: stainless steel tube reactor, 3.5
g of catalyst, 120°C, 0.2 MPa, MeOH:EC=8:1, LHSV 3h-1.
Jeong et al. [123] investigated quaternary ammonium salts as PC/MeOH transesterification
catalyst. They found that conversion of PC increases with the increase of alkyl chain length of
the cation. More nucleophilic anion have the same effect. High pressure of CO2 was favorable
for the inhibition of PC decomposition to PO and CO2 in accordance with [118]. Pseudo-first
reaction order was detected and activation energy was calculated as 37.7 kJ/mol. No
information about heterogeneous character of the catalyst or its reusability is given. Reaction
conditions: steel autoclave, 250-400 psig CO2 pressure, 140°C, 6h reaction time, MeOH:PC
molar ratio = 8:1, catalyst amount 2 mmol.
Y.Chen et al. [124] described PC/MeOH transesterification over ZnO-PbO heterogeneous
catalyst. The conversion of PC, selectivity of DMC and yield of DMC reached 63.8%, 97.8%,
and 62.4%, respectively. Reusability of catalyst was examined and cause of deactivation was
analyzed. Reaction conditions: 110°C, reaction time 2 h, MeOH:PC molar ratio = 8.4, mass
fraction of catalyst 3.0%.
Dhuri and Mahajani [125] showed high activity of Amberlyst-21 as heterogeneous catalyst for
EC, PC/MeOH transesterification. In case of EC up to 37 mol.% of EC conversion and 95
mol.% DMC selectivity was achieved. For PC: 22 mol.% of PC conversion with 95 mol.%
DMC selectivity. Very good reusability of the Amberlyst-21 was shown. No activity or
products selectivity loss after 5 reaction cycles were detected. Reaction conditions: slurry
reactor, MeOH:EC/PC molar ratio = 8:1, 120°C, catalyst loading 22.488 kg*m-3. Amberlyst-
21 showed good reusability properties, but its activity was only a half of that of homogeneous
catalysts like e.g. NaOH. If 8:1 molar excess of MeOH to PC is used, up to 70 mol.% PC
conversion with close to 100% DMC and PG selectivity at room temperature is possible by
using of NaOH. Thereagainst Amberlyst-21 achieved only 22 mol.% of PC conversion.
Wang et al. [126] reported about successful use of CaO-ZrO2 solid solution catalyst. This
catalyst was prepared by coprecipitation. XRD, XPS and CO2-TPD analysis showed that Ca2+
ion substituted for Zr4+ ions in the host lattice and formed homogeneous CaO-ZrO2 solid
solution. When Ca/(Ca+Zr) ratio was 0.1 to 0.3 true solid solution was formed and good
General Part – Dimethyl Carbonate production 38
reusability of catalyst was achieved. By using reactive distillation constant PC conversion of
around 90 mol.% during 200 h reaction time was shown. In batch reactor around 50 mol.%
PC conversion at 440K was achieved. Increase of the CaO loading improves of catalytic
performance, but had negative influence on the catalyst stability. In reactive distillation strong
drop of PC conversion from 95 mol.% to 70 mol.% after 200 h reaction time was observed
when ratio 0.5 Ca/(Ca+Zr) was used. Reaction conditions: stainless batch reactor, 0.5 g of
catalyst, 0.2-0.3 mm particle size, MeoH:PC molar ratio = 6:1 (batch reactor), 2 h reaction
time. Reactive distillation: 0.71-0.1 mm particle size, 15 g catalyst, LHSV = 0.03 h-1, 423K,
0.5 MPa.
Sankar et al. [127] described successful use of tungstate-based solid catalyst. Around 80
mol.% EC conversion with close to 100 mol.% DMC selectivity was achieved (at room
temperature and pressure). Also excellent reusability of Na2WO4*2H2O was shown. No loss
of activity during two reactions cycles of recovered catalyst was detected. These results are
the best that was published to the time of writing this work.
Also transesterification of PC and MeOH was done by these authors. Only 25 mol.% of PC
was converted after 5 h reaction time (23 mol.% DMC yield). If 3.4 MPa CO2 pressure and
150°C was applied the PC conversion increased to 54 mol.% with 40 mol.% DMC yield. So
use of PC instead of EC hinders notably the DMC formation. Reaction conditions: batch
reactor, 50 mmol EC, 500 mmol MeOH, MeOH:EC molar ratio = 10:1, 1g of catalyst, CO2
pressure of 3.4 MPa (if needed), p-xylene – internal standard, 4h reaction time.
2.5.4 Proposed r eaction mechanism in liquid phase
Reaction mechanism of transesterification of PC and MeOH using CaO was proposed in
[119].
Knifton [104] reported that hydroxyethyl methyl carbonate (HEMC), which could be detected
only at short reaction time and/or low temperatures, was an intermediate when MeOH reacted
with ethylene carbonate, catalyzed by a basic catalyst, to generate DMC and ethylene glycol.
Since CaO is a typical solid base, hydroxypropyl methyl carbonate (HPMC) may be the
intermediate in the synthesis of DMC from PC and MeOH on CaO. On the basis of this
assumption, the charge distributions for MeOH, HPMC and PC were calculated by [119] by
use of Guassion 98. Table 6 lists the charge of the oxygen and hydrogen in the hydroxyl
group and/or the carbon in the carbonyl group of these three molecules.

General Part – Dimethyl Carbonate production 39
Table 6: Charge Distribution of MeOH, HPMC and PC [119] Charge of atom
Molecule Oa Hb Cc
MeOH -0,614 0,393 -
HPMC -0,620 0,391 0,803
PC - - 0,771
NOTE: Atoms in the molecules are illustrated as follows:
Usually a transesterification reaction catalyzed by a base is taken place when the nucleophilic
agent attacks the electrophilic carbonyl carbon of the ester. Thus, when PC transesterifies
with MeOH, the oxygen of methanol attacks the carbonyl carbon of PC to initial formation of
HPMC (as on Eq. 15-17 shown). HPMC has both nucleophilic hydroxyl oxygen and an
electrophilic carbonyl carbon. It cannot only react with MeOH to give DMC but also react
with PC to give the polypropylene carbonate (PPC). The two reactions are competitive. From
Table 6 it can be seen that the charge on the oxygen in MeOH and HPMC is -0.614 and -
0.620, respectively, while the carbonyl carbon in HPMC and PC is 0.803 and 0.771,
respectively. It is widely accepted that for nucleophilic substitution reactions, a high electron
density for the nucleophilic agent and a high positive charge for the attacked atom are
beneficial to decrease the energy of the transition state and subsequently increase the reaction
rate [128]. As a result, the free energy for the reaction of HPMC with MeOH is lower than
that for MeOH with PC as well as that for HPMC with PC. The reaction rate of HPMC with
MeOH is faster than that of MeOH with PC as well as that of HPMC with PC.
In summary, for the synthesis of DMC from PC and MeOH, the intermediate is HPMC, which
may be detected only at low temperatures and/or short reaction times. This is because the
reaction rate of HPMC with MeOH is much faster than that of PC with MeOH. On the other
hand, HPMC can continually react with PC to give the side product, PPC, with a rate much
slower than that of the transesterification reaction.
CH3OH
a b
CH3CHCH2OCOCH3
OH
O
a bC H C H 2
OO
C
O
H 3C
c
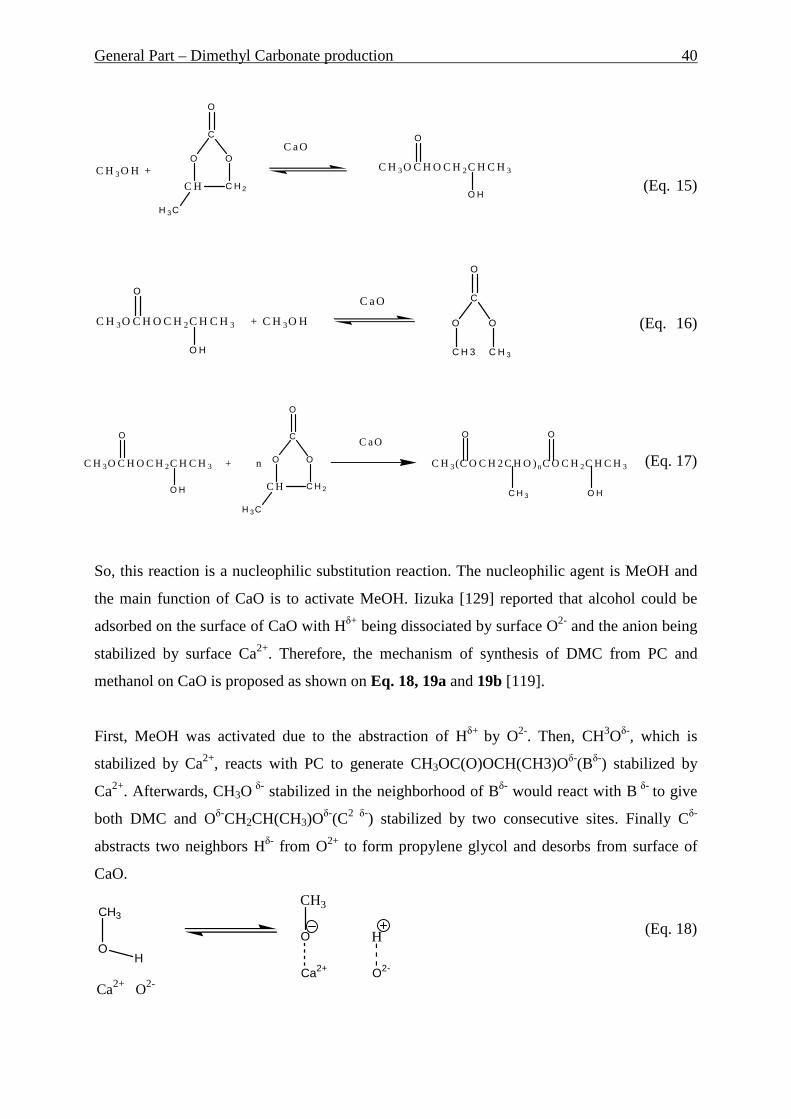
General Part – Dimethyl Carbonate production 40
(Eq. 15)
(Eq. 16)
(Eq. 17)
So, this reaction is a nucleophilic substitution reaction. The nucleophilic agent is MeOH and
the main function of CaO is to activate MeOH. Iizuka [129] reported that alcohol could be
adsorbed on the surface of CaO with Hδ+ being dissociated by surface O2- and the anion being
stabilized by surface Ca2+. Therefore, the mechanism of synthesis of DMC from PC and
methanol on CaO is proposed as shown on Eq. 18, 19a and 19b [119].
First, MeOH was activated due to the abstraction of Hδ+ by O2-. Then, CH3Oδ-, which is
stabilized by Ca2+, reacts with PC to generate CH3OC(O)OCH(CH3)Oδ-(Bδ-) stabilized by
Ca2+. Afterwards, CH3O δ- stabilized in the neighborhood of Bδ- would react with B δ- to give
both DMC and Oδ-CH2CH(CH3)Oδ-(C2 δ-) stabilized by two consecutive sites. Finally Cδ-
abstracts two neighbors Hδ- from O2+ to form propylene glycol and desorbs from surface of
CaO.
(Eq. 18)
C H C H 2
OO
C
O
H 3C
C H 3O H +
C aO
C H 3O C H O C H2C H C H3
O H
O
C H 3 C H 3
OO
C
O
C aO
C H 3O C H O C H2C H C H3
O H
O
+ C H3O H
C H C H 2
OO
C
O
H 3C
C aO
C H 3O C H O C H2C H C H3 +
O H
O
n C H3(C O C H 2 C H O )nC O C H2C H C H3
O O
C H 3 O H
CH3
OH
Ca2+ O2-
CH3
O
Ca2+
H
O2-
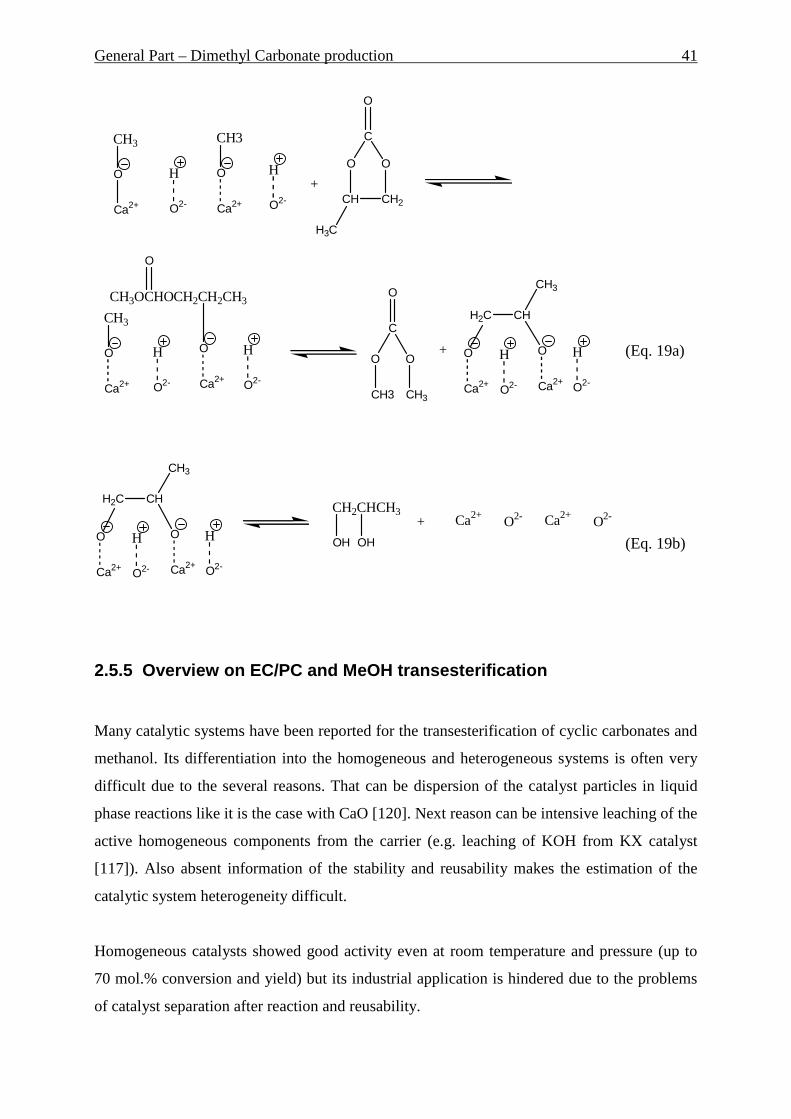
General Part – Dimethyl Carbonate production 41
(Eq. 19a)
(Eq. 19b)
2.5.5 Overview on EC/PC and MeOH transesterificatio n
Many catalytic systems have been reported for the transesterification of cyclic carbonates and
methanol. Its differentiation into the homogeneous and heterogeneous systems is often very
difficult due to the several reasons. That can be dispersion of the catalyst particles in liquid
phase reactions like it is the case with CaO [120]. Next reason can be intensive leaching of the
active homogeneous components from the carrier (e.g. leaching of KOH from KX catalyst
[117]). Also absent information of the stability and reusability makes the estimation of the
catalytic system heterogeneity difficult.
Homogeneous catalysts showed good activity even at room temperature and pressure (up to
70 mol.% conversion and yield) but its industrial application is hindered due to the problems
of catalyst separation after reaction and reusability.
CH3
O
Ca2+
H
O2-
CH3
O
Ca2+
H
O2- CH CH2
O O
C
O
H3C
CH3OCHOCH2CH2CH3
O
O
Ca2+
CH3
O
Ca2+
H
O2-
H
O2-
C
CH3 CH3
OO
O
H
O2-
H2C CH
CH3
O
Ca2+
O
Ca2+
H
O2-
H
O2-
CH2CHCH3
OH OH
Ca2+
H2C CH
CH3
O
Ca2+
O
Ca2+
O2- Ca2+
H
O2-
O2-
+
+
+

General Part – Dimethyl Carbonate production 42
Nevertheless some catalytic systems have without any doubts heterogeneous nature (e.g. [125,
126, 127]). Most of the heterogeneous catalytic systems need severe reaction conditions (i.e.
high pressures up to 3 MPa and temperatures in range of 110-250°C) to obtain even moderate
DMC yield (mostly around 40 mol.% conversion at 80 mol.% selectivity). The best results
were published in [127], were high EC conversion at room temperature and pressure was
reported (80 mol.% EC conversion and DMC yield), during PC conversion remain very low
(25 mol.%).
Results and Discussion – Ethyl Benzene to Styrene 43
3 Results and Discussion
3.1 Ethyl benzene to styrene
3.1.1 Introduction
Process of co-producing of styrene, ethane and hydrogen as in Eq. 4 shown, was successful
developed and implemented by Dow Chemical Co. They have been running a pilot plant scale
unit in Houston, using a circulating fluidized bed reactor with catalyst residence times of
several minutes. However, Dow expects the activity of the catalyst to be significantly higher
during its first seconds of Time On Stream (TOS) compared the activity after several minutes
TOS due to the catalyst deactivation. This would imply the use of a riser reactor instead of
fluidized bed unit to obtain the required catalyst residence times.
In order to investigate this problem a co-operation between the department of Chemical
Technology and Heterogeneous Catalysis of the RWTH Aachen University, Prof. Wolfgang
Hölderich, was established. In this project a laboratory scale riser reactor was to be conceived,
in which residence times in the order of magnitude of seconds were envisaged. After
performing these tasks (vide infra), another important questions appeared which solution was
also performed and is presented in this work. Different problems regarding influence of the
different factors like temperature, carbon dioxide and water addition to the feed as well as
looking for the possible oxygen source due to the strong CO2 formation during running of
pilot plant were investigated.
The reactions were performed in the riser-reactor, which set up, as well as picture without
isolation and cooling trap are shown in the Figure 17 and Figure 18. For reactor details and
reaction procedure please refer to the Chapter 5 - Experimental.
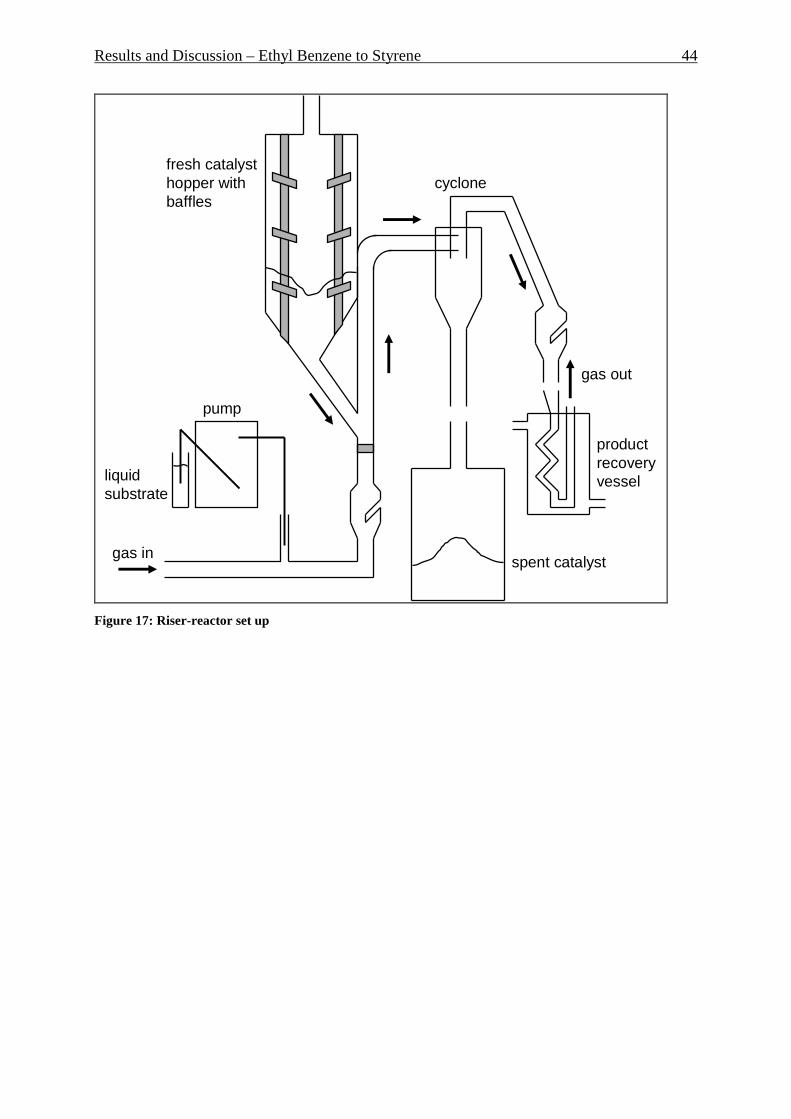
Results and Discussion – Ethyl Benzene to Styrene 44
fresh catalysthopper withbaffles
spent catalyst
productrecoveryvessel
cyclone
pump
liquidsubstrate
gas in
gas out
Figure 17: Riser-reactor set up
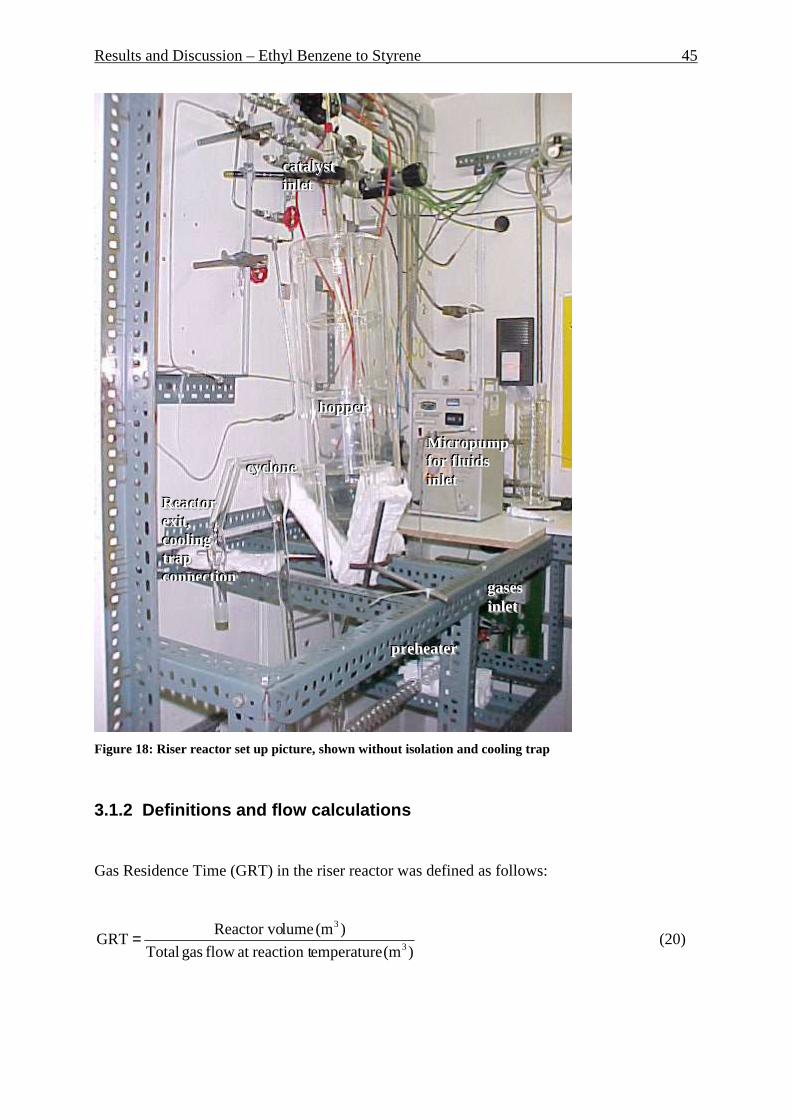
Results and Discussion – Ethyl Benzene to Styrene 45
Figure 18: Riser reactor set up picture, shown without isolation and cooling trap
3.1.2 Definitions and flow calculations
Gas Residence Time (GRT) in the riser reactor was defined as follows:
)(m emperaturereaction tat flow gas Total
)(m lumeReactor voGRT
3
3
= (20)
cccaaattt aaalll yyysssttt iii nnnlll eeettt
hhhoooppppppeeerrr
MMM iii cccrrr ooopppuuummmppp fff ooorrr fff lll uuuiii dddsss iii nnnlll eeettt
cccyyyccclll ooonnneee
RRReeeaaacccttt ooorrr eeexxxiii ttt ,,, cccoooooolll iii nnnggg ttt rrr aaappp cccooonnnnnneeecccttt iii ooonnn
ppprrr eeehhheeeaaattt eeerrr
gggaaassseeesss iii nnnlll eeettt
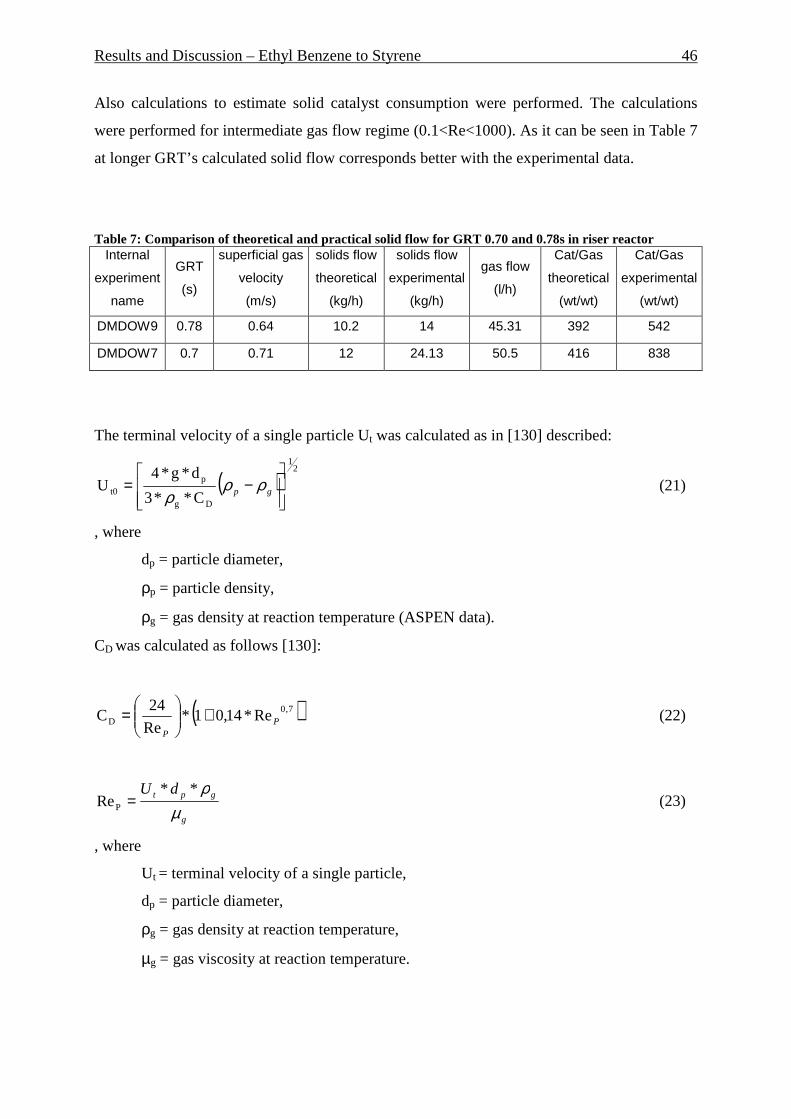
Results and Discussion – Ethyl Benzene to Styrene 46
Also calculations to estimate solid catalyst consumption were performed. The calculations
were performed for intermediate gas flow regime (0.1<Re<1000). As it can be seen in Table 7
at longer GRT’s calculated solid flow corresponds better with the experimental data.
Table 7: Comparison of theoretical and practical solid flow for GRT 0.70 and 0.78s in riser reactor Internal
experiment
name
GRT
(s)
superficial gas
velocity
(m/s)
solids flow
theoretical
(kg/h)
solids flow
experimental
(kg/h)
gas flow
(l/h)
Cat/Gas
theoretical
(wt/wt)
Cat/Gas
experimental
(wt/wt)
DMDOW9 0.78 0.64 10.2 14 45.31 392 542
DMDOW7 0.7 0.71 12 24.13 50.5 416 838
The terminal velocity of a single particle Ut was calculated as in [130] described:
( )2
1
Dg
pt0 C**3
d*g*4U
−= gp ρρ
ρ (21)
, where
dp = particle diameter,
ρp = particle density,
ρg = gas density at reaction temperature (ASPEN data).
CD was calculated as follows [130]:
( )7,0D Re*14,01*
Re
24C P
P
+
= (22)
g
gpt dU
µρ**
ReP = (23)
, where
Ut = terminal velocity of a single particle,
dp = particle diameter,
ρg = gas density at reaction temperature,
µg = gas viscosity at reaction temperature.
Results and Discussion – Ethyl Benzene to Styrene 47
After calculations of UT hindered setting corrections for the high particle concentration were
performed as in [131] and [132] described:
( )nc1*UU t0t −= (24)
, where
Ut = terminal setting velocity,
Ut0 = terminal velocity of a single sphere (infinity dilution),
c = volume fraction solid in the suspension,
n = function of Reynolds number Rep (n=4.3).
Also the models for Stoke’s and Newton’s laws (Re<0.1 and Re>1000) were tried to perform
the calculations, but the obtained values were even more outside the experimental data. The
deviations are possibly conditioned by non-spherical particles form as well non-ideal gas
behavior at high temperatures.
3.1.3 Reaction conditions and products The reaction of EB and ethane were performed at 600°C (873 K) reactor temperature. A
typical product mixture consists of unconverted EB, styrene and a small amount of benzene.
In addition toluene, naphthalene, biphenyl and other components, which are described below
as “others” were found in more or less negligible amounts. The gaseous product mixture
contains ethane, ethene, methane and carbon dioxide. Thermogravimetric analysis of spent
catalyst didn’t show present of any deposits on catalyst particles.
Before performing experiments with co-feeding of ethane to EB, experiment only with EB as
a feed was performed to detect the necessary of ethane adding to the feed. The reaction
conditions are 600°C (873 K), 0.68 s GRT and nitrogen as carrier gas. Around 27 mol.% of
styrene could be detected in liquid product mixture, 2.2 mol.% of benzene and 2.7 mol.% of
“others”. The rest was unconverted EB. A lot of carbon dioxide was found in gaseous mixture
- around 90%, followed by methane with 8% as well as ethane and ethene as rest. The styrene
yield was only 7 mol.%.

Results and Discussion – Ethyl Benzene to Styrene 48
3.1.4 Influence of Gas Residence Time (GRT) Effect of GRT was investigated at 20 and 40 mol.% of ethyl benzene in the feed. Figure 19
represents the product distribution in case of 20 mol.% of EB. As it can be seen the styrene
concentration increases significantly by increasing the GRT, on contrary the EB concentration
drops. At 1 s GRT around 56 mol.% of styrene and only 32 mol.% of EB were found as liquid
products. The formation of side products like benzene and many other components become
significant at longer GRT (after approx. 0.7 s GRT). At 1s GRT around 3.5 mol.% of benzene
and 5 mol.% of “others” have been formed (see Figure 19).
The distribution of gaseous reaction products is illustrated on Figure 20. Apart from large
amounts of carbon dioxide small amounts of methane and ethane were detected. Formation of
CO2 becomes extremely at longer GRT’s. At 1 s GRT more CO2 was detected than ethane.
The source of oxygen for oxidation reactions was unclear, so additional experiments for its
detection were performed (vide infra).
0
10
20
30
40
50
60
70
80
0,5 0,6 0,7 0,8 0,9 1 1,1
Gas Residence Time in s
Pro
duct
dis
trib
utio
n in
mol
.%
EB
Styrene
Others
Benzene
Figure 19: Liquid products distribution. 20 mol.% of EB, 600°C.
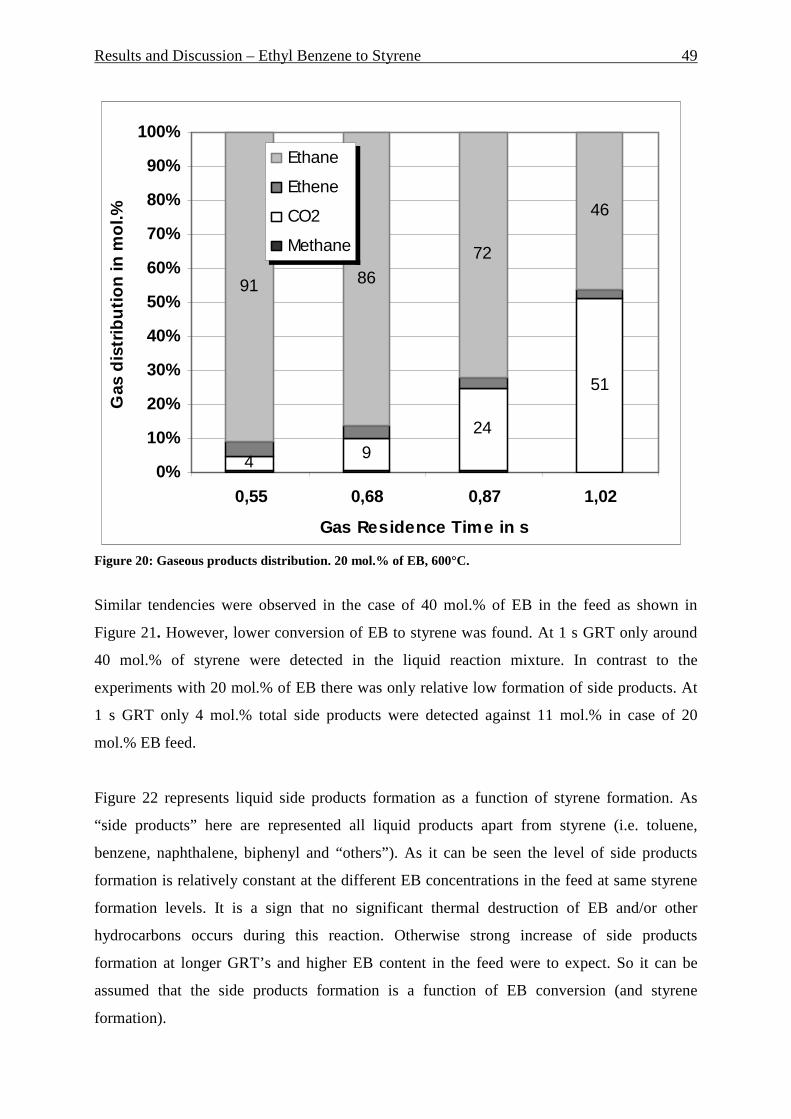
Results and Discussion – Ethyl Benzene to Styrene 49
4 9
24
51
91 86
72
46
0%
10%
20%
30%
40%
50%
60%
70%
80%
90%
100%
0,55 0,68 0,87 1,02
Gas Residence Time in s
Gas
dis
trib
utio
n in
mol
.%
Ethane
Ethene
CO2
Methane
Figure 20: Gaseous products distribution. 20 mol.% of EB, 600°C.
Similar tendencies were observed in the case of 40 mol.% of EB in the feed as shown in
Figure 21. However, lower conversion of EB to styrene was found. At 1 s GRT only around
40 mol.% of styrene were detected in the liquid reaction mixture. In contrast to the
experiments with 20 mol.% of EB there was only relative low formation of side products. At
1 s GRT only 4 mol.% total side products were detected against 11 mol.% in case of 20
mol.% EB feed.
Figure 22 represents liquid side products formation as a function of styrene formation. As
“side products” here are represented all liquid products apart from styrene (i.e. toluene,
benzene, naphthalene, biphenyl and “others”). As it can be seen the level of side products
formation is relatively constant at the different EB concentrations in the feed at same styrene
formation levels. It is a sign that no significant thermal destruction of EB and/or other
hydrocarbons occurs during this reaction. Otherwise strong increase of side products
formation at longer GRT’s and higher EB content in the feed were to expect. So it can be
assumed that the side products formation is a function of EB conversion (and styrene
formation).
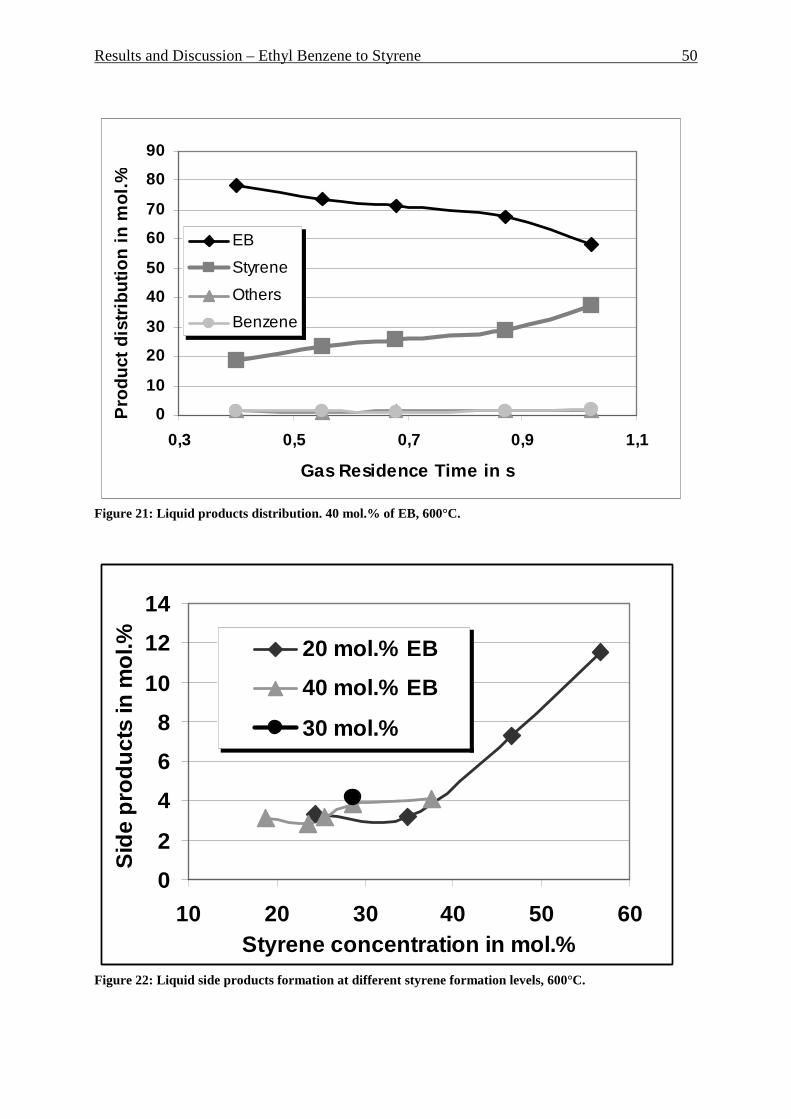
Results and Discussion – Ethyl Benzene to Styrene 50
0
10
20
30
40
50
60
70
80
90
0,3 0,5 0,7 0,9 1,1
Gas Residence Time in s
Pro
duct
dis
tribu
tion
in m
ol.%
EB
Styrene
Others
Benzene
Figure 21: Liquid products distribution. 40 mol.% of EB, 600°C.
0
2
4
6
8
10
12
14
10 20 30 40 50 60Styrene concentration in mol.%
Sid
e pr
oduc
ts in
mol
.% 20 mol.% EB
40 mol.% EB
30 mol.%
Figure 22: Liquid side products formation at different styrene formation levels, 600°C.

Results and Discussion – Ethyl Benzene to Styrene 51
3.1.5 Influence of ethyl benzene content in the fee d
The Figure 23 represents the concentration of styrene, unconverted EB and “others” in the
liquid reaction mixture using different EB concentrations in the feed. The formation of
desired styrene decreases slightly by increasing amount of EB in the feed. The concentration
of unconverted EB grows in mixture. A constantly low side products formation was observed.
0
10
20
30
40
50
60
70
80
15 20 25 30 35 40 45
Amount of EB in feed in mol.%
Pro
duct
s d
istri
butio
n in
mol
.%
EB
Styrene
Others
Figure 23: Influence of the EB concentration in the feed, 0.68 s GRT and 600°C.
3.1.6 Oxygen in the reaction
In order to detect the source for the high amount of carbon dioxide in the gaseous product
various “blank” experiments using only nitrogen as a feed were performed. Around 3% of
oxygen was found in the product mixture after the blank test. It can be assumed that in the
catalyst pores contained oxygen is a source for that. Also flushing the catalyst with argon
during 30 min at fluidized conditions before reaction resulted in the same oxygen content as
in the blank reaction. It seems that oxygen adsorbed in catalysts pores cannot be effectively
removed by flushing and is responsible for oxidation reactions and high carbon dioxide
content in gas products.
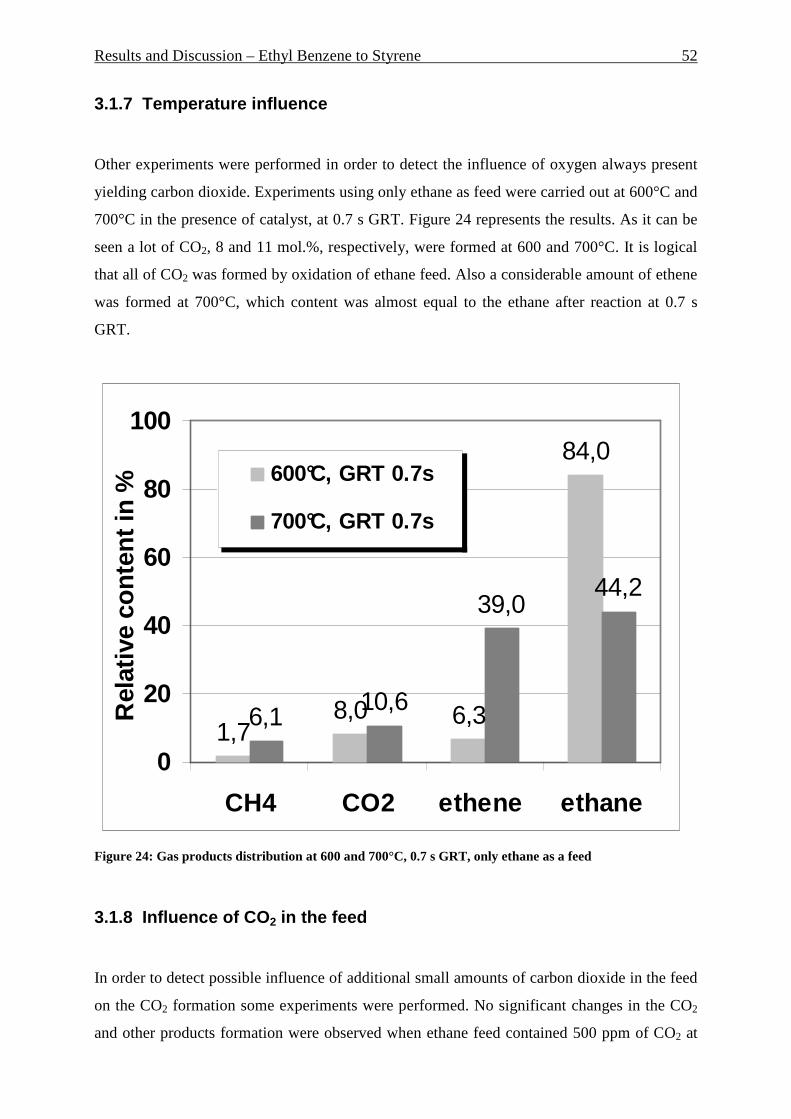
Results and Discussion – Ethyl Benzene to Styrene 52
3.1.7 Temperature influence
Other experiments were performed in order to detect the influence of oxygen always present
yielding carbon dioxide. Experiments using only ethane as feed were carried out at 600°C and
700°C in the presence of catalyst, at 0.7 s GRT. Figure 24 represents the results. As it can be
seen a lot of CO2, 8 and 11 mol.%, respectively, were formed at 600 and 700°C. It is logical
that all of CO2 was formed by oxidation of ethane feed. Also a considerable amount of ethene
was formed at 700°C, which content was almost equal to the ethane after reaction at 0.7 s
GRT.
1,78,0 6,3
84,0
6,110,6
39,044,2
0
20
40
60
80
100
CH4 CO2 ethene ethane
Rel
ativ
e co
nten
t in
%
600°C, GRT 0.7s
700°C, GRT 0.7s
Figure 24: Gas products distribution at 600 and 700°C, 0.7 s GRT, only ethane as a feed
3.1.8 Influence of CO 2 in the feed
In order to detect possible influence of additional small amounts of carbon dioxide in the feed
on the CO2 formation some experiments were performed. No significant changes in the CO2
and other products formation were observed when ethane feed contained 500 ppm of CO2 at

Results and Discussion – Ethyl Benzene to Styrene 53
600°C. Reaction conditions: 0.7 s GRT, 600°C. No changes in methane or ethene formation
were detected. So at 600°C no influence of CO2 in the feed was detected. Thereagainst at
700°C considerably amount of additional carbon dioxide, around 3% (13.4% versus 10.6 %),
more CO2 were produced.
3.1.9 Gas Residence Time influence
The effect of GRT on the amount of carbon dioxide produced during the reaction of EB and
ethane is illustrated in Figure 25. CO2 formation grows exponential by increasing GRT.
Already at 1 s GRT a half of the gaseous products consist from carbon dioxide.
Figure 26 represents the product distribution at 0.7 and 1 s GRT only with ethane as a feed at
700°C. A similar tendency to increased carbon dioxide production at longer GRT can be
observed. Also a strong increase of methane production was detected opposite to the
experiments with EB in the feed (see Figure 25).
4 9
24
51
91 86
72
46
0%
10%
20%
30%
40%
50%
60%
70%
80%
90%
100%
0,55 0,68 0,87 1,02
Gas Residence Time in s
Gas
dis
trib
utio
n in
mol
.%
Ethane
Ethene
CO2
Methane
Figure 25: Gaseous product distribution. 20 mol.% of EB, 600°C

Results and Discussion – Ethyl Benzene to Styrene 54
6,110,6
39,0
44,2
11,215,7
40,2
32,9
0
5
10
15
20
25
30
35
40
45
50
CH4 CO2 ethene ethane
Rel
ativ
e co
nten
t in
%
GRT 0,7s
GRT 1s
Figure 26: Gas product distribution at 0.7 and 1 s GRT. 700°C, only ethane as a feed
3.1.10 Water influence
30 mol.% of water were added to the ethane feed to investigate its possible influence.
Reaction conditions are only ethane as a feed, 700°C and 1s GRT. As demonstrated in Figure
27 a considerable reduction of methane and CO2 formation can be observed. Also small
increase of ethene formation was detected.
The partial pressure of the ethane was reduced in this experiment compared to that in the
experiment only with ethane in the feed. Possibly it was the reason for the lower CO2 and
methane content in the product mixture. So experiments with the same ethane concentration
(i.e. same ethane partial pressure) as in presence of water were performed (“blank”
experiment). This “blank” experiment allowed to test if these changes in carbon dioxide and
methane production are caused by water presence. Table 8 represents comparison of the feed
gases of these two experiments. As it can be seen same amount of ethane (42.6 vol.%) was
used for both reactions.

Results and Discussion – Ethyl Benzene to Styrene 55
Table 8: Feed comparison of water and “blank” experiments Water experiment “Blank” experiment
Flow in
Nl/h
Flow at
700°C in
l/h
Gas
content,
vol.-%
Flow in
Nl/h
Flow at 700°C in
l/h Gas content, vol.%
Ethane 6,4 21,3 42,5 6,4 21,3 42,6
Water 3,0 9,9 19,8 0,00 0,00 0,00
Nitrogen
(anti-arching) 5,7 18,9 37,7 8,7 28,8 57,4
Total 15,1 50,1 100,0 15,1 50,1 100,0
Figure 28 represents an experiment with 30 mol.% of water in ethane feed and “blank”
experiment with 30 % of nitrogen and ethane (it should be mentioned that also additional
nitrogen as “anti-arching” flow was used in every experiment – see Chapter 5
Experimental). Up to 2.5 times more CO2 (32% vs. 12%) was formed when nitrogen was
used instead of water. Thus, the water presence prevents the oxidation of ethane. Also
destruction of ethane to methane is hindered.
8,611,7
41,138,6
11,2
15,7
40,2
32,9
0
5
10
15
20
25
30
35
40
45
CH4 CO2 ethene ethane
Rel
ativ
e co
nten
t in
%
water, GRT 1s
ethane only, GRT 1s
Figure 27: Gas products distribution with and without water adding. 1 s GRT, 700°C.

Results and Discussion – Ethyl Benzene to Styrene 56
7
12
37
44
10
3234
24
0
5
10
15
20
25
30
35
40
45
50
CH4 CO2 ethene ethane
Rel
ativ
e co
nten
t in
%
Water
Blank
Figure 28: Water experiment and blank experiment. 1 s GRT, 700°C.
3.1.11 Conclusions and Outlook
Influence of the different factors on the formation of carbon dioxide and other products were
studied in the reaction of ethyl benzene with ethane in a riser reactor.
The increase of EB concentration in the feed from 20 mol.% to 40 mol.% leads to some
decrease of the styrene formation.
Gas residence time is one of the main reaction parameters in the riser reactor. Longer GRT
increases the styrene yield but also leads to the stronger side product formation, such as
carbon dioxide and methane. The amount of the side products directly dependent upon the
styrene formed.
Using only ethane as feed, high temperatures and long GRT’s lead to an increase of methane
and carbon dioxide formation.
Results and Discussion – Ethyl Benzene to Styrene 57
The possible source of oxygen in the reaction is the catalyst itself. Oxygen in the catalysts
pores causes the oxidation of ethane and/or of EB to CO2. Use of only nitrogen as a feed in a
blank experiment as well as argon flushing the catalyst prior to the experiments didn’t lead to
the reduction of the oxygen content in the product mixture.
The influence of carbon dioxide present in the feed was studied. 500 ppm CO2 in the feed has
an influence on CO2 formation only at 700°C. No differences at 600°C could be detected.
Positive effect to reduce the side products formation by addition of water to the feed was
observed. A 30% less CO2 was formed at 1 s GRT and 700°C if 30 mol.% water was added to
the feed.
It is recommended to run the reaction under following conditions in the riser reactor:
EB concentration range 20-30 mol.%, GRT range 0.8-1.0 s, water concentration range 10-30
mol.%.
.
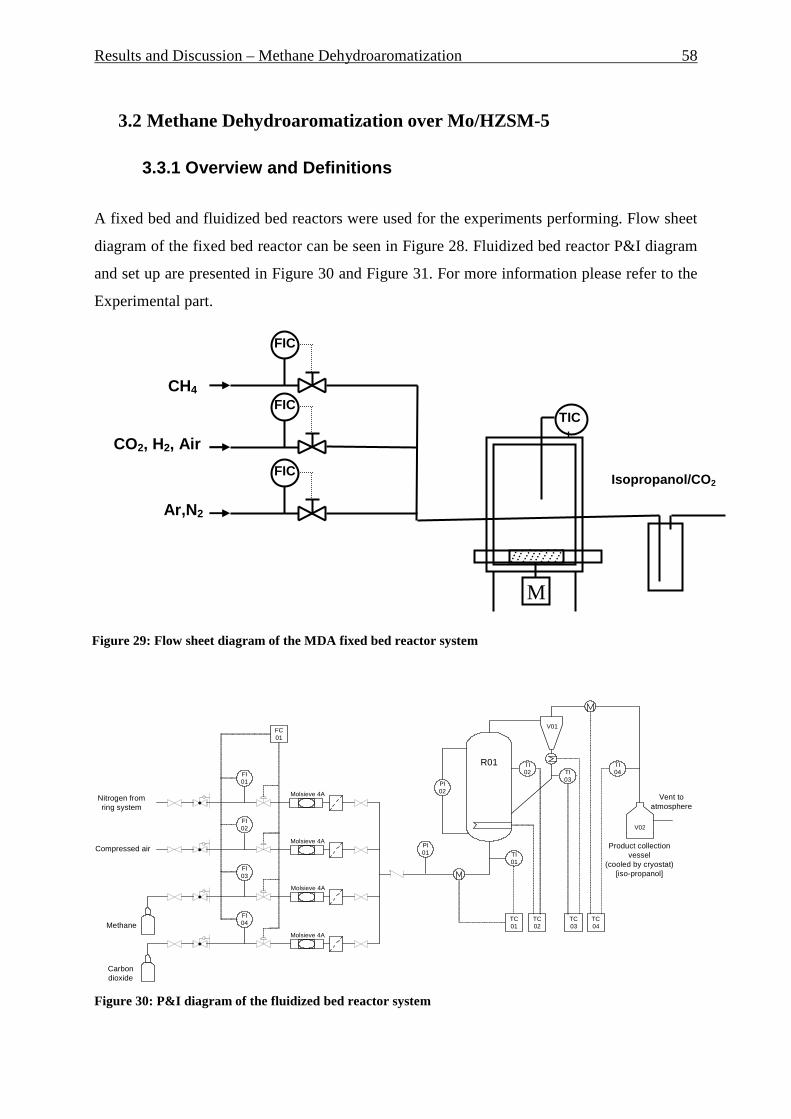
Results and Discussion – Methane Dehydroaromatization 58
3.2 Methane Dehydroaromatization over Mo/HZSM-5
3.3.1 Overview and Definitions
A fixed bed and fluidized bed reactors were used for the experiments performing. Flow sheet
diagram of the fixed bed reactor can be seen in Figure 28. Fluidized bed reactor P&I diagram
and set up are presented in Figure 30 and Figure 31. For more information please refer to the
Experimental part.
Nitrogen fromring system
Vent toatmosphere
Compressed air
Methane
Carbondioxide
Molsieve 4API01
FI01
FC01
FI03
FI02
FI04
Molsieve 4A
Molsieve 4A
Molsieve 4A
R01
V01
PI02
Product collectionvessel
(cooled by cryostat)[iso-propanol]
V02
TI01
TI02
TI04
TC01
TC03
TC04
TC02
TI03
Figure 30: P&I diagram of the fluidized bed reactor system
CH4
Ar,N2
TIC
FIC
FIC
FIC
CO2, H2, Air
M
Isopropanol/CO 2
Figure 29: Flow sheet diagram of the MDA fixed bed reactor system
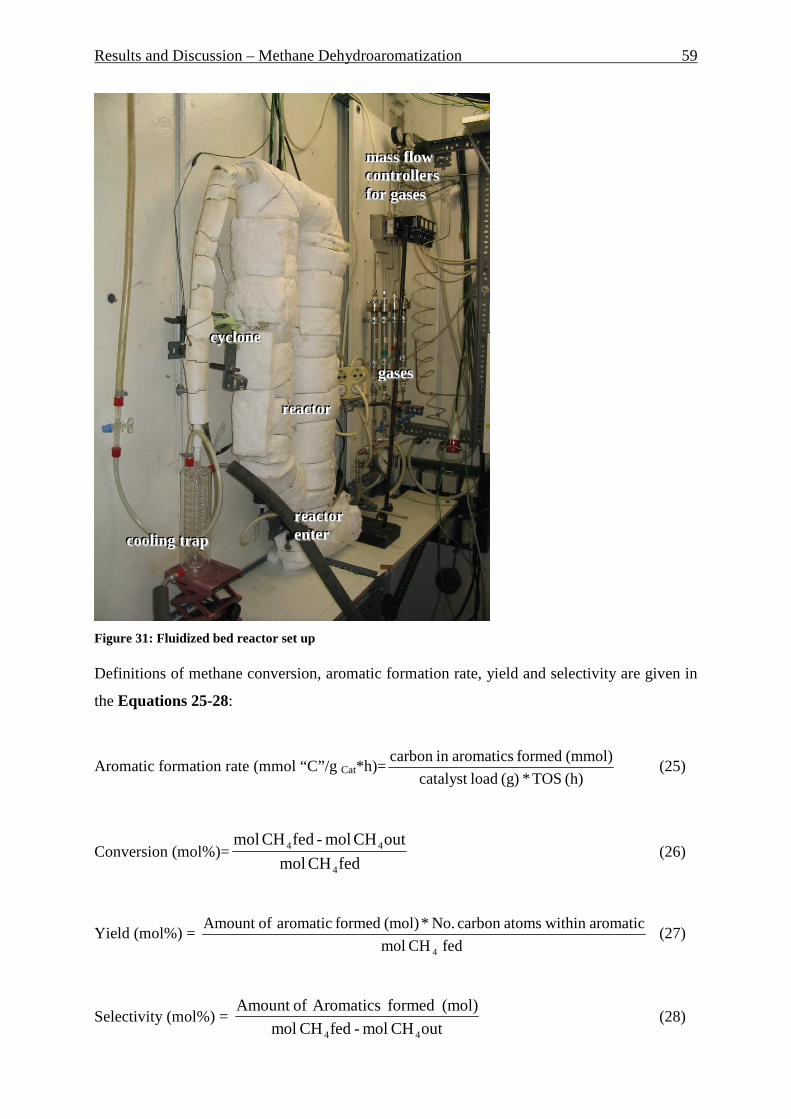
Results and Discussion – Methane Dehydroaromatization 59
Figure 31: Fluidized bed reactor set up Definitions of methane conversion, aromatic formation rate, yield and selectivity are given in
the Equations 25-28:
Aromatic formation rate (mmol “C”/g Cat*h)=(h) TOS *(g) loadcatalyst
(mmol) formed aromaticsin carbon (25)
Conversion (mol%)=fedCH mol
outCH mol - fedCH mol
4
44 (26)
Yield (mol%) = fed CH mol
aromatic within atomscarbon No. * (mol) formed aromatic ofAmount
4
(27)
Selectivity (mol%) = outCH mol - fedCH mol
(mol) formed Aromatics ofAmount
44
(28)
cccoooooolll iii nnnggg ttt rrr aaappp
gggaaassseeesss
rrr eeeaaacccttt ooorrr eeennnttt eeerrr
rrr eeeaaacccttt ooorrr
cccyyyccclll ooonnneee
mmmaaassssss fff lll ooowww cccooonnnttt rrr ooolll lll eeerrr sss fff ooorrr gggaaassseeesss
Results and Discussion – Methane Dehydroaromatization 60
3.3.2 Fixed-bed reactor results
The Figure 32 and Figure 33 show the typical aromatic formation rate and distribution during
the reaction at 973K when only methane was used as feed. WHSV was maintained at a rate of
2.0 g CH4 / g cat*h.
The formation rate of the aromatic products increases very rapidly during the first 40 minutes
and arrives a maximum. And after that it decreases slowly because of the coke deposits on the
catalyst particles - see Figure 32. As it can be seen, this reaction is very selective to the
benzene formation. At the start of the reaction benzene content is around 84% of all the
aromatics formed. The longer TOS the lower is the naphthalene production and the higher is
the selectivity to benzene, which grows up to 95% of total aromatics formed (see. Figure 33)
after 470 min TOS. Toluene formation is almost constant and consist 1-2 mol% during all
reaction times (Figure 33).
Figure 35 shows the course of the catalyst’s activity during 16 reaction cycles. A maximum of
the yield of around 7 mol.% aromatics can be achieved. A long-term deactivation occurs after
11 cycles (that corresponds to 55 h in total TOS). The catalyst after 16 reaction cycles was
undergone XRD, ICP-AES, BET and TGA analysis in order to detect changes in the catalyst’s
structure and properties.
The XRD analysis of the fresh catalyst and the spent catalyst after 16 reaction cycles is shown
below in Figure 35. Three analyses were performed for each sample, and figures of intensity
were averaged over the 2θ scale.
The diffraction patterns of the spent catalyst were not as intense as those of the fresh, starting
material. The intensity of the diffraction at ca. 23°, decreased respectively from 187 cps to
156 cps after 16 reaction cycles. Assuming a crystallinity of 100% for the fresh catalyst, the
spent catalyst suffered a loss of crystallinity of around 16%. This might be caused by a partial
destruction of the lattice, caused by repeated heating of the catalyst to the reaction
temperature of 700°C. There was no secondary phase formation observed.

Results and Discussion – Methane Dehydroaromatization 61
0
1
2
3
4
5
6
7
8
0 50 100 150 200 250 300TOS in min
Aro
mat
ics
form
atio
n ra
te in
mm
ol/g
*h
Figure 32: Aromatic formation rate. 973K, WHSV=2.0 h -1, fixed-bed reactor
0
84 88 89 90 91 93 91 95100
15 10 8 7 5 4 4 2
0%
20%
40%
60%
80%
100%
0 44 68 95 200 282 324 435 470Time in min
Aro
mat
ics
in m
ol.%
Naphthalene
Toluene
Benzene
Figure 33: Aromatic distribution. 973K, WHSV=2.0 h-1, fixed-bed reactor

Results and Discussion – Methane Dehydroaromatization 62
0%
1%
2%
3%
4%
5%
6%
7%
8%
1 2 3 4 5 6 7 8 9 10 11 12 13 14 15 16
Reaction Cycle
Aro
mat
ic y
ield
in m
ol.%
Naphthalene
Toluene
Benzene
Figure 34: Yield of the aromatic in mol.% and its distribution during 16 reaction cycles. 973K, fixed bed reactor
Figure 35: X-Ray diffraction of the fresh Mo/HZSM-5 and the spent catalyst after having undergone 16 reaction cycles
intensity (cps)
187
0
2-Theta - Scale
3 10 20 30 40 50 60
156
Spent catalyst
Results and Discussion – Methane Dehydroaromatization 63
Table 9 represents the surface area, measured by BET method. A decrease of the nitrogen
sorption capacity of the catalyst after 16 reaction cycles was observed. However, this decrease
was minor (see Table 9). The BET surface area decreased from 288 to 276 m2/g, the
micropore surface area from 189 to 184 m2/g, and the micropore volume decreased from
0.092 to 0.090 cm3/g. Such decreases may be attributed to a somewhat loss in crystallinity, as
previously shown, which would have caused a partial collapse of the structure. However, such
a loss was only minor and appeared to be of no significance.
Elementary analysis of the substances revealed no recognizable trend in the aluminum, silicon
or molybdenum transfer (see Table 10). Such small deviations in the above calculated ratios
cannot be interpreted, as they clearly lie within the error of measurement of the techniques
involved. The other consideration is that within gas phase reactions, leaching of elements is
rather unlikely (at the given temperatures).
TGA analysis was applied to the coked catalyst. Figure 36 represents the typical TGA and
DTG curves. The first mass loss process (Peak 1) occurs at 688K (415°C). According to the
references [75] and [77], this mass loss process can be attributed to the coke formed on the
MoCxOy-species. The second peak (Peak 2 - 465°C/738K) can be attributed to the coke
formed on the free Brönsted acid sites of HZSM-5. There is no described in [77] third mass
loss process was detected which can be ascribed to the coke, formed on the Mo-species not
associated with Brönsted acid sites. According to [75] all of MoOx species were associated to
the Brönsted acid sites during long activation/regeneration period of 18h. This is the reason
for the absence of the third mass loss process on TGA analysis data.

Results and Discussion – Methane Dehydroaromatization 64
92
93
94
95
96
97
98
99
100
100 200 300 400 500 600 700Temperature in °C
Mas
s lo
ss in
%
-1,2
-1,0
-0,8
-0,6
-0,4
-0,2
0,0
0,2
0,4
DT
G in
%/m
in a
nd D
SC
in u
V/m
g
Mass loss
DSC
DTG
Figure 36: TGA analysis of used catalyst. Mass loss, DSC and DTG, air, 2K/min
Table 9: Summary of nitrogen sorption and BET surface area analyses for the fresh Mo/HZSM-5 and for the spent catalyst after having undergone 16 reaction cycles.
BET Surface Area
(m2/g)
Micropore Surface
Area
(m2/g)
Micropore volume
(cm3/g)
Fresh catalyst 288 189 0.092
Used catalyst 276 184 0.090
Loss in % 4.2 2.6 2.2
Table 10: Summary of ICP AES analyses for the fresh Mo/HZSM-5 and for the spent catalyst after having undergone 16 reaction cycles.
Si/Al
(mol/mol)
Si/Mo
(mol/mol)
Al/Mo
(mol/mol)
Fresh catalyst 16.3 29.3 1.8
Used catalyst 15.0 32.7 2.2

Results and Discussion – Methane Dehydroaromatization 65
3.3.3 Fluidized bed reactor results
3.3.3.1 Yield and selectivity
The reactions were performed at 973K and WHSV of 1.4 g CH4/g Cat*h (this corresponds to
the VHSV level of 2000 ml CH4/(g cat*h)). Fluid dynamic investigations were performed
prior to the use of every catalyst batch and Minimal Fluidization Velocity (MFV) was
calculated. For more information see Chapter 5.1.3.
As it can be seen on the Figure 37 and Figure 38 Mo/HZSM-5 is very active as a catalyst in
the first reaction run. Methane conversion reaches 8 mol.% and depletion rate of methane
reaches 6.3 mmol C/g Cat*h. After that a strong long-term deactivation of the catalyst occurs.
During the second and the third run depletion rate values of only 1.8 and 1.4 mmol C/gCat*h
respectively can be observed (Figure 38).
Figure 39 represents the aromatic distribution during first reaction run in the fluidized bed
reactor. Stronger naphthalene formation can be realized at the maximum point of the aromatic
formation. Selectivity to the benzene has a minimum at the point of the maximum catalytic
activity. Production of toluene is relative constant during the total reaction time. After the
maximum of aromatic formation the naphthalene selectivity drops to a similar values as in the
fixed bed reactor of around 4-7 mol.% with a decreasing trend (Figure 39).
Figure 40 represents the aromatic distribution in the third reaction run. The selectivity to
benzene maintains at a very high level of more than 95% during entire reaction time. A
formation of a higher amount of naphthalene at the reaction start can be observed but is not as
clear as in the first reaction cycle. The reason for it is general catalyst deactivation which
results in the total activity drop (see next Chapter 3.3.3.2).

Results and Discussion – Methane Dehydroaromatization 66
0
1
2
3
4
5
6
7
8
9
0 50 100 150 200 250 300
TOS in min
Met
hane
con
vers
ion
in m
ol.%
1 run
2 run
3 run
Figure 37: Methane conversion in fluidized bed reactor. Three reaction cycles are shown. 973K, WHSV=1.44 h-1
0
1
2
3
4
5
6
7
8
9
0 50 100 150 200 250 300
TOS in min
Met
hane
con
vers
ion
in m
ol.%
1 run
2 run
3 run
Figure 38: Aromatic formation rate in mmol “C”/g*h for fluidized bed reactor. Three reaction cycles are shown. 973K, WHSV=1.44 h-1

Results and Discussion – Methane Dehydroaromatization 67
Fluidized bed, 700°C, WHSV=1
9181 85 88 90 90 91 94
919 13 9 7 7 6 4
0%
10%
20%
30%
40%
50%
60%
70%
80%
90%
100%
0 22 49 96 133 171 258 281Time in min
% o
f aro
mat
ics
Naphthalene
Toluene
Benzene
Figure 39: Aromatic distribution in mol.% for fluid ized bed reactor. First reaction cycle is shown, 973K.
96 93 93 94 95 96 94 94
0%
20%
40%
60%
80%
100%
0 40 85 170 247 367 431 474
Time in min
% o
f aro
mat
ics
form
ed
Naphthalene
Toluene
Benzene
Figure 40: Aromatic distribution in fluidized bed r eactor. Third reaction cycle is shown, 973K.
Results and Discussion – Methane Dehydroaromatization 68
3.3.3.2 Catalyst analysis
In order to detect some changes in the catalyst structure after three reaction cycles in the
fluidized bed reactor the catalyst was investigated by BET, ICP-AES and XRD analysis. Total
reaction time during 3 reaction cycles in the fluidized bed (reaction conditions: methane
WHSV 1.4 h-1, 700°C (973 K)) was 20 hours and common activation and regeneration time
(conditions: WHSV=1.4 h-1, 580°C (853 K)) was 72 hours.
It is illustrated in Table 11 that the catalyst lost around 41% of its BET surface, and about
45% of its micropore surface area and volume. Such significant loss of active micropores has
a heavy effect on the catalyst performance (vide infra).
Table 12 shows results of ICP-AES analysis. A decrease of Si/Al ratio from 16.3 to 13.1 was
detected. In addition a significant loss of Mo loading was observed. In case of the used
catalyst the Al/Mo ratio increased from 1.8 to 2.3. It seems that the intensification of the Mo-
leaching occurs under fluidized conditions, compared to the fixed bed reaction at same
reaction conditions.
XRD-analysis was performed for spent catalyst. A significant loss of the intensities of the
diffraction patterns at different 2-Theta degrees was detected. This is a sign of crystallinity
loss. Table 13 represents the results of XRD-analysis. Up to 34% of crystallinity loss could be
detected. The repeated heating up and cooling down of the catalyst might be a reason for it.
Also mechanical attrition of the particles could be possibly the reason for decreasing of
crystallinity and surface area (see also next Chapter 3.3.3.3).
All these changes in the catalyst structure under fluidized conditions resulted in the significant
activity loss of the catalyst already after 4h TOS at 700°C and at 1.44 h-1 methane WHSV as
in Figure 38 presented (with one regeneration cycle of 20 h at fluidized conditions between).
Also significant changes in the formed aromatic distribution can be detected, see Figure 40.
High benzene selectivity (more than 95 mol.%) and relative high toluene formation at longer
TOS were observed. In contrast to this amount of naphthalene formed was less than in the
case of fresh catalyst. It can be assumed that the methane residence time on catalyst particles
decreased significantly in case of used catalyst. Less micropores in the catalyst structure lead
to the limited aromatic formation and to the prevailed formation of benzene and/or toluene.
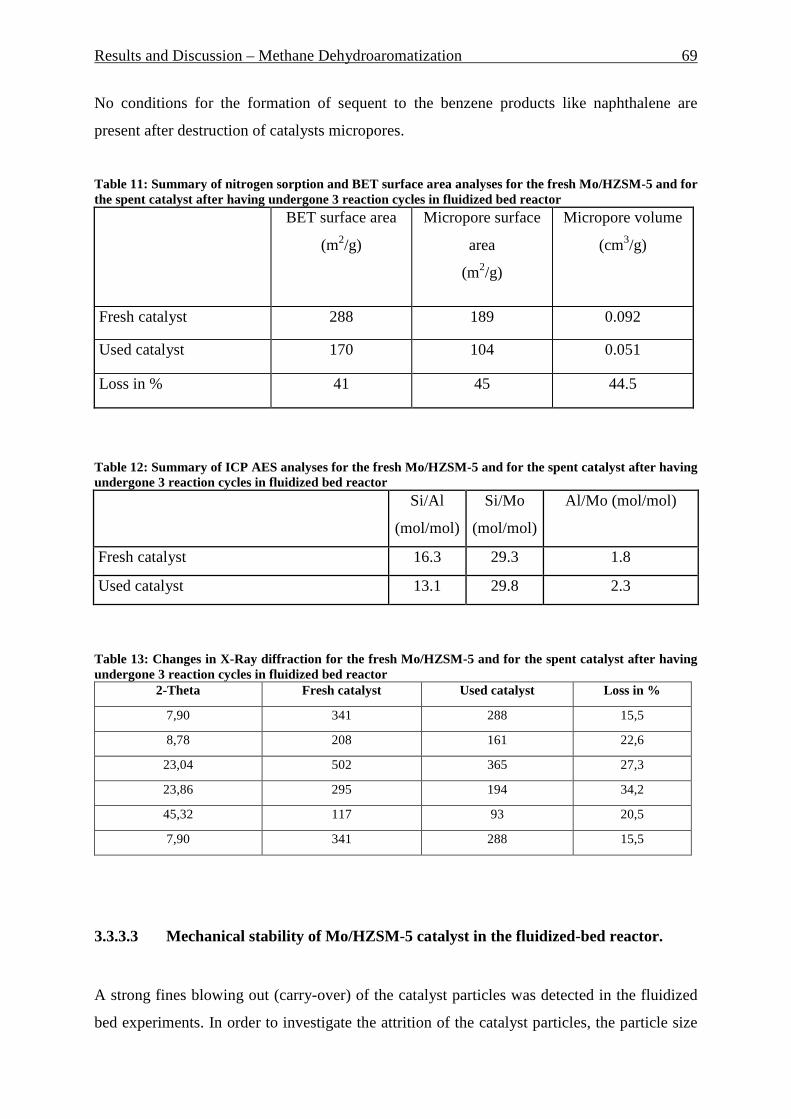
Results and Discussion – Methane Dehydroaromatization 69
No conditions for the formation of sequent to the benzene products like naphthalene are
present after destruction of catalysts micropores.
Table 11: Summary of nitrogen sorption and BET surface area analyses for the fresh Mo/HZSM-5 and for the spent catalyst after having undergone 3 reaction cycles in fluidized bed reactor BET surface area
(m2/g)
Micropore surface
area
(m2/g)
Micropore volume
(cm3/g)
Fresh catalyst 288 189 0.092
Used catalyst 170 104 0.051
Loss in % 41 45 44.5
Table 12: Summary of ICP AES analyses for the fresh Mo/HZSM-5 and for the spent catalyst after having undergone 3 reaction cycles in fluidized bed reactor Si/Al
(mol/mol)
Si/Mo
(mol/mol)
Al/Mo (mol/mol)
Fresh catalyst 16.3 29.3 1.8
Used catalyst 13.1 29.8 2.3
Table 13: Changes in X-Ray diffraction for the fresh Mo/HZSM-5 and for the spent catalyst after having undergone 3 reaction cycles in fluidized bed reactor
2-Theta Fresh catalyst Used catalyst Loss in %
7,90 341 288 15,5
8,78 208 161 22,6
23,04 502 365 27,3
23,86 295 194 34,2
45,32 117 93 20,5
7,90 341 288 15,5
3.3.3.3 Mechanical stability of Mo/HZSM-5 catalyst in the fluidized-bed reactor.
A strong fines blowing out (carry-over) of the catalyst particles was detected in the fluidized
bed experiments. In order to investigate the attrition of the catalyst particles, the particle size

Results and Discussion – Methane Dehydroaromatization 70
distribution analysis was done. During 3 reaction cycles the total reaction time was 20 hours
and regeneration time was around 72 hours, so total time under fluidized conditions was about
92 hours. Figure 41 represents the particles size distribution after 3 reaction cycles in the
fluidized bed reactor and the fresh catalyst particles size. Initial particles size (depicted in dark
color) was 160-400 µm. The light grey columns on the Figure 41 correspond to the particles
of the used catalyst. They consist from the initial sized particles and particles, appeared due to
catalyst attrition. It can be seen that only around 55% of the initial catalyst particles kept their
particles size in the primary range. And from the rest - 26% and 9% are still in the range of 1
µm – 0.16 µm. That is less than initial size but it can be assumed, that they are still participate
in the reaction without significant blowing out from the reactor. Around 10% of used catalyst
particles have size less than 1 µm after 92 h TOS.
For the use of this catalyst in the fluidized bed reactor its mechanical stability has to be
improved.
0%
10%
20%
30%
40%
50%
60%
70%
80%
0-0,063 0,063-0,08 0,08-0,09 0,09-0,1 0,1-0,125 0,125-0,16 0,16-0,2 0,2-0,4
Particle size in mm
Mas
s %
Used catalystFresh catalyst
Figure 41: Particles size distribution of used catalyst after 92 hours under fluidized conditions and fresh catalyst particles.

Results and Discussion – Methane Dehydroaromatization 71
3.3.4 Comparison of MDA procedure in fixed and flui dized bed
reactors
3.3.4.1 Yield and selectivity
Figure 42 represents the formation rate of aromatic for fixed and fluidized bed reactions. The
reaction conditions are : 700°C (973 K), methane WHSV=1,4 h-1 or VHSV=2000 mlCH4/g
Cat*h. Around 15 % higher conversion rates of methane to aromatic can be reached at the
maximum point (after around 60 min TOS) in the fluidized bed reactor – 6.3 mmol C/gCat*h
against 5.5 mmol C/gCat*h in fixed bed. After achieving the maximum point in fluidized bed a
strong activity drop was detected. Afterwards the activity level remained at 4.0 mmol C/gCat*h
and dropped again after 300 min to the level of 2.0 mmol C/gCat*h. In contrast to this, the
aromatic formation rate in fixed bed reactor was relative constant and decreased from 5.5 to
5.0 mmol C/gCat*h during 4h TOS.
This increase of aromatic formation in fluidized bed reactor goes along with some higher
level of the naphthalene formation (Figure 38, Figure 39). In contrast to the aromatic
distribution in the fixed bed reactor (Figure 33), in case of fluidized bed some more
naphthalene formation was detected (despite the reaction start point - Figure 38). Also
different behavior at lower reaction temperatures in fluidized bed reactor was observed. At the
start of reaction time (i.e. from 580 to 700°C) 91 mol.% of benzene was formed in fluidized
bed.
The increased naphthalene formation in the fluidized bed might have its reason in a process of
catalyst back mixing. Therefore the total contact time can be longer than in case of fixed bed.
The longer contact times lead to the formation of consecutive products such as naphthalene.
Strong catalyst particles destruction in the fluidized bed (vide infra) leads consequently to the
destruction of the pores and reducing of the total active species amount. The reasons for it can
be e.g. catalyst attrition, heating and cooling process, Mo-leaching. Together with the process
of coke formation this results in the stronger catalyst deactivation in the fluidized bed reactor
compared to the fixed bed reactor.
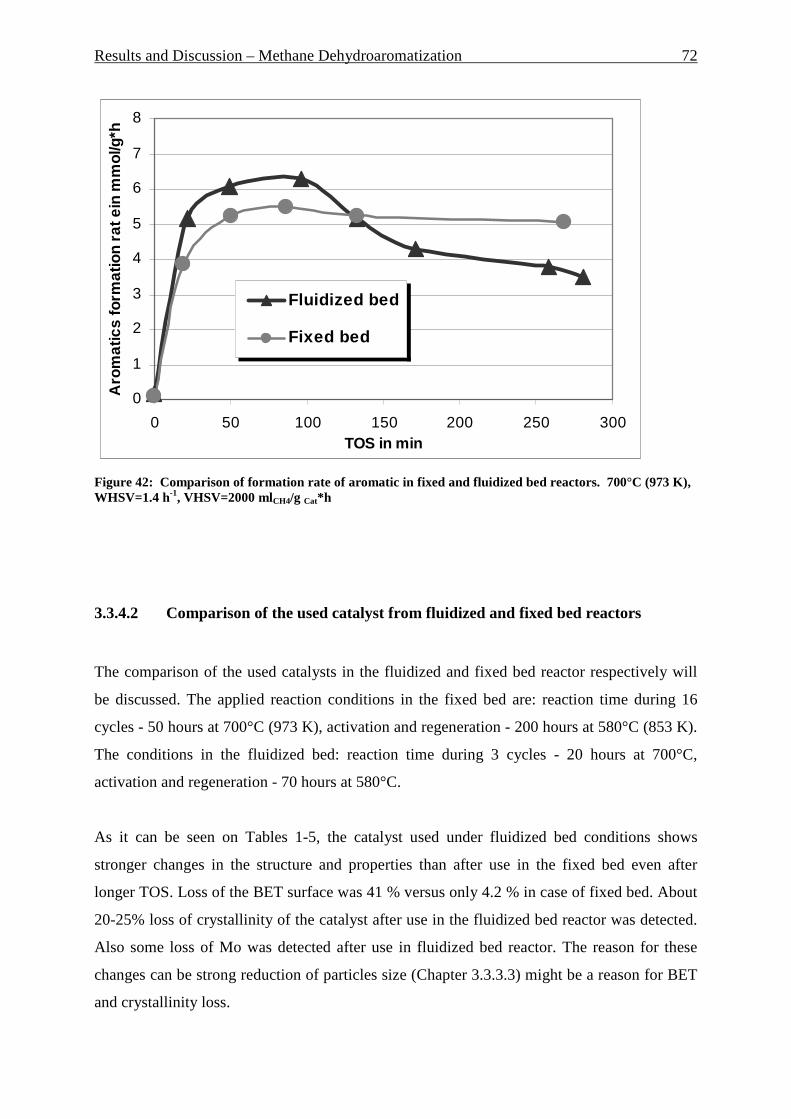
Results and Discussion – Methane Dehydroaromatization 72
0
1
2
3
4
5
6
7
8
0 50 100 150 200 250 300TOS in min
Aro
mat
ics
form
atio
n ra
t ein
mm
ol/g
*h
Fluidized bed
Fixed bed
Figure 42: Comparison of formation rate of aromatic in fixed and fluidized bed reactors. 700°C (973 K), WHSV=1.4 h-1, VHSV=2000 mlCH4/g Cat*h
3.3.4.2 Comparison of the used catalyst from fluidized and fixed bed reactors
The comparison of the used catalysts in the fluidized and fixed bed reactor respectively will
be discussed. The applied reaction conditions in the fixed bed are: reaction time during 16
cycles - 50 hours at 700°C (973 K), activation and regeneration - 200 hours at 580°C (853 K).
The conditions in the fluidized bed: reaction time during 3 cycles - 20 hours at 700°C,
activation and regeneration - 70 hours at 580°C.
As it can be seen on Tables 1-5, the catalyst used under fluidized bed conditions shows
stronger changes in the structure and properties than after use in the fixed bed even after
longer TOS. Loss of the BET surface was 41 % versus only 4.2 % in case of fixed bed. About
20-25% loss of crystallinity of the catalyst after use in the fluidized bed reactor was detected.
Also some loss of Mo was detected after use in fluidized bed reactor. The reason for these
changes can be strong reduction of particles size (Chapter 3.3.3.3) might be a reason for BET
and crystallinity loss.

Results and Discussion – Methane Dehydroaromatization 73
As it can be seen, Mo/HZSM-5 catalyst undergoes strong structural modifications under
fluidized conditions.
TGA profiles of both used catalysts showed almost same temperatures of the first mass loss
process. Peak 1 was detected at 420°C (688K) for fixed bed and at 415°C for fluidized bed
reactor. This coke can be attributed to the coke formed on the MoCxOy-species - [75] and
[77]. Peak 2 for catalyst used in the in fluidized bed reactor was shifted towards higher
temperature for 20°C (from 438°C for catalyst used in fixed bed to 458°C). This coke can be
attributed to the coke formed on the free Brönsted acid sites of HZSM-5 catalyst. More
intensive aromatic formation rate in fluidized bed reactor favors intensive HZSM-5 support
participating in the catalysis process, causing more intensive coke depositions in it. Total
amount of coke on the used catalyst was also higher after use in fluidized bed (4.6 wt.% vs.
3.6 wt.% in fixed bed). Reaction conditions: 700°C, 5h TOS, WHSV=1.44 g-1. Third mass
loss process described in [77] was not detected. This mass loss can be attributed to the coke,
formed on the Mo-species not associated with Brönsted acid sites.
95
96
97
98
99
100
101
300 350 400 450 500 550 600
Temperature in °C
Mas
s lo
ss in
%
-1,4
-1,2
-1,0
-0,8
-0,6
-0,4
-0,2
0,0
0,2
DS
C in
uV
/mg
Fluidized Bed - Mass Loss
Fixed Bed - Mass Loss
Fluidized Bed - DSC
Fixed Bed - DSC
Figure 43: TGA coke analysis after use in fixed and fluidized bed reactors.
Results and Discussion – Methane Dehydroaromatization 74
3.3.5 Influence of the WHSV on catalytic performanc e
The variation of the WHSV was investigated. Figure 44 represents the formation rate of the
aromatic at different WSHV levels. As it can be seen the maximum of aromatic formation
rate grows continuously during increase of WHSV from 0.3 h-1 to 4.3 h-1. Up to 11.5 mmol
carbon pro g catalyst per hour was formed. However, the deactivation of catalyst becomes
very rapid after around WHSV 2 h-1. The reason is a significant coke formation (vide infra).
The methane conversion is relative constant over almost all tested WHSV levels (Figure 45).
Starting from WHSV of around 2 h-1, conversion drop after arriving of maximum point was
detected. This tendency is more intensive at highest WHSV level of 4.3 h-1.
It seems that the optimal WHSV level lies in the range of 1.4 – 2.0 h-1 (VHSV approx. 2000 –
2800 mlCH4/gCat*h) at which the aromatic formation rate is high and no strong deactivation
occurs. The reason why many researcher selected VHSV level of 1500 ml CH4/g Cat*h as
usual reaction conditions was probably another reactor set up - lower amount of catalyst in the
bed and relative big diameter of reactor (i.e. small length/diameter ratio). That has strong
influence on the possibility of catalysts particles to contact with methane and lower VHSV
optimum is a logical consequence.
As mentioned before, TGA analysis of the formed coke showed two main mass losses. First
one occurs at approx. 425°C (698 K) and the second one at ca. 460°C (773 K). Figure 46
represents the temperatures of these two mass loss processes (represented as Peak 1 and Peak
2 respectively), total mass loss in wt.% (on secondary scale) as well as P1 to P2 ratio (on
secondary scale), which is ratio of Peak1 area to Peak 2 area. As it can be seen, the
temperature required to burn out the coke formed at MoCxOy-species (Peak 1) goes slowly
down or remains constant by increasing of WHSV level. In contrast to this coke formed on
the free Brönsted acid sites of HZSM-5 (Peak 2) moderately increases required burn out
temperatures at higher WHSV levels (from 445°C at 0.3 h-1 to 480°C at 4 h-1 - Figure 46).
This can be a sign for stronger coke formation on the free acid sites at the higher WHSV
levels. In order to verify this hypothesis an estimation of the DSC curve area of both mass
loss processes was done. The area was determined graphically as a peak height multiplied by
peak breadth (at a half of the peak height) on the DSC curve of coke TGA analysis. The ratio
of the area of Peak 1 to Peak 2 at the different WHSV levels is represented on Figure 46. It

Results and Discussion – Methane Dehydroaromatization 75
can be seen that P1/P2 ratio grows significantly by increasing of methane WHSV from 0.4 to
1.0 h-1 (grow from 1.2 to 2.2, respectively). Further WHSV increase from 1 to 4 h-1 leads to
the slow P1/P2 increase from 2.2 to 2.36. These observations show that coke formation on the
free acid sites becomes more significant at higher WHSV levels. It can be assumed that coke
formation increase by WHSV increasing is conditioned by its formation on free acid sites
until WHSV level of around 1.0 h-1. During further WHSV increasing coke is formed
proportionally on the free acid sites and on the MoCxOy active species. This seems to be an
important reason for the stronger catalyst deactivation at higher WHSV levels. Further
catalyst improvement should go in the direction of the reduction of the free acid sites amount
up to the minimum which is required for effective trimerization/aromatization of the
intermediate C2-species what should improve the catalyst service time.
A continuously strong increase of total coke amount was detected. At WHSV of 0.3 h-1 only
3.2 wt.% of coke was formed. At WHSV of 4.3 h-1 three times more coke was formed - 9.8
wt.%. The strong coke formation remains as main reason for the catalyst deactivation and
hence hindrance for the MDA industrial application so far.

Resu
lts and
Discu
ssion
– M
ethan
e Deh
ydro
aro
ma
tizatio
n
76
0
2
4
6
8
10
12
0 100 200 300 400 500 600TOS in min
For
mat
ion
rate
in m
mol
"C"/
g*h
WHSV=4.3, VHSV=6000
WHSV=2.0, VHSV=2800
WHSV=1.45, VHSV=2000
WHSV=1.0, VHSV=1400
WHSV=0.6, VHSV=840
WHSV=0.4, VHSV=550
WHSV=0.3, VHSV=420
Figure 44: Formation rate of aromatic at different WSHV levels, 700°C, VHSV in ml CH4/g cat*h
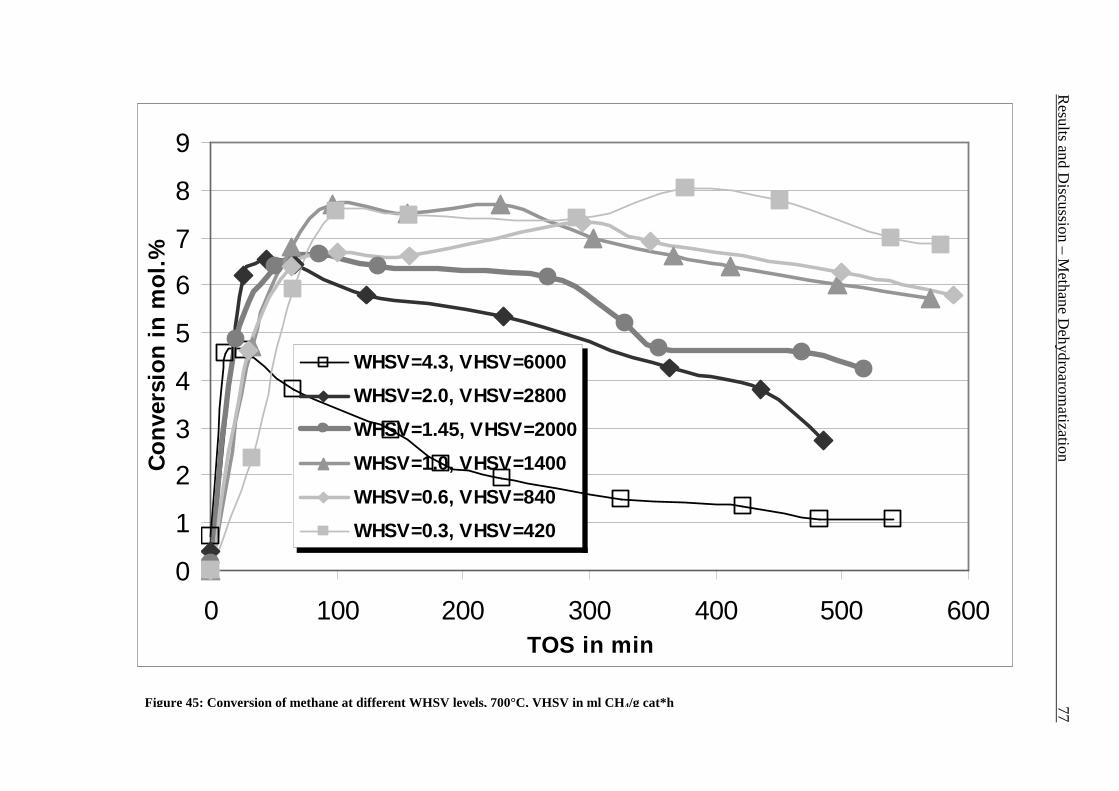
Resu
lts and
Discu
ssion
– M
ethan
e Deh
ydro
aro
ma
tizatio
n
77
0
1
2
3
4
5
6
7
8
9
0 100 200 300 400 500 600TOS in min
Con
vers
ion
in m
ol.%
WHSV=4.3, VHSV=6000
WHSV=2.0, VHSV=2800
WHSV=1.45, VHSV=2000
WHSV=1.0, VHSV=1400
WHSV=0.6, VHSV=840
WHSV=0.3, VHSV=420
Figure 45: Conversion of methane at different WHSV levels, 700°C, VHSV in ml CH4/g cat*h

Results and Discussion – Methane Dehydroaromatization 78
0
50
100
150
200
250
300
350
400
450
500
0 1 2 3 4 5 WHSV level in gCH4/gCat*h
Tem
pera
ture
in °C
1
2
3
4
5
6
7
8
9
10
Mas
s lo
ss in
wt.%
Peak 1
Peak 2
Mass loss
Figure 46: Temperatures of two mass loss processes (Peak 1 and Peak 2) and total mass loss in wt.%
0,0
0,5
1,0
1,5
2,0
2,5
3,0
3,5
4,0
4,5
0 1 2 3 4 5WHSV level in h -1
H/C
mol
ar r
atio
H/C mol
Figure 47: H/C molar ratio of the coke after reactions at different WHSV level.

Results and Discussion – Methane Dehydroaromatization 79
3.3.6 Temperature influence on catalytic performanc e
The temperature influence on the catalytic performance was investigated. The reactions were
performed in a fixed-bed reactor. As it can be seen in Figure 48, aromatic yield increases by
increasing of reaction temperature. Higher yields of aromatic were observed for 725°C and
800°C (maximum yields of 9 mol.% and 15 mol.%, respectively) than previously observed at
a reaction temperature of 700°C (maximum yield of 7 mol.%). The maxima of aromatic yields
given after approximately 60 to 90 minutes TOS. However, there is very strong drop in
product yield after 180 minutes TOS was detected. This fact was not observed in previous
results in fixed bed reactor.
The catalyst behavior changes markedly for reaction temperature of 850°C. A maximum yield
of 12.8 % was achieved, afterwards the aromatic formation declines significantly. After 160
minutes TOS, no further aromatic were formed. This catalyst was regenerated under normal
conditions, and put through a second experimental cycle. No aromatic were formed in this
second cycle.
Figure 49 represent the results of TGA analysis of the coked catalyst. The temperature of the
maximum mass loss and the amount of the burned coke are shown. The temperature needed to
burn out the coke increases with increased reaction temperature. That indicates on the
intensification of the formation of high-condensed nearly graphitic-like coke on the catalyst,
which can not be burned off. Also almost three times more coke have been formed at 800°C
than at 700°C. This may be the reason for rapid deactivation of the catalyst at 800°C (sharp
slope for 800°C curve after maximum) that can be seen on Figure 48.
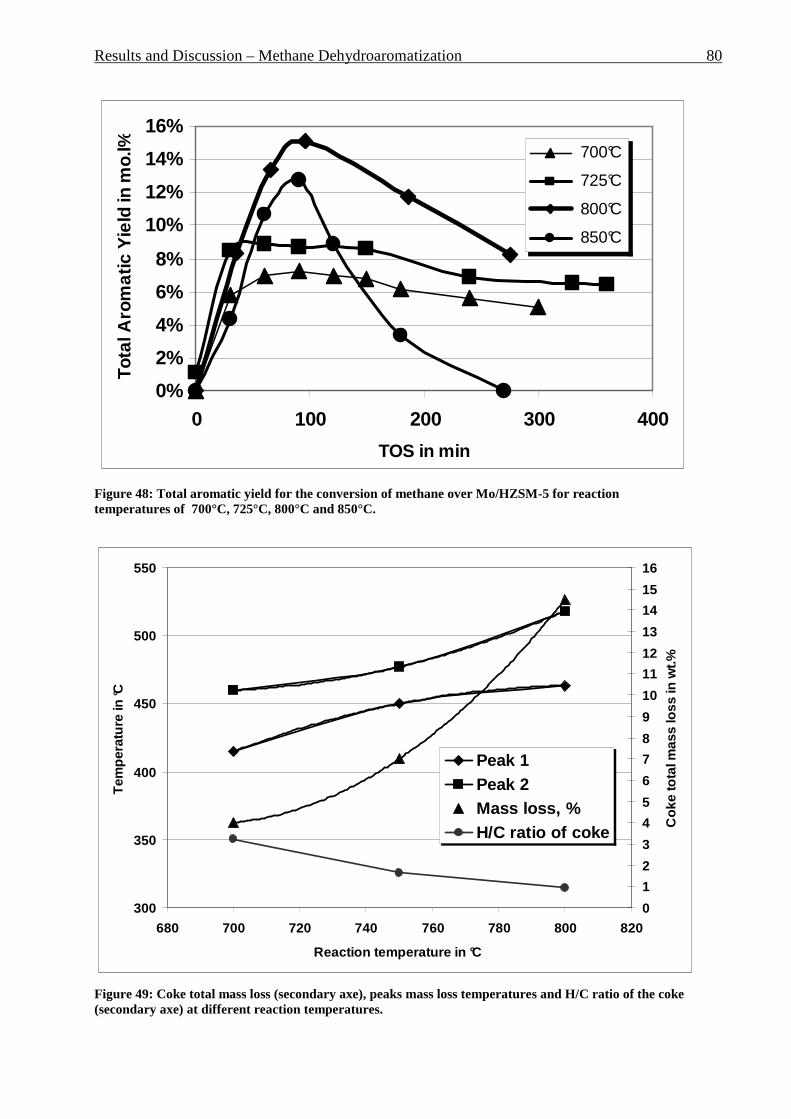
Results and Discussion – Methane Dehydroaromatization 80
0%
2%
4%
6%
8%
10%
12%
14%
16%
0 100 200 300 400
TOS in min
Tota
l Aro
mat
ic Y
ield
in m
o.l%
700°C
725°C
800°C
850°C
Figure 48: Total aromatic yield for the conversion of methane over Mo/HZSM-5 for reaction temperatures of 700°C, 725°C, 800°C and 850°C.
300
350
400
450
500
550
680 700 720 740 760 780 800 820
Reaction temperature in °C
Tem
pera
ture
in °C
0
1
2
3
4
5
6
7
8
9
10
11
12
13
14
15
16
Cok
e to
tal m
ass
loss
in w
t.%
Peak 1Peak 2Mass loss, %H/C ratio of coke
Figure 49: Coke total mass loss (secondary axe), peaks mass loss temperatures and H/C ratio of the coke (secondary axe) at different reaction temperatures.
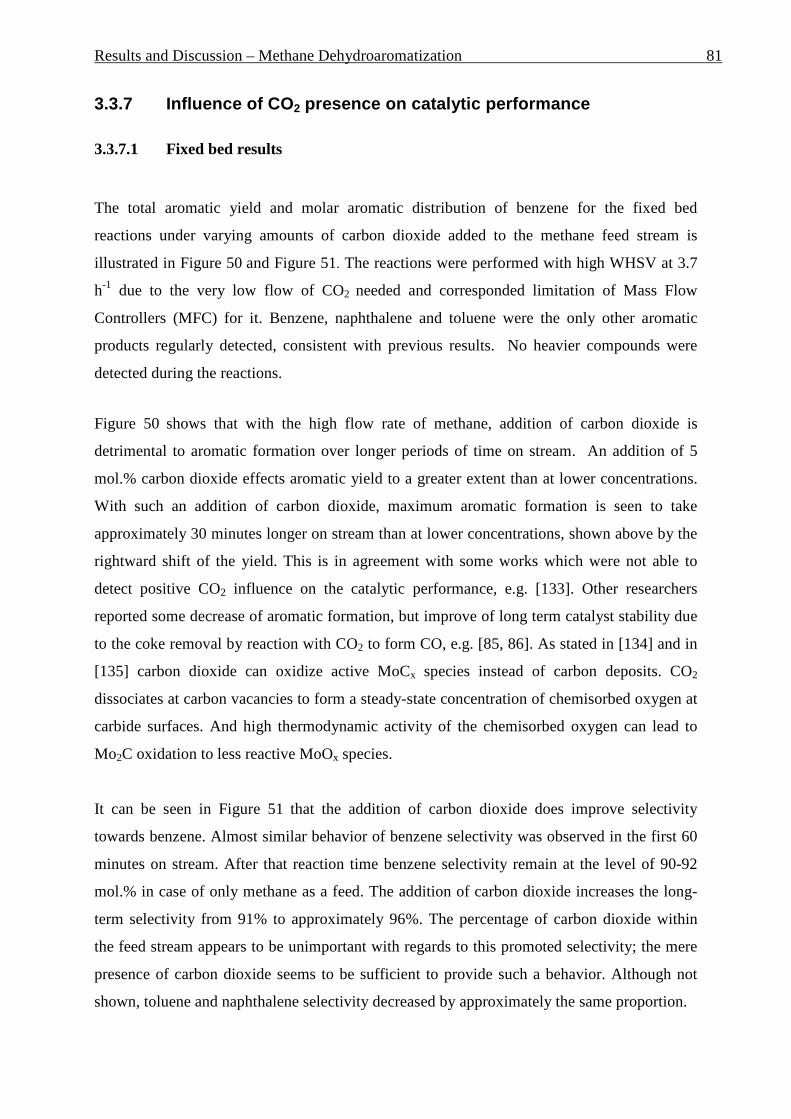
Results and Discussion – Methane Dehydroaromatization 81
3.3.7 Influence of CO 2 presence on catalytic performance
3.3.7.1 Fixed bed results
The total aromatic yield and molar aromatic distribution of benzene for the fixed bed
reactions under varying amounts of carbon dioxide added to the methane feed stream is
illustrated in Figure 50 and Figure 51. The reactions were performed with high WHSV at 3.7
h-1 due to the very low flow of CO2 needed and corresponded limitation of Mass Flow
Controllers (MFC) for it. Benzene, naphthalene and toluene were the only other aromatic
products regularly detected, consistent with previous results. No heavier compounds were
detected during the reactions.
Figure 50 shows that with the high flow rate of methane, addition of carbon dioxide is
detrimental to aromatic formation over longer periods of time on stream. An addition of 5
mol.% carbon dioxide effects aromatic yield to a greater extent than at lower concentrations.
With such an addition of carbon dioxide, maximum aromatic formation is seen to take
approximately 30 minutes longer on stream than at lower concentrations, shown above by the
rightward shift of the yield. This is in agreement with some works which were not able to
detect positive CO2 influence on the catalytic performance, e.g. [133]. Other researchers
reported some decrease of aromatic formation, but improve of long term catalyst stability due
to the coke removal by reaction with CO2 to form CO, e.g. [85, 86]. As stated in [134] and in
[135] carbon dioxide can oxidize active MoCx species instead of carbon deposits. CO2
dissociates at carbon vacancies to form a steady-state concentration of chemisorbed oxygen at
carbide surfaces. And high thermodynamic activity of the chemisorbed oxygen can lead to
Mo2C oxidation to less reactive MoOx species.
It can be seen in Figure 51 that the addition of carbon dioxide does improve selectivity
towards benzene. Almost similar behavior of benzene selectivity was observed in the first 60
minutes on stream. After that reaction time benzene selectivity remain at the level of 90-92
mol.% in case of only methane as a feed. The addition of carbon dioxide increases the long-
term selectivity from 91% to approximately 96%. The percentage of carbon dioxide within
the feed stream appears to be unimportant with regards to this promoted selectivity; the mere
presence of carbon dioxide seems to be sufficient to provide such a behavior. Although not
shown, toluene and naphthalene selectivity decreased by approximately the same proportion.

Results and Discussion – Methane Dehydroaromatization 82
0,0%
0,5%
1,0%
1,5%
2,0%
2,5%
3,0%
3,5%
4,0%
4,5%
5,0%
0 50 100 150 200 250 300 350 400TOS (min)
Tot
al A
rom
atic
Yie
ld (
mol
%)
5 mol% CO23 mol% CO2No CO2
Figure 50: Total aromatic yield for the conversion of methane over Mo/HZSM-5 for reaction conditions of 3.7g CH4/g Cat*h with varying amounts of carbon dioxide added to the methane feed. Each reaction has been performed with a fresh catalytic bed
80%
82%
84%
86%
88%
90%
92%
94%
96%
98%
100%
0 50 100 150 200 250 300 350 400TOS (min)
Ben
zene
Aro
mat
ic D
istr
ibut
ion
(mol
%)
5 mol% CO2
No CO2
3 mol% CO2
Figure 51: Molar aromatic distribution of benzene for reaction conditions of 3.7 gCH4/g cat*h with varying amounts of carbon dioxide added to the methane feed. Each reaction has been performed with a fresh catalytic bed
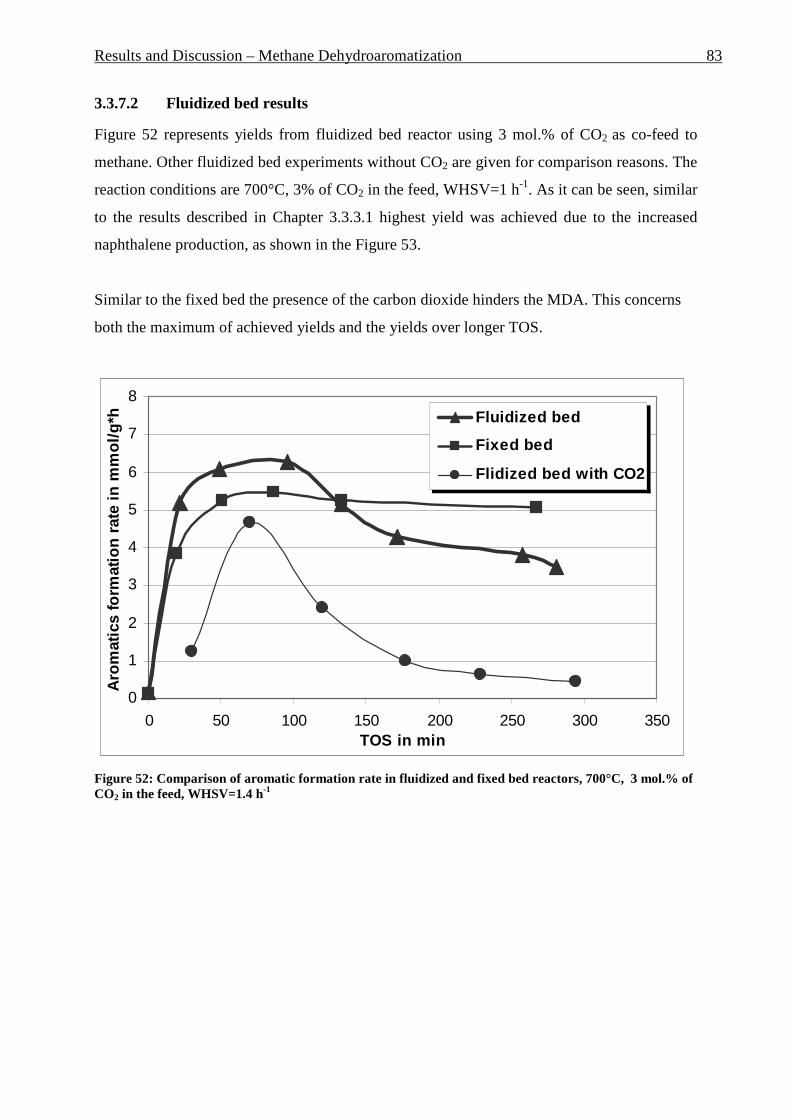
Results and Discussion – Methane Dehydroaromatization 83
3.3.7.2 Fluidized bed results
Figure 52 represents yields from fluidized bed reactor using 3 mol.% of CO2 as co-feed to
methane. Other fluidized bed experiments without CO2 are given for comparison reasons. The
reaction conditions are 700°C, 3% of CO2 in the feed, WHSV=1 h-1. As it can be seen, similar
to the results described in Chapter 3.3.3.1 highest yield was achieved due to the increased
naphthalene production, as shown in the Figure 53.
Similar to the fixed bed the presence of the carbon dioxide hinders the MDA. This concerns
both the maximum of achieved yields and the yields over longer TOS.
0
1
2
3
4
5
6
7
8
0 50 100 150 200 250 300 350TOS in min
Aro
mat
ics
form
atio
n ra
te in
mm
ol/g
*h
Fluidized bed
Fixed bed
Flidized bed with CO2
Figure 52: Comparison of aromatic formation rate in fluidized and fixed bed reactors, 700°C, 3 mol.% of CO2 in the feed, WHSV=1.4 h-1
Results and Discussion – Methane Dehydroaromatization 84
1,3
4,5
2,71,2
0,5
0,8
3,4
1,3
0,50,3 0,20,7
0
1
2
3
4
5
6
7
8
9
30 70 120 177 229 294
Time in min
Yie
ld in
mol
.%
Naphthalene
Toluene
Benzene
Figure 53: Aromatic distribution during the fluidiz ed bed experiment, 3 mol.% of CO2
3.3.8 Physical mixtures of Mo 2C and Mo/HZSM-5
Catalysts with the following Mo load were investigated:
- 2,5 wt.% Mo2C and HZSM-5 physical mixture,
- 4,0 wt.% Mo2C and HZSM-5 physical mixture,
- 5,5 wt.% Mo2C and HZSM-5 physical mixture,
The physical mixture of HZSM-5 with Mo2C load of 2.5 wt.% was tested at 700°C and
800°C. No catalytic activity was observed. However, a lot of coke formation was detected,
around 4.0 mass.% of the spent catalyst. The coke was burned out at wide temperature range
380-550°C.
The catalyst with 4 wt.% and 5,5 wt.% of Mo2C showed relative high activity level. The
Figure 54 represents the yields of reactions with different concentrations of Mo2C. The
reaction conditions are 700°C, WHSV=4.3 h-1, VHSV=6000 mlCH4/g Cat*h. It can be seen that
increased load of Mo2C (from 4 to 5.5 mass.%) leads to increase of methane conversion (i.e.
aromatic yield, because selectivity is approx. 100 %) from 1.5 to 3 mol.%. But the results are

Results and Discussion – Methane Dehydroaromatization 85
still below the activity of impregnated 4% Mo/HZSM-5 catalyst which converts around 4
mol.% methane after 30 min reaction time. The reason for moderate activity of Mo2C and
HZSM-5 physical mixtures probably is a limited contact of these substances by building of
active species (low specific surface of Mo2C particles). In case of impregnated catalyst this
problem is not present.
0
0,5
1
1,5
2
2,5
3
3,5
4
4,5
0 50 100 150 200 250 300
Time in min
Met
hane
con
vers
ion/
Aro
mat
ic y
ield
in m
ol.%
5,5% Mo2C4% Mo2C4% Mo/HZSM-5
Figure 54: Physical mixtures of Mo2C and HZSM-5, Mo/HZSM-5 results are given for comparison. Yields of aromatic in mol.% Conditions: methane WHSV=4.3 h-1, 700°C, aromatic selectivity=100%.
3.3.9 Conclusions and Outlook
Mo-HZSM-5 with is very selective catalyst for producing of aromatic. The liquid reaction
products contain up to 95% of benzene and toluene as well as naphthalene. Selectivity to
benzene increases at longer TOS to 90-95 mol.%. In case of fluidized bed reactions increased
up to 20% formation of the naphthalene was observed.
Higher yields of aromatic can be achieved in fluidized bed reactor (6.3 mol.% vs. 5.5 mol.%
compared with fixed bed reactor or increase of 15 %). Better mix behavior of fluidized bed
reactor favors the better gas-solid contact and facilitates the reaction. Furthermore better heat

Results and Discussion – Methane Dehydroaromatization 86
transfer in fluidized bed prevents the formation of “hotspots” – local overheated areas. It is
more important during oxidative regeneration of the catalyst. However, a strong particles size
reduction due to the attrition was observed and a long-term deactivation of the catalyst occurs
faster than in fixed bed. Significant changes in the catalyst properties and structure were
detected after use in the fluidized bed.
In case of improved mechanical stability of catalyst particles fluidized bed reactor can be
successful applied for performing of MDA reaction. It cannot be ruled out that moderate
increase of the reaction temperature will be possible also (up to around 750°C).
The optimum of methane WHSV is around 1.4 – 2.0 h-1 (approx. 2000 – 2800 ml CH4/g
cat*h). Higher WHSV lead to the fast deactivation of the catalyst due to the strong coke
formation. If continuous regeneration of the catalyst will be applied in fluidized bed reactor,
further increase of WHSV up to 4 h-1 (6000 ml CH4/g cat*h) and more will be possible.
The temperature has very strong influence on the reaction procedure. The catalyst becomes
active from approx. 973 K and continuously increases the aromatic production till approx.
1073 K. Indeed the strong coke formation was detected also, which results in faster catalyst
deactivation. At 850°C no further raise of aromatic yield can be observed and complete
deactivation of catalyst occurs. No regeneration is possible.
Carbon dioxide has a detrimental influence on the catalytic properties of Mo/HZSM-5.
The physical mixture of molybdenum carbide and HZSM-5 can be used for MDA but have
lower activity and long-term stability properties.
A positive effect of the catalyst hydrogen pretreatment could not be detected.
Further optimization of the reaction parameter as well of the catalyst properties is necessary to
perform MDA reaction economically in the large industrial scale.
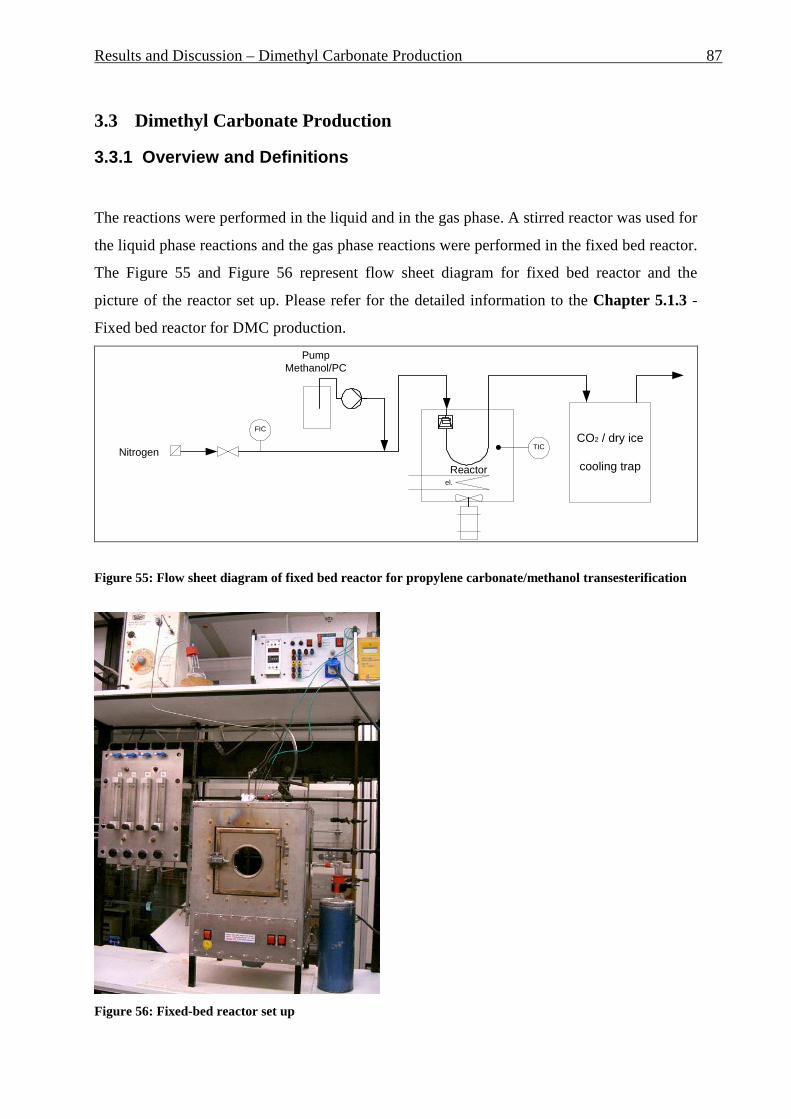
Results and Discussion – Dimethyl Carbonate Production 87
3.3 Dimethyl Carbonate Production
3.3.1 Overview and Definitions
The reactions were performed in the liquid and in the gas phase. A stirred reactor was used for
the liquid phase reactions and the gas phase reactions were performed in the fixed bed reactor.
The Figure 55 and Figure 56 represent flow sheet diagram for fixed bed reactor and the
picture of the reactor set up. Please refer for the detailed information to the Chapter 5.1.3 -
Fixed bed reactor for DMC production.
el.
Reactor
TIC
FIC
Nitrogen
PumpMethanol/PC
CO2 / dry ice
cooling trap
Figure 55: Flow sheet diagram of fixed bed reactor for propylene carbonate/methanol transesterification
Figure 56: Fixed-bed reactor set up
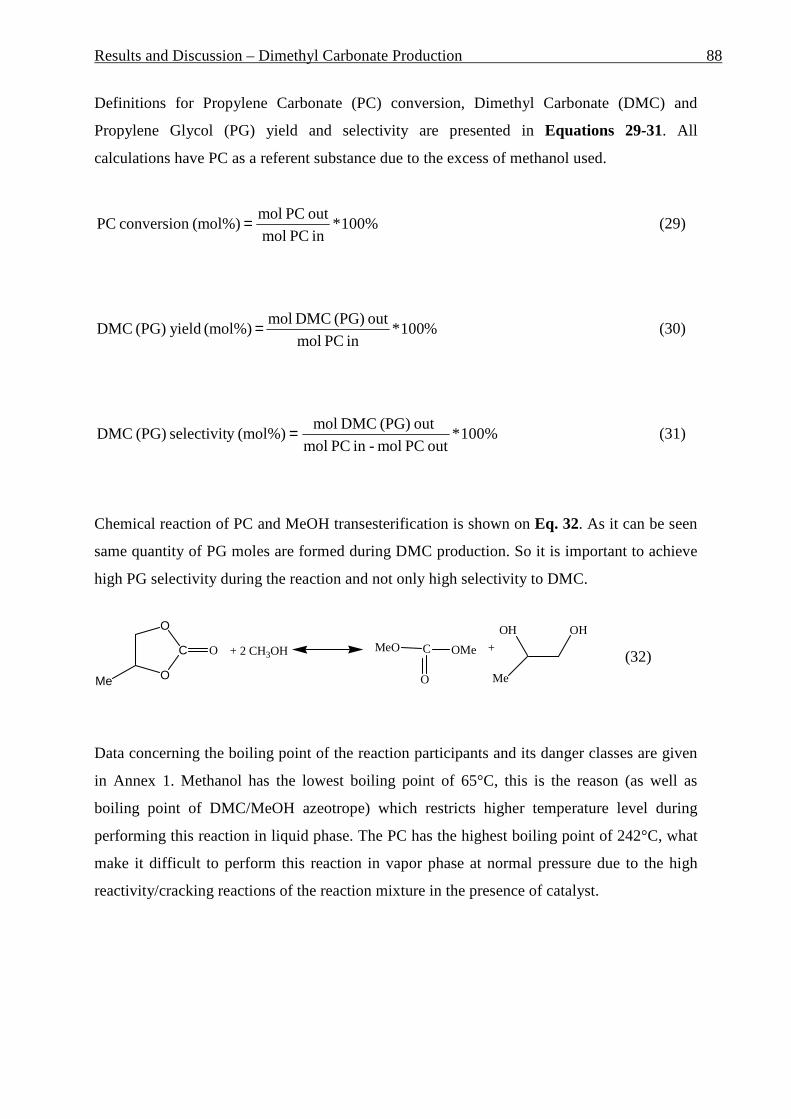
Results and Discussion – Dimethyl Carbonate Production 88
Definitions for Propylene Carbonate (PC) conversion, Dimethyl Carbonate (DMC) and
Propylene Glycol (PG) yield and selectivity are presented in Equations 29-31. All
calculations have PC as a referent substance due to the excess of methanol used.
%100*in PC mol
out PC mol (mol%) conversion PC = (29)
%100*in PC mol
out (PG) DMC mol (mol%) yield (PG) DMC = (30)
%100*out PC mol -in PC mol
out (PG) DMC mol (mol%)y selectivit (PG) DMC = (31)
Chemical reaction of PC and MeOH transesterification is shown on Eq. 32. As it can be seen
same quantity of PG moles are formed during DMC production. So it is important to achieve
high PG selectivity during the reaction and not only high selectivity to DMC.
(32)
Data concerning the boiling point of the reaction participants and its danger classes are given
in Annex 1. Methanol has the lowest boiling point of 65°C, this is the reason (as well as
boiling point of DMC/MeOH azeotrope) which restricts higher temperature level during
performing this reaction in liquid phase. The PC has the highest boiling point of 242°C, what
make it difficult to perform this reaction in vapor phase at normal pressure due to the high
reactivity/cracking reactions of the reaction mixture in the presence of catalyst.
O
C
O
O
Me
MeO C OMe
O
OH OH
Me
+ 2 CH3OH +
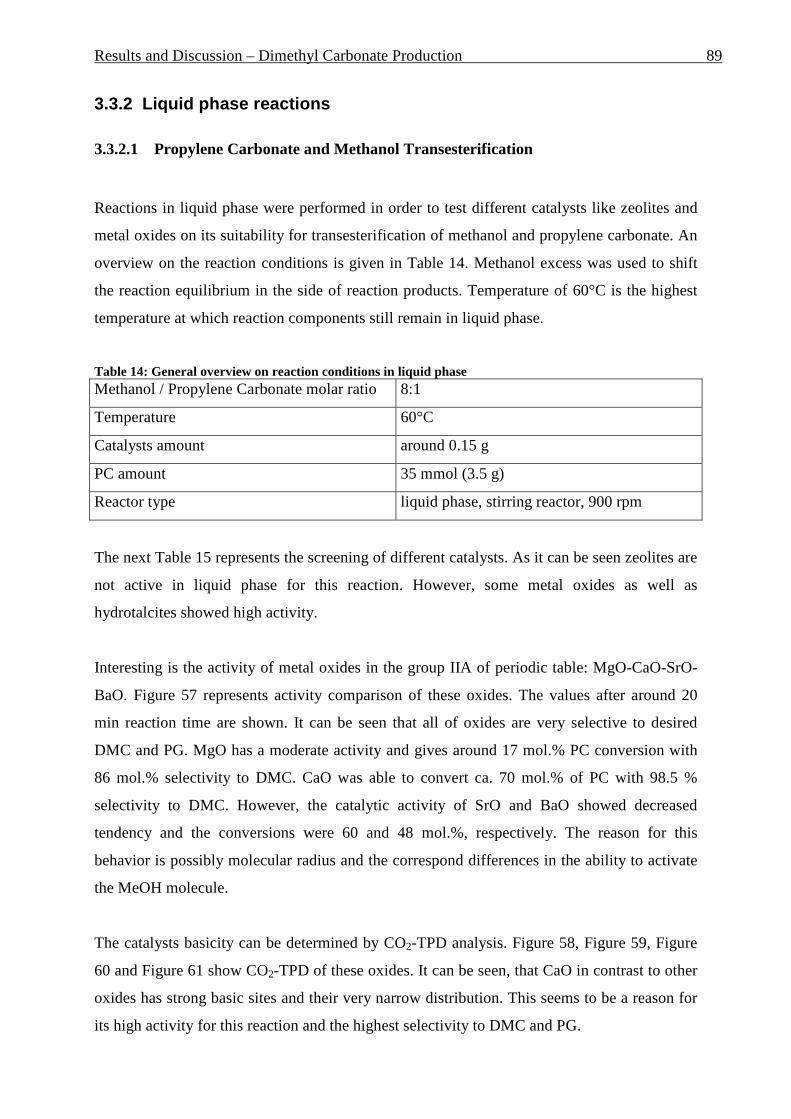
Results and Discussion – Dimethyl Carbonate Production 89
3.3.2 Liquid phase reactions
3.3.2.1 Propylene Carbonate and Methanol Transesterification
Reactions in liquid phase were performed in order to test different catalysts like zeolites and
metal oxides on its suitability for transesterification of methanol and propylene carbonate. An
overview on the reaction conditions is given in Table 14. Methanol excess was used to shift
the reaction equilibrium in the side of reaction products. Temperature of 60°C is the highest
temperature at which reaction components still remain in liquid phase.
Table 14: General overview on reaction conditions in liquid phase Methanol / Propylene Carbonate molar ratio 8:1
Temperature 60°C
Catalysts amount around 0.15 g
PC amount 35 mmol (3.5 g)
Reactor type liquid phase, stirring reactor, 900 rpm
The next Table 15 represents the screening of different catalysts. As it can be seen zeolites are
not active in liquid phase for this reaction. However, some metal oxides as well as
hydrotalcites showed high activity.
Interesting is the activity of metal oxides in the group IIA of periodic table: MgO-CaO-SrO-
BaO. Figure 57 represents activity comparison of these oxides. The values after around 20
min reaction time are shown. It can be seen that all of oxides are very selective to desired
DMC and PG. MgO has a moderate activity and gives around 17 mol.% PC conversion with
86 mol.% selectivity to DMC. CaO was able to convert ca. 70 mol.% of PC with 98.5 %
selectivity to DMC. However, the catalytic activity of SrO and BaO showed decreased
tendency and the conversions were 60 and 48 mol.%, respectively. The reason for this
behavior is possibly molecular radius and the correspond differences in the ability to activate
the MeOH molecule.
The catalysts basicity can be determined by CO2-TPD analysis. Figure 58, Figure 59, Figure
60 and Figure 61 show CO2-TPD of these oxides. It can be seen, that CaO in contrast to other
oxides has strong basic sites and their very narrow distribution. This seems to be a reason for
its high activity for this reaction and the highest selectivity to DMC and PG.
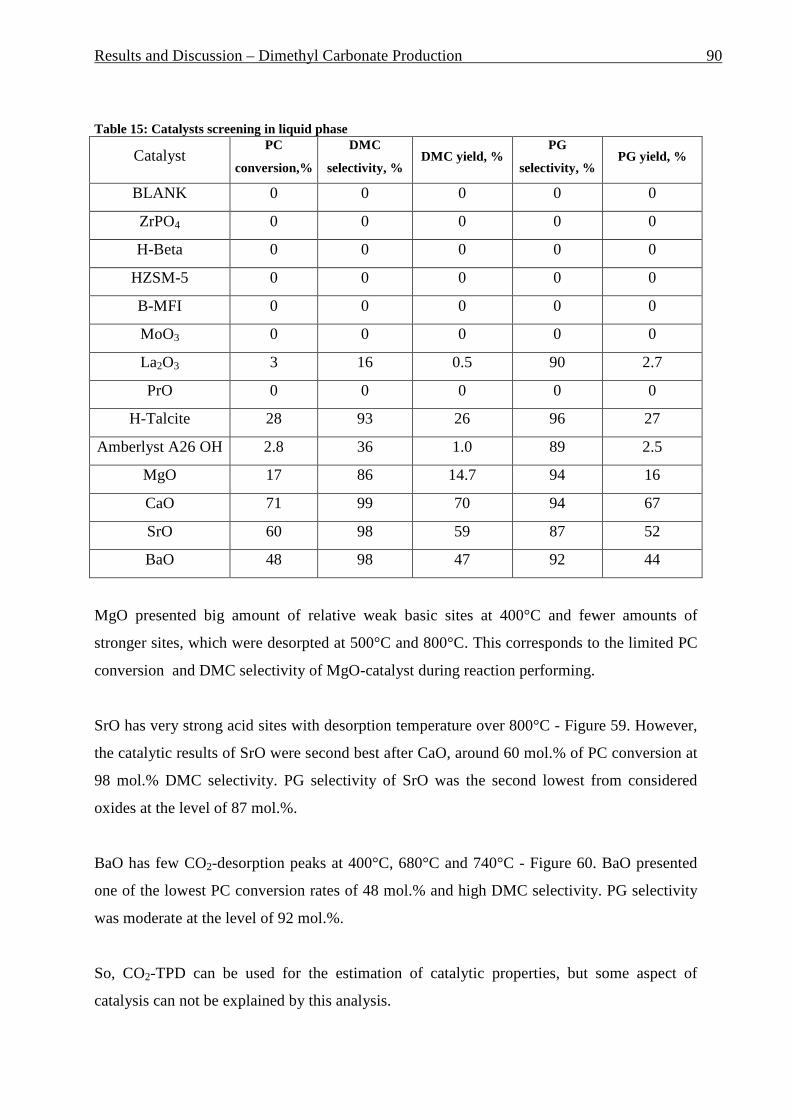
Results and Discussion – Dimethyl Carbonate Production 90
Table 15: Catalysts screening in liquid phase
Catalyst PC
conversion,%
DMC
selectivity, % DMC yield, %
PG
selectivity, % PG yield, %
BLANK 0 0 0 0 0
ZrPO4 0 0 0 0 0
H-Beta 0 0 0 0 0
HZSM-5 0 0 0 0 0
B-MFI 0 0 0 0 0
MoO3 0 0 0 0 0
La2O3 3 16 0.5 90 2.7
PrO 0 0 0 0 0
H-Talcite 28 93 26 96 27
Amberlyst A26 OH 2.8 36 1.0 89 2.5
MgO 17 86 14.7 94 16
CaO 71 99 70 94 67
SrO 60 98 59 87 52
BaO 48 98 47 92 44
MgO presented big amount of relative weak basic sites at 400°C and fewer amounts of
stronger sites, which were desorpted at 500°C and 800°C. This corresponds to the limited PC
conversion and DMC selectivity of MgO-catalyst during reaction performing.
SrO has very strong acid sites with desorption temperature over 800°C - Figure 59. However,
the catalytic results of SrO were second best after CaO, around 60 mol.% of PC conversion at
98 mol.% DMC selectivity. PG selectivity of SrO was the second lowest from considered
oxides at the level of 87 mol.%.
BaO has few CO2-desorption peaks at 400°C, 680°C and 740°C - Figure 60. BaO presented
one of the lowest PC conversion rates of 48 mol.% and high DMC selectivity. PG selectivity
was moderate at the level of 92 mol.%.
So, CO2-TPD can be used for the estimation of catalytic properties, but some aspect of
catalysis can not be explained by this analysis.
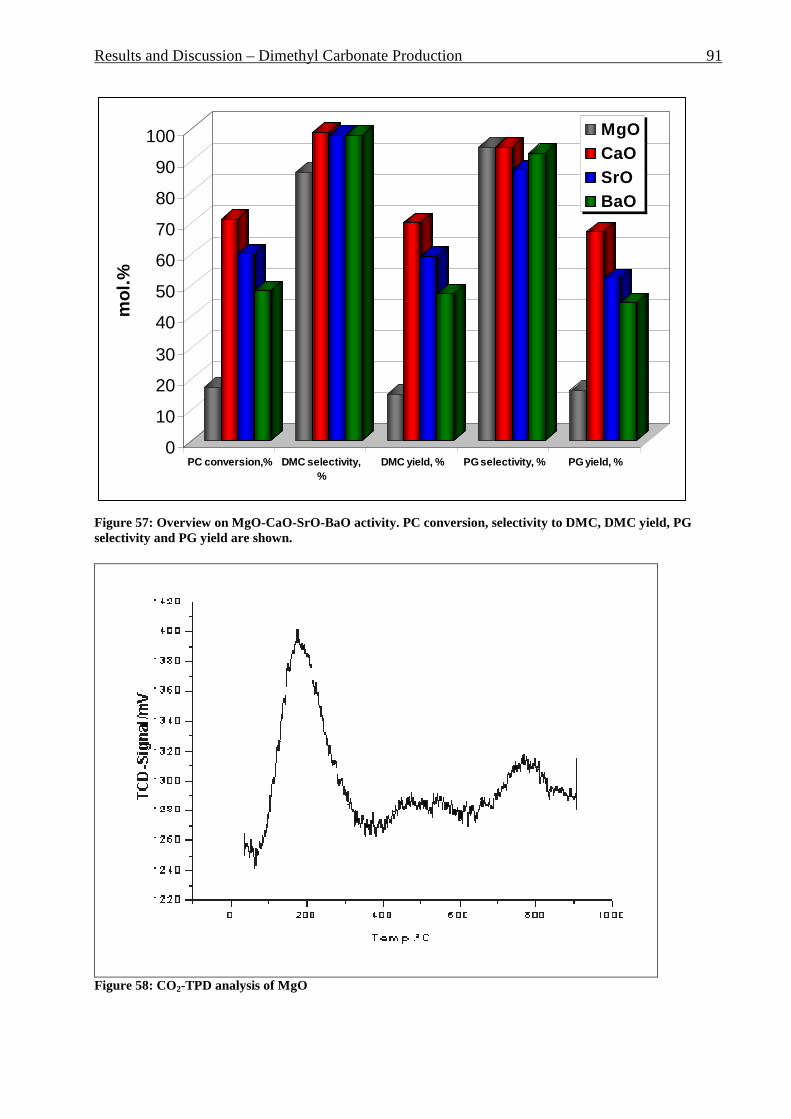
Results and Discussion – Dimethyl Carbonate Production 91
0
10
20
30
40
50
60
70
80
90
100m
ol.%
PC conversion,% DMC selectivity,%
DMC yield, % PG selectivity, % PG yield, %
MgOCaOSrOBaO
Figure 57: Overview on MgO-CaO-SrO-BaO activity. PC conversion, selectivity to DMC, DMC yield, PG selectivity and PG yield are shown.
Figure 58: CO2-TPD analysis of MgO
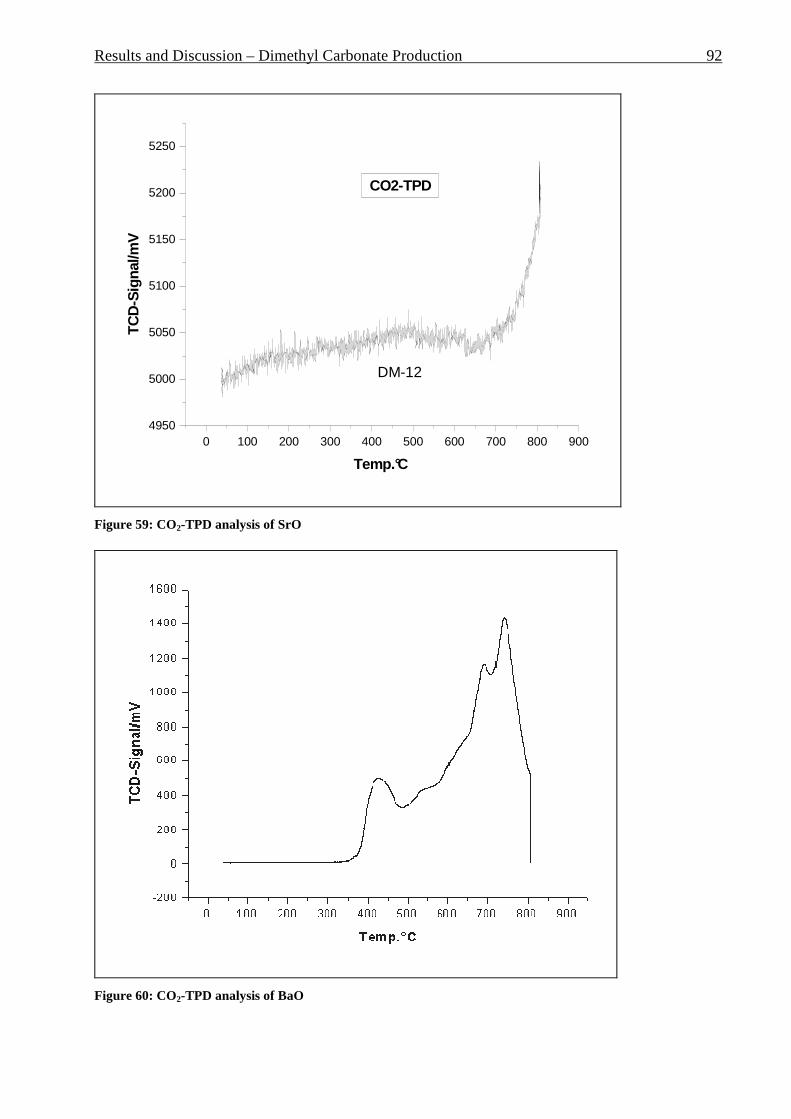
Results and Discussion – Dimethyl Carbonate Production 92
0 100 200 300 400 500 600 700 800 9004950
5000
5050
5100
5150
5200
5250
DM-12
TCD
-Sig
nal/m
V
Temp.°C
CO2-TPD
Figure 59: CO2-TPD analysis of SrO
Figure 60: CO2-TPD analysis of BaO

Results and Discussion – Dimethyl Carbonate Production 93
Figure 61: CO2-TPD analysis of CaO
3.3.2.2 Use of superbases Na/NaOH/MgO
The superbases Na/NaOH/MgO were tested as catalysts for the PC/methanol
transesterification. Very high catalytic activity was detected. No other products apart desired
DMC and PG were detected in the reaction mixture (and unconverted PC and MeOH). So
selectivity to DMC and PG was close to 100%.
Different content of Na and NaOH was used to find optimal concentrations of these
ingredients in the superbase. “Design Expert 5” program was used to optimize these
parameters and make visualization of used concentrations and its effect. The response surface
with 3 level factorial design was built finally. Both cubic and quadratic models were used.
First, an experiment table was made to determine experiments to be performed. Also some
additional experiments were performed from redundant reasons. These additional experiments
can be integrated in the final response surface and make the entire results more precise. All
experiments as well as “response” – yield of DMC are shown in Table 16: Experiments list

Results and Discussion – Dimethyl Carbonate Production 94
for building of response surface. Na and NaOH concentrations are given in mmol substance
per g support (MgO).
Table 16: Experiments list for building of response surface, DMC selectivity around 100 mol.% for all experiments
Experiment No.
NaOH Na PC conversion / DMC
yield mmol/g mmol/g mol.% 1 4 0 50 2 0 2 31,5 3 0 4 48,8 4 0 0 10 5 2 4 71,1 6 2 2 50 7 4 2 50,2 8 2 2 50 9 4 4 72 10 2,5 0 20 11 2 2 50 12 2 2 50 13 2 2 50 14 2,5 2,2 55 15 0 4,3 52 16 1,3 3,5 49 17 2 3,5 69 18 1 1 20
After that, response surfaces can be formed by using “Design Expert 5” software. Figure 62
represents response surfaces using quadratic model. Axis X is the NaOH concentration in superbase
and axis Y – these of Na. Responses are shown in form of contours. These contours represent
combination of both factors – Na and NaOH concentrations – that result in the same level of DMC
yield.
As it can be seen DMC yield grows continuously by increasing of Na and/or NaOH concentrations in
the superbase. Also it can be realized that at higher NaOH and Na concentrations (2-4 mmol/g)
stronger influence of Na concentration can be seen. This means effect of small increase of Na is higher
then effect of same increase of NaOH content. Graphically this is shown by curves tendency to be
more horizontally at higher concentrations.
Next Figure 63 represents the response surface in a cubic model. The general tendency of factor
influence is the same as in quadratic model, but cubic model is more precise. As it can be seen, at
higher concentrations further increase of NaOH doesn’t improve DMC yield. E.g. DMC yields at the
point 2:4 (NaOH:Na concentration) and 4:4 are equal. Contour 72 % represents maximum of the real

Results and Discussion – Dimethyl Carbonate Production 95
yields, which can be achieved in liquid phase with 8:1 methanol excess. Further increase of Na and
NaOH don’t lead to an yield (i.e. PC conversion, selectivity remain around 100 mol.%) improvement.
Figure 62: Response surface using quadratic model Figure 63: Response surface using cubic model
Attempts to reuse the catalyst after reaction resulted in very low yields at the level of 3-5
mol.%. This is an indication that Na-species in the catalyst are labile and are been leached
during reaction. And Mg-framework without Na-species leads only to a limited PC
conversions at high selectivities around 86 mol.% - Table 15: Catalysts screening in liquid
phaseTable 15. So it can be assumed that catalysis had a homogeneous character because of
the leaching of Na-species from the MgO support.
3.3.2.3 Propylene Carbonate and Phenol Transesterification
Study about possibility of transesterification of PC and PhOH, as shown in Equation 33, was
carried out. In this reaction propylene carbonate reacts with phenol to diphenyl carbonate
(DPC) and propylene glycol.
(33)
O
C
O
O
Me
PhO C OPh
O
OH OH
Me
+ 2 PhOH +

Results and Discussion – Dimethyl Carbonate Production 96
Table 17 represents the reaction conditions.
Table 17: Reaction conditions of PC-PhOH transesterification Phenol / Propylene carbonate ratio 8:1
Temperature 60°C
Catalysts amount 0.15 g
PC amount 35 mmol (3.5 g)
Reactor type liquid phase, stirring reactor, 900 rpm
Different catalysts which performed good activity in PC / MeOH transesterification were
tested. No PC conversion and/or DPC and PG in the reaction products were detected. Table
18 gives overview on used catalysts and results. The possible reason for such behavior of
catalyst can be both a steric hindrance of big PhOH molecule and its unfavorable chemical
activity in the first reaction step during PhOH activation by the catalyst (as in Chapter 2.5.4
described). Also other researchers, e.g. [130] pointed out that direct synthesis of DPC from
EC and PhOH is not thermodynamically favorable (and reactions with EC are easier to
perform, than with PC – Chapter 2.4.2).
Table 18: Catalyst used for PC/PhOH transesterification and results Catalyst PC conversion,% DMC yield, % PG yield, %
Blank 0 0 0
CaO 60°C 0 0 0
BaO 120°C 0 0 0
HT 120°C 0 0 0
BMFI 300°C, 30 min 0 0 0
3.3.3 Gas phase reactions
3.3.3.1 Definitions and reaction conditions
Most of the data about reaction conditions are shown in Table 19. The molar excess of
methanol was 6 (molar ratio MeOH/PC = 6:1), a temperature range from 250°C to 350°C was
used because of very high boiling point of PC - 242°C as in Annex 1 presented. Thus, the
reactions had have to be performed over this temperature to be sure, that there are complete
vapor phase conditions present. At the temperatures over 350°C strong side products
formation was detected, vide infra.
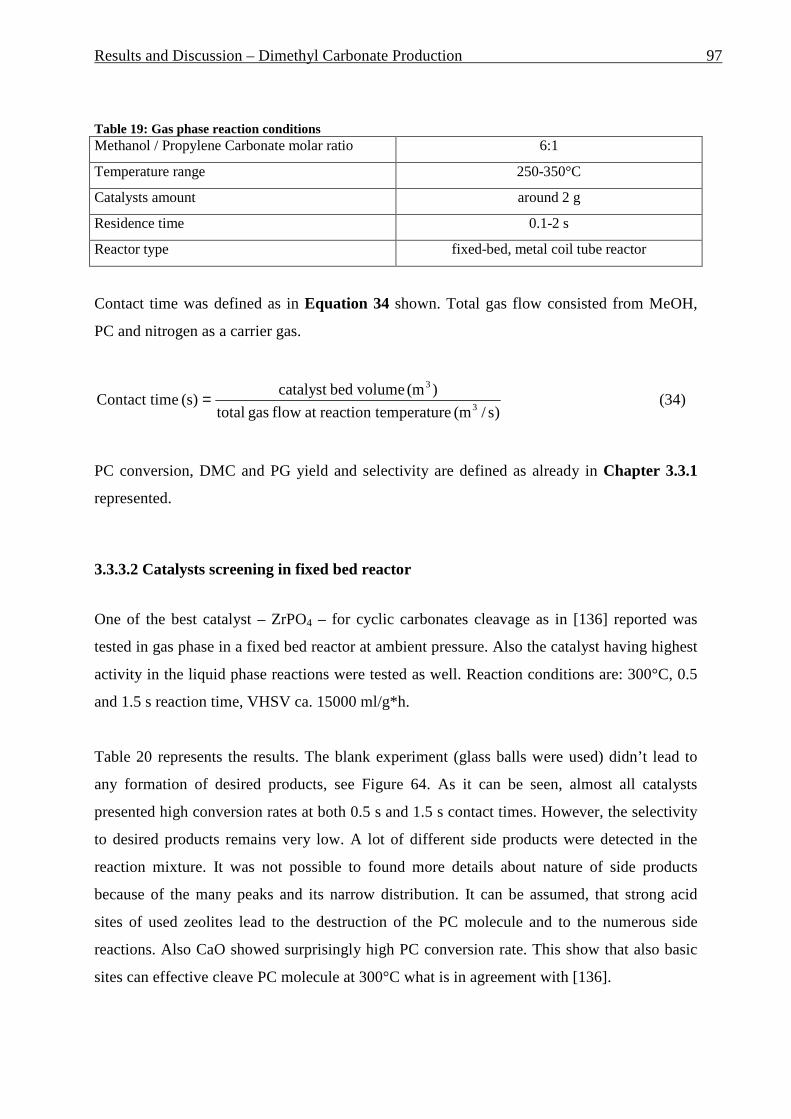
Results and Discussion – Dimethyl Carbonate Production 97
Table 19: Gas phase reaction conditions Methanol / Propylene Carbonate molar ratio 6:1
Temperature range 250-350°C
Catalysts amount around 2 g
Residence time 0.1-2 s
Reactor type fixed-bed, metal coil tube reactor
Contact time was defined as in Equation 34 shown. Total gas flow consisted from MeOH,
PC and nitrogen as a carrier gas.
)s/(m emperaturereaction tat flow gas total
)(m volumebedcatalyst (s) meContact ti
3
3
= (34)
PC conversion, DMC and PG yield and selectivity are defined as already in Chapter 3.3.1
represented.
3.3.3.2 Catalysts screening in fixed bed reactor
One of the best catalyst – ZrPO4 – for cyclic carbonates cleavage as in [136] reported was
tested in gas phase in a fixed bed reactor at ambient pressure. Also the catalyst having highest
activity in the liquid phase reactions were tested as well. Reaction conditions are: 300°C, 0.5
and 1.5 s reaction time, VHSV ca. 15000 ml/g*h.
Table 20 represents the results. The blank experiment (glass balls were used) didn’t lead to
any formation of desired products, see Figure 64. As it can be seen, almost all catalysts
presented high conversion rates at both 0.5 s and 1.5 s contact times. However, the selectivity
to desired products remains very low. A lot of different side products were detected in the
reaction mixture. It was not possible to found more details about nature of side products
because of the many peaks and its narrow distribution. It can be assumed, that strong acid
sites of used zeolites lead to the destruction of the PC molecule and to the numerous side
reactions. Also CaO showed surprisingly high PC conversion rate. This show that also basic
sites can effective cleave PC molecule at 300°C what is in agreement with [136].
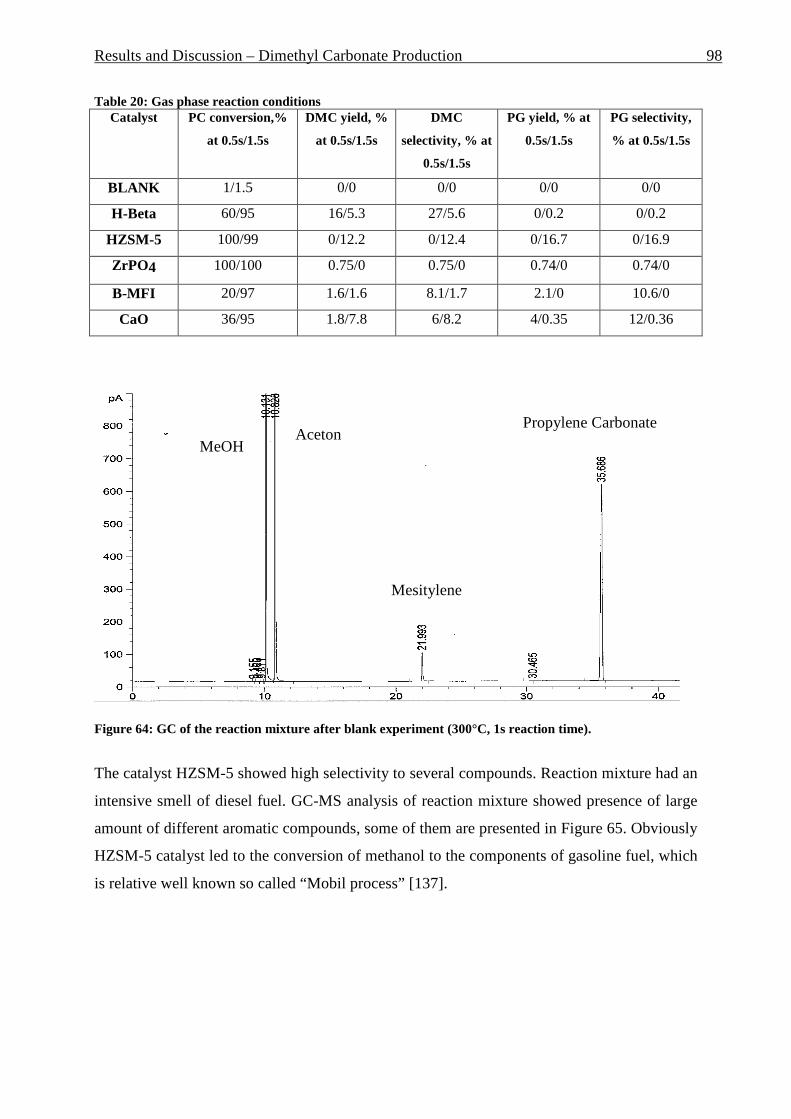
Results and Discussion – Dimethyl Carbonate Production 98
Table 20: Gas phase reaction conditions Catalyst PC conversion,%
at 0.5s/1.5s
DMC yield, %
at 0.5s/1.5s
DMC
selectivity, % at
0.5s/1.5s
PG yield, % at
0.5s/1.5s PG selectivity,
% at 0.5s/1.5s
BLANK 1/1.5 0/0 0/0 0/0 0/0
H-Beta 60/95 16/5.3 27/5.6 0/0.2 0/0.2
HZSM-5 100/99 0/12.2 0/12.4 0/16.7 0/16.9
ZrPO4 100/100 0.75/0 0.75/0 0.74/0 0.74/0
B-MFI 20/97 1.6/1.6 8.1/1.7 2.1/0 10.6/0
CaO 36/95 1.8/7.8 6/8.2 4/0.35 12/0.36
Figure 64: GC of the reaction mixture after blank experiment (300°C, 1s reaction time).
The catalyst HZSM-5 showed high selectivity to several compounds. Reaction mixture had an
intensive smell of diesel fuel. GC-MS analysis of reaction mixture showed presence of large
amount of different aromatic compounds, some of them are presented in Figure 65. Obviously
HZSM-5 catalyst led to the conversion of methanol to the components of gasoline fuel, which
is relative well known so called “Mobil process” [137].
Aceton MeOH
Mesitylene
Propylene Carbonate
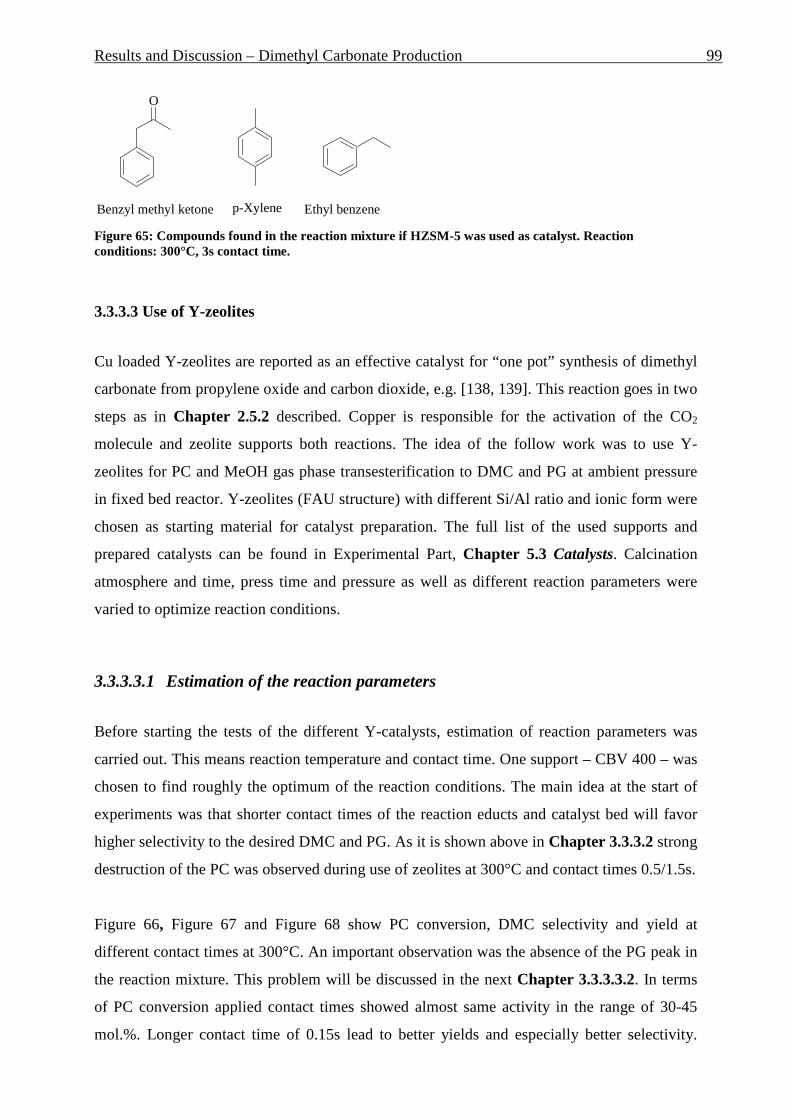
Results and Discussion – Dimethyl Carbonate Production 99
O
Benzyl methyl ketone Ethyl benzenep-Xylene Figure 65: Compounds found in the reaction mixture if HZSM-5 was used as catalyst. Reaction conditions: 300°C, 3s contact time.
3.3.3.3 Use of Y-zeolites
Cu loaded Y-zeolites are reported as an effective catalyst for “one pot” synthesis of dimethyl
carbonate from propylene oxide and carbon dioxide, e.g. [138, 139]. This reaction goes in two
steps as in Chapter 2.5.2 described. Copper is responsible for the activation of the CO2
molecule and zeolite supports both reactions. The idea of the follow work was to use Y-
zeolites for PC and MeOH gas phase transesterification to DMC and PG at ambient pressure
in fixed bed reactor. Y-zeolites (FAU structure) with different Si/Al ratio and ionic form were
chosen as starting material for catalyst preparation. The full list of the used supports and
prepared catalysts can be found in Experimental Part, Chapter 5.3 Catalysts. Calcination
atmosphere and time, press time and pressure as well as different reaction parameters were
varied to optimize reaction conditions.
3.3.3.3.1 Estimation of the reaction parameters
Before starting the tests of the different Y-catalysts, estimation of reaction parameters was
carried out. This means reaction temperature and contact time. One support – CBV 400 – was
chosen to find roughly the optimum of the reaction conditions. The main idea at the start of
experiments was that shorter contact times of the reaction educts and catalyst bed will favor
higher selectivity to the desired DMC and PG. As it is shown above in Chapter 3.3.3.2 strong
destruction of the PC was observed during use of zeolites at 300°C and contact times 0.5/1.5s.
Figure 66, Figure 67 and Figure 68 show PC conversion, DMC selectivity and yield at
different contact times at 300°C. An important observation was the absence of the PG peak in
the reaction mixture. This problem will be discussed in the next Chapter 3.3.3.3.2. In terms
of PC conversion applied contact times showed almost same activity in the range of 30-45
mol.%. Longer contact time of 0.15s lead to better yields and especially better selectivity.

Results and Discussion – Dimethyl Carbonate Production 100
Around 16 mol.% DMC selectivity was observed at 0.15 s contact time against only 8 mol.%
if 0.0.25 s contact time was used, see Figure 67.
So some longer residence time was used for the next experiments at 330°C. Figure 69, Figure
70 and Figure 71 represent the results. Again the longest contact time of 0.35 s resulted in the
best DMC yield. The selectivity to DMC was also higher at longer contact time, except the
shortest 0.03s. In this case some increase of DMC selectivity was observed, Figure 69.
However, the lowest PC conversion at this contact time was detected (less than 10 mol.%
after 80 min TOS). For other contact times continuously reducing of PC conversion was
detected. After 80 min TOS around 50 mol.% of PC conversion was observed. However, at
the reaction start up to 90 mol.% PC conversion was found for reaction with 0.35 s contact
time and around 65 mol.% for the 0.08 s. So deactivation of the catalyst equalizes the
differences in the PC conversion after around 80 min TOS.
0
10
20
30
40
50
60
0 20 40 60 80 100Reaction time in min
PC
con
vers
ion
in m
ol.%
0.15s
0.06s
0.025s
Figure 66: PC conversion at different contact times, 300°C

Results and Discussion – Dimethyl Carbonate Production 101
0
2
4
6
8
10
12
14
16
18
0 20 40 60 80 100Reaction time in min
DM
C s
elec
tivity
in m
ol.%
0.15s
0.06s
0.025s
Figure 67: DMC selectivity at different contact times, 300°C
0123456789
0 20 40 60 80 100Reaction time in min
DM
C y
ield
in m
ol.%
0.15s
0.06s
0.025s
Figure 68: DMC yield at different contact times, 300°C

Results and Discussion – Dimethyl Carbonate Production 102
0
10
20
30
40
50
60
70
80
90
100
0 20 40 60 80 100Reaction time in min
PC
con
vers
ion
in m
ol.%
0.35s
0.15s
0.08s
0.03s
Figure 69: PC conversion at different contact times, 330°C
0
5
10
15
20
25
30
35
40
0 20 40 60 80 100Reaction time in min
DM
C s
elec
tivity
in m
ol.%
0.35s
0.15s
0.08s
0.03s
Figure 70: DMC selectivity at different contact times, 330°C

Results and Discussion – Dimethyl Carbonate Production 103
0
2
4
6
8
10
12
14
16
18
0 20 40 60 80 100Reaction time in min
DM
C y
ield
in m
ol.%
0.35s
0.15s
0.08s
0.03s
Figure 71: DMC yield at different contact times, 330°C
The next step was the estimation of the reaction temperature. The used contact time was 0.15s
and three temperatures were tested: 300°C, 330°C and 370°C.
The following Figure 72, Figure 73 and Figure 74 represent PC conversion, DMC yield and
selectivity, respectively. It can be seen, that PC conversion is relative stable at 300°C, but at
330°C it decreases more sharply and at 370°C this process becomes dramatic character. The
selectivity to DMC drops continuously at 300°C. At 330°C it has an maximum at 15 mol.%.
However, surprisingly high selectivities were observed at higher temperatures. The
temperature and reaction time have positive effect on DMC selectivity, at 370°C around 22
mol.% of DMC was detected in the reaction mixture. In contrast to the selectivity at lower
temperatures, it seems that catalyst at 370°C is too active at starting the reaction. It converts
almost all of PC to the side products at the beginning. And after that some deactivation occurs
which leads to the increase of the DMC formation. However, in terms of yield DMC
formation increases continuously at 370°C, see Figure 74.
So optimal reaction temperature seems to lie in the range 330-350°C and contact time 0.2-0.5
seconds. These parameters will be used for the comparison of different catalysts and for fine-
tuning of the reaction conditions.

Results and Discussion – Dimethyl Carbonate Production 104
0
10
20
30
40
50
60
70
80
90
100
0 20 40 60 80 100Reaction time in min
Con
vers
ion
in m
ol.%
300°C
330°C
370°C
Figure 72: PC conversion at different temperatures, 0.15 s contact time
0
5
10
15
20
25
0 20 40 60 80 100Reaction time in min
Sel
ectiv
ity in
mol
.%
300°C
330°C
370°C
Figure 73: DMC selectivity at different temperatures, 0.15 s contact time

Results and Discussion – Dimethyl Carbonate Production 105
0
1
2
3
4
5
6
7
8
9
0 20 40 60 80 100Reaction time in min
Yie
ld in
mol
.% 300°C
330°C
370°C
Figure 74: DMC yield at different temperatures, 0.15 s contact time
3.3.3.3.2 PG absence in the reaction mixture
No PG could be detected in the reaction mixture. In order to detect stability of PG at higher
temperatures the following experiments were performed: PG and DMC (molar ratio 1:1) as
starting reaction material, temperatures 200, 250 and 300°C, catalysts: H-Beta-, BMFI- and
Y-zeolite. Reaction conditions: contact time 0.1s, VHSV=18000 ml/g*h. Table 21 represents
the results. As it can be seen, already reaction temperatures of 200°C lead to the complete PG
destruction if H-Beta is used as catalyst. Moreover, further temperature increase to 250°C and
300°C has a complete PG destruction as well partial or complete DMC molecule splitting as a
result. BMFI and Y-zeolite don’t destroy PG molecule at 200°C; at 250°C around 50% of PG
was cleaved and at 300°C all of PG was disappeared from the reaction mixture. So it can be
concluded, that the reaction performing in the gas phase at the present conditions can not lead
to the PG formation. Possibly performing of this reaction at lower pressures and temperatures
will solve this problem. Also use of the shorter contact times was considered as a possible
solution, but this doesn’t lead to the formation of the desired products, vide supra.
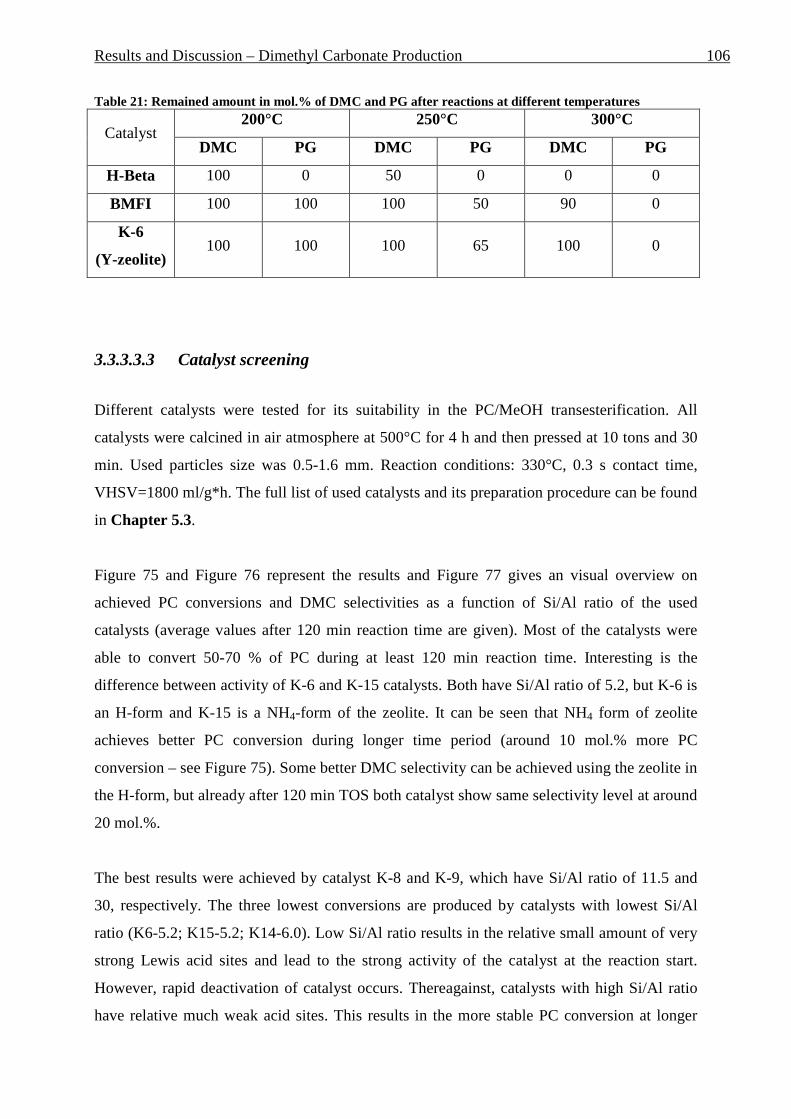
Results and Discussion – Dimethyl Carbonate Production 106
Table 21: Remained amount in mol.% of DMC and PG after reactions at different temperatures
Catalyst 200°C 250°C 300°C
DMC PG DMC PG DMC PG
H-Beta 100 0 50 0 0 0
BMFI 100 100 100 50 90 0
K-6
(Y-zeolite) 100 100 100 65 100 0
3.3.3.3.3 Catalyst screening
Different catalysts were tested for its suitability in the PC/MeOH transesterification. All
catalysts were calcined in air atmosphere at 500°C for 4 h and then pressed at 10 tons and 30
min. Used particles size was 0.5-1.6 mm. Reaction conditions: 330°C, 0.3 s contact time,
VHSV=1800 ml/g*h. The full list of used catalysts and its preparation procedure can be found
in Chapter 5.3.
Figure 75 and Figure 76 represent the results and Figure 77 gives an visual overview on
achieved PC conversions and DMC selectivities as a function of Si/Al ratio of the used
catalysts (average values after 120 min reaction time are given). Most of the catalysts were
able to convert 50-70 % of PC during at least 120 min reaction time. Interesting is the
difference between activity of K-6 and K-15 catalysts. Both have Si/Al ratio of 5.2, but K-6 is
an H-form and K-15 is a NH4-form of the zeolite. It can be seen that NH4 form of zeolite
achieves better PC conversion during longer time period (around 10 mol.% more PC
conversion – see Figure 75). Some better DMC selectivity can be achieved using the zeolite in
the H-form, but already after 120 min TOS both catalyst show same selectivity level at around
20 mol.%.
The best results were achieved by catalyst K-8 and K-9, which have Si/Al ratio of 11.5 and
30, respectively. The three lowest conversions are produced by catalysts with lowest Si/Al
ratio (K6-5.2; K15-5.2; K14-6.0). Low Si/Al ratio results in the relative small amount of very
strong Lewis acid sites and lead to the strong activity of the catalyst at the reaction start.
However, rapid deactivation of catalyst occurs. Thereagainst, catalysts with high Si/Al ratio
have relative much weak acid sites. This results in the more stable PC conversion at longer

Results and Discussion – Dimethyl Carbonate Production 107
TOS. Already after short reaction time of 30 min catalysts with high Si/Al ratio achieve more
PC conversion – see Figure 75. Further increase of the Si/Al ratio of the zeolite leads to the
PC conversion drop. So an optimum of Si/Al ratio was found which can be seen at Figure 77.
Two catalysts with moderate Si/Al ratio of 11.5 and 30 achieved best PC conversion over the
used reaction time. Too strong acid sites show high activity at the reaction start but then it
continuously drops from initial value of 95 mol.% to around 70 mol.% (after 40 min TOS)
due to the strong catalyst deactivation. Too weak acid sites are not able effectively convert PC
and show moderate activity even at the reaction start, see Figure 75.
A similar tendency was observed in terms of DMC selectivity: too strong or too weak acid
sites leaded to lower selectivity. However, catalyst with Si/Al ratio of 5.2 showed relative
high DMC selectivity at the reaction beginning, which sank after some reaction time. So same
Si/Al ratio optimum (i.e. Si/Al range = 10-30) exists, if selectivity to DMC is considered over
longer time period – see Figure 76 and Figure 77. Up to 25 mol.% DMC selectivity was
observed if catalyst with Si/Al ratio of 30 was used.
The catalytic results of two catalysts in the Na and Ca ionic form (K-11 and K-13) will be
presented in Chapter 3.3.3.3.11. Completely other reaction products were detected in case of
these two catalysts.

Resu
lts and
Discu
ssion
– D
imeth
yl Carb
on
ate Pro
du
ctio
n
1
08
30
40
50
60
70
80
90
100
10 40 70 100 130 160 190Time in min
Con
vers
ion
in m
ol.%
K-6 Si/Al=5.2K-8, Si/Al=11.5K-9, Si/Al=30K-10, Si/Al=42K-12 Si/Al=55K-14, Si/Al=6K-15, Si/Al=5.2
Figure 75: PC conversion, 0.3 s contact time, 330°C

Resu
lts and
Discu
ssion
– D
imeth
yl Carb
on
ate Pro
du
ctio
n
1
09
0
5
10
15
20
25
30
10 40 70 100 130 160 190Time in min
DM
C s
elec
tivity
in m
ol.%
K-6 Si/Al=5.2 K-8, Si/Al=11.5
K-9, Si/Al=30 K-10, Si/Al=42
K-12 Si/Al=55 K-14, Si/Al=6
K-15, Si/Al=5.2
Figure 76: DMC selectivity, 0.3 s contact time, 330°C
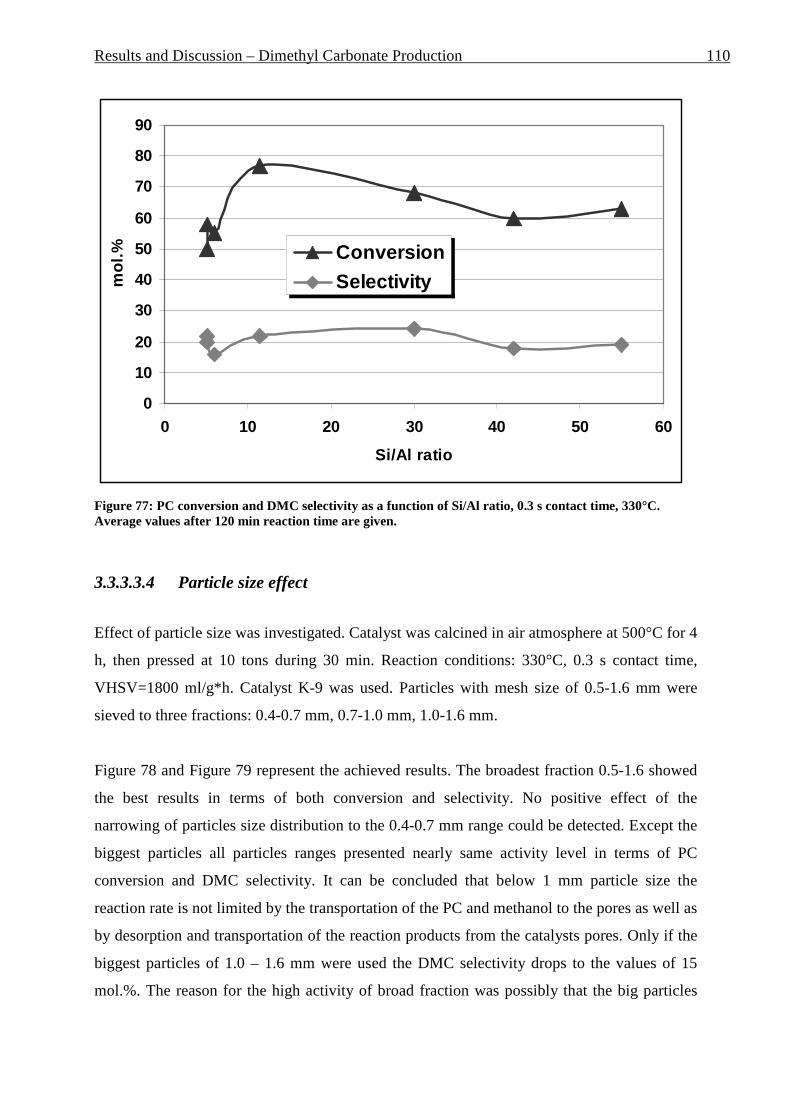
Results and Discussion – Dimethyl Carbonate Production 110
0
10
20
30
40
50
60
70
80
90
0 10 20 30 40 50 60
Si/Al ratio
mol
.% Conversion
Selectivity
Figure 77: PC conversion and DMC selectivity as a function of Si/Al ratio, 0.3 s contact time, 330°C. Average values after 120 min reaction time are given.
3.3.3.3.4 Particle size effect
Effect of particle size was investigated. Catalyst was calcined in air atmosphere at 500°C for 4
h, then pressed at 10 tons during 30 min. Reaction conditions: 330°C, 0.3 s contact time,
VHSV=1800 ml/g*h. Catalyst K-9 was used. Particles with mesh size of 0.5-1.6 mm were
sieved to three fractions: 0.4-0.7 mm, 0.7-1.0 mm, 1.0-1.6 mm.
Figure 78 and Figure 79 represent the achieved results. The broadest fraction 0.5-1.6 showed
the best results in terms of both conversion and selectivity. No positive effect of the
narrowing of particles size distribution to the 0.4-0.7 mm range could be detected. Except the
biggest particles all particles ranges presented nearly same activity level in terms of PC
conversion and DMC selectivity. It can be concluded that below 1 mm particle size the
reaction rate is not limited by the transportation of the PC and methanol to the pores as well as
by desorption and transportation of the reaction products from the catalysts pores. Only if the
biggest particles of 1.0 – 1.6 mm were used the DMC selectivity drops to the values of 15
mol.%. The reason for the high activity of broad fraction was possibly that the big particles

Results and Discussion – Dimethyl Carbonate Production 111
optimized the gas flow within the catalyst bed and hence led to the better total catalyst
activity.
40
50
60
70
80
90
100
0 60 120 180 240 300 360Time in min
Con
vers
ion
in m
ol.%
0.5-1.6
0.4-0.7
0.7-1.0
1.0-1-6
Figure 78: PC conversion, 0.3 s contact time, 330°C
0
5
10
15
20
25
30
0 60 120 180 240 300 360Time in min
DM
C s
elec
tivity
in m
ol.%
0.5-1.6
0.4-0.7
0.7-1.0
1.0-1-6
Figure 79: DMC selectivity, 0.3 s contact time, 330°C

Results and Discussion – Dimethyl Carbonate Production 112
3.3.3.3.5 Temperature effect
As shown above (Figure 72, Figure 73, Figure 74), temperature has a strong influence on the
reaction. Fine temperature tuning was done to investigate this effect more precisely. The
catalyst was calcined in the air atmosphere at 500°C for 4 h, then pressed at 10 tons during 30
min. Reaction conditions: 330°C, 0.3 s contact time, 0.5-1.6 mm particle size, VHSV=1800
ml/g*h. Catalyst K-8 was used.
If the temperature increases from 320°C to 330°C some better PC conversions can be
achieved (see Figure 80), whereas the DMC selectivity remains at the level of around 20
mol.% (see Figure 81). Also the DMC yield grows by around 4 mol.% (Figure 82). Further
temperature increase doesn’t lead to a significant improvement of the reaction parameter. The
conversion remains at the level of about 75 mol.% after 2.5 h reaction time and small
selectivity decrease of about 3 mol.% can be observed.
Too low temperatures are not enough to perform desired reaction (i.e. to convert PC) and too
high temperatures lead to the formation of side products/cracking reactions. So the optimum
of the reaction temperature is around 330°C.
10
20
30
40
50
60
70
80
90
100
0 50 100 150 200Time in min
Con
vers
ion
in m
ol.%
320°C
330°C
340°C
Figure 80: PC conversion, 0.3 s contact time.

Results and Discussion – Dimethyl Carbonate Production 113
0
5
10
15
20
25
30
0 50 100 150 200Time in min
DM
C s
elec
tivity
in m
ol.%
320°C
330°C
340°C
Figure 81: DMC selectivity, 0.3 s contact time.
0
2
4
6
8
10
12
14
16
18
20
0 50 100 150 200Time in min
DM
C y
ield
in m
ol.%
320°C
330°C
340°C
Figure 82: DMC yield, 0.3 s contact time.

Results and Discussion – Dimethyl Carbonate Production 114
3.3.3.3.6 Pressing time effect
The catalyst powder forms hard tablets during pressing, which have been crushed afterwards
to the necessary particle size. Pressing has an effect in reducing of catalyst pores and as a
consequence of BET and micropore area and volume. This can be seen in Table 22. As a
result of these catalyst structure modifications its activity was changed significantly, too.
Figure 83 and Figure 84 illustrate that after 10 and 30 min pressing time the catalyst achieved
similarly high activity of around 30-35 mol.% DMC selectivity (with a maximum of 46
mol.% in case of 30 min pressing) and continuously reduced conversions from 80 mol.% to
30 mol.% after 5 hours reaction time. Thereagainst, long pressing time led to a strong activity
drop of the catalyst in respect to DMC selectivity. PC conversion was slightly higher than
after 10 and 30 min pressing. This is an indication that catalyst micropores are of primary
importance for the performing of reaction and DMC formation. Reaction conditions: 330°C,
0.3 s contact time, 0.5-1.6 mm particle size, VHSV=1800 ml/g*h.
So it can be seen that pore size plays an important role in this reaction. Increased pressing
time from 10 min to 30 min leads to the small changes in the catalyst structure (decrease of
BET and micropore area) and to the some increase of DMC selectivity. Further micropores
destruction by catalyst pressing during 2h causes stronger PC conversion on unchanged
macropores of the catalyst with low DMC selectivity.
Table 22: BET and micropore area and volume reducing during catalyst pressing at 10 tons during different times, calcination temperature is 500°C.
Pressing time in
min BET in m2/g
Micropore area in
m2/g
Micropore volume
in cm3/g
10 644 472 0,2321
30 637 467 0,2264
120 609 437 0,2117

Results and Discussion – Dimethyl Carbonate Production 115
0
10
20
30
40
50
60
70
80
90
100
0 50 100 150 200 250 300 350Time in min
Con
vers
ion
in m
ol.%
2h 10 tons30 min 10 tons10 min 10 tons
Figure 83: PC conversion, 0.3 s contact time, 330°C
0
5
10
15
20
25
30
35
40
45
50
0 50 100 150 200 250 300 350Time in min
DM
C s
elec
tivity
in m
ol.%
2 h 10 tons30 min 10 tons10 min 10 tons
Figure 84: DMC selectivity, 0.3 s contact time, 330°C
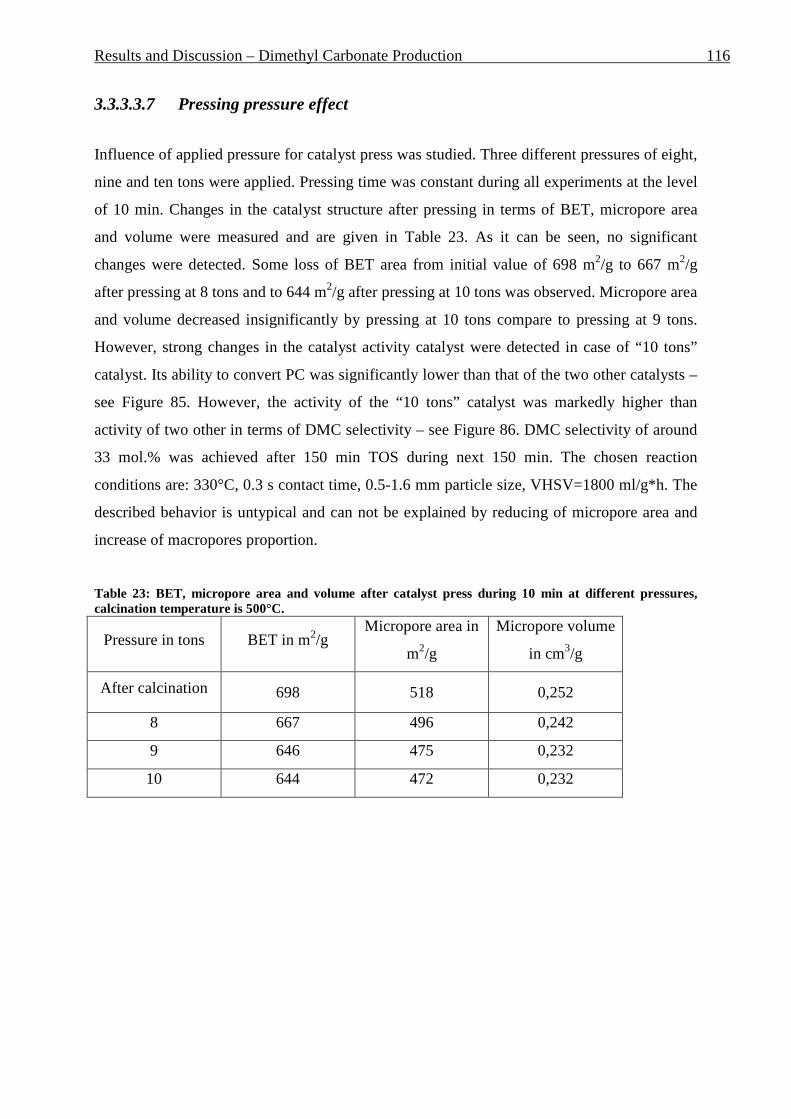
Results and Discussion – Dimethyl Carbonate Production 116
3.3.3.3.7 Pressing pressure effect
Influence of applied pressure for catalyst press was studied. Three different pressures of eight,
nine and ten tons were applied. Pressing time was constant during all experiments at the level
of 10 min. Changes in the catalyst structure after pressing in terms of BET, micropore area
and volume were measured and are given in Table 23. As it can be seen, no significant
changes were detected. Some loss of BET area from initial value of 698 m2/g to 667 m2/g
after pressing at 8 tons and to 644 m2/g after pressing at 10 tons was observed. Micropore area
and volume decreased insignificantly by pressing at 10 tons compare to pressing at 9 tons.
However, strong changes in the catalyst activity catalyst were detected in case of “10 tons”
catalyst. Its ability to convert PC was significantly lower than that of the two other catalysts –
see Figure 85. However, the activity of the “10 tons” catalyst was markedly higher than
activity of two other in terms of DMC selectivity – see Figure 86. DMC selectivity of around
33 mol.% was achieved after 150 min TOS during next 150 min. The chosen reaction
conditions are: 330°C, 0.3 s contact time, 0.5-1.6 mm particle size, VHSV=1800 ml/g*h. The
described behavior is untypical and can not be explained by reducing of micropore area and
increase of macropores proportion.
Table 23: BET, micropore area and volume after catalyst press during 10 min at different pressures, calcination temperature is 500°C.
Pressure in tons BET in m2/g Micropore area in
m2/g
Micropore volume
in cm3/g
After calcination 698 518 0,252
8 667 496 0,242
9 646 475 0,232
10 644 472 0,232
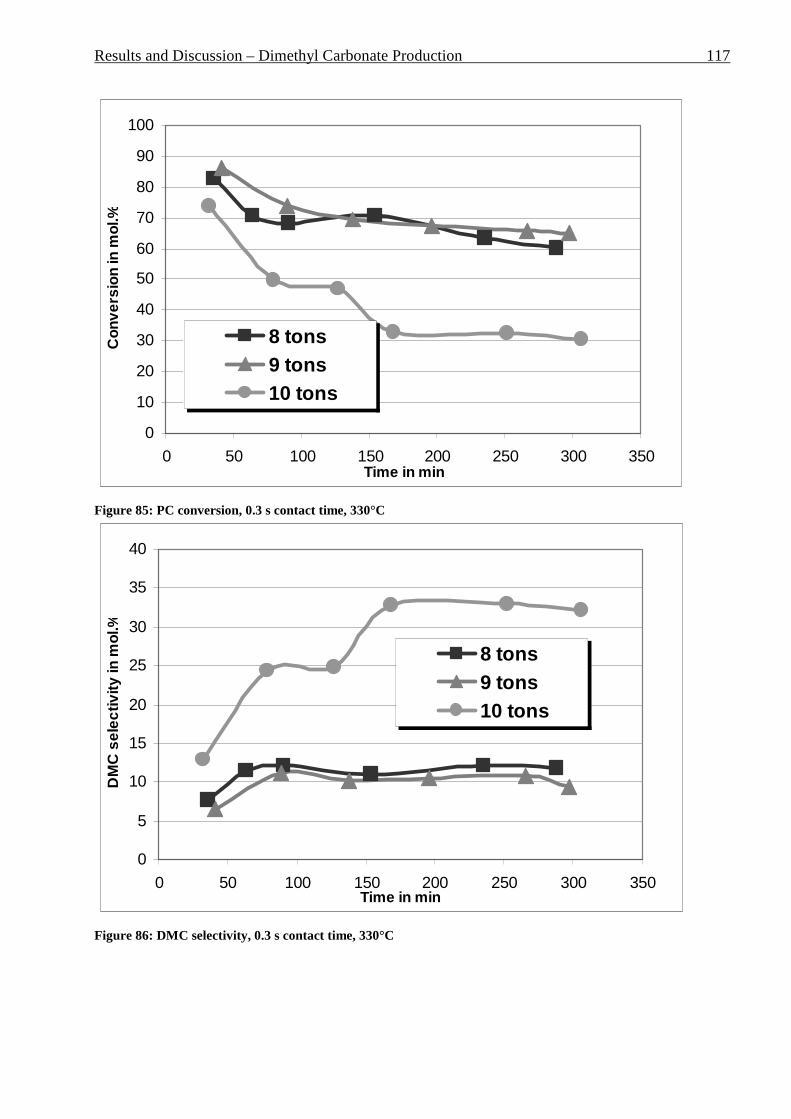
Results and Discussion – Dimethyl Carbonate Production 117
0
10
20
30
40
50
60
70
80
90
100
0 50 100 150 200 250 300 350Time in min
Con
vers
ion
in m
ol.%
8 tons9 tons10 tons
Figure 85: PC conversion, 0.3 s contact time, 330°C
0
5
10
15
20
25
30
35
40
0 50 100 150 200 250 300 350Time in min
DM
C s
elec
tivity
in m
ol.%
8 tons9 tons10 tons
Figure 86: DMC selectivity, 0.3 s contact time, 330°C
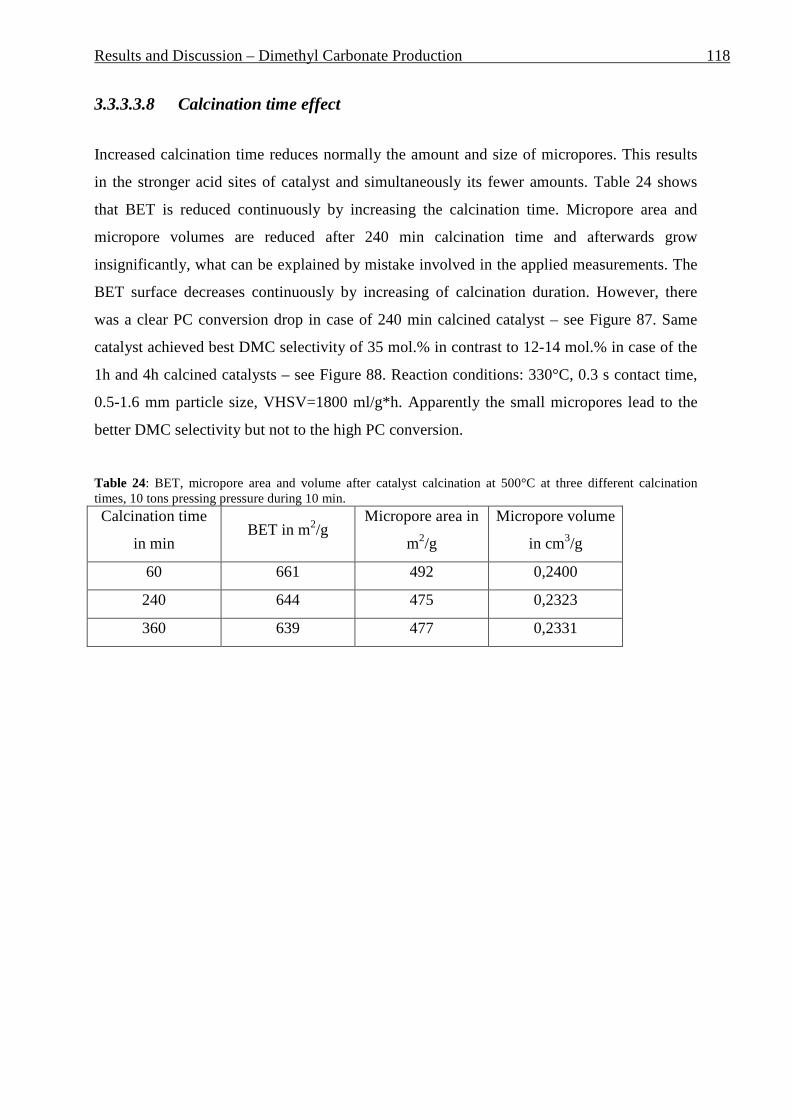
Results and Discussion – Dimethyl Carbonate Production 118
3.3.3.3.8 Calcination time effect
Increased calcination time reduces normally the amount and size of micropores. This results
in the stronger acid sites of catalyst and simultaneously its fewer amounts. Table 24 shows
that BET is reduced continuously by increasing the calcination time. Micropore area and
micropore volumes are reduced after 240 min calcination time and afterwards grow
insignificantly, what can be explained by mistake involved in the applied measurements. The
BET surface decreases continuously by increasing of calcination duration. However, there
was a clear PC conversion drop in case of 240 min calcined catalyst – see Figure 87. Same
catalyst achieved best DMC selectivity of 35 mol.% in contrast to 12-14 mol.% in case of the
1h and 4h calcined catalysts – see Figure 88. Reaction conditions: 330°C, 0.3 s contact time,
0.5-1.6 mm particle size, VHSV=1800 ml/g*h. Apparently the small micropores lead to the
better DMC selectivity but not to the high PC conversion.
Table 24: BET, micropore area and volume after catalyst calcination at 500°C at three different calcination times, 10 tons pressing pressure during 10 min. Calcination time
in min BET in m2/g
Micropore area in
m2/g
Micropore volume
in cm3/g
60 661 492 0,2400
240 644 475 0,2323
360 639 477 0,2331
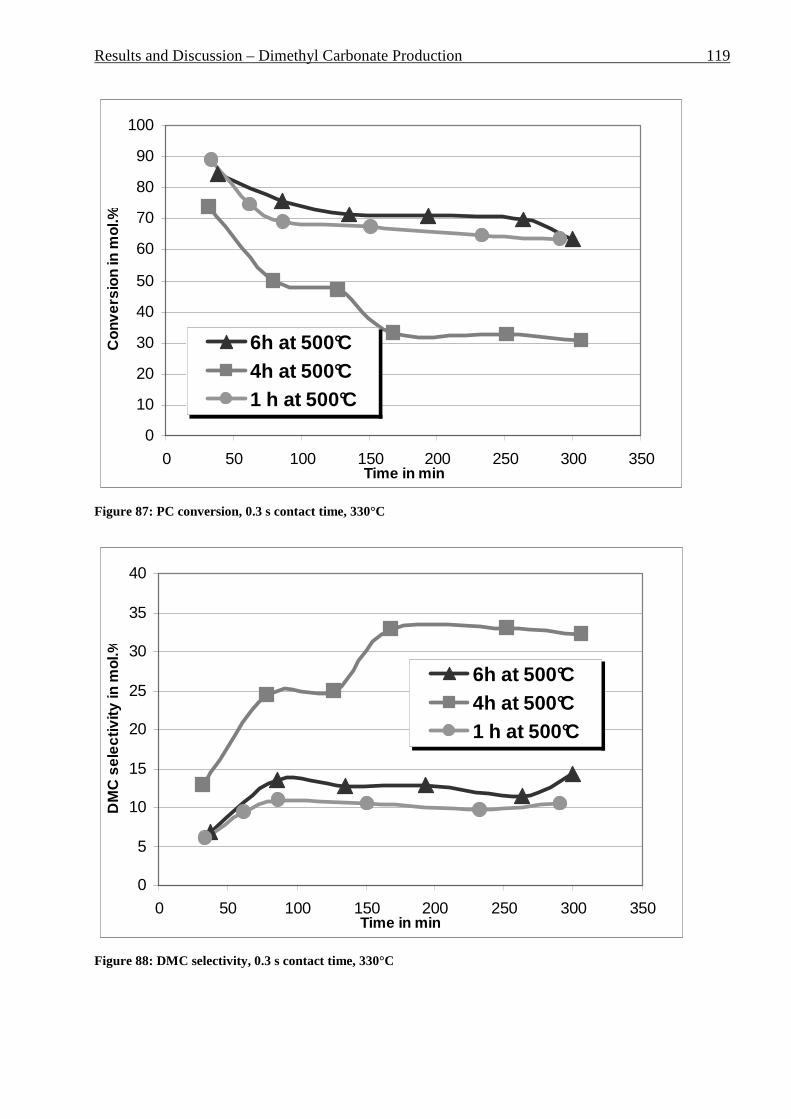
Results and Discussion – Dimethyl Carbonate Production 119
0
10
20
30
40
50
60
70
80
90
100
0 50 100 150 200 250 300 350Time in min
Con
vers
ion
in m
ol.%
6h at 500°C4h at 500°C1 h at 500°C
Figure 87: PC conversion, 0.3 s contact time, 330°C
0
5
10
15
20
25
30
35
40
0 50 100 150 200 250 300 350Time in min
DM
C s
elec
tivity
in m
ol.%
6h at 500°C4h at 500°C1 h at 500°C
Figure 88: DMC selectivity, 0.3 s contact time, 330°C
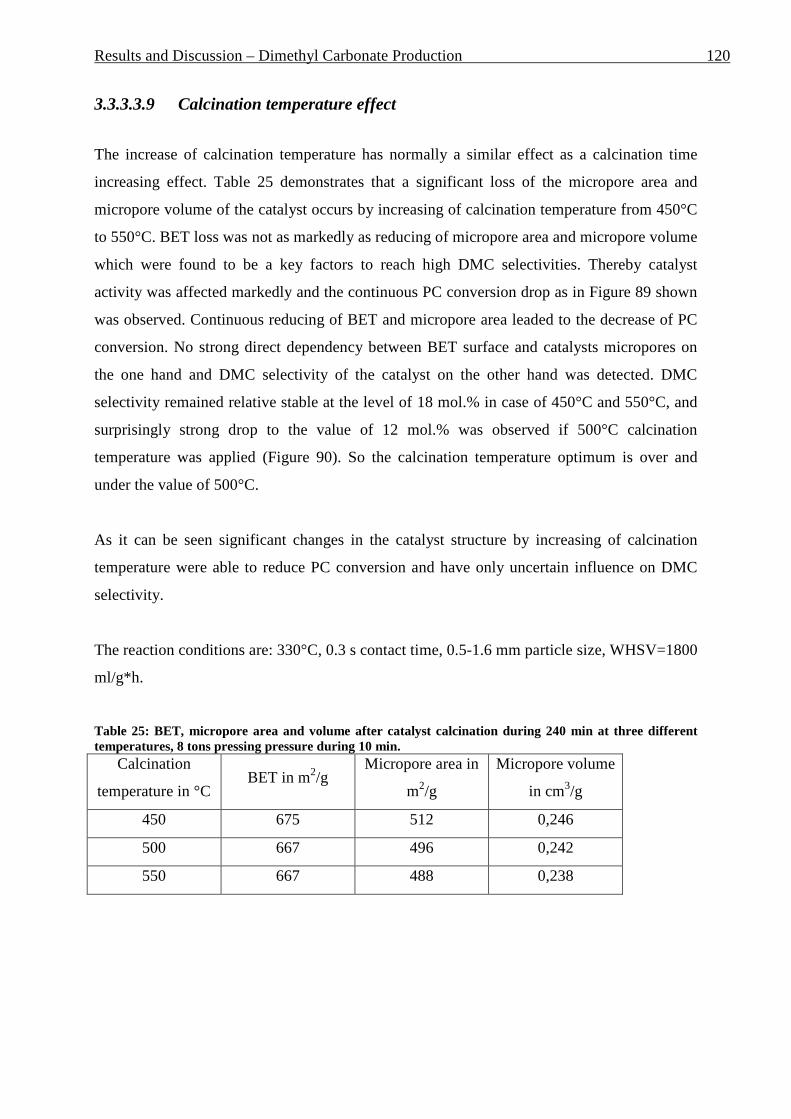
Results and Discussion – Dimethyl Carbonate Production 120
3.3.3.3.9 Calcination temperature effect
The increase of calcination temperature has normally a similar effect as a calcination time
increasing effect. Table 25 demonstrates that a significant loss of the micropore area and
micropore volume of the catalyst occurs by increasing of calcination temperature from 450°C
to 550°C. BET loss was not as markedly as reducing of micropore area and micropore volume
which were found to be a key factors to reach high DMC selectivities. Thereby catalyst
activity was affected markedly and the continuous PC conversion drop as in Figure 89 shown
was observed. Continuous reducing of BET and micropore area leaded to the decrease of PC
conversion. No strong direct dependency between BET surface and catalysts micropores on
the one hand and DMC selectivity of the catalyst on the other hand was detected. DMC
selectivity remained relative stable at the level of 18 mol.% in case of 450°C and 550°C, and
surprisingly strong drop to the value of 12 mol.% was observed if 500°C calcination
temperature was applied (Figure 90). So the calcination temperature optimum is over and
under the value of 500°C.
As it can be seen significant changes in the catalyst structure by increasing of calcination
temperature were able to reduce PC conversion and have only uncertain influence on DMC
selectivity.
The reaction conditions are: 330°C, 0.3 s contact time, 0.5-1.6 mm particle size, WHSV=1800
ml/g*h.
Table 25: BET, micropore area and volume after catalyst calcination during 240 min at three different temperatures, 8 tons pressing pressure during 10 min.
Calcination
temperature in °C BET in m2/g
Micropore area in
m2/g
Micropore volume
in cm3/g
450 675 512 0,246
500 667 496 0,242
550 667 488 0,238
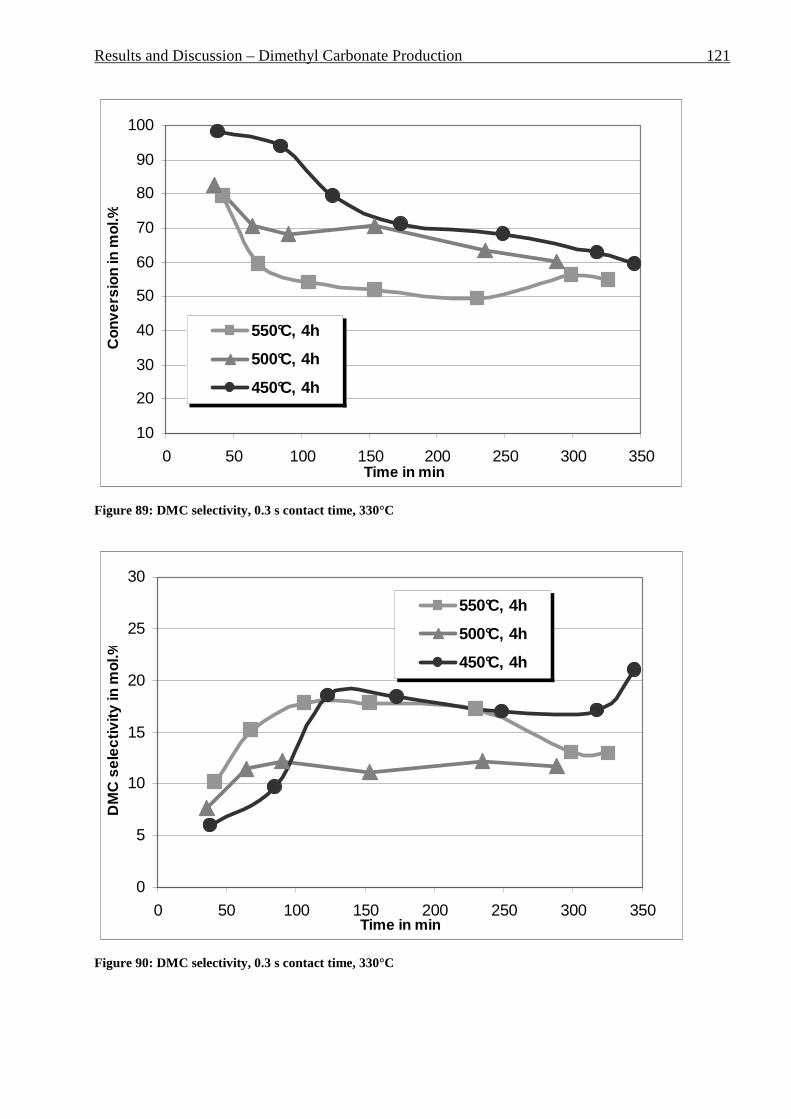
Results and Discussion – Dimethyl Carbonate Production 121
10
20
30
40
50
60
70
80
90
100
0 50 100 150 200 250 300 350Time in min
Con
vers
ion
in m
ol.%
550°C, 4h
500°C, 4h
450°C, 4h
Figure 89: DMC selectivity, 0.3 s contact time, 330°C
0
5
10
15
20
25
30
0 50 100 150 200 250 300 350Time in min
DM
C s
elec
tivity
in m
ol.%
550°C, 4h
500°C, 4h
450°C, 4h
Figure 90: DMC selectivity, 0.3 s contact time, 330°C

Results and Discussion – Dimethyl Carbonate Production 122
3.3.3.3.10 MeOH : PC ratio effect
Generally methanol excess promotes improvement of the reaction rate and selectivity to DMC
in liquid phase by shifting of the reaction equilibrium. The attempt to reduce the methanol
excess of a factor of three (corresponds to the MeOH/PC ratio 6:1) to two (MeOH/PC ratio of
4:1) was done. Strong drop of PC conversion was detected – see Figure 91. Around 20 mol.%
loss of the PC conversion was observed. DMC selectivity remained at the level of around 20
mol.% with light decreased tendency at the longer TOS.
So reducing of methanol excess from 6:1 to 4:1 can be considered as a positive factor due to
the keeping of DMC selectivity at the same level by using less methanol, which can be a
source for some difficulties like formation of volatile dimethylether or azeotrope mixture with
DMC (proportion of 6(methanol):1(DMC)). This azeotrope mixture plays an important role
by reaction performing in the liquid phase. But in the vapor phase methanol proportion can be
reduced without loss of DMC selectivity.
Reaction conditions: 330°C, 0.3 s contact time, 0.5-1.6 mm particle size, WHSV=1800
ml/g*h. Catalyst K-8 was used.
0
5
10
15
20
25
30
0 30 60 90 120 150 180 210Time in min
DM
C s
elec
tivity
in m
ol.%
50
55
60
65
70
75
80
85
90
95
100
Con
vers
ion
in m
ol.%
4:1 selectivity
6:1 selectivity
4:1 Conv. (sec axe)
6:1 Conv. (sec axe)
Figure 91: DMC selectivity, 0.3 s contact time, 330°C

Results and Discussion – Dimethyl Carbonate Production 123
3.3.3.3.11 Influence of the ionic form of Y-zeolite
Strong effect of different ionic form of Y-zeolite on the product distribution was detected.
Use of Na- and Ca-form of Y-zeolite led to another products distribution that was found in
case of H- and NH4-form. The comparison of the reaction products is given in Table 26. It can
be seen that a variety of different chemical transformations take place during the reaction.
High temperatures and the presence of strong acid sites lead to many side reactions.
As it can be seen in Table 26, in case of the Ca-modified catalyst with relative small metal
load of 2.4 wt.% DMC formation was still observed. But the bulk reaction mixture content
was consisted from another three compounds which are presented in this Table. In case of Na-
modified catalyst no DMC was formed and strong side reactions gave five main side
products, which are presented in Table 26. These side products were formed with relative
high selectivity, see Figure 92.
It is quite difficult to detect origin of all presented side products. The main idea to present the
variety of the formed compounds and their formation selectivities was to indicate that ambient
pressure and high reaction temperature don’t set an absolute limit for the high reaction
selectivity. Further catalyst modification can lead to an increase of target products selectivity.
0
10
20
30
40
50
60
70
80
90
100
0 50 100 150 200 250 300Time in min
´Con
vers
ion
and
Sel
ectiv
ity in
mol
.%
0.25 s 0.25 s
0.31s 0.31s
Figure 92: Side products formation at 0.25 and 0.31 s contact time.

Results and Discussion – Dimethyl Carbonate Production 124
Table 26: Side products formed by Y-zeolites with Na- and Ca-form K-11 K-11 K-13
Ionic form Na Na Ca
Metal load in wt.%
6.0 6.0 2.5
BET in m2/g
722 722 394
-------- 330°C, 0.3s contact time 330°C, 0.25s contact time 330°C, 0.3s contact time
Nr. Compound Chemical structure Compound Chemical
structure Compound Chemical structure
1 2-methoxy-
propane O
2 dimethyl carbonate O C O
O
3 2,2-
dimethoxy-propane
OO
2,2-dimethoxy-
propane
OO
2,2-dimethoxy-
propane OO
4 toluene
5
2-propyl-1,3-
Dioxolane O O
2-propyl-1,3-
Dioxolane O O
6 2-methyl-3-
Pentanol OH
2-methyl-3-Pentanol
OH
7
3,4-dimethyl-
3,4-Hexandiol
OH
OH
8 2-ethyl-4-
methyl-1,3-Dioxolane
O O
2-ethyl-4-methyl-1,3-Dioxolane O O
9
2-methyl-propanoic
acid, anhydride
O
O O

Results and Discussion – Dimethyl Carbonate Production 125
3.3.3.4 Conclusions and Outlook
The presented investigations showed that the transesterification of methanol and propylene
carbonate can be performed in liquid phase using homogenous catalysis conditions effectively
with PC conversions up to 72 mol.%. Both dimethyl carbonate and propylene glycol can be
formed with close to 100% selectivity. Oxides of alkali-earth metals can be used for these
reactions. In the row BaO – SrO – CaO – MgO the activity grows except last MgO oxide.
Best results can be achieved with CaO. Catalysis has a heterogeneous character but CaO
particles undergo strong dispersion and cannot be effectively filtered out after reaction.
Also superbase Na/NaOH/MgO was used successfully for this reaction. Build of response
surfaces allows an evaluation of the Na and NaOH concentrations influence on the PC
conversion. However, the Na can be easily leached from the MgO support. This leads to the
activity drop in the reusability experiments.
The following limitations of the liquid phase reactions are existing: reaching of the reaction
equilibrium and difficulty in the separation of homogeneous catalyst. In order to overcome
these limitations, heterogeneous catalysis was applied.
A variety of solid catalyst was tested for its suitability to catalyze methanol-propylene
carbonate transesterification at ambient pressure. Relative high temperatures over 250°C were
necessary to perform this reaction in vapor phase due to the high boiling point of propylene
carbonate (242°C). Side effect of high reaction temperatures was destroying of the one of the
reaction products – propylene glycol.
Most of the solid acids like HZSM-5 or H-BETA leaded to the thermo-catalytic cracking of
the used propylene carbonate-methanol mixture even at relative low temperatures of 250-
300°C. Thereagainst Y-zeolites showed ability to form dimethyl carbonate with the selectivity
of around 25 mol.% at temperatures over 320°C. Further tuning of the reaction parameter as
well of the catalyst preparation procedure allows DMC selectivity up to 45 mol.% at ambient
pressure, 0.3 s contact time, VSHV of 18000 ml/g*h and 330°C. Overview on optimizations
performed on reaction and catalyst parameters is shown in Table 27.
It was detected that Y-zeolites in H- and NH4-form are suitable for PC/methanol
transesterification. However, the Na- and Ca- form of the Y-zeolite lead to the strong side
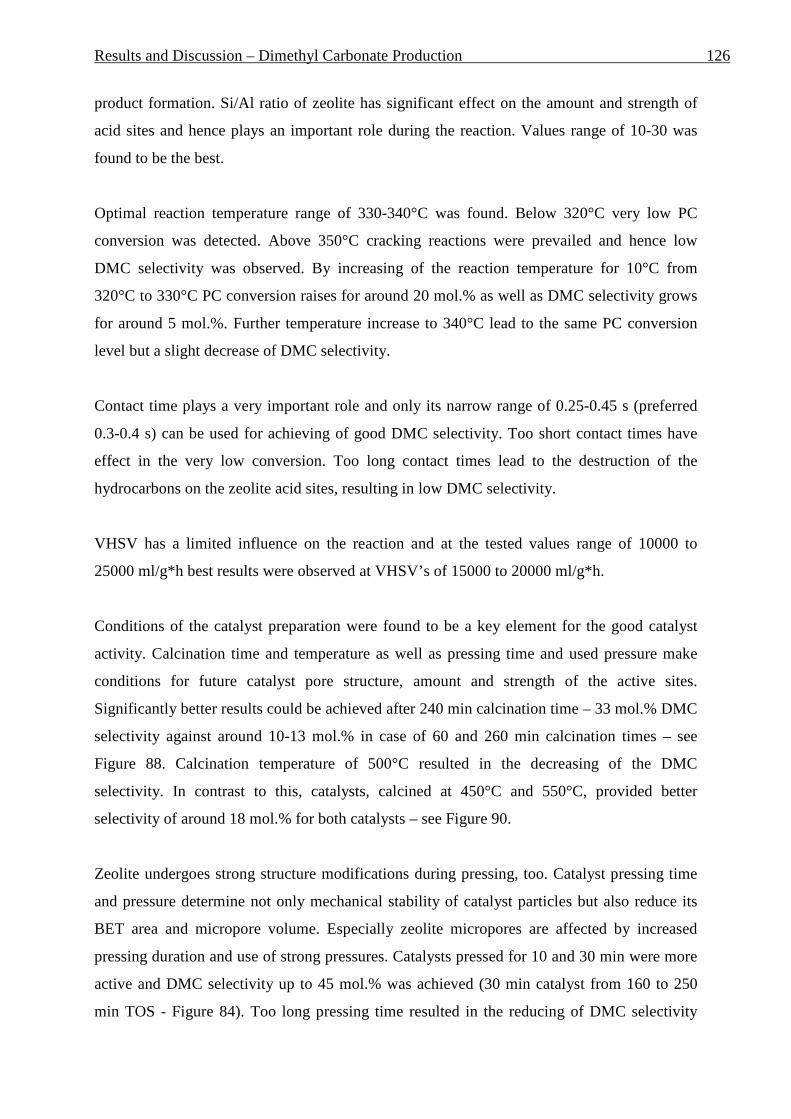
Results and Discussion – Dimethyl Carbonate Production 126
product formation. Si/Al ratio of zeolite has significant effect on the amount and strength of
acid sites and hence plays an important role during the reaction. Values range of 10-30 was
found to be the best.
Optimal reaction temperature range of 330-340°C was found. Below 320°C very low PC
conversion was detected. Above 350°C cracking reactions were prevailed and hence low
DMC selectivity was observed. By increasing of the reaction temperature for 10°C from
320°C to 330°C PC conversion raises for around 20 mol.% as well as DMC selectivity grows
for around 5 mol.%. Further temperature increase to 340°C lead to the same PC conversion
level but a slight decrease of DMC selectivity.
Contact time plays a very important role and only its narrow range of 0.25-0.45 s (preferred
0.3-0.4 s) can be used for achieving of good DMC selectivity. Too short contact times have
effect in the very low conversion. Too long contact times lead to the destruction of the
hydrocarbons on the zeolite acid sites, resulting in low DMC selectivity.
VHSV has a limited influence on the reaction and at the tested values range of 10000 to
25000 ml/g*h best results were observed at VHSV’s of 15000 to 20000 ml/g*h.
Conditions of the catalyst preparation were found to be a key element for the good catalyst
activity. Calcination time and temperature as well as pressing time and used pressure make
conditions for future catalyst pore structure, amount and strength of the active sites.
Significantly better results could be achieved after 240 min calcination time – 33 mol.% DMC
selectivity against around 10-13 mol.% in case of 60 and 260 min calcination times – see
Figure 88. Calcination temperature of 500°C resulted in the decreasing of the DMC
selectivity. In contrast to this, catalysts, calcined at 450°C and 550°C, provided better
selectivity of around 18 mol.% for both catalysts – see Figure 90.
Zeolite undergoes strong structure modifications during pressing, too. Catalyst pressing time
and pressure determine not only mechanical stability of catalyst particles but also reduce its
BET area and micropore volume. Especially zeolite micropores are affected by increased
pressing duration and use of strong pressures. Catalysts pressed for 10 and 30 min were more
active and DMC selectivity up to 45 mol.% was achieved (30 min catalyst from 160 to 250
min TOS - Figure 84). Too long pressing time resulted in the reducing of DMC selectivity

Results and Discussion – Dimethyl Carbonate Production 127
due to the destroying of micropores – around 12% micropore volume and surface loss after 2h
pressing and only around 4% after 30 min. Also applied pressure has a significant influence
on the catalytic activity. Catalysts pressed at 8 and 9 tons showed only limited activity and
catalyst pressed at 10 tons was more active as in Figure 86 presented. Strong DMC selectivity
grow up to 33 mol.% was observed in case of pressing at 10 tons.
Attempts of narrowing of particles size distribution didn’t lead to some improvements of the
desired reaction characteristics. The broadest fraction 0.5-1.6 showed the best results due to
the optimized gas flow in the catalyst bed.
Reducing of methanol excess from 6:1 to 4:1 was detected to be positive due to the keeping of
DMC selectivity at the same level by using less methanol, which can be a source for some
difficulties like formation of volatile dimethylether or azeotrope mixture with DMC
(proportion of 6(methanol):1(DMC)).
Further catalyst and reaction conditions fine optimizations can lead to the better DMC and PG
selectivity. The reaction goes with the decreasing of the total molecules amount, so the
reaction performing at the lower pressure can also be a step to increase overall performance.
Table 27: Overview on optimized parameter in vapor phase reactions and optimal values detected Parameter Range tested Optimum/optimum range
reaction temperature in °C 200-350 330-340
catalyst contact time in s 0,01-3 0.3-0.4
VHSV in ml/g(cat)*h 10000-25000 15000-20000
particle size in µm 400-700, 700-1000,
1000-1600, 500-1600 500-1600
catalyst calcination time in min 60-360 240
catalyst calcination temperature in °C 450-550 450, 550
catalyst calcination atmosphere air, nitrogen air, nitrogen
catalyst press time in min 10-120 30-60
catalyst press pressure in tons 8-10 10
catalyst Si/Al ratio 5.2-80 10-30
MeOH/PC molar ratio 4-6 6
Y-zeolite ionic form H-, NH4-, Na-, Ca-, H-, NH4-

Summary and Outlook 128
4 Summary and Outlook
Some applied aspects of the ethyl benzene to the styrene reaction in the riser reactor were
studied. Unusual strong carbon dioxide formation during the reaction was explained through
the oxygen in the catalysts pores and its sequent oxidation during the reaction. Use of only
nitrogen as a feed in a blank experiment as well as argon flushing of the catalyst prior to the
experiments didn’t lead to the reducing of the oxygen content in the product mixture. High
reaction temperature and long gas residence times favor the increased by products formation.
Positive effect of the water presence in the feed was observed. A 30% less CO2 was formed at
1 s GRT and 700°C if 30 mol.% water was added to the feed.
Another point of this work consisted in the investigations of the Mo/HZSM-5 catalysts use for
the methane dehydroaromatization. Several reaction optimizations like WHSV level, reaction
temperature, carbon dioxide addition were performed in the fixed bed reactor at ambient
pressure. The methane WHSV level was found to be optimal in the range of 1.5-2.0 h-1.
Further WHSV increasing leads to the activity drop in terms of mmol produced aromatic per
gram catalyst per hour. Increasing of the temperature favors the desired aromatic formation
but causes strong irreversible catalyst deactivation. Temperature optimum lies in the range
700-725°C. Detrimental effect of the carbon dioxide addition was detected. Methane
conversion as well as aromatic formation were significantly suppressed by addition of 3%
CO2 to the methane feed.
Moreover use of the fluidized bed reactor at ambient pressure was studied. Around 15 % more
aromatic yield compare to the fixed bed reactor were achieved in the fluidized bed reactor.
However, catalyst underwent strong deactivation already after several hours at the fluidized
conditions. The reasons for the deactivation were investigated. Significant loss of crystalline
structure and molybdenum leaching were detected. Strong reducing of the particles size
distribution was observed also. Mechanical stability of the particles has to be improved to use
this catalyst in fluidized bed reactor.
Furthermore, the production of the “green” reagent dimethyl carbonate was investigated in
this work. Catalyst screening for the reaction performing in the liquid phase was done. CaO
showed best results as well as superbase MgO/Na/NaOH. PC conversion of around 70 mol.%
with 99 mol.% DMC and PG selectivity was achieved.

Summary and Outlook 129
However, reaction performing in the liquid phase doesn’t allow effective reuse of the catalyst.
For this reason it was attempted to perform this reaction heterogeneously in fixed bed reactor
in the vapor phase and at ambient pressure. Catalyst screening was done. Y-zeolites showed
highest activity and were able to achieve up to 25 mol.% DMC selectivity at around 60 mol.%
PC conversion during initial experiments. An optimization of the reaction conditions as well
of the catalyst preparation method led to the grow of DMC selectivity up to 45 mol.% at
around 60 mol.% PC conversion. Overview on optimized parameters is given in Table 27.
Many parameters have a strong influence on the DMC selectivity and only its narrow values
range can be used for the effective reaction performance. Further selectivity increase cannot
be ruled out. It was detected that H- and NH4-form of Y-zeolites are suitable for PC/methanol
transesterification. In contrast to this Na- and Ca- form lead to the strong side products
formation.
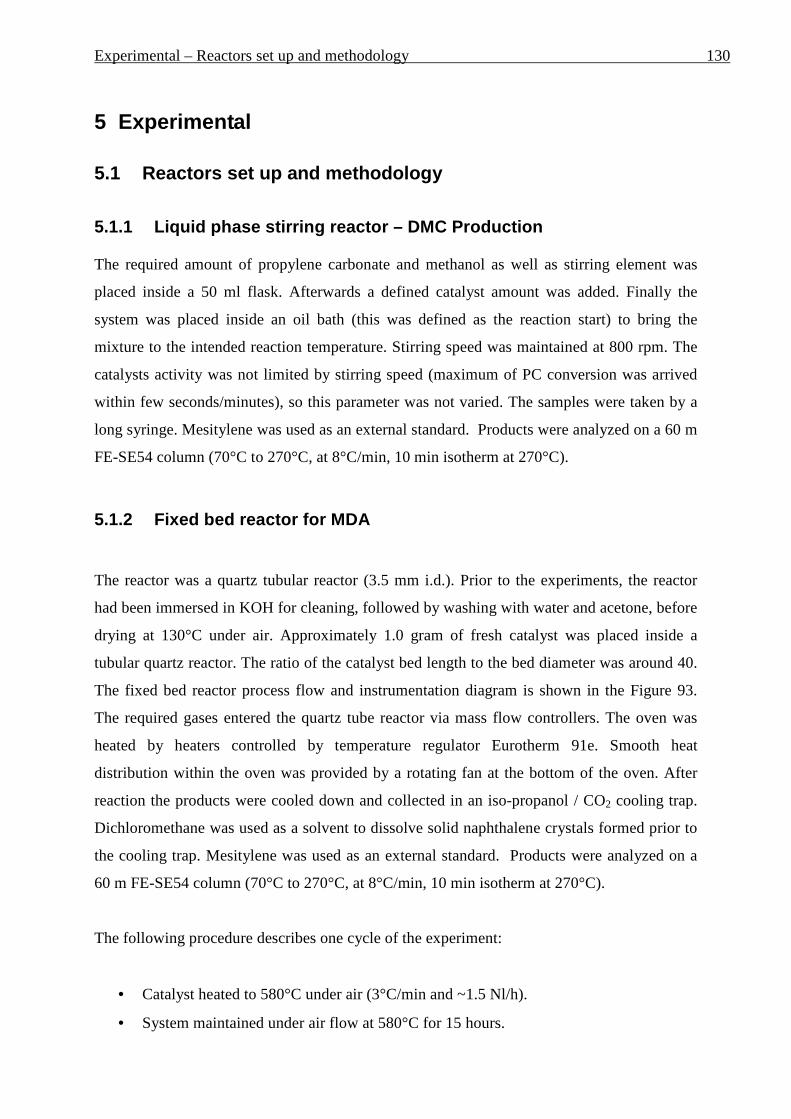
Experimental – Reactors set up and methodology 130
5 Experimental
5.1 Reactors set up and methodology
5.1.1 Liquid phase stirring reactor – DMC Productio n
The required amount of propylene carbonate and methanol as well as stirring element was
placed inside a 50 ml flask. Afterwards a defined catalyst amount was added. Finally the
system was placed inside an oil bath (this was defined as the reaction start) to bring the
mixture to the intended reaction temperature. Stirring speed was maintained at 800 rpm. The
catalysts activity was not limited by stirring speed (maximum of PC conversion was arrived
within few seconds/minutes), so this parameter was not varied. The samples were taken by a
long syringe. Mesitylene was used as an external standard. Products were analyzed on a 60 m
FE-SE54 column (70°C to 270°C, at 8°C/min, 10 min isotherm at 270°C).
5.1.2 Fixed bed reactor for MDA
The reactor was a quartz tubular reactor (3.5 mm i.d.). Prior to the experiments, the reactor
had been immersed in KOH for cleaning, followed by washing with water and acetone, before
drying at 130°C under air. Approximately 1.0 gram of fresh catalyst was placed inside a
tubular quartz reactor. The ratio of the catalyst bed length to the bed diameter was around 40.
The fixed bed reactor process flow and instrumentation diagram is shown in the Figure 93.
The required gases entered the quartz tube reactor via mass flow controllers. The oven was
heated by heaters controlled by temperature regulator Eurotherm 91e. Smooth heat
distribution within the oven was provided by a rotating fan at the bottom of the oven. After
reaction the products were cooled down and collected in an iso-propanol / CO2 cooling trap.
Dichloromethane was used as a solvent to dissolve solid naphthalene crystals formed prior to
the cooling trap. Mesitylene was used as an external standard. Products were analyzed on a
60 m FE-SE54 column (70°C to 270°C, at 8°C/min, 10 min isotherm at 270°C).
The following procedure describes one cycle of the experiment:
• Catalyst heated to 580°C under air (3°C/min and ~1.5 Nl/h).
• System maintained under air flow at 580°C for 15 hours.

Experimental – Reactors set up and methodology 131
• System flushed with nitrogen for 30 minutes (~1.5 nL/h).
• Switched to CH4 and heated to 700°C (3°C/min and ~1.5 nL/h).
• System maintained at 700°C for the intended reaction duration.
• Switched to argon and cooled to room temperature (3°C/min and ~1.5 nL/h).
The start of the time on stream is defined as the time when which the reaction temperature
reached 700°C.
Figure 93: Process flow and instrumentation diagram of the MDA fixed bed reactor system
5.1.3 Fixed bed reactor for DMC production
Reactor was a steel spiral reactor (5 mm i.d.). Approximately 2.0 gram of fresh catalyst was
placed inside the reactor. The ratio of the catalyst bed length to the bed diameter was around
12. The fixed bed reactor piping flow and instrumentation diagram is represented in the
Figure 94. The required gas flow was controlled by rotameter and the liquid educts were
pumped by Latek micropump. The oven was heated by heaters which were controlled by
Eurotherm 91e temperature regulator. Smooth heat distribution within the oven was provided
by a rotating fan at the bottom of the oven. After reaction the products from the reactor were
cooled down and collected in an iso-propanol / CO2 cooling trap. Acetone was used as a
solvent to dissolve the reaction products. Mesitylene was used as an external standard.
Products were analyzed on a 60 m FE-SE54 column (70°C to 270°C, at 8°C/min, 10 min
isotherm at 270°C).
The following procedure describes one cycle of the experiment:
CH
Ar,N
TIC
FIC
FIC
FIC
CO2, H2, Air
M
Isopropanol/CO
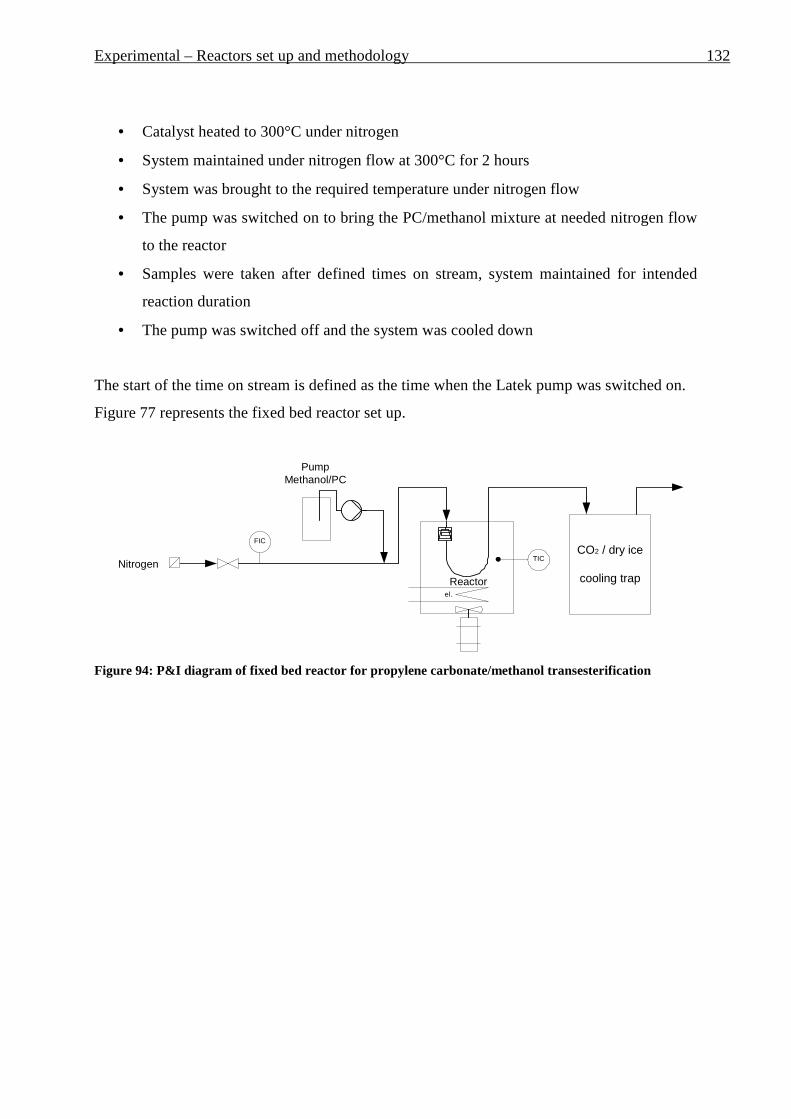
Experimental – Reactors set up and methodology 132
• Catalyst heated to 300°C under nitrogen
• System maintained under nitrogen flow at 300°C for 2 hours
• System was brought to the required temperature under nitrogen flow
• The pump was switched on to bring the PC/methanol mixture at needed nitrogen flow
to the reactor
• Samples were taken after defined times on stream, system maintained for intended
reaction duration
• The pump was switched off and the system was cooled down
The start of the time on stream is defined as the time when the Latek pump was switched on.
Figure 77 represents the fixed bed reactor set up.
el.
Reactor
TIC
FIC
Nitrogen
PumpMethanol/PC
CO2 / dry ice
cooling trap
Figure 94: P&I diagram of fixed bed reactor for propylene carbonate/methanol transesterification

Experimental – Reactors set up and methodology 133
Figure 95: Fixed-bed reactor set up for DMC production
5.1.4 Fluidized bed reactor for MDA
A quartz fluidized bed reactor was used for the investigations of MDA. A process and
instrumentation diagram (P&ID) of the entire system is presented in Figure 96. During the
reaction the typical temperature in the reactor was 973 K, in the cyclone 673 K, in the tube
after cyclone 593 K to avoid deposition of naphthalene (Tboil = 491 K) in the pipe. The reactor
has double layer insulation to keep safely high temperatures up to 800°C during the reaction.
Four temperature controllers Eurotherm 818, one for each described below heating zone,
regulated the temperature during the reaction:
- preheater,
- reactor,
- separator (cyclone),
- tube for reaction products.
The gas flow was regulated by mass flow controllers of Brooks (type 5850E). The gas
mixture was added to the system through preheater and enters the fluidized bed reactor
through the filter at needed reaction temperature. The gas mixture contacts the fluidized
Experimental – Reactors set up and methodology 134
catalyst bed. After that the solid-gas mixture enters the cyclone where the solid particles are
separated from the gas phase. The solid catalyst particles fall down back to the reactor. The
reaction mixture in the gas phase is conducted via a tube to the cooling trap.
Prior to the reactions the pressure drop over the glass filter inside the reactor at temperatures
of 293 K and 973 K was determined. Subsequently the MFV (Minimal Fluidization Velocity)
was determined for the catalyst bed. The approach of the ∆P measurements according to the
gas velocity was applied. An example of measured MVF is represented in Figure 97.
Measured values corresponded well with the ideal curve, which is shown for comparison.
The reactions were carried out at the gas velocities larger than MFV approx. a factor of 1.5.
This makes sure that the catalyst bed is in the fluidized state.
The following procedure describes one cycle of experiment.
• Catalyst heated to 580°C under air (5°C/min and ~15 Nl/h).
• System maintained at 580°C under air for 12 hours.
• System flushed with nitrogen for 30 min (~15 Nl/h).
• Switched to CH4 and heated to 700°C (5°C/min and ~60 Nl/h).
• System maintained at 700°C for intended reaction duration.
• Switched to nitrogen and cooled to room temperature (5°C/min and ~15 Nl/h).
The start of the time on stream is defined as the time when the reactor reached required
reaction temperature.
Figure 98 represents a picture of the fluidized bed reactor set up.

Experimental – Reactors set up and methodology 135
Nitrogen fromring system
Vent toatmosphere
Compressed air
Methane
Carbondioxide
Molsieve 4API01
FI01
FC01
FI03
FI02
FI04
Molsieve 4A
Molsieve 4A
Molsieve 4A
R01
V01
PI02
Product collectionvessel
(cooled by cryostat)[iso-propanol]
V02
TI01
TI02
TI04
TC01
TC03
TC04
TC02
TI03
Figure 96: Process flow and instrumentation diagram of the fluidized bed reactor system
0
2
4
6
8
10
12
14
16
0 0,005 0,01 0,015 0,02 0,025 0,03 0,035
Gas Velocity (m/s)
DP
(mm
H2O
)
Figure 97: An example of detected MFV and ideal curve
ideal curve

Experimental – Reactors set up and methodology 136
Figure 98: Fluidized bed reactor set up.
5.1.5 Riser reactor for Ethyl Benzene to Styrene
A quartz glass riser reactor was used for the investigations of styrene production. It consists
out of five main zones as shown in Figure 99 and in the reactor picture Figure 100: pre-heater
in form of a coil, reactor, hopper for fresh catalyst, cyclone and product recovery vessel.
A Brooks mass flow controller of type 5850E regulates ethane flow. Together with the ethyl
benzene, which is pumped into this pre-heater zone at about half-length as a liquid with a
Latek pump, they are heated to the desired temperature. This temperature is controlled by a
thermocouple just underneath a quartz glass filter (< 80 µm). This filter prevents the catalyst
falling into the pre-heater. The thermocouple is situated inside a glass ‘finger’ for its better
determination and control of the temperature the gas flow. The thermocouples are not in
cccoooooolll iii nnnggg ttt rrr aaappp
gggaaassseeesss
rrr eeeaaacccttt ooorrr eeennnttt eeerrr
rrr eeeaaacccttt ooorrr
cccyyyccclll ooonnneee
mmmaaassssss fff lll ooowww cccooonnnttt rrr ooolll lll eeerrr sss fff ooorrr gggaaassseeesss

Experimental – Reactors set up and methodology 137
direct contact with ethane, ethyl benzene and catalyst because there are no gas tight seals at
600°C. Furthermore the metal of the thermocouple would cause side reactions.
The fresh catalyst is stored in a hopper, equipped with baffles to ensure a good catalyst down
flow, in which the catalyst can be heated. During the reaction the catalyst flows down in
hopper under its own weight and enters the reactor just above the quartz glass filter. An
additional “anti-arching” nitrogen flow was used in order to prevent blocking of catalyst
particles at the entrance to the riser. Without this “anti-arching” nitrogen flow it was possible
that catalyst blocked the tube at the low gas stream or the catalyst flow was unstable
(pulsing). The riser reactor ends in a cyclone, in which the catalyst is separated from the
product flow. The catalyst drops into a recovery vessel, from which it can be taken to be
regenerated batch wise. The organic products are cooled down in a double walled recovery
vessel (cooled with a cryostat filled with iso-propanol at ca. -10°C); gas samples of the off-
gas can be taken with a gas mouse.
The following procedure has been carried out during one cycle of experimentation:
- The apparatus was heated under flowing N2 with 5°C/min to the following
temperatures: Tpre-heater = 400°C, Treactor = 500°C, Thopper = 500°C, Tbottom cone hopper =
500°C,
- Afterwards the catalyst recovery vessel and the fresh catalyst hopper were flushed
with argon. The calcined catalyst, stored under argon, was filled into the hopper under
flowing argon. Subsequently, the hopper temperature was increased to 650°C and the
reactor temperature to 550°C. The system was left to stabilize at these temperatures
overnight,
- The relative low temperature of pre-heater zone of 400°C was chosen to avoid the
thermal cracking of ethyl benzene,
- For the reaction itself the ethane flow and the ‘anti arching’ nitrogen flow were started
until a rising system was obtained. Then the ethyl benzene flow was started. This was
defined as t = 0 min. During the reaction the catalyst flow was monitored continuously
to ensure that indeed a rising system was obtained. This monitoring was done visually
by observing the catalyst falls down in the recovery vessel,
- With a gas mouse gas samples were taken after 30 min TOS, which should ensure a
stable system,

Experimental – Reactors set up and methodology 138
- After all catalyst was used the ethyl benzene and ethane flows were stopped, and the
reactor was flushed with nitrogen for several minutes,
- The product recovery vessel, which was cooled to ca. –10°C during the reaction, was
taken from the reactor, and washed with ethanol. This solution was analyzed by gas
chromatography,
- The catalyst throughput was determined by weighing the empty catalyst recovery
vessel before and after the reaction,
- Between the reactions the catalyst remaining in the reactor was removed with a
vacuum cleaner.
fresh catalysthopper withbaffles
spent catalyst
productrecoveryvessel
cyclone
pump
liquidsubstrate
gas in
gas out
Figure 99: Riser reactor set up

Experimental – Reactors set up and methodology 139
Figure 100: Riser reactor set up picture, shown without insulation and cooling trap
5.2 Chemicals and Gases
Most of the solid, fluid and gaseous materials were ordered by Aldrich, Merck or Fluka
catalogues in synthesis quality and were applied without further purification.
cccaaattt aaalll yyysssttt iii nnnlll eeettt
hhhoooppppppeeerrr
MMM iii cccrrr ooopppuuummmppp fff ooorrr fff lll uuuiii dddsss iii nnnlll eeettt
cccyyyccclll ooonnneee
RRReeeaaacccttt ooorrr eeexxxiii ttt ,,, cccoooooolll iii nnnggg ttt rrr aaappp cccooonnnnnneeecccttt iii ooonnn
ppprrr eeehhheeeaaattt eeerrr
gggaaassseeesss iii nnnlll eeettt

Experimental – Catalysts 140
5.3 Catalysts
DOW Chemicals kindly provided catalyst for dehydrogenation of ethyl benzene. The
catalyst was calcined in batches under air by heating with 5°C/min to 120°C, which
temperature is maintained for 3 h. Subsequently, the catalyst was heated to 650°C over 300
min, kept at 650°C for 5 h, and cooled down to 200°C. At this temperature the calcined
catalyst was transferred into glass bottles, in which it is stored under argon and left to cool
down to the ambient temperature.
4% Mo/HZSM-5 zeolite for methane dehydroaromatization was kindly provided by
ENICHEM Company. Physical mixtures of Mo2C and HZSM-5 and MoO3 and HZSM-5 were
prepared by mixing of corresponded amount of components.
Different zeolites for DMC production came from BASF, Zeolyst, USY, Valfor, Wessalith
or PQ companies. Table 28 represents Y-zeolites which were used as a starting material for
the preparation of different catalysts for the PC/methanol transesterification.
CaO was prepared from CaCO3 by keeping it in air atmosphere at 600°C during 4h.
Other metal oxides were purchased in Aldrich catalogue and were used without any pre-
treatments.
Table 28: List of supports used, their ionic form and origin
Internal name Name SiO2/Al 2O3 Ionic Form Origin, Fa. Structure
HV 00/08 CBV 780 80 H Zeolyst FAU
HV 92/71 CBV 400 5,2 H Zeolyst FAU
HV 97/02 - 5,6 Na Wessalith NaY FAU
HV 94/50 CBV 720
30 H SDUS PQ FAU
HV 94/46 CBV 760 55 H Valfor FAU
HV 94/45 CBV 740 42 H Valfor FAU
HV 94/44 CBV 712 11,5 NH4 Valfor FAU
HV 94/11 - - Ca 001/KH FAU
HV 93/17 - 6 H USY FAU
HV 92/72 CBV 500 5,2 NH4 Zeolyst FAU

Experimental – Catalysts 141
Table 29: List of used catalysts and catalyst preparation
Catalyst, internal name
Support/internal name
SiO2/Al2O3 Ionic form
Surface area of fresh
material in m2/g
Structure
Calcination
Press
in tons
Press time
in min
K-6 CBV 400 5.2 H 730 FAU Air calcination 4h at 500°C 10 30
K-8 CBV 712 11,5 NH4 730 FAU Air calcination 4h at 500°C 10 30
K-9 CBV 720 30 H 780 FAU Air calcination 4h at 500°C 10 30
K-10 CBV 740 42 H 740 FAU Air calcination 4h at 500°C 10 30
K-11 HV 97/02 5,6 Na 722 FAU Air calcination 4h at 500°C 10 30
K-12 CBV 760 55 H 720 FAU Air calcination 4h at 500°C 10 30
K-13 HV 94/11 - Ca 394 FAU Air calcination 4h at 500°C 10 30
K-14 HV 93/17 6 H 595 FAU Air calcination 4h at 500°C 10 30
K-15 CBV 500 HV
92/72 5,2 NH4 750 FAU Air calcination 4h at 500°C 10 30
K-16 CBV 720 HV
94/50 30 H 780 FAU
Air calcination 1h at 500°C 10 30
K-17 CBV 720 HV
94/50 30 H 780 FAU
Air calcination 6h at 500°C 10 30
K-18 K-9 Batch 2 30 H 780 FAU Air calcination 4h at 500°C 10 30
K-19 CBV 720 HV
94/50 30 H 780 FAU
Air calcination 4h at 450°C 10 30
K-20 CBV 720 HV
94/50 30 H 780 FAU
Air calcination 4h at 550°C 10 30
K-21 CBV 720 HV
94/50 30 H 780 FAU
Air calcination 1h at 500°C 10 10
K-22 CBV 720 HV
94/50 30 H 780 FAU
Air calcination 4h at 550°C 8 10
K-23 CBV 720 HV
94/50 30 H 780 FAU
Air calcination 6h at 500°C 10 10
K-24 CBV 720 HV
94/50 30 H 780 FAU
Air calcination 4h at 550°C 9 10
K-25 CBV 720 HV
94/50 30 H 780 FAU
Air calcination 4h at 550°C 10 10
Superbase MgO/Na/NaOH for DMC production was prepared as follows:
Required amount of MgO was placed inside a metal stirring reactor. The reactor was flushed
with nitrogen during all preparation procedure. The reactor was heated to 350°C with heating
rate of 5°C/min. Then it was maintained at 350°C for 3h. After that NaOH was added and
maintained next 3h at 350°C. Afterwards Na was added. After stirring for the next 2h at
350°C the reactor was cooled down at 5°C/min ramp and finally the prepared catalyst was
transferred to the sealed flask.

Experimental – Catalysts 142
Hydrotalcites for DMC production were produced on the follow way:
First Mg2Al-NO3 was prepared by adoption of the induced hydrolysis method developed by
Taylor [140]. Dissolved CO2 was removed by bubbling N2 through deionized water. This
solution was added drop wise to an aqueous solution of NaOH (375 mmol in 100 ml) in 90
min, with continuous stirring. The pH of the mixture was 13. Following the addition, the
mixture was kept at 346K for 18h by continuous stirring. The resultant slurry was cooled
down to the room temperature and solid product was separated by filtration, washed with
deionized water and dried at 393 K overnight.
Then Mg2AlOH was prepared by ion-exchange of Mg2AlNO3. Mg2AlNO3 (1g) was added to
a NaOH solution in 100 ml deionized water. The NaOH was taken in 50-100% stoichiometric
excess of NO3- amount in Mg2AlNO3. The mixture was stirred for 2h at 343K. After two ion-
exchange treatments the product was separated by filtration, washed and dried at 393K
overnight.
5.4 Product analysis
5.4.1 Gas chromatography
The fluid reaction products were cooled and collected in an iso-propanol / CO2 cooling trap.
Dichloromethane or acetone was used as a solvent to dissolve reaction products (solid
naphthalene crystals formed prior to the cooling trap in case of MDA reaction). Mesitylene
was used as an external standard. Products were analyzed on a 60 m FE-SE54 column (70°C
to 270°C, at 8°C/min, 10 min isotherm at 270°C).
5.4.2 Mass spectrometry (GC-MS)
Mass spectrometry was used for identification of unknown products. Follow apparatus and
conditions were used:
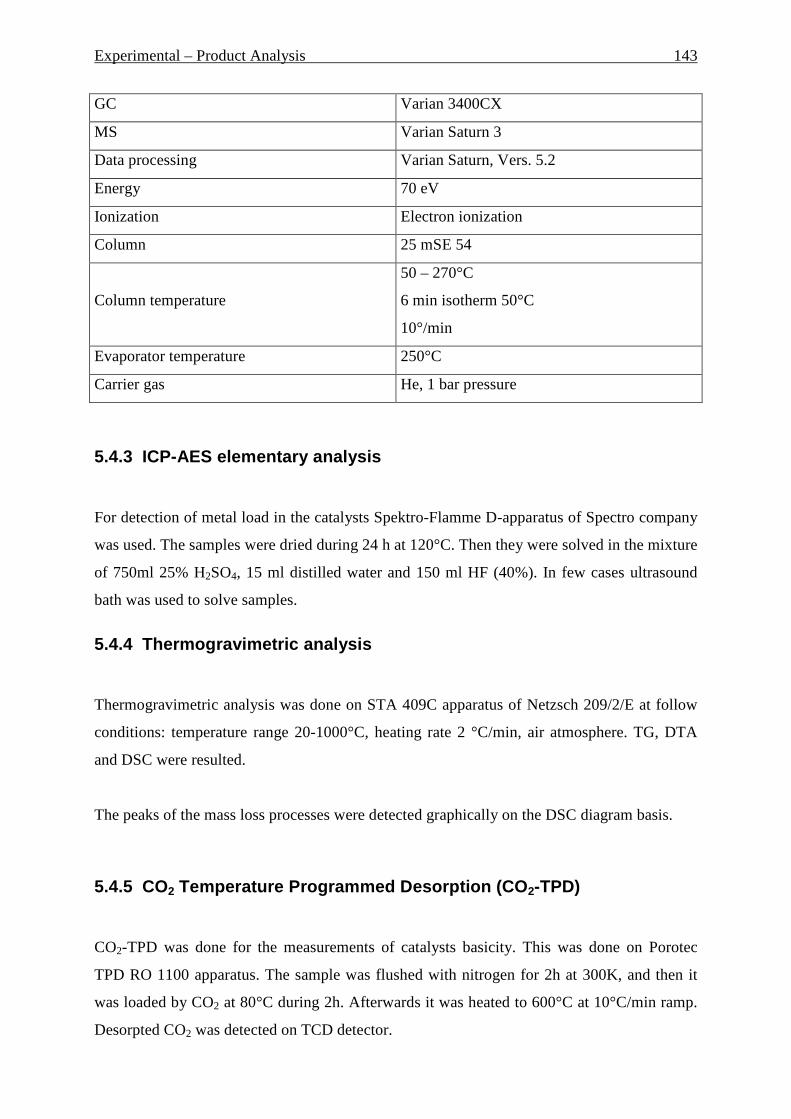
Experimental – Product Analysis 143
GC Varian 3400CX
MS Varian Saturn 3
Data processing Varian Saturn, Vers. 5.2
Energy 70 eV
Ionization Electron ionization
Column 25 mSE 54
Column temperature
50 – 270°C
6 min isotherm 50°C
10°/min
Evaporator temperature 250°C
Carrier gas He, 1 bar pressure
5.4.3 ICP-AES elementary analysis
For detection of metal load in the catalysts Spektro-Flamme D-apparatus of Spectro company
was used. The samples were dried during 24 h at 120°C. Then they were solved in the mixture
of 750ml 25% H2SO4, 15 ml distilled water and 150 ml HF (40%). In few cases ultrasound
bath was used to solve samples.
5.4.4 Thermogravimetric analysis
Thermogravimetric analysis was done on STA 409C apparatus of Netzsch 209/2/E at follow
conditions: temperature range 20-1000°C, heating rate 2 °C/min, air atmosphere. TG, DTA
and DSC were resulted.
The peaks of the mass loss processes were detected graphically on the DSC diagram basis.
5.4.5 CO2 Temperature Programmed Desorption (CO 2-TPD)
CO2-TPD was done for the measurements of catalysts basicity. This was done on Porotec
TPD RO 1100 apparatus. The sample was flushed with nitrogen for 2h at 300K, and then it
was loaded by CO2 at 80°C during 2h. Afterwards it was heated to 600°C at 10°C/min ramp.
Desorpted CO2 was detected on TCD detector.
Experimental – Product Analysis 144
5.4.6 BET analysis
Surface area, micropore area and volume of the catalyst were measured by BET method on
ASAP 2000 of Micromeritics.
5.4.7 X-ray diffraction analysis (XRD)
X-ray diffraction (XRD) patterns were obtained in air on the Siemens D5000 apparatus.

Annex 1 145
Annex 1. Boiling points and danger classes of used chemicals
Boiling point in °C Danger
Propylene Carbonate (PC) 242
Methanol 65
Dimethyl Carbonate (DMC) 90
Propylenglycol (PG) 189 -
Azeotrope DMC*6MeOH (30
wt.% DMC, 70 wt.% MeOH) 63 -
Mesitylene 165
Benzene 80
Toluene 111
Naphthalene 218
Dichloromethane 40
Ethyl benzene 136
Styrene 145

146
6 Literature
1 Johannesburg Declaration on Sustainable Development, Johannesburg, 2002 2 Anastas, P. T.; Warner, J. C. Green Chemistry: Theory and Practice, Oxford University Press: New York, 1998, p.30 3 EcoScale, a semi-quantitative tool to select an organic preparation based on economical and ecological parameters. Van Aken K, Strekowski L, Patiny L Beilstein Journal of Organic Chemistry, 2006 4 A.Greco, F.Rivetti, Chim. Ind. (Milan) 80 (1998) 77 5 June, Eur. Chem. News 69 (15-21) (1998) 29 6 A.-A. Shakh, S.Sivaram, Chem. Rev. 96 (1996) 951 7 M.Aresta, E.Quaranta, Tetrahedron 47 (1991) 9489 8 Z.H.Fu, Y.Ono, J. Mol. Catal. 91 (1994) 399 9 U.Romano, F.Rivetti, Chimicaoggi 9 (1984) 37 10 A.Bomben, C.A.Marques, M.Selva, P.Tundo, Tetrahedron 51 (1995) 11573 11 A.Ben Taleb, G.J.Jenner, J. Mol. Catal. 84 (1993) L131 12 G.Gerbaz, G.Fisicaro, R.L.Shubkin (ed.), Synthetic Lubricants and High Performance Functional Fluids, Marshall Dekker, New York, 1993, p.229 13 Johnston, D., 2003 14 A.F.Cronstedt, Observations and Descriptions: On an Unknown Mineral - Species Called Zeolites. Int. Zeolite Conf. 17, 1756, 120-123 15 Baerlocher, Meier, Olson: Atlas of zeolite framework types, Fifth Revised Edition. 2001 16 Herreros, B., The X-Ray Diffraction Zeolite Database on the web (http://suzy.unl.edu/bruno/zeodat/zeodat.html), December 2006 17 Meier, W. M., et. al., The Atlas of Zeolite Structure Types on the web (http://www-iza-sc.csb.yale.edu/IZA-SC/Atlas/AtlasHome.html), December 2006 18 Subhash Bhatia, Zeolite Catalysis: Principles and Applications, CRC Press, Inc., Boca Raton, Florida, 1990 19 Ribeiro, F. R., et. al., ed., Zeolites: Science and Technology, Martinus Nijhoff Publishers, The Hague, 1984 20 K.Tanabe, W.Hölderich. Appl.Catalysis A:General 181 (1999) 399-434 21 Pfenninger, A. Manufacture and use of zeolites for adsorption processes. Molecular Sieves (1999), 2 (Structures and Structure Determination), 163-198 22 Grace, Chem. Eng., 64, 353-363 (1986) 23 Gmehling/Brehm, Grundoperationen - Lehrbuch der Technischen Chemie, Band 2, 1996, Georg Thieme Verlag, Stuttgart, Fig.1.10, p.25 24 R. Reynoldson, Heat Treatment in Fluidized Bed Furnaces (Materials Park, OH: ASM International 1993) 25 Perry’s Chemical Engineers’ Handbook. Seventh Edition, 1997 26 Weissermel, K., Industrial Organic Chemistry, 3rd Edition, VCH, New York, 1997 27 Weissermehl, K., Arpe, H.J., Industrielle Organische Chemie- 4. erweiterte Aufl. VCh-Verl. Weinheim. 1994 28 Ullmann’s Encyclopaedia of Industrial Chemistry, 6th Ed., 2001 Electronic Release 29 J. Gmehling, A.Brehm. Lehrbuch der Technischen Chemie, Stuttgart:Tieme. Bd.3 Chemisch Prozesskunde. 1996 30 J. Gmehling, A.Brehm. Lehrbuch der Technischen Chemie, Stuttgart:Tieme. Bd.2 Grundoperationen. 1996 31 S.J. Hamper, W.M. Castor, R.A. Pierce, WO 01/56960 (2001), assigned to Dow Chemical Co. 32 Sherrod, Smith: Dehydrogenation Catalyst. US4758543, assigned to The Dow Chemical Company, 1988 33 IPCC Third Assessment Report on the web 34 BP Statistical Review of World Energy, 2006. Natural gas section. © BP 35 http://www.oilcrisis.com/ on the web. 36 Key World Energy Statistics, International Energy Agency, 2006 Edition 37 M.Tessic du Motay and M. Marechal, Bull.Soc. Chim. Paris 9 (1868) 334 38 L.Mond and C. Langer. Chem Zentralbl. II (1890) 32 39 A. York, T. Xiao and M. Green. Topics in Catal. Vol.22, Nos.3-4, 2003 40 J.H.Lunsford, Stud. Surf. Sci. Catal. 81 (1993) 1 41 H.Gesser, N.Hunter and C.Prakash, Chem. Rev. 85 (1985) 235 42 V. Durante, D.Walker, S.Gussow and J.Lyons, U.S. Patent No. 4,918,249 to Sun Refining and Marketing Company (1990) 43 K.Otsuka, T.Komatsu, K.Jinno, Y.Uragami and A.Morikawa, in: Proc. 9th Int.Congr. Catal., eds. M.J. Philips and M.Ternan. 44 R.Periana, D.Taube, E.Evitt, D.Loeffler, P.Wentreek, G.Voss and T.Masuda, Science 259 (1993) 340 45 Wang, L., Tao, L., Xie, M., Xu, G., Catal. Lett. 21 (1993) 35

147
46 N.Amin, Kusmiyati, Journal of Natural Gas Chemistry 13(2004)148-159 47 Y.Shu, R.Ohnishi, M.Ichikawa, J. of Cat., 206, 134-142 (2002) 48 W.Chu, F.Qiu, Topics in Catalysis, Vol.22, Nos. 1/2, January 2003 49 S.Wong, Y.Xu, L.Wang, S.Liu, G.Li, M.Xie, X.Guo. Catalysis Letters, 1996, 39-43 50 Xiong, Z., Chen, L., Zhang, H., Zeng, J., Lin, G., Catalysis Letters, 2001, 74, 3-4 51 Solymosi, F., Szoke, A., Egri, L., Topics in Catalysis, 1999, 249-257 52 R.Kojima, S.Kikuchi and M.Ichikawa, Chem.Lett., Vol.33, No.9 (2004) 53 Zhang, Y., Wang, D., Fei, J., Zheng, X., Australian Journal of Chemistry, 2002, 55, 531-534 54 Liu, B., Yang, Y., Sayari, A., Applied Catalysis A: General, 2001, 214, 95-102 55 Liu, S., Dong, Q., Ohnishi, R., Ichikawa, M., Chem. Communications, 1997, 1455-1456 56 Wang, L., Murata, K., Sayari, A., Grandjean, B., Inaba, M., Chemical Communications, 2001, 1952-1953 57 P.Sily, F.Noronha, F.Passos, Journal of Natural Gas Chem., 15 (2006), 82-86 58 Weckhuysen, B., Wang, D., Rosynek, M., Lunsford, J., Journal of Catalysis, 1998, 175, 338-346 59 H.Liu, Y.Li, W.Shen, X.Bao, Y.Xu, Catalysis Today, 93-95, 2004, 65-73 60 S.Kikuchi, R.Kojima, H.Ma, J.Bai, M.Ichikawa, Jour. of Catalysis, 242, 2006, 249-356 61 Shu, Y., Ohnishi, R., Ichikawa, M., Catalysis Letters, 2002, 81, 1-2 62 Y.Xu, S.Liu, L.Wang et al., Catal. Lett. 30 (1995) 135-149 63 Y.Shu, D.Ma, L.Xu et al. Catal. Lett. 70 (2000) 67 64 Y.Shu, D.Ma, X.Liu et al., J.Phys. Chem.B 104 (2000) 8245 65 S.Liu, Q.Dong, R.Ohnishi, M.Ichikawa, Chem. Communic. (1997) 1455 66 L.Wang., R.Ohnishi, M.ichikawa, J.Catal. 190 (2000) 276 67 J.Zeng, Z.Xiong, H.Zhang et al., Catal. Lett. 53 (1998) 119 68 B.Weckhuysen, D.Wang, M.Rosynek, J.Lunsford, J.catal. 175 (1998) 338 69 B.Weckhuysen, D.Wang, M.Rosynek, J.Lunsford, J.catal. 175 (1998) 347 70 C.Zhang, S.Li, Y.Yian et al., Catal. Lett. 56 (1998) 207 71 Liu, S., Wang, L., Ohnishi, R., Ichikawa, M., Journal of Catalysis, 1999, 181, 175-188 72 Shu, J., Adnot, A., Grandjean, P.,Inustrial & Eng. Chem. Research, 1999, 38, 3860-3867 73 H.Liu, W.Shen, X.Bao, Y.Xu, Appl. Cat. A: General, 295 (2005), 79-88 74 H.Liu, X.Bao, Y.Xu, Journal of Catalysis, 239, 2006, 441-450 75 H.Liu, W.Shen, X.Bao, Y.Xu, J. of Mol. Catalysis A: Chemical, 244, 2006, 229-236 76 W.Ding, G.Meitzner, E.Iglesia, J. Catal. 206 (2002) 14 77 B.Weckhuysen, M.Rosynek and J.Lunsford, Catal. Lett., 52 (1998) 31-36 78 Y.Kim, R.Borry, E.Iglesia, J.Catal. 191 (2000) 373 79 S.Tang, H.Chen, J.Lin, K.Tan, Cat. Comm. 2 (2001) 31-35 80 Y.Song, C.Sun, W.Shen, L.Lin, Cat.Lett. Vol. 109, Nos. 1-2, June 2006 81 P.Tan, Y.Leung, S.Lai, C.Au, Appl.Cat. A: General 228 (2002) 115-125 82 L.Wang, Y.Xu, S.Wong, W.Cui, X.Guo, Appl. Cat. A: General 152 (1997) 173-182 83 D.Ma, Y.Lu, L.Su, Z.Xu, Z.Tian et al., J.Phys. Chem. B 2002, 106, 8524-8530 84 H.S.Lacheen, E.Iglesia, J.of Cat., 230 (2005) 173-185 85 H.Ma, R.Kojima, S.Kikuchi, M.Ichikawa, J. of Natural Gas Chem. 14 (2005) 129-139 86 R.Ohnishi and M.Ichikawa, Cat.Surveys from Japan, Vol. 5, No. 2, April 2002 87 S.Liu, Q.Dong, R.Ohnishi and M.Ichikawa, Chem. Commun., 1998, 1217 88 L.Wang, R.Ohnishi and M.Ichikawa, Cat.Lett. 62 (1999) 29-33 89 Y.Shu, H.Ma, R.Ohnishi and M.Ichikawa, Chem. Commun., 2003, 86-87 90 Y.Shu, R.Ohnishi and M. Ichikawa, J.of Cat. 206, 134-142 (2002) 91 S.Yuan, J.Li, Z.Hao, Z.Feng et al., Cat. Lett., 63 (1999) 73-77 92 H.Shen, Y.Li, W.Shen, Y.Xu, X.Bao, J. of Natural Gas Chem., 13 (2004) 10-166 93 P.Tan, Y.Leung, S.Lai, C.Au, Cat. Lett. Vol. 78, Nos. 1-4, March 2002 94 H.Ma, R.Kojima, R.Ohnishi, M.Ichikawa, Appl. Cat. A: General 275 (2004) 183-187 95 Tundo, Pietro. Chimica e l’Industria (Milan) (1994), 76(8-9), 558-61 96 A. Bomben, M.Selva, P.Tundo. Recueil des Travaux Chimiques des Pays-Bas (1996), 115(4), 256-260 97 Ono, Yoshio. Catalysis Today (1997), 35(1-2), 15-25 98 Ono, Yoshio. Applied Catalysis, A: General (1997), 155(2), 133-166. 99 S.Memoli, M.Selva, P.Tundo, Chemosphere 43 (2001), 115-121 100 D.Delledone, F.Rivetti, U.Romano, Appl. Cat. A: General 221 (2001), 241-251 101 U.Romano, M.Massi Mauri, F.Rivetti, Ing.Chim. Italy 21 (1985), 6 102 M.Wang, N.Zhao, W.Wei and Y.Sun, Ind. Eng. Res. 2005, 44, 7596-7599 103 Knifton, J.F.; Duranleau, R.G., J.Mol.Catal. 1991, 67, 389-399 104 M.Sankar, N.H.Tarte,P.Manikandan, Appl. Catal. A 276 (2004) 217-222 105 K. Takashi, MITSUBISHI CHEM CORP, JP2003342209, 2003
148
106 O. Yoshimi et al., CHIYODA CHEM ENG CONSTRUCT CO, JP10036297, 1998 107 Y. Terunobu, Y.Takashi, TEIJIN LTD, JP9278689, 1997 108 B.M.Bhanage et al., Appl. Cat. A General 219 (2001) 259-266 109 K.Nishira, K.Mizature, S.Tanaka: EP Patent 425, 197 (1991) 110 H.J.Busych, A.Klausener, R.Langer and F.J.Mais, Ger. Offen. DE 1991, 4129316 111 L.K.Frevel and J.A.Gilpin, U.S. Pat. 1972, 3642858 112 H.J.Busych, H.Krimm and H.Rudolph, Ger. Offen. 1979, 2740243 113 T.Tatsumi, Y.Watanabe and K.A.Koyano, Chem. Commun., 1996, 2281 114 Man Seok Han et al., React.Kinet.Catal.Lett., Vol.73, No.1, 33-38 (2001) 115 Jiang, Qi; Li, Xiangsheng; Li, Qinyuan; Huang, Zhongtao, Tianranqi Huagong (1997), 22(5), 1-4 116 Y.Watanabe, T.Tatsumi, Microp. and Mesop. Materials, 22 (1998), 399-407 117 T.Zhao, Y.Li, X.Chen, Y.Han, Y.Sun, J. of Ningxia Univ. (Natural Science Edition), 2001, Vol.22, No.3 118 M.Bhanage, S.Fujita, Y.He, Y.Ikishima et al., Cat. Letters, 83, Nos. 3-4, Nov. 2002 119 Tong Wei, M.Wang, Wei Wei, Yuhan Sun and Bin Zhong; ACS, 2003, 852, 138-158 120 Wei et al., Green Chemistry, 2003, 5, 343-346 121 T.Wei, M.Wang, W.Wei, Y.Sun, B.Zhong, Fuel Proces. Technol., 83 (2003), 175-182 122 X.Feng, X.Lu, R.He. Applied Catalysis A: General 272 (2004) 347-352 123 E.Jeong, K.Kim, D.Park, S.Park, J.Lee, React.Kinet.Catal.Lett. Vol.86, No.2, 241-248 (2005) 124 Y. Chen, X. Zhao, Y. Wang. Shiyou Huagong (2005), 34(2), 105-110 125 Shekhar M Dhuri and Vijaykumar V Mahajani, J Chem Technol Biotechnol 81:62-69 (2006) 126 H.Wang, M.Wang, W.Zhang, N.Zhao, W.Wei, Y.Sun, Cat.Today, 115, 2006, 107-110 127 M.Sankar, C.Madhavan Nair, K.V.G.K.Murty, P.Manikandan, Appl. Cat. A: General 312 (2006), 108-114 128 Tang, P. Fine Organic Synthesis Chemistry and Technology, 1st ed.; Tianjin University Press, Tianjin, 1993, p.22 129 Iizuka, T.: Hattori, H.;Ono, Y. Et al. J. Catal. 1971, 22,130-139 130 Robert H. Perry, “Perry’s Chemical Engineers’ Handbook”, 7th ed., McGraw Hill Companies, pp. 6-50 – 6-52 131 Maude and Whitmore, Br. J. Appl. Phys., 9, 477-482, 1958 132 Kunii D. and O. Levenspiel, “Fluidization Engineering”, 2nd edition, Butterworth-Heinemann, Boston (1991) 133 Liu, Nutt, Iglesia, Catal.Lett. 92 (2002) 271 134 Claridge, York, Brungs, Marquez-Alvarez, Sloan et. al., J. Catal. 180 (1998) 85 135 Weckhuysen, Rosynek, Lunsford, Catal.Lett. 52 (1998) 31 136 Wolfgang F. Hölderich, “Zeolitic Catalysts as Useful Tools for the Formation and the Cleavage of C-O bonds in Fine Chemicals”, Catalytic Science and Technology, Vol. 1, 1991. 137 US4058576, Clarence D. Chang, Shamsher S. Grover, assigned to Mobil Oil Corporation, 1977 138 R.Eckelt, M.Fait et al., WO2006077254 assigned to Institut für Angewandte Chemie Berlin-Adlershof E.V., 27.07.2006 139 S.King, M.Jones et al., US5391803 assigned to Dow Chemical Company, 3.01.1994 140 R.M.Taylor, Clay Miner. 19 (1984) 591
149
Curriculum Vitae
Personal Data:
Name Dimitri Mousko
Date of burth 19.08.1978
Place of burth Novomoskovsk, Soviet Union
Marital status Married
Citizenship Germany
Education and working expirience:
1995 - 1999 Moscow Gubkin-University for Oil and Gas,
Russian Federation
Chemical Engineering
1999 - 2001 TU Bergakademie Freiberg, Germany
Energy Engineering
2002 - 2003 TU München, Germany
Researcher
2004 - 2006 RWTH Aachen, Germany
Ph.D. in Heterogeneous Catalysis
since 2007 Clyde Bergemann GmbH, Germany
Process Engineer


![[Charles N. Satterfield] Heterogeneous Catalysis](https://static.fdocuments.in/doc/165x107/577cc1a51a28aba71193945e/charles-n-satterfield-heterogeneous-catalysis.jpg)