Heroin purity and composition: an analysis of …...Technical Report 79 Heroin purity and...
37
Technical Report 79 Heroin purity and composition: an analysis of street-level samples in Cabramatta, NSW. Wendy Swift, Lisa Maher 1 and Michael Dawson 2 National Drug and Alcohol Research Centre, UNSW, 1 School of Medical Education, UNSW and 2 Department of Chemistry, Materials and Forensic Science, University of Technology, Sydney. ISBN: 0 7334 0658 0 © NDARC 1999
Transcript of Heroin purity and composition: an analysis of …...Technical Report 79 Heroin purity and...

Technical Report 79
Heroin purity and composition: an analysis of street-level samples in Cabramatta, NSW.
Wendy Swift, Lisa Maher1 and Michael Dawson2
National Drug and Alcohol Research Centre, UNSW, 1School of Medical Education,
UNSW and 2Department of Chemistry, Materials and Forensic Science, University of
Technology, Sydney.
ISBN: 0 7334 0658 0
© NDARC 1999

TABLE OF CONTENTS
ACKNOWLEDGEMENTS ................................................................................................... II
EXECUTIVE SUMMARY .................................................................................................... III
1 INTRODUCTION ................................................................................................................ 1
1.1 HEROIN USE IN AUSTRALIA .............................................................................................. 1 1.2 BIOAVAILABILITY ............................................................................................................. 2
1.2.1 Form/Composition and route of administration ............................................... 2 1.2.2 Presence and type of processing impurities and/or adulterants/diluents ...... 4 1.2.3 Chasing and injecting techniques .......................................................................... 5
1.3 PURITY, OVERDOSE AND NON-INJECTING ROUTES OF ADMINISTRATION ............... 5 1.4 AIMS .................................................................................................................................... 7
2 METHODS .............................................................................................................................. 8
2.1 SAMPLE SELECTION .......................................................................................................... 8 2.1.1 Sampling frame ........................................................................................................ 8 2.1.2 Criteria for selecting samples ................................................................................. 9
2.2 PROCEDURE .................................................................................................................... 10 2.3 ANALYTICAL METHODS ................................................................................................ 10
3 RESULTS............................................................................................................................... 12
3.1 CHARACTERISTICS OF FINAL SAMPLE .......................................................................... 12 3.2 COMPOSITION ................................................................................................................ 14 3.3 PURITY ............................................................................................................................. 15 3.2 ADULTERANTS/DILUENTS ........................................................................................... 16
4 DISCUSSION ....................................................................................................................... 19
5 REFERENCES .................................................................................................................... 22
APPENDIX 1: CHARACTERISTICS OF THE 33 EXHIBITS ANALYSED. .... 27
APPENDIX 2: PERCENTAGE PURITY DATA FOR EACH OF THE SAMPLES ANALYSED EXPRESSED AS % MAJOR OPIATES, AND PRESENCE OF ADULTERANTS ................................................................................... 29
APPENDIX 3: THE AVERAGE PERCENTAGE PURITY DATA FOR EACH EXHIBIT ................................................................................................................................... 31

ACKNOWLEDGEMENTS
There are a number of people who require thanks, and without whom this project would
not have been possible.
This research was funded by a grant from the Drug and Alcohol Directorate, NSW
Department of Health. Their contribution is gratefully acknowledged.
We would also like to acknowledge Bruce Flaherty, currently of the Crime Prevention
Division, NSW Attorney General’s Department, for his support and enthusiasm from
the early days of this project.
The NSW Police Service generously allowed us access to the heroin samples analysed in
this research. In particular, we wish to thank the Cabramatta Patrol for their cooperation
and patience while the samples were being selected and collected. Special thanks to
Cabramatta Patrol Commanders Geoff Cavanagh and Peter Horton, and Senior
Constable Sue Bytheway.
Brian Moir, NSW Police Service, provided information on police procedure.
Mr Roy Day, Mr Jim Keegan, Ms Belinda Tosi, Dr Claude Roux and Dr Phil Maynard,
from the University of Technology, Sydney, for their contribution to the analyses.
Dr Shane Darke and Professor Wayne Hall provided helpful comments on earlier
versions of this manuscript.
Tanya Howard and Richard Peters assisted with the scanning of the photos.
ii
EXECUTIVE SUMMARY Recent Australian research has documented the emergence of smoking as a relatively
common route of heroin administration in south-west Sydney. However, transitions to
injecting are also common, often occurring within the space of a few months. This
contrasts with the situation in parts of Europe and the UK, where heroin smoking has
been a stable pattern of use among some heroin users since the late 1980s.
The bioavailability of heroin is determined by a number of factors, including
form/composition, route of administration, the presence of adulterants and impurities,
and chasing/injecting techniques. If, as existing data suggest, the heroin sold in
Cabramatta (and by extension the rest of Sydney) is predominantly heroin hydrochloride
(salt) rather than base, it may not be pharmacologically suitable for chasing. This study
therefore aimed to provide baseline data on the pharmacological properties of heroin
available for sale in Cabramatta during the six-month period from October 1996 to
March 31, 1997.
A retrospective sampling frame was generated comprising all police seizures (“exhibits”)
suspected of containing heroin logged in the exhibit books at Cabramatta Police Station
in the six months October 1, 1996 to March 31, 1997 (n=487). A total of 33 street-level
“exhibits”, comprising 88 samples (e.g., multiple balloons and foils), were obtained from
the NSW Police Service for these analyses.
All of the 88 samples analysed contained heroin as the hydrochloride salt. No heroin
free base was encountered. The mean purity of the 88 heroin samples was 66.2 %.
Fifteen percent of exhibits and samples were of very high purity (91-100 %), while none
were less than 20 % pure. While the purity of these samples was significantly higher (at
sample level) than the purity of the Cabramatta heroin analysed earlier by Weatherburn
and Lind (1997), there was no linear trend in purity across the study period.
These analyses indicate that street-level heroin in Cabramatta was relatively free of
harmful adulterants. Those detected were pharmacologically inactive diluents largely
used to add bulk (sugars), or pharmacologically active adulterants used to improve the
bioavailability of heroin HCL when smoked (caffeine). The reasons for the addition of
paracetamol require clarification.
iii

iv
This study did not find evidence to support one pre-requisite for the development of a
heroin smoking culture - the availability of heroin in a form that could be easily and
efficiently smoked. No heroin free base was encountered. The adulterants and diluents
present in these samples were similar to those commonly found in the UK and Europe,
and to a lesser extent, the US. Given the ability of caffeine to increase the recovery rate
of smoked heroin hydrochloride, its addition in one third of these samples may be an
attempt to increase its volatility and hence facilitate heroin smoking. The reason for the
addition of paracetamol requires clarification, as its impact on volatility is uncertain.
The street-level samples analysed for this study had an average purity of 66%, with 85%
having an average purity of at least 50% heroin hydrochloride salts. This is in the range
reported for small NSW seizures (<2g) by the Australian Federal Police in 1997-1998
(64% to 71%). These findings have several implications for the risk of fatal overdose.
These results also suggest that while there may be a demand for harm-reduction
interventions designed to facilitate transitions from heroin injecting to smoking, careful
consideration of the pharmacological factors associated with route of administration is
required.

1 INTRODUCTION
1.1 Heroin use in Australia The development of a heroin-using culture in Australia began in the early part of this
century, where it was commonly included in patent medicines, and regularly used for
"therapeutic reasons". A major illicit market developed in the decade following its
prohibition (1954), and there was an increase in heroin use in the general Australian
population in the late 1960s and early 1970s. In Australia, injection has historically been
considered the dominant route of administration. Prior to the 1990s, there have been
only isolated reports of heroin smoking or sniffing (see Swift et al, 1997).
Recent Australian research has documented the emergence of smoking as a relatively
common route of heroin administration in south-west Sydney, particularly among
Indochinese users (e.g., Hando et al, 1998; Maher et al, 1998; Maher and Swift, 1997;
McKetin et al, 1999; Swift et al, 1999). However, transitions to injecting are also
common, often occurring within the space of a few months. These transitions may be
particularly rapid among “new injectors” (defined here as those who have been using
intravenously for two or less years). Recent research designed to characterise initiation to
injecting drug use and transitions from smoking to injecting among 184 young Indo-
Chinese people aged 15 to 24 found that two-thirds (64 %) reported making a transition
to injecting drugs that they had previously only used by non-injecting routes. The study,
conducted in Sydney and Melbourne, found that most transitions involved heroin (72
%), with eight people reporting transitions to injecting involving Normison (7%), and
eight reporting transitions involving cocaine (3%). The average age of initiation to
injecting was 17 years (Maher et al, 1999).
Reasons provided for such transitions are the perceived superior effect of injecting (a
better “rush”), and the beliefs that injecting is more cost-effective and smoking is a
“waste” (Maher and Swift, 1997; Swift et al, 1999; see also Atillasoy et al, 1996; Perez-
Jiminez and Robert, 1997). One third (32 %) of the sample interviewed by Maher et al.
(1999) claimed that the main reason they had switched routes was because they believed
the drug would be stronger and more cost-efficient (cheaper) if they injected it.
Transitions from injecting to smoking appear to be relatively rare in Australia (Maher et
al, 1998; Swift et al, 1999; but see Maher et al, 1999). This contrasts with the situation in
parts of Europe and the UK, where heroin smoking has been a stable pattern of use
1

among some heroin users since the late 1980s (e.g. de la Fuente et al, 1996; Gossop,
1995; Grund and Blanken, 1993; Perez-Jiminez and Robert, 1997; Strang et al, 1997a).
The research presented in this report arose as an attempt to better understand these
differences in patterns of heroin use: that is, why do most of the heroin smokers in
Sydney make such rapid transitions to injecting, compared to their overseas counterparts?
A plausible hypothesis is that route of administration has been affected by the
characteristics of the heroin available in Sydney compared to the UK and Europe. This
Introduction will briefly outline the literature on this issue.
1.2 Bioavailability Street market heroin is available in two forms: as a heroin salt, such as the hydrochloride,
which is freely soluble in water, or as heroin free base which is insoluble in water.
Heroin which is injected or snorted is, in fact, heroin hydrochloride (HCl) (or some other
salt). Smoking heroin is usually the free base, which is appreciably more volatile than the
salts (i.e., vaporises more easily).
The conversion of morphine to heroin (diacetylmorphine) is a simple chemical process.
However, illicit heroin usually contains acetylcodeine as well as O-6-
monoacetylmorphine and small amounts of other opium alkaloids. Acetylcodeine arises
from the acetylation of the codeine contained in crude morphine, and O-6-
monoacetylmorphine is a degradation product of heroin.
The bioavailability of heroin (i.e., the percentage of heroin that is actually absorbed) is
determined by a number of factors, including form/composition, route of
administration, the presence of adulterants and impurities, and chasing/injecting
techniques.
1.2.1 Form/Composition and route of administration Since the late 1970s heroin from south-west Asia has become increasingly available in
“base” form, often mixed with barbiturates and caffeine, in Europe and the UK (see
Strang et al, 1997a; 1997b). In south-west Asia, heroin is most often sold as the free
base, while it is typically converted to the hydrochloride salt elsewhere (United Nations
International Drug Control Programme, 1998). Heroin in Cabramatta, Australia’s largest
open-air drug market located in the south-western suburbs of Sydney, primarily derives
2
from south-east Asia, and is typically comprised of a type known as “Chinese No. 4”
(Australian Bureau of Criminal Intelligence, 1999). South-east Asian heroin is usually
white, with uncut samples having the appearance and consistency of laundry powder.
However, the product is increasingly being produced in finer and denser form and is
often retailed in small rock-like units or chunks. The purity of uncut south-east Asian
hydrochloride salt is typically 80 % or higher, is readily dissolved and injected, and only
rarely contains the alkaloid impurities noscapine or papaverine. South-east Asian heroin
base is reported as being less pure, with a higher probability of containing codeine and
noscapine (Australian Bureau of Criminal Intelligence, 1999; United Nations
International Drug Control Programme, 1998).
During the study period, heroin in Cabramatta was typically sold in pre-packaged “caps”,
whereby the drug is wrapped in a small piece of foil and sealed in small plastic balloons.
“Half-weights” (“Asian halves” for Asian customers were typically 0.5 grams, and “junkie
halves” for other customers weighed between 0.3 and 0.4 grams) were the next most
common unit of retail sale. In 1995 and 1996, caps sold for an average of $30 and half-
weights cost an average of $180 (Maher et al, 1998). Prices appear to have decreased
considerably since this time (McKetin et al, 1999).
Heroin “chasing” or “chasing the dragon” involves heating the heroin on aluminium foil
until it vaporises rather than burns. The fumes are then inhaled. As heroin
hydrochloride (HCl) is highly water soluble and has a higher melting point than heroin
base, it decomposes to a certain extent upon heating. This reduces the bioavailability of
heroin, and renders it less useful for inhalation than heroin base. Heroin base is quite
insoluble in water, but vaporises readily without decomposition, at lower temperatures
than heroin HCl (Strang et al, 1997a). Under laboratory conditions, approximately 60 %
of the heated heroin base is recovered, which is about three to four times as much as the
hydrochloride form (Grund and Blanken, 1993).
In an early study, Mo and Way (1966) compared urinary excretion of morphine over 72
hours after chasing and injecting heroin HCl. The mean percentage recovery of
morphine in the urine of injectors was 68 %, compared to only 26% for chasers. They
concluded that smoking was only about 40 % as effective as injecting. A later Dutch
study (Huizer, 1987) reported a recovery rate of only 17 % when heroin HCl was
3

smoked, compared to 62 % of heroin base – i.e., only 17 % of the heroin present in the
original sample was recovered. However, Huizer found that adding caffeine considerably
increased the recovery rate to 51 %. More recently, in the United States, Jenkins and
colleagues (Jenkins et al, 1994) used a computer-assisted smoking device to deliver single
“puffs” of heroin vapour to human subjects under controlled clinical conditions. In that
study, only 28 % of the heroin HCl dose was delivered intact when vaporised at 200 °C.
By contrast, 89 % of the heroin base vaporised without decomposition. This study
confirms beyond doubt that heroin form or composition has a significant impact on
bioavailability. Similar findings on bioavailability have been observed in relation to
opium smoking, with some experts suggesting that only about 20 % of the active
constituents of opium are actually absorbed when it is smoked (Kalant, 1997).
1.2.2 Presence and type of processing impurities and/or adulterants/diluents The percentage of heroin that is vaporised also depends on the presence and type of
impurities (e.g., the alkaloid impurities noscapine and papaverine) (Huizer, 1987) and
added compounds (e.g., pharmacologically inactive diluents (cutting agents) such as
sugars, or pharmacologically active adulterants such as caffeine). These may vary
according to region of production (United Nations International Drug Control
Programme, 1998), level of sale and other market variables (e.g., Des Jarlais et al, 1992).
There has been speculation that heroin may contain various toxic additives such as rat
poison, Ajax and chalk (see Coomber, 1999a; 1999b). “Unknown poisons” have also
been implicated in a fatal neurologic condition following heroin smoking (e.g., Tan et al,
1994). In reality, street adulteration/dilution is less frequent than is commonly believed,
and adulteration often occurs high in the distribution chain prior to importation
(Coomber, 1997a; Huizer, 1988). Most additives are relatively harmless and some
actually enhance the drug’s effect by increasing its bioavailability when chased (Coomber,
1999a; 1999b). During the 1990s, the most common additives in the UK and Europe
have been caffeine, paracetamol and various sugars (Coomber, 1997a; de la Fuente et al,
1996; Trimbos Institute, 1998). In the US there is great variability: the predominant
diluent was sugar, with other common additives being quinine, procaine and caffeine
(Coomber, 1999b).
4
The addition of caffeine, barbiturates, and methaqualone have been shown to increase
volatility and therefore increase bioavailability from the base and salt forms of heroin
(e.g., Cooke, 1991; Coomber, 1999a; Eskes and Brown, 1975; Gruhzit, 1958; Huizer,

1987; Huizer et al, 1977; Mo and Way, 1966). In the Netherlands, high levels of the
impurity noscapine, found in street-samples of heroin base from the mid-1980s, have
been shown to considerably reduce bioavailability when heroin is smoked (Huizer, 1987).
The reasons for adding paracetamol to heroin are unclear. In one of a series of studies
for his doctoral thesis, Huizer (1988) found that the addition of paracetamol substantially
reduced the bioavailability of smoked heroin base but produced a large yield of O-6-
monoacetylmorphine, a degradation product of heroin. The effects of paracetamol on
the recovery of heroin hydrochloride were not investigated.
1.2.3 Chasing and injecting techniques Despite evidence of reasonable recovery rates under controlled (laboratory) conditions,
in practice, bioavailability may be significantly reduced. Grund and Blanken (1993)
suggest that only 15-20 % of heroin used becomes available when heroin is smoked
carefully and under “ideal” conditions, and that poor chasing techniques may reduce
bioavailability even further. This literature suggests a much more complex relationship
between purity and bioavailability or "drug effect" (and possibly dependence) when the
drug is smoked. When administered intravenously, users’ experiences show a more or
less linear relationship to strength or purity – i.e., as purity increases, so does drug effect.
This may not necessarily the case when heroin is smoked.
1.3 Purity, overdose and non-injecting routes of administration An analysis of heroin obtained from undercover operations and seizures (including
supply-level seizures) in Cabramatta between February 1993 and January 1995 revealed
an average purity of 58.7 % (range: 13.2-79.8 %). More than three-quarters of the
samples obtained in this study were at least 50 % pure (Weatherburn and Lind, 1997).
More generally, an analysis of New South Wales seizures made by the Australian Federal
Police (AFP) in 1997-98 indicated a purity of between 63.8 to 70.5 % for quantities of
less than 2 g (Australian Bureau of Criminal Intelligence, 1999). In 1998, the average
purity of AFP seizures in NSW had increased from 64 % in 1997 to 71 % (McKetin et al,
1999). However, it is not known how applicable these results are to heroin consumed at
street level.
The emergence of non-injecting routes of administration (NIROA) has prompted
considerable controversy in Australia, with some commentators arguing for the
facilitation of such routes as a public health measure to reduce heroin-related harm (e.g.,
5

see Wood, 1996). In addition to their potential to decrease the occurrence of blood-
borne diseases, non-injecting routes of administration have also been promoted as
protective against overdose death (Hunt et al, 1998). There has been a 55-fold increase
in the rate of overdose fatalities in Australia since 1964 (Hall et al, 1999). One third of all
NSW fatalities between 1992 and 1996 occurred within the immediate surrounds of
Kings Cross and Cabramatta, with deaths in Cabramatta significantly more likely to occur
in public places (Darke et al, 1999b).
A study of fatalities in NSW in this period found that while injecting was the route of
administration implicated in the majority (99 %) of fatalities, non-injecting routes
precipitated death in 1 % (10) of cases. Four deaths occurred following smoking, four
following snorting and two cases after oral administration. These cases were
demographically similar to injection-related fatalities, polydrug use (particularly alcohol
consumption) was the norm and the toxicological profiles of the groups were similar
(Darke and Ross, in press). While these data indicate that intravenous administration
constitutes a greater overdose risk factor than non-injecting routes, they also indicate that
no route of administration can guarantee immunity to overdose.
Purity is often perceived as the main factor involved in overdose fatalities, despite
increasing evidence implicating polydrug use in heroin-related deaths (see Darke and
Zador, 1996). A time-series analysis of the relationship between heroin purity in south-
west Sydney (reported by Weatherburn and Lind, 1997) and fatal heroin overdose found
that the two were moderately correlated, with a role played by both mean purity and the
range of purity. However, purity accounted for only 40 % of the variance in overdose
deaths, supporting suggestions that it is a contributing, but not the sole, factor in
overdose aetiology (Darke et al, 1999a). Nonetheless, data on the nature of heroin sold
in south-west Sydney, including its composition, average purity, range of purity, and the
presence or otherwise of adulterants, may contribute to a better understanding of the
pharmacological factors influencing route of administration. It may also provide
potential for reducing the risks of heroin overdose and the transmission of blood-borne
viruses.
6

1.4 Aims
If, as existing data suggest, the heroin sold in Cabramatta (and by extension the rest of
Sydney) is predominantly heroin hydrochloride (salt) rather than base, it may not be
pharmacologically suitable for chasing. Transitions to injecting would therefore not be
surprising, and indeed, in most cases, would appear inevitable. In the wake of calls for
health professionals to promote “reverse transitions” (from injecting to smoking), there
is an urgent need for a better understanding of the contribution of heroin’s
pharmacological properties to routes of administration. This may help to inform the
development of harm minimisation strategies that rely on the adoption of non-injecting
routes of use. With the exception of routine analyses of heroin seizures by Government
laboratories, there are no data on this issue in Australia.
This study therefore aimed to provide baseline data on the pharmacological properties of
heroin available for sale in Cabramatta during the six-month period from October 1996
to March 31, 1997. Specifically, it aimed to:
(i) examine its form (i.e., salt or base)
(ii) its purity, and
(iii) the presence of impurities and adulterants.
7

2 METHODS
2.1 Sample selection
2.1.1 Sampling frame There is a specified police procedure for the handling of illicit drugs, including those
examined in this research. During a typical unplanned drug detection in which an
offender is identified, the drug(s) and packaging are weighed and photographed in situ in
front of the offender, who is charged at the nearest police station. The drug(s) and
offender are taken to a custody officer, and the drug(s) sealed in an exhibit bag in front
of the offender, who is then charged, photographed and fingerprinted. The drugs are
entered into the exhibit book by the exhibit officer (in the presence of the arresting
officer), and the sealed exhibit bag is then placed into the security cabinet in the exhibits
room. The procedure differs slightly during a planned operation, with a nominated
independent case exhibit officer attending the location of the operation with the exhibit
bags (Brian Moir, NSW Police Service, personal communication, August 30).
A retrospective sampling frame was generated comprising all police seizures (“exhibits”)
suspected of containing heroin logged in the exhibit books at Cabramatta Police Station
in the six months October 1, 1996 to March 31, 1997 (n=487). This period was chosen
as the most opportune time frame in order to maximise the availability of exhibits (i.e., to
minimise the likelihood that exhibits had been destroyed and to maximise the availability
of data from the NSW Division of Analytical Laboratories (DAL) confirming the
presence of heroin). The period also contained several overdoses (14-17/3/97) and a
number of heroin-related fatalities.
The majority of exhibits were indicative of the heroin available at street level, comprising
relatively small seizures (i.e., 75 % weighed 1g or less including packaging) made by the
local patrol. A small proportion (9.1 %) arose from large seizures and/or resulting from
other than local operations (e.g., district, regional and transit police, State and Federal
Taskforces, and Drug Enforcement Agency). Documentation from the NSW Division
of Analytical Laboratories confirming the presence of heroin was available for just under
half the exhibits (42.7 %).
8

2.1.2 Criteria for selecting samples At least one exhibit was sought for each of the 27 weeks comprising the study period.
As the aim was to examine the properties of heroin consumed by users, we decided to
select seizures from as close to street level as possible – i.e., from arrests of street-level
users and dealers/user-dealers in the Cabramatta area. Exhibits were selected in
accordance with the following criteria: primarily from local seizures, linked to a known
offender, and consisting of a small number (1-4) of balloons or foils, with a laboratory
weight of no more than 100-150mg as recorded on the DAL report in the Cabramatta
exhibit book. Thus, ideally, exhibits with accompanying verification of heroin content
were chosen, but these were not always available. Exhibits also had to be physically
available. A small proportion of the original or “first choice” exhibits (see below) was
unobtainable because they were required in court cases or had already been destroyed.
Under provisions contained in Section 10 (2) paragraph (a) of the NSW Drug Misuse and
Trafficking Act 1985 No. 226, authority was received from NSW Health, Pharmaceutical
Services Branch, for Dr Michael Dawson (chemist) to be in possession of the necessary
reference standards: heroin, O-6-monoacetylmorphine and acetylcodeine, and up to four
grams of street heroin (excluding packaging). Once this authority was in place, the NSW
Police Service was in a position to supply samples of seized heroin to conduct this
research project.
Of the 487 exhibits, 27 were deemed to meet all selection criteria and were requested
(“first choice”), representing approximately one per week of the time frame. An
additional 26 were selected as “reserves” if the first choice was unavailable, or because
they were seized at the scene of a suspected fatal overdose. The final sample obtained
from police comprised 33 exhibits, 23 of which had been requested as first choice or
“reserve” exhibits. As some of the requested exhibits were unavailable (required in court
or already destroyed), we were subsequently provided with an additional 10 non-
requested, but available, seizures. Two of these non-requested exhibits weighed
appreciably more than those which were requested (gross weights (with packaging) of 1.5
g and 3.5 g). These were selected primarily for the purposes of further analyses on the
conversion of salt to base. Two of the 33 exhibits were collected from the scene of
suspected heroin-related fatalities. These 33 exhibits yielded a total of 88 individual
samples, as many exhibits consisted of multiple items such as balloons and foils. The
9

characteristics of each of these exhibits are presented in Appendix 1. A summary of the
characteristics of the final sample and the sampling frame are presented in Table 1.
2.2 Procedure This project received approval from the NSW Police Service and NSW Department of
Health. The Committee on Experimental Procedures Involving Humans at the UNSW
was advised of this project, but as it did not come under its terms of reference, an
exemption from approval was granted. Permission was gained from NSW Police to
access 24 samples of 200 mg over a 6 month period. All exhibit books covering this
period were accessed and information pertinent to the selection criteria was entered for
each exhibit into a spreadsheet program on a laptop computer to facilitate selection of
the final sample. Requests for suitable samples were submitted by the Chief
Investigators, and the final sample was collected from the Patrol Commander according
to police protocol. All analyses were conducted by Dr Dawson at the laboratories of the
Department of Chemistry, Materials and Forensic Science, University of Technology,
Sydney.
2.3 Analytical methods Reference materials were purchased from either the Curator of Standards at the
Australian Government Analytical Laboratories or Sigma-Aldrich, USA.
At the laboratory, each exhibit was photographed with its packaging, and the contents
were recorded.
Ion chromatography was used to determine whether the samples contained heroin as the
free base or as the hydrochloride (or other salt).
High performance liquid chromatography with diode array detection was used to provide
quantitative information on the content of the following substances in each sample:-
diacetylmorphine hydrochloride (heroin hydrochloride), O-6-Monoacetylmorphine
hydrochloride (degradation product) and acetylcodeine hydrochloride (synthesis by-
product).
Gas chromatography/mass spectrometry was used to confirm the presence of
compounds amenable to analysis by this procedure – such as, heroin, O-6-
10

Monoacetylmorphine acetylcodeine, codeine, morphine, caffeine, paracetamol, procaine,
methaqualone, noscapine and papaverine (this technique provides qualitative data on
drugs that can be volatilised and chromatographed). Some samples contained trace
amounts of noscapine and other compounds which tentative library searches identified as
opiate-related compounds. High performance liquid chromotography with refractive
index detection was used to provide data on the types of sugars present in the samples.
All samples were handled and stored in accordance with Clauses 76, 113, 114, 119, 120,
122, 123 and 153 of the NSW Poisons and Therapeutic Goods Regulation 1994.
11
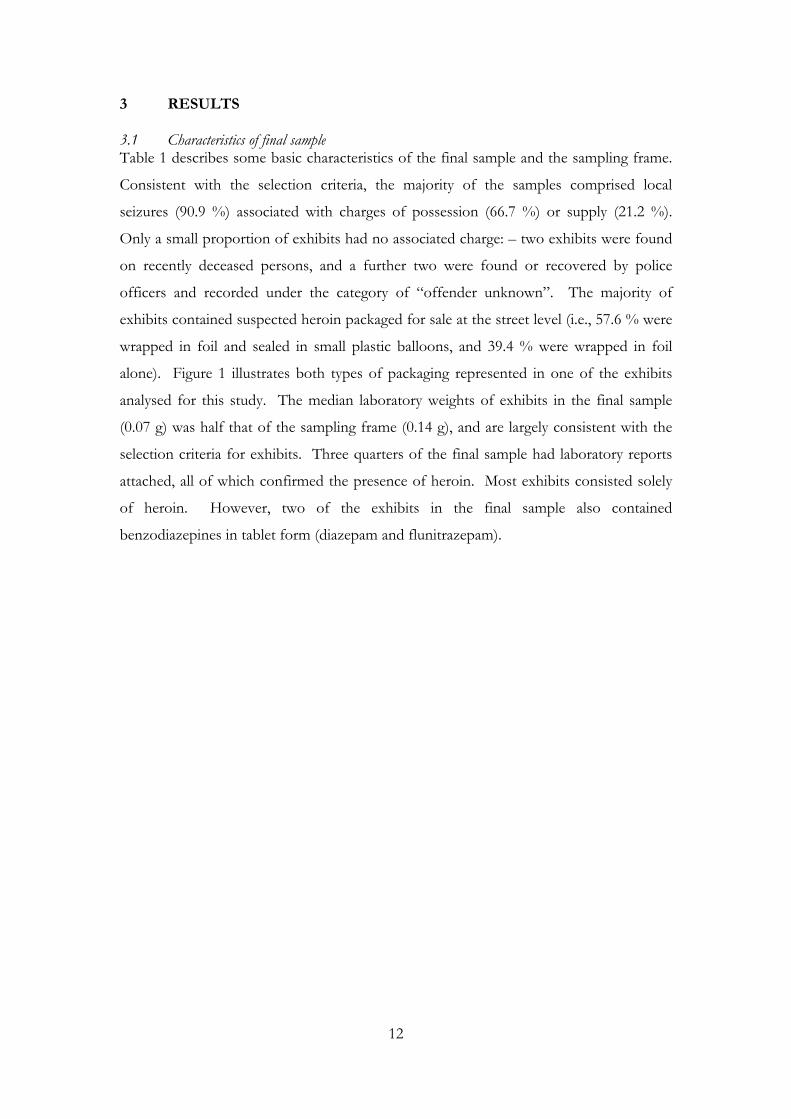
3 RESULTS 3.1 Characteristics of final sample Table 1 describes some basic characteristics of the final sample and the sampling frame.
Consistent with the selection criteria, the majority of the samples comprised local
seizures (90.9 %) associated with charges of possession (66.7 %) or supply (21.2 %).
Only a small proportion of exhibits had no associated charge: – two exhibits were found
on recently deceased persons, and a further two were found or recovered by police
officers and recorded under the category of “offender unknown”. The majority of
exhibits contained suspected heroin packaged for sale at the street level (i.e., 57.6 % were
wrapped in foil and sealed in small plastic balloons, and 39.4 % were wrapped in foil
alone). Figure 1 illustrates both types of packaging represented in one of the exhibits
analysed for this study. The median laboratory weights of exhibits in the final sample
(0.07 g) was half that of the sampling frame (0.14 g), and are largely consistent with the
selection criteria for exhibits. Three quarters of the final sample had laboratory reports
attached, all of which confirmed the presence of heroin. Most exhibits consisted solely
of heroin. However, two of the exhibits in the final sample also contained
benzodiazepines in tablet form (diazepam and flunitrazepam).
12
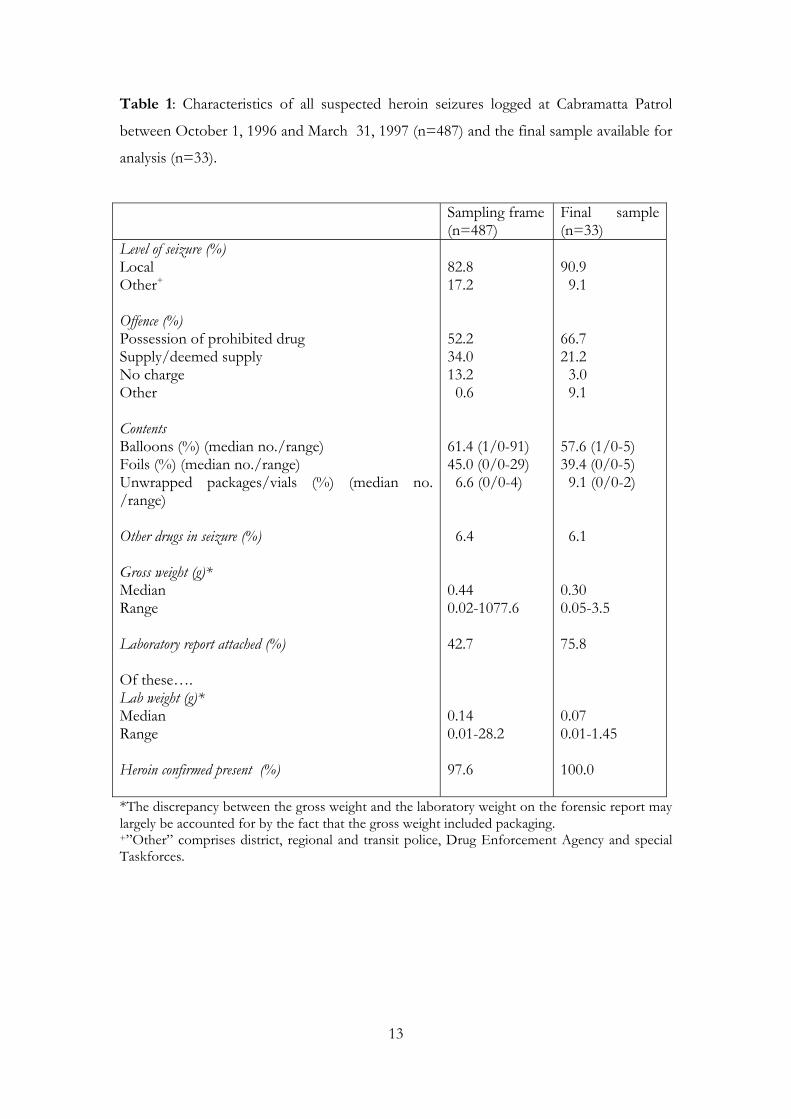
Table 1: Characteristics of all suspected heroin seizures logged at Cabramatta Patrol
between October 1, 1996 and March 31, 1997 (n=487) and the final sample available for
analysis (n=33).
Sampling frame (n=487)
Final sample (n=33)
Level of seizure (%) Local Other+ Offence (%) Possession of prohibited drug Supply/deemed supply No charge Other Contents Balloons (%) (median no./range) Foils (%) (median no./range) Unwrapped packages/vials (%) (median no. /range) Other drugs in seizure (%) Gross weight (g)* Median Range Laboratory report attached (%) Of these…. Lab weight (g)* Median Range Heroin confirmed present (%)
82.8 17.2 52.2 34.0 13.2 0.6 61.4 (1/0-91) 45.0 (0/0-29) 6.6 (0/0-4) 6.4 0.44 0.02-1077.6 42.7 0.14 0.01-28.2 97.6
90.9 9.1 66.7 21.2 3.0 9.1 57.6 (1/0-5) 39.4 (0/0-5) 9.1 (0/0-2) 6.1 0.30 0.05-3.5 75.8 0.07 0.01-1.45 100.0
*The discrepancy between the gross weight and the laboratory weight on the forensic report may largely be accounted for by the fact that the gross weight included packaging. +”Other” comprises district, regional and transit police, Drug Enforcement Agency and special Taskforces.
13
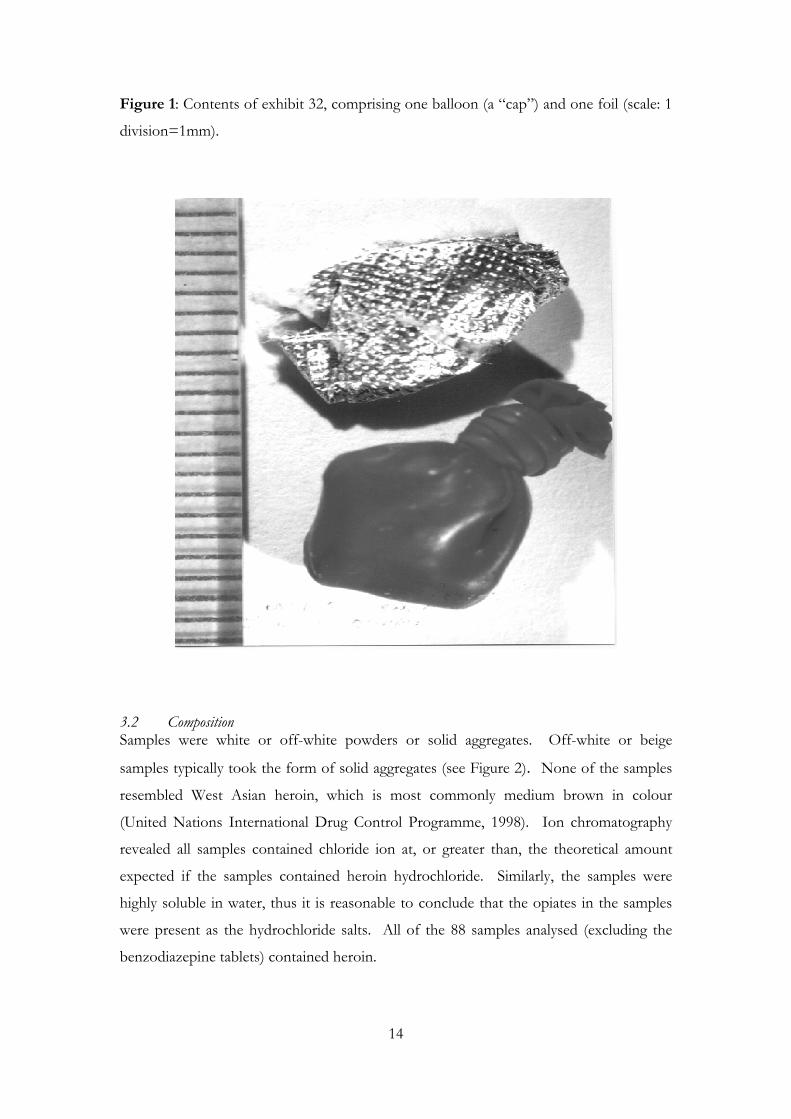
Figure 1: Contents of exhibit 32, comprising one balloon (a “cap”) and one foil (scale: 1
division=1mm).
3.2 Composition Samples were white or off-white powders or solid aggregates. Off-white or beige
samples typically took the form of solid aggregates (see Figure 2). None of the samples
resembled West Asian heroin, which is most commonly medium brown in colour
(United Nations International Drug Control Programme, 1998). Ion chromatography
revealed all samples contained chloride ion at, or greater than, the theoretical amount
expected if the samples contained heroin hydrochloride. Similarly, the samples were
highly soluble in water, thus it is reasonable to conclude that the opiates in the samples
were present as the hydrochloride salts. All of the 88 samples analysed (excluding the
benzodiazepine tablets) contained heroin.
14

Figure 2: Heroin contained in exhibit 32, comprising off-white/beige solid (highlighted).
3.3 Purity Purity was assessed by means of high performance liquid chromatography. The mean
purity of the 88 heroin samples, expressed as the percentage of each sample comprised
of major opiates (that is diacetylmorphine, O-6-monoacetylmorphine and acetylcodeine
occurring as the hydrochloride salts), was 66.2 % (SD=19.1, range=27-98 %). If these
data are examined at the level of exhibit (n=33), the mean purity was 68.1 % (SD=17.2,
range=29-94 %). Both levels indicate a mean purity greater than the mean of 58.7 %.
(n=322 samples; SD=14.8, range=13.2-79.8 %) reported by Weatherburn and Lind
(1997). A t-test revealed that the purity of the heroin analysed for this report was
significantly higher (at sample level) than the purity of the heroin analysed by
Weatherburn and Lind (66.1 vs. 58.7%; t408=-3.9, p<0.001). While nearly 80 % of
samples in their study had a purity of at least 50 % heroin, 85 % of exhibits (or 84.1 % of
samples) in this report had an average purity of at least 50 % heroin. 15

Table 2 indicates the ranges of purity among the exhibits and samples. One significant
observation was that 15 % of exhibits and samples were of very high purity (91-100 %),
while none were less than 20 % pure. This table illustrates the intra-sample variability in
purity – while an exhibit may have had a mean purity within one range (e.g., 51-60 %) its
constituent samples may have had purities spanning two ranges (51-70 %) (see
Appendices 2 and 3). For example, exhibit 29 contained 5 balloons and 5 foils. While
the average purity of this exhibit was 57 %, the purity of its constituents ranged from 51-
72 %.
Table 2: Summary of purity data, by exhibit (n=33) and sample (n=88).
Range of purity (%) Exhibits (%) Samples (%) 0-10 11-20 21-30 31-40 41-50 51-60 61-70 71-80 81-90 91-100
0 0 3.0 6.1 9.1 9.1 27.3 24.2 6.1 15.1
0 0
5.7 5.7 5.6 23.9 15.9 15.9 12.5 14.8
Figure 3 indicates that there was no apparent linear trend in purity over the study period.
The lack of a complete time series for these data precludes firm conclusions being drawn
about purity data for all logged seizures. However, these data do not provide any
suggestion of a sustained increase or decrease in purity over the six months examined.
3.2 Adulterants/Diluents The proportion of samples and exhibits containing adulterants is displayed in Figure 4
(details for individual samples are presented in Appendix 2). Gas chromatography/mass
spectrometry analysis showed the presence of caffeine and a number of minor
constituents in approximately one third (36.4%) of samples, or 27.3 % of all exhibits.
Additionally, 40.9 % of samples (or 36.4 % of exhibits) showed the presence of
paracetamol and related compounds. Caffeine and paracetamol (and related compounds)
were present in one in five (21.6 %) samples, or 12.1 % of exhibits. In the majority of
exhibits containing multiple samples (e.g., several balloons or foils), these substances
16

Figure 3: Average purity (%) (including linear trend line) of 33 heroin exhibits
covering the period October 1, 1996-March 31, 1997.
0102030405060708090
100
1 3 5 7 9 11 13 15 17 19 21 23 25 27 29 31 33Exhibit
Perc
ent (
%)
were present in all items comprising the exhibit. As noted previously, caffeine has been
found to aid volatilisation of heroin, and hence increase recovery rates of smoked heroin
HCl, while it is possible that paracetamol decreases recovery rates.
Sugars, largely used to add bulk, were present in approximately two thirds of samples
(57/88: that is, 64.7 %) and exhibits (22/33: that is, 66.7 %), predominantly in the form
of sucrose. All exhibits containing sugars contained sucrose, although in one exhibit (no.
29) it was detected only in trace amounts (<5 %). The assay method used was unable to
distinguish between glucose, sorbitol or mannitol; sugars in the form of glucose, sorbitol
or mannitol were detected in only 7 samples (8 %), or 3 exhibits (9.1 %).
Only one in five samples (16/88: that is, 18.1%), or one in ten exhibits (3/33: that is,
9.1%) contained all three diluents - caffeine, paracetamol and sugars.
A number of samples contained trace amounts of noscapine. No samples contained
scopolamine or other tropane alkaloids, procaine or methaqualone.
17
These analyses indicate that street-level heroin in Cabramatta is relatively free of harmful
adulterants. Those detected are pharmacologically inactive diluents largely used to add
bulk (sugars), or pharmacologically active adulterants used to improve the bioavailability
of heroin HCL when smoked (caffeine). The extremely low levels of the opiate alkaloids
noscapine and papaverine are consistent with the heroin being of south-east Asian origin.
The reasons for the addition of paracetamol require clarification.
Figure 4: Proportion of samples (n=88) and exhibits (n=33) containing caffeine,
paracetamol and sugars.
0
20
40
60
80
Samples Exhibits
Perc
ent (
%)
CaffeineParacetamolSugars
18
4 DISCUSSION
All of the samples analysed for this study contained heroin as the hydrochloride salt.
Previous Australian research has documented the existence of the first of Griffiths and
colleagues' (Griffiths et al, 1994) pre-requisites for the development of a heroin smoking
culture - pre-existing patterns of drug taking which favour heroin smoking over injecting
(e.g., Maher et al 1998, 1999; McKetin et al, 1999; Swift et al 1999). However, the
current study did not find evidence to support the second pre-requisite - the availability
of heroin in a form that could be easily and efficiently smoked. No heroin free base was
encountered.
The adulterants and diluents present in these samples were similar to those commonly
found in the UK and Europe, and to a lesser extent, the US. Approximately one third
(36%) of the samples contained caffeine, 41% contained paracetamol and related
compounds, and two thirds (65%) contained sugars. Only one in five of the 88 samples
contained all three diluents. The absence of dangerous contaminants is consistent with
previous research based on interviews with drug dealers in the UK which suggests that,
contrary to common perception, dangerous adulteration is largely mythical and that very
little "cutting" actually takes place (Coomber, 1997).
Given the ability of caffeine to increase the recovery rate of smoked heroin
hydrochloride, its addition in one third of these samples may be an attempt to increase its
volatility and hence facilitate heroin smoking. The reason for the addition of
paracetamol requires clarification, as its impact on volatility is uncertain. Anecdotal
reports from local dealers gathered by the second author (LM), suggest it may be a
marketing tool, added to make the heroin “burn yellow” when it is smoked. Further
research on the effects of paracetamol on the volatility of heroin should be conducted to
provide a possible explanation for its presence in illicit heroin samples and help resolve
conflicting reports on this issue.
The extent to which street-level adulteration of heroin occurs in Australia is unknown.
Coomber’s work (1997, 1999a, 1999b) implies that most cutting occurs at a relatively
high level of the distribution network. However, given the source of European heroin is
typically south-west Asia, this does not necessarily apply to the marketing and
distribution of the south-east Asian heroin available in Sydney. 19

The street-level samples analysed for this study had an average purity of 66%, with 85%
having an average purity of at least 50% heroin hydrochloride salts. This is in the range
reported for small NSW seizures (<2g) by the Australian Federal Police in 1997-1998
(64% to 71%) (McKetin et al, 1999). The average purity of samples in the present study
represented a small but significant increase from that reported in Cabramatta by
Weatherburn and Lind between 1993 and 1995 (66.2% vs. 58.7%). However, the lack of
a complete time series for this study, and differences in the methodology between
studies, should be considered when interpreting these findings. There was no evidence
of any change in purity over the six months of this study, with the trend line completely
flat (Figure 3).
These findings have several implications for the risk of fatal overdose. Firstly, the
presence of heroin in salt rather than base form encourages intravenous administration.
This route is associated with a greater risk of overdose (and the transmission of blood-
borne viruses). These data also lend support to recent Australian findings (Darke et al,
1999a) that purity may be only one of many factors implicated in the occurrence of
overdose fatalities. While fatal overdoses are increasing (Hall et al, 1999), there were no
indications of large increases in street-level heroin purity across the study period. There
was also only a modest increase in the purity of street-level seizures examined between
this and the Weatherburn and Lind study that was not commensurate with the large
increase in the number of overdose fatalities. Recent (1999) data from NSW heroin
seizures made by the Australian Federal Police also indicate little change in average purity
since the period of this study (1999 average purity=67%) (McKetin, 1999). Further, the
majority of overdose deaths are occurring among older, more experienced users, who
have presumably developed tolerance to the effects of heroin (Darke et al, 1999b; Hall et
al, 1999). Finally, the lack of toxic contaminants in these samples supports the findings
of previous research that they play little role in overdose deaths (see Darke and Zador,
1996).
These results also need to be placed in the context of recent Australian research which
has sought to document patterns and contexts of heroin smoking (e.g., Maher et al, 1998,
1999; Maher and Swift, 1997; Swift et al, 1999). While "reverse" transitions appear to be
relatively rare in Australia, a recent study of young Indo-Chinese IDU found that just
over a quarter (27%) reported ever having stopped injecting a drug and returning to
20

smoking, snorting or swallowing that drug. Poor health (10%) was the main reason cited
for reverse transitions. Four people cited fear of HIV/Hepatitis C, a further four cited
family problems and three people cited vascular problems as the main reason they had
made a transition to non-injecting (Maher et al, 1999). These results suggest that there
may be a demand for harm-reduction interventions designed to facilitate transitions from
injecting to smoking among this population.
However, the availability of heroin in salt, rather than base, form in Sydney would appear
to mitigate against the success of such interventions. Nevertheless, a small proportion of
local users do manage to maintain smoking behaviour (e.g., Maher et al, 1998; Swift et al,
1999). A better understanding of the factors influencing route of administration and
potential ways to surpass the pharmacological barriers to smoking are crucial steps in
attempting to minimise the harms associated with injecting. For example, in the absence
of heroin base in the local market, the addition of caffeine to heroin hydrochloride may
provide a means to increase the smoking efficiency of street-level heroin. Users could
also be taught more efficient ways of smoking that maximise the bioavailability of heroin
administered by this route.
Finally, this study has established a system that could be used to perform ongoing
analytical studies that would require only minimal financial assistance. This system could
be readily incorporated, for example, into the NSW Illicit Drug Reporting System (e.g.,
McKetin et al, 1999), to include the annual collection and analysis of street-level heroin
samples. Because the present sampling frame was constructed retrospectively, we
encountered problems with the removal and destruction of exhibits. Our experience
suggests that systematic data collection will necessitate the development of criteria and
mechanisms (in consultation with the NSW Police Service) to allow for prospective
sampling.
21

5 REFERENCES
Atillasoy, A., Neagius, A., Andrade, X., Friedman, S.R., Ildefonso, G. & Des Jarlais, D.C.
(1996). Why self-identified non-injecting users of heroin do and do not inject drugs. Paper presented
at the American Public Health Association 124th Annual Meeting, New York, November
18.
Australian Bureau of Criminal Intelligence (1999). Australian Illicit Drug Report 1997-98.
Canberra: Australian Bureau of Criminal Intelligence.
Cooke, C.E. (1991). Pyrolytic characteristics, pharmacokinetics and bioavailability of
smoked heroin, cocaine, phencyclidine and methamphetamine. In: M. Miller & N. Kozel
(Eds.), Methamphetamine abuse: epidemiologic issues and implications (NIDA Research
Monograph No. 115) (pp. 6-23). Rockville, MD: National Institute on Drug Abuse.
Coomber, R. (1997). How often does the adulteration/dilution of heroin actually occur?
An analysis of 228 ‘street’ heroin samples across the UK (1995-96) and discussion of
monitoring policy. The International Journal of Drug Policy, 8, 178-186.
Coomber, R. (1999a). Cutting the crap: the reality of drug adulteration. Druglink,
July/August, 19-21.
Coomber, R. (1999b). The cutting of heroin in the United States in the 1990s. Journal of
Drug Issues, 29, 17-36.
Darke, S., Hall, W., Weatherburn, D. & Lind, B. (1999a). Fluctuations in heroin purity
and the incidence of fatal heroin overdose. Drug and Alcohol Dependence, 54, 155-161.
Darke, S., Ross, J., Zador, D. & Sunjic, S. (1999b). Heroin-related deaths in New South Wales,
1992-1996 (Technical Report No. 68). Sydney: National Drug and Alcohol Research
Centre.
Darke, S. & Ross, J. (in press). Fatal heroin overdoses resulting from non-injecting routes
of administration, NSW, Australia, 1992-1996. Addiction.
22

Darke, S. & Zador, D. (1996). Fatal heroin overdose: a review. Addiction, 91, 1765-1772.
De la Fuente, L., Saavedra, P., Barrio, G., Royuela, L., Vicente, J., and Spanish Group for
the Study of the Purity of Seized Drugs (1996). Temporal and geographic variations in
the characteristics of heroin seized in Spain and their relation with the route of
administration. Drug and Alcohol Dependence, 40, 185-194.
Des Jarlais, D.C., Courtwright, D.T & Joseph, H. (1992). The transition from opium
smoking to heroin injection in the United States. AIDS and Public Policy Journal, 6, 88-90.
Eskes, D. & Brown, J.K. (1975). Heroin-caffeine-strychnine mixtures – where and why?
Bulletin on Narcotics, 27, 67-69.
Gossop, M. (1995). Chasing the dragon: Research into heroin smoking in Britain.
European Addiction Research, 1, 42-49.
Griffiths, P., Gossop, M. & Strang, J. (1994). Chasing the dragon: the development of
heroin smoking in the United Kingdom. In J.Strang & M. Gossop (Eds.), Heroin addiction
and drug policy: The British system. Oxford: Oxford University Press.
Gruhzit, C.C. (1958). Pharmacological investigation and evaluation of the effects of
combined barbiturate and heroin inhalation by addicts. Bulletin on Narcotics, 10, 8-11.
Grund, J.C. & Blanken, P. (1993). From chasing the dragon to chinezen: the diffusion of heroin
smoking in the Netherlands. Rotterdam: Instituut voor Verslavingsonderzoek.
Hall, W.D., Degenhardt, L.J. & Lynskey, M.T. (1999). Opioid overdose mortality in
Australia, 1964-1997: birth-cohort trends. Medical Journal of Australia, 171, 34-37.
Hando, J., Darke, S., O’Brien, S., Maher, L. & Hall, W. (1998). The development of an
early warning system to detect trends in illicit drug use in Australia: The Illicit Drug
Reporting System. Addiction Research, 6, 97-113.
23
Huizer, H. (1987). Analytical studies on illicit heroin. V. Efficacy of volatilisation during
heroin smoking. Pharmaceutisc Weekblad (Scientific Edition), 9, 203-211.
Huizer, H. (1988). Analytical studies on illicit heroin. Doctoral thesis. Leiden, Netherlands:
Leiden University.
Huizer, H., Logtenberg, H. & Steenstra, A.J. (1977). Heroin in the Netherlands. Bulletin
on Narcotics, 29, 65-74.
Hunt, N., Stillwell, G., Taylor, C. & Griffiths, P. (1998). Evaluation of a brief
intervention to prevent initiation into injecting. Drugs: education, prevention and policy, 5, 185-
194.
Jenkins, A.J., Keenan, R.M., Henningfield, J.E. & Cone, E.J. (1994). Pharmacokinetics
and pharmacodynamics of smoked heroin. Journal of Analytical Toxicology, 18, 317-330.
Kalant, H. (1997). Opium revisited: a brief review of its nature, composition, non-
medical use and relative risks. Addiction, 92, 267-277.
Maher, L., Dixon, D., Lynskey, M. & Hall, W. (1998). Running the risks: Heroin, health and
harm in south west Sydney (Monograph No. 38). Sydney: National Drug and Alcohol
Research Centre.
Maher, L., Higgs, P., Sargent, P., Le, T. & Crofts, N. (1999). Sharing knowledge to protect our
community: The Indo-Chinese initiates project. Paper presented at 31st Annual Public Health
Association Conference, Darwin, September 1999.
Maher, L. & Swift, W. (1997). Heroin use in Sydney's Indo-chinese communities: A review of
National Drug and Alcohol Research Centre research (Monograph No. 33). Sydney: National
Drug and Alcohol Research Centre.
McKetin, R. (1999). Drug trends bulletin, December 1999. Sydney: Illicit Drug Reporting
System, National Drug and Alcohol Research Centre.
24

McKetin, R., Darke, S., Hayes, A. & Rumbold, G. (1999). Drug trends 1998. A comparison of
drug use and trends in three Australian states: Findings from the Illicit Drug Reporting System (IDRS)
(Monograph No. 41). Sydney: National Drug and Alcohol Research Centre.
Mo, B.P. & Way, E.L. (1966). An assessment of inhalation as a mode of administration
of heroin by addicts. Journal of Pharmacology and Experimental Therapeutics, 154, 142-151.
Perez-Jiminez, J.-P. & Robert, M.S. (1997). Transitions in the route of use: A Spanish
sample. European Addiction Research, 3, 93-98.
Strang, J., Griffiths, P. & Gossop, M. (1997a). Heroin smoking by ‘chasing the dragon’:
origins and history. Addiction, 92, 673-683.
Strang, J., Griffiths, P. & Gossop, M. (1997b). Heroin in the United Kingdom: different
forms, different origins, and the relationship to different routes of administration. Drug
and Alcohol Review, 16, 329-337.
Swift, W., Maher, L., Sunjic, S. & Doan, V. (1997). Transitions between routes of
administration among Caucasian and Indochinese heroin users in south-west Sydney
(Technical Report No. 42). Sydney: National Drug and Alcohol Research Centre.
Swift, W., Maher, L. and Sunjic, S. (1999). Transitions between routes of administration
among Caucasian and Indochinese heroin users in south-west Sydney. Addiction, 94, 71-
82.
Tan, T.P., Algra, P.R., Valk, J. & Wolters, E.C. (1994). Toxic leukoencephalopathy after
inhalation of poisoned heroin: MR findings. AJNR: American Journal of Neuroradiology, 15,
175-178.
Trimbos Institute (1998). National report 1997: The Netherlands. Epidemiological situation.
Utrecht: Trimbos Institute.
25

26
United Nations International Drug Control Programme (1998). Recommended methods for
testing opium, morphine and heroin: Manual for use by national drug testing laboratories. New York:
United Nations, Laboratory Section.
Weatherburn, D. & Lind, B. (1997). The impact of law enforcement activity on a heroin
market. Addiction, 92, 557-569.
Wood, C. (1996). Demonising the needle: The NIROA debate. Connexions,
August/September, 4-7.
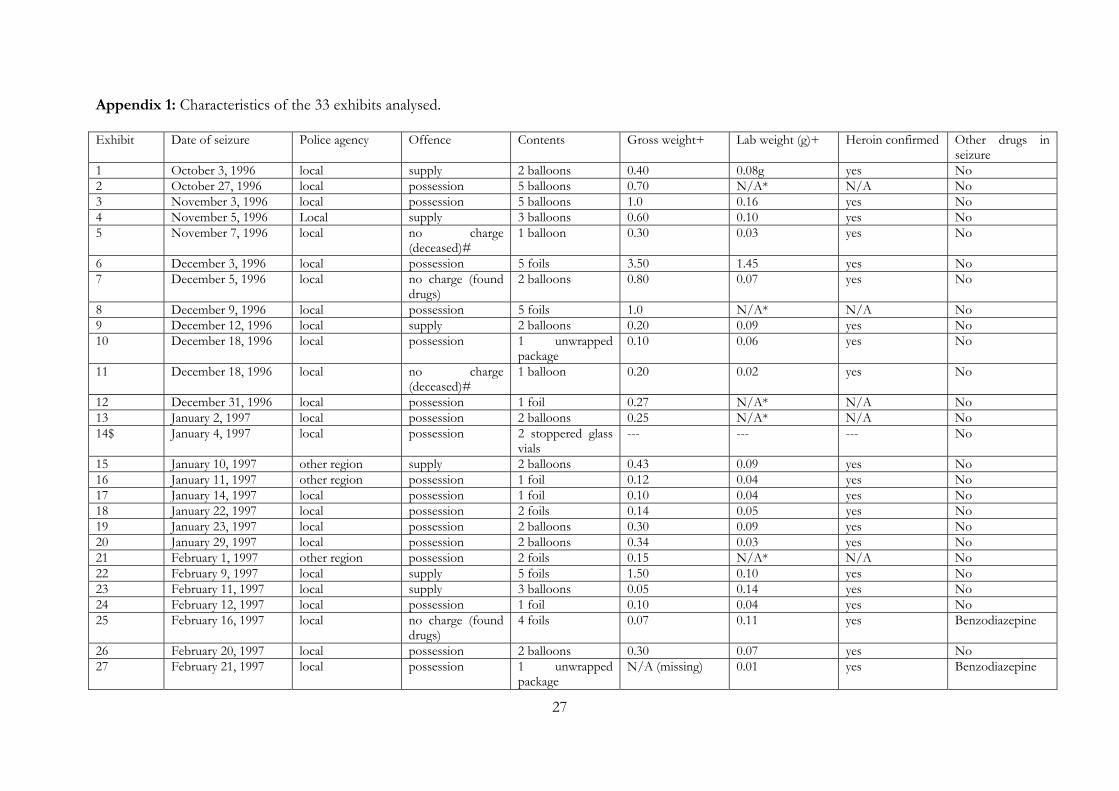
Appendix 1: Characteristics of the 33 exhibits analysed. Exhibit Date of seizure Police agency Offence Contents Gross weight+ Lab weight (g)+ Heroin confirmed Other drugs in
seizure 1 October 3, 1996 local supply 2 balloons 0.40 0.08g yes No2 October 27, 1996 local possession 5 balloons 0.70 N/A* N/A No3 November 3, 1996 local possession 5 balloons 1.0 0.16 yes No4 November 5, 1996 Local supply 3 balloons 0.60 0.10 yes No5 November 7, 1996 local no charge
(deceased)# 1 balloon 0.30 0.03 yes No
6 December 3, 1996 local possession 5 foils 3.50 1.45 yes No7 December 5, 1996 local no charge (found
drugs) 2 balloons 0.80 0.07 yes No
8 December 9, 1996 local possession 5 foils 1.0 N/A* N/A No9 December 12, 1996 local supply 2 balloons 0.20 0.09 yes No10 December 18, 1996 local possession 1 unwrapped
package 0.10 0.06 yes No
11 December 18, 1996 local no charge (deceased)#
1 balloon 0.20 0.02 yes No
12 December 31, 1996 local possession 1 foil 0.27 N/A* N/A No13 January 2, 1997 local possession 2 balloons 0.25 N/A* N/A No14$ January 4, 1997 local possession 2 stoppered glass
vials --- --- --- No
15 January 10, 1997 other region supply 2 balloons 0.43 0.09 yes No16 January 11, 1997 other region possession 1 foil 0.12 0.04 yes No17 January 14, 1997 local possession 1 foil 0.10 0.04 yes No18 January 22, 1997 local possession 2 foils 0.14 0.05 yes No19 January 23, 1997 local possession 2 balloons 0.30 0.09 yes No20 January 29, 1997 local possession 2 balloons 0.34 0.03 yes No21 February 1, 1997 other region possession 2 foils 0.15 N/A* N/A No22 February 9, 1997 local supply 5 foils 1.50 0.10 yes No23 February 11, 1997 local supply 3 balloons 0.05 0.14 yes No24 February 12, 1997 local possession 1 foil 0.10 0.04 yes No25 February 16, 1997 local no charge (found
drugs) 4 foils 0.07 0.11 yes Benzodiazepine
26 February 20, 1997 local possession 2 balloons 0.30 0.07 yes No27 February 21, 1997 local possession 1 unwrapped
package N/A (missing) 0.01 yes Benzodiazepine
27

28
28 February 22, 1997 local supply 2 balloons 0.38 0.06 yes No29 March 15, 1997 local possession 5 balloons and 5
foils 1.50 N/A* N/A No
30 March 19, 1997 local possession 2 foils 0.42 0.05 yes No31 March 19, 1997 local possession 5 balloons 0.62 N/A* N/A No32 March 20, 1997 local possession 1 balloon and 1
foil 0.16 N/A* N/A No
33 March 26, 1997 local possession 2 balloons 0.21 0.06 yes No$ The contents of this exhibit did not match the entry described in the log book. The entry above describes the contents of the exhibit we received. Subsequently, no data are presented for exhibit weight or presence of heroin. * No laboratory report attached # Suspected overdose + The discrepancy between the gross weight and the laboratory weight on the forensic report may largely be accounted for by the fact that the gross weight included packaging.
Appendix 2: Percentage purity data for each of the samples analysed expressed as % major opiates, and presence of adulterants Exhibit* Exhibit wt
(mg) Paracetamol Caffeine Sucrose Glucose,
sorbitol or mannitol
% Diamorphine HCl
% O-6-Mono acetylmorphine HCl
% Acetyl codeine HCl
% Major opiates as hydrochloride salts
1a 42 Yes Yes 58 2 7 67
1b 32 Yes Yes 55 1 6 62
2a 23 Yes Yes Yes 20 5 4 29
2b 16 Yes Yes Yes 24 6 4 34
2c 18 Yes Yes Yes 19 5 3 27
2d 8 Yes Yes Yes 19 5 3 27
2e 14 Yes Yes Yes 19 5 3 27
3a 27 Yes 80 1 7 88
3b 29 Yes 71 1 6 78
3c 8 Yes 49 2 8 59
3d 17 Yes 44 1 7 52
3e 35 Yes 85 1 7 93
4a 26 Yes Yes Yes 37 1 38
4b 26 Yes Yes Yes 27 27
4c 27 Yes Yes Yes 35 1 36
5 23 Yes Yes 40 2 42
6a 165 Yes 61 61 6b 231 Yes 64 64 6c 334 Yes 74 74 6d 186 Yes 79 79 6e 317 Yes 68 68 7a 29 Yes 64 2 1 67
7b 9 Yes 77 2 1 80
8a 93 92 4 96
8b 10 85 2 87
8c 16 92 2 94 8d 14 81 2 83 8e 15 81 2 83 9a 9 Yes 78 1 81
9b 23 Yes 70 2 5 77
10 53 Yes 74 74
11 15 Yes 74 74
12 95 Yes 79 79 13a 36 Yes 92 1 93 13b 21 Yes 89 1 90
14a 22 Yes Yes 46 6 13 65
14b 54 Yes Yes 47 6 13 66
15a 27 87 2 9 98
15b 31 76 1 9 86
16 35 Yes 59 5 64 17 19 Yes 79 3 9 91
18a 17 Yes 72 3 7 82
18b 21 Yes 76 2 8 86
19a 26 Yes Yes 47 3 6 56
19b 27 Yes Yes 64 4 7 75
20a 8 Yes Yes 71 6 8 85
20b 6 Yes Yes 44 6 5 55
29
21a 42 Yes 50 8 58
21b 26 Yes 68 4 72
22a 16 86 10 96
22b 17 83 8 91 22c 17 85 8 93 22d 18 88 8 96 22e 18 86 8 94 23a 10 Yes Yes 71 2 4 77
23b 17 Yes Yes 73 1 74
23c 20 Yes Yes 78 2 5 85
24 18 Yes 54 5 59
25a 16 Yes 52 2 4 58
25b 23 Yes 45 1 10 56
25c 32 Yes 55 1 5 61
25d 33 Yes 45 1 9 55
26a 26 Yes 32 7 39
26b 36 Yes 32 6 38
27 11 62 1 3 66
28a 24 Yes 50 10 60
28b 23 Yes 55 11 66
29a 41 Yes Yes Trace only+ 57 57
29b 54 Yes Yes Trace only 54 54
29c 16 Yes Yes 60 60
29d 25 Yes Yes Trace only 55 55
29e 13 Yes Yes Trace only 72 72
29f 26 Yes Yes Trace only 54 54
29g 30 Yes Yes Trace only 52 52
29h 35 Yes Yes Trace only 53 53
29i 29 Yes Yes Trace only 51 51
29j 17 Yes Yes Trace only 63 63
30a 14 Yes Yes 38 5 4 47
30b 13 Yes Yes 39 5 4 48
31a 10 Yes Yes 38 3 5 46
31b 10 Yes Yes 41 4 5 50
31c 17 Yes Yes 40 5 6 51
31d 24 Yes Yes 42 5 4 51
31e 17 Yes Yes 44 1 6 51
32a 30 Yes Yes Yes 67 4 71
32b 32 Yes Yes Yes 70 3 73
33a 15 Yes 90 2 92
33b 13 89 2 91
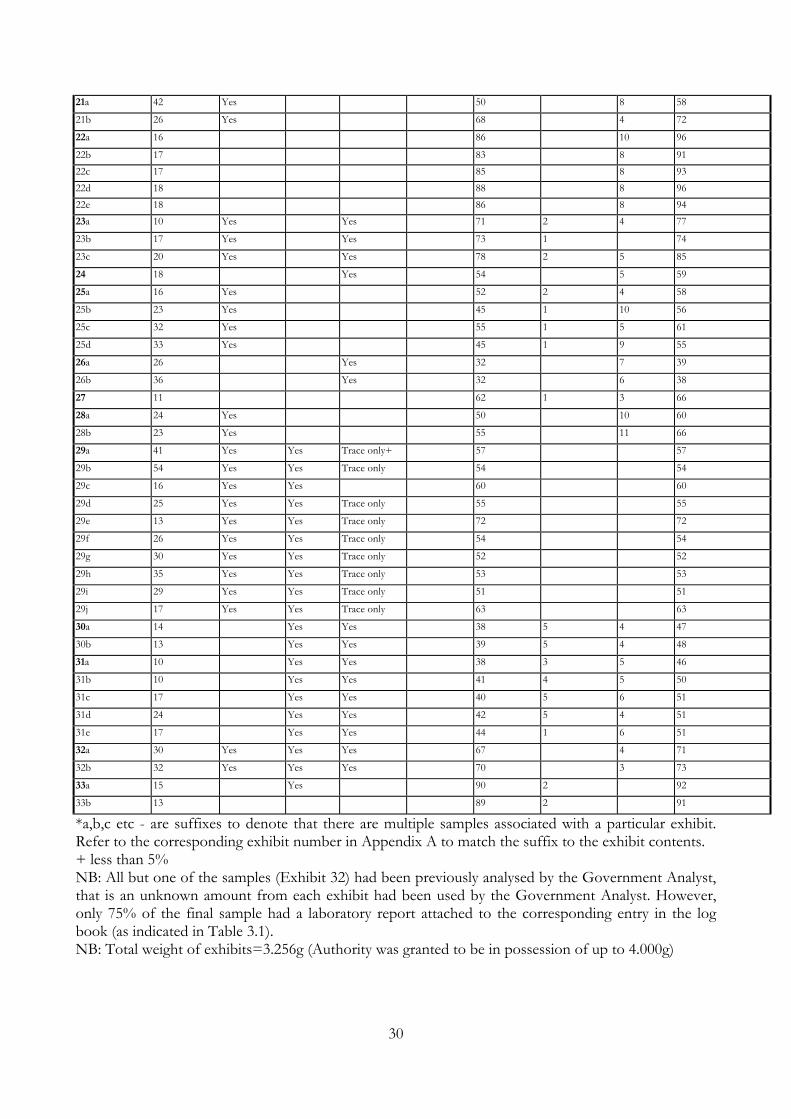
*a,b,c etc - are suffixes to denote that there are multiple samples associated with a particular exhibit. Refer to the corresponding exhibit number in Appendix A to match the suffix to the exhibit contents. + less than 5% NB: All but one of the samples (Exhibit 32) had been previously analysed by the Government Analyst, that is an unknown amount from each exhibit had been used by the Government Analyst. However, only 75% of the final sample had a laboratory report attached to the corresponding entry in the log book (as indicated in Table 3.1). NB: Total weight of exhibits=3.256g (Authority was granted to be in possession of up to 4.000g)
30

Appendix 3: The average percentage purity data for each exhibit Exhibit* Exhibit wt
(mg) % Major opiates as hydrochloride salts Average % purity per exhibit
1a 42 67 1b 32 62 65 2a 23 29 2b 16 34 2c 18 27 2d 8 27 2e 14 27 29 3a 27 88 3b 29 78 3c 8 59 3d 17 52 3e 35 93 74 4a 26 38 4b 26 27 4c 27 36 34 5 23 42 42 6a 165 61 6b 231 64 6c 334 74 6d 186 79 6e 317 68 69 7a 29 67 7b 9 80 73 8a 93 96 8b 10 87 8c 16 94 8d 14 83 8e 15 83 89 9a 9 81 9b 23 77 79 10 53 74 74 11 15 74 74 12 95 79 79 13a 36 93 13b 21 90 92 14a 22 65 14b 54 66 66 15a 27 98 15b 31 86 92 16 35 64 64 17 19 91 91 18a 17 82 18b 21 86 84 19a 26 56 19b 27 75 66 20a 8 85 20b 6 55 70 21a 42 58 21b 26 72 65 22a 16 96 22b 17 91
31

32
22c 17 93 22d 18 96 22e 18 94 94 23a 10 77 23b 17 74 23c 20 85 79 24 18 59 59 25a 16 58 25b 23 56 25c 32 61 25d 33 55 58 26a 26 39 26b 36 38 39 27 11 66 66 28a 24 60 28b 23 66 63 29a 41 57 29b 54 54 29c 16 60 29d 25 55 29e 13 72 29f 26 54 29g 30 52 29h 35 53 29i 29 51 29j 17 63 57 30a 14 47 30b 13 48 48 31a 10 46 31b 10 50 31c 17 51 31d 24 51 31e 17 51 50 32a 30 71 32b 32 73 72 33a 15 92 33b 13 91 92 *a,b,c etc - are suffixes to denote that there are multiple samples associated with a particular exhibit. Refer to the corresponding exhibit number in Appendix 1 to match the suffix to the exhibit contents.


![Heroin maintenance for chronic heroin-dependent individualsharmreductionactioncenter.org/HRAC_DOCUMENTS/ADDICTION AND... · [Intervention Review] Heroin maintenance for chronic heroin-dependent](https://static.fdocuments.in/doc/165x107/5b87383e7f8b9a1a248c3f66/heroin-maintenance-for-chronic-heroin-dependent-individualsharmr-and-intervention.jpg)