Heritage and the Economy 2019 | Historic England
60
HERITAGE COUNTS HERITAGE AND THE ECONOMY 2019
Transcript of Heritage and the Economy 2019 | Historic England

H E R I T A G E C O U N T S
HERITAGEAND THEECONOMY2019

HERITAGE AND THE ECONOMY 2019England
HERITAGE AND THE ECONOMY 20192
VALUE (GVA)
The heritage sector is an important source of economic prosperity and growth
total GVA of
£31.0bn(equivalent to 1.9% of national GVA)
For every £1 of GVA directly generated, an additional £1.21 of GVA is supported in the wider economy
Direct
£1 4.0 b n£7.3b n£9.6b n
+£1 53p+68p
Indirect Induced
EMPLOYMENT
Heritage is an important employer in England
jobs total over
464,000
1 98,0001 11,000
For every direct job created, an additional 1.34 jobs are supported in the wider economy
Direct
1 +1 55,000
Indirect
0.78 +
Induced
0.56
Heritage attracts millions of domestic and international tourists each year
TOURISM
n International trip n Domestic day visit n Domestic overnight trip
no. of visits
218.4mVisits (m)
17.5 14.9
186
tourist spend
£17.0bn
Spend (£bn)
4.3
3.4
9.3
Source: (Cebr, 2019)

HERITAGE AND THE ECONOMY 2019 3
HERITAGE AND THE ECONOMY
The historic environment is intrinsically linked to economic activity, with a large number of economic activities occurring within it, dependent on it or attracted to it.
Heritage and the Economy examines the economic aspects of heritage conservation and presents evidence on the numerous ways that the historic environment contributes to the national economy and to local economies.
I. Heritage and the economics of uniqueness (p.4)
1. Investing in heritage creates places for businesses to grow and prosper (p.6)
2. Heritage and the creative economy (p.12)
3. Heritage shapes people’s perceptions and authentic experiences of places (p.16)
4. Heritage generates demand and a property price premium (p.20)
5. Heritage still has a great untapped potential (p.22)
II. Heritage and the economy: The sum of many parts (p.28)
1. Heritage construction and development (p.32)
2. Heritage tourism (p.36)
3. Heritage volunteering (p.40)
III. Heritage and the economy: A focus on skills in the heritage sector (p.44)
IV. The ‘Total Economic Value’ of heritage is greater than the sum of all its parts (p.50)
The evidence presented here includes recent research findings as well as past seminal pieces, forming part of the heritage sector’s rich, multi-dimensional knowledge base. The evidence is presented as brief bite-sized facts with links to the detailed evidence sources for more technical readers, or those with more specific evidence needs.
Together with Heritage and Society, Heritage and the Economy can be used by anyone to make the case for heritage.

HERITAGE AND THE ECONOMY 20194
I. Heritage and the economics of uniqueness
“In my generation as retailers, we successfully cloned every town in Britain so they all looked the same, but clearly that doesn’t work. All towns have a heritage and history and their reason for uniqueness needs to be brought to the fore”. (Bill Grimsey, former head of Wickes, Iceland and Focus DIY (BBC, 2018).
n Historic buildings, monuments and spaces shape how our towns, cities and rural areas look and feel. They form a vital part of our nation’s infrastructure providing homes, amenities, utilities and premises for businesses. They add to the unique character of places, signifying the culture of places and playing an important part in shaping peoples’ perceptions and authentic experiences of a place.
n The Nobel Prize winning economist, Robert Merton Solow stated that “over the long term, places with strong, distinctive identities are more likely to prosper than places without them.
Every place must identify its strongest, most distinctive features and develop them or run the risk of being all things to all persons and nothing special to any” (in Licciardi et al. 2012). The historic environment provides a sense of authenticity, beauty and distinctiveness. This attracts people, businesses and investment, and can provide places with their competitive advantage. “Using the historic environment as an asset, and giving it new life, has also been one of the cornerstones of the economic and social revival of our towns and cities” (Deloitte, 2017).
Rievaulx Abbey, North Yorkshire.

5HERITAGE AND THE ECONOMY 2019
Battle Abbey, East Sussex.

HERITAGE AND THE ECONOMY 20196
1. Investing in heritage creates places for businesses to grow and prosper
Many of our local shops, hotels, offices, warehouses and industrial units are located within historic buildings. Distinctive and characterful place and working spaces attract businesses and customers contributing to the competitiveness of businesses and places.
Businesses in Listed buildings
142,000 +18%
Businesses operating in Listed buildings across England 2012-2018
Occupiers of Listed buildings – change 2012-2018
Retail brands
+154%
+173%
Eating and drinking brands
-18%
Independent retail
-3%
Independent eating and drinking
Occupiers of Listed buildings – top 10 most prevalent
eating & drinking
eating & drinking
retail services
eating & drinking
retail services
eating & drinking
eating & drinking
eating & drinking
retail services
professional services
Source: Heritage Counts (2018)

HERITAGE AND THE ECONOMY 2019 7
Abbey Road Studios, St John’s Wood, Greater London.

HERITAGE AND THE ECONOMY 20198
HERITAGE IN COMMERCIAL USE: DRIVING THE REVITALISATION OF OUR TOWNS AND CITIES
Heritage assets in commercial use play a vital role in the prosperity of local economies. In the retail sector, experts refer to the growing importance of
“experiential retail” where consumers increasingly demand immersive and unique experiences instead of routine shopping. Places must now also provide emotional and human connections to attract consumers. Heritage assets play an increasingly important role in helping places differentiate themselves from others thus contributing to the competitive advantage of places (Moore, 2018).
Research for Heritage Counts, 2018 examined the commercial use of heritage in towns and city centres locations.
The research shows that there are approximately 142,000 retail, hospitality and commercial operations in listed buildings. Independent retail and hospitality sectors are the largest and most likely occupiers of listed buildings. However, over the past 6 years the number of independent businesses occupying listed buildings has declined, while the number of branded retailers and branded food and drink establishments located in listed buildings has grown by 173%. Today, branded pubs are the largest single type occupiers of listed buildings, followed closely by large coffee chains
Evidence from a survey of 509 commercial businesses occupying listed buildings also shows that the main advantage of occupying a listed building is that it “contributes to the positive atmosphere of the surrounding area” and it “provides a positive exterior appearance”. Amongst surveyed businesses, “ambience” and
“attractiveness” are highly competitive features of the built environment. Heritage brings authenticity and a sense of uniqueness to places (Heritage Counts, 2018).
The research concluded that towns and cities must protect their historic environment as a key resource for emerging and existing economic activities. Heritage assets in commercial use are vital contributors to economic growth in local economies to day and in the future.
Madison Square, Liverpool, Merseyside.

HERITAGE AND THE ECONOMY 2019 9
n Heritage density is positively and strongly related to the overall movement of businesses into an area. Using cross-sectional and longitudinal local authority data, researchers conclude that heritage assets are important ‘pull’ factors influencing business location decisions (TBR, 2016).
n The density of heritage assets is highly and positively related to the concentration of firms in a local economy. An econometric analysis using local authority cross-sectional data for the year 2013 and using a fixed effect model for the period 2003-2013 found a correlation between heritage and firms (TBR, 2016).
n Historic places are increasingly attractive to businesses. Since 2012 the number of listed buildings occupied by a brand has increased by 154%. This is based on a research carried out in in 55 cities and town centres (Heritage Counts, 2018).
n Heritage influences the location choices of businesses. One in four businesses in a survey of 122 businesses that had received investment in the historic environment agreed that the historic environment is an important factor in deciding where to locate (AMION and Locum Consulting, 2010).
n A survey of 1,345 listed building residential owners found that a fifth of respondents (21%) undertake some sort of commercial activity within their properties:
– 12% of respondents indicated that they had office space at their property.
– 9% indicated that they provided accommodation such as bed and breakfast of cottage rental, while 3% provided accommodation at their property through Airbnb/One Fine Stay or similar.
– Around 7% of respondents were self-employed or running a business from home.
– Over 2% were involved in farming or agriculture.
(Ecorys, 2017)
n Heritage enhances business opportunities. In a telephone survey of 509 businesses located in listed buildings, 62% of the respondents replied that the historic nature of their building improved their business (Historic England, 2018).
Corn Street, Bristol.

HERITAGE AND THE ECONOMY 201910
Eagle Works, Little Kelham, Sheffield, South Yorkshire. © Historic England Archive
CASE STUDY: AGILE WORKING IN HISTORIC BUILDINGS
Research by Ramidus Consulting in 2018, shows that the purpose of the workplace has changed in recent years and it is argued that this is likely to continue to change in the future. Modern workspaces encourage innovation by creating an environment that promotes trust and team-work. They connect people and promote social and professional networks. They achieve a vast array of
functions as the separation between work and life becomes increasingly blurred. In essence, modern workspaces are being transformed from being the place where works happens, to becoming a business driver.
Knowledge workers have more transferable skills, which makes them less dependent on a single employer and also places greater demands on employers. Evidence shows that workers increasingly demand quality and collaborative workplaces (Ramidus Consulting, 2018).

HERITAGE AND THE ECONOMY 2019 11
To attract and retained highly-skilled workers, workplaces increasingly need to provide an experience. This goes hand in hand with the spread of “agile working”, which involves working in a variety of settings and a in a more mobile and interactive atmosphere than in traditional working places.
In this sense, workspaces themselves have a role to play in recruitment and in retention, in improving productivity and well-being and in promoting collaboration and innovation. This means that office
buildings will become less generic and in the future they will need to offer
“experiential workplaces”. The uniqueness, character and flexibility of historic buildings, especially those formerly in industrial use such as warehouses and factories, have great potential to provide successful office space for the future (Ramidus Consulting, 2018). The historic environment not only provides competitive advantages to places but also to businesses.

HERITAGE AND THE ECONOMY 201912
2. Heritage and the creative economy
Over the past decade, creative industries have been among the fastest-growing sectors in the UK and globally. Many historic buildings offer flexible, distinctive and characterful working and studio spaces that are attractive to creative businesses.
n Creative industries are concentrated in areas with a high heritage density. A recent study into the role of culture and sport in place shaping found that the greater the density of cultural and heritage assets, the better the performance of the creative industries and the greater the level of specialisation towards the creative industries. This is based on longitudinal and cross-sectional econometric analysis for the period 2003 and 2013 (TBR, 2016).
n Creative and cultural industries are more likely to be found in a listed building than in a non-listed building in England – this difference is particularly pronounced in England’s core cities, where creative industries are more likely to be found in a listed building than a non-listed building (National Lottery Heritage Fund, 2013).
n A very high proportion of creative industries based in historic buildings are start-ups. A telephone survey of more than 200 businesses in listed buildings demonstrated that over 60% were established in the past 3 years (National Lottery Heritage Fund, 2013).
Engineering Building, Liverpool University, Liverpool, Merseyside.

THE IMPACT OF CULTURAL HERITAGE ON ECONOMIC DEVELOPMENT THROUGH CREATIVITY AND INNOVATION
Creativity, defined as new ideas based on different types of talents, may have an artistic, scientific or economic nature (Cerisola, 2019). The effect of cultural heritage on different kinds of creativity and, in turn, on economic development is analysed in the article A new perspective on the cultural-heritage development nexus: the role of creativity by Cerisola, (2019), published in the Journal of Cultural Economics. The study used a standard linear maximum likelihood structural equation model for two periods (2001-2004 and 2011-2014) for Italian
provinces (NUTS3 level) with a total of 206 observations (Cerisola, 2019).
The study finds that cultural heritage is a source of inspiration that fosters scientific and artistic creativity. The statistical analysis demonstrates that cultural heritage has a positive and significant effect on artistic creativity (0.183***), a lower but still positive impact on scientific creativity (0.115**) and no significant impact on economic creativity. The relationship between cultural heritage, creativity and economic development is presented in the diagram below.
Cultural heritage
Artistic creativity
Economic creativity
Scientific creativity
0.115**0.183***
0.132
-0.31
-0.017
0.09 0.031Economic development
HERITAGE AND THE ECONOMY 2019 13
Source: Cerisola, (2019)
Figure 1: The impact of cultural heritage and of scientific, artistic and economic creativity on development. All the results presented in the graphs are standardized coefficients with the following significance levels: *10%, **5%, ***1%.
The author argues that cultural heritage and each type of creativity (artistic, scientific or economic) do not lead to economic development individually as demonstrated by the statistical insignificance of the coefficients in Figure 2 (-0.017, 0.132, 0.09, 0.031 respectively). The author instead finds that it is the combination between the different types of creativity (artistic, economic and scientific) that drive economic development.
The research argues that it is in fact the interplay between artistic and scientific creativity; scientific and economic creativity; and artistic and economic creativity that have
a positive and significant effect on economic development.
The research concludes that cultural heritage contributes to local economic development indirectly by fostering scientific and artistic creativity (Cerisola, 2019). It is the complexity of this relationship in measurement terms that often leads to the exclusion of cultural heritage from this equation however in qualitative terms a vast body of heritage evidence confirms this relationship.
The study concludes that policies aimed at protecting and improving cultural heritage would at the same time be contributing to economic development.
Artistic and scientific creativity
0.324**
Artistic and economic creativity
0.277*
Scientific and economic creativity
0.269**
Economic development
Other variables(population density, accessibility, etc.)
HERITAGE AND THE ECONOMY 201914
Source: Based on Cerisola, (2019)
Figure 2: The interplay between different types of creativity leads to economic development. All the results presented in the graphs are standardized coefficients with the following significance levels: *10%, **5%, ***1%.

HERITAGE AND THE ECONOMY 2019 15
CASE STUDY: CREATIVE INDUSTRIES IN CONSERVATION AREAS
Creative industries are a crucial part of economic growth and prosperity. This sector has experienced fast-paced growth with GVA rising more than a third between 2010 and 2015, which was twice the rate of growth of the UK economy during that period (DCMS, 2016).
Research for Heritage Counts 2018 studied a sample of 35,000 creative businesses in conservation areas across England. The study found that 26% of all creative industries are located in conservation areas. The findings show that businesses are highly concentrated in London’s conservation areas (approximately two thirds) and in the South East. Overall 87% of creative industries located in conservation areas are located in just 20% of the 10,000 conservation areas in England (Colliers International, 2018).
The research estimated that creative businesses in conservation areas employ 460,000 to 530,000 people and generate a GVA of £22 to £25 billion per year (Colliers International, 2018).
The research highlighted the importance of the historic environment particularly for creative businesses with examples of warehouses or former industrial buildings transformed into creative hubs. Many firms in creative industries are young and ambitious, and often choose to locate in historic buildings and restore them with panache creating and projecting a unique image for potential clients (Colliers International, 2018).
One of the main insights of the research (Colliers International, 2018) is that as places change, economic development policies must take into account and prioritise the historic environment to promote societal and economic prosperity.
Showroom Cinema, Paternoster Row, Sheffield, South Yorkshire.
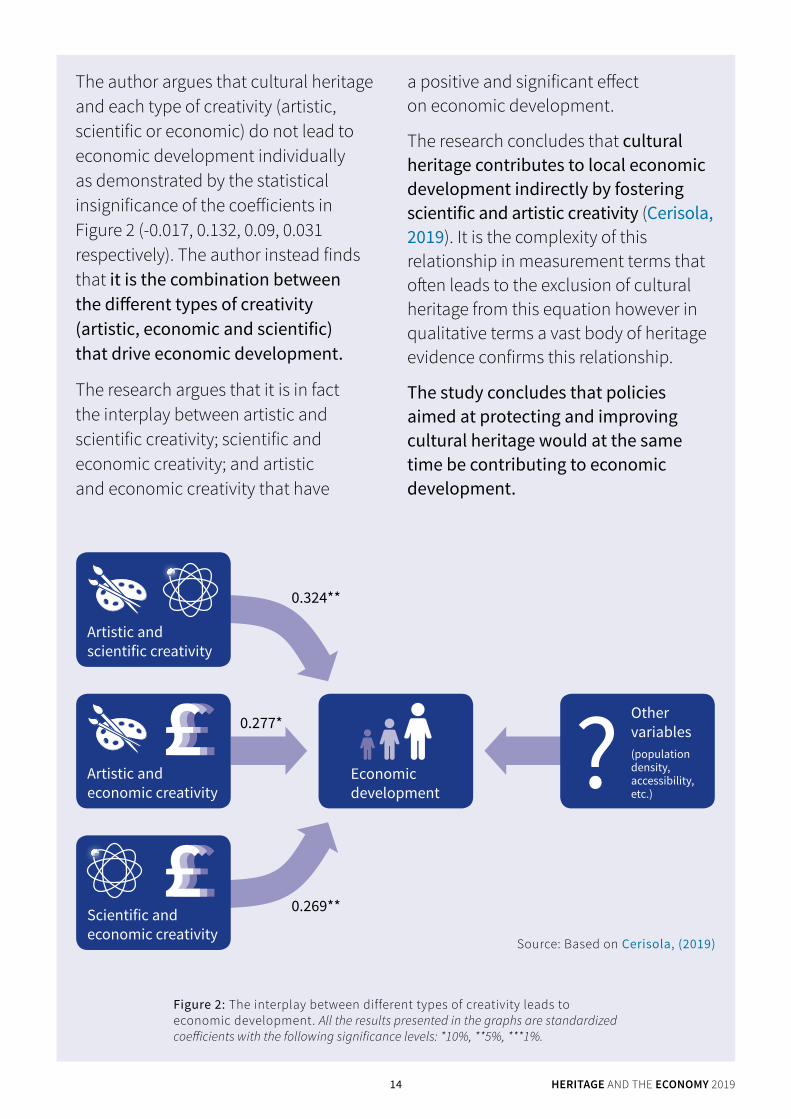
3. Heritage shapes peoples’ perceptions and authentic experiences of places
The unique character of heritage assets and historic places creates the desire amongst members of the public to conserve and protect heritage for current and future generations. Places that are aesthetically pleasing have an attractive power that encourages people to congregate there. (National Trust 2017).
HERITAGE AND THE ECONOMY 201916
n Beauty is a symbol of mutual belonging and social harmony. In a national omnibus survey of 1,043 adults across England conducted by Ipsos Mori, 81% of respondents agree that everybody should experience beauty on a regular basis (Building Better, building beautiful commission, 2019).
n The built historic environment influences perceptions of the quality and attractiveness of place. 68% of the public agree that historic buildings are built to a high standard compared with only 27% agreeing with the same statement about new buildings. This evidence is based on a national omnibus survey of 1,043 adults across England in 2018. It found that amongst members of the public, older buildings convey a sense of
‘grandeur’ and longevity (YouGov, 2018).
n Heritage forms a vital part of place identity. The GREAT Britain campaign showcases the best of what the UK has to offer to inspire the world and encourage people to visit, do business, invest and study in the UK. The campaign identifies heritage as one of 12
‘unique selling points’ of the UK. It is estimated that for every £1 spent on the GREAT campaign, overseas visitors spend £23 in Britain (VisitBritain, 2016).
‘Historic buildings were generally built to a high standard’
n Agree5%
n Disagree68%
‘New buildings are generally built to a high standard’
n Agree27%
n Disagree40%
(YouGov 2018)

HERITAGE AND THE ECONOMY 2019 17
n Investing in the historic environment can successfully increase footfall. Evaluation evidence from the Derby Partnership Scheme in Conservation Areas (PSiCA) shows that while average footfall on high streets around the nation dropped by 26% between 2008 and 2013, the Derby PSiCA areas reversed a spiral of decline through heritage led regeneration and saw footfall growth between 12% to 15% in the same period (Anarchitecture, 2017).
n Investing in the historic environment can reduce vacancy rates. The Derby Partnership Scheme in Conservation Areas (PSiCA) programme also resulted in a fall in vacancy rates from 40% vacant in 2008 to 100% occupancy in 2017 (Anarchitecture, 2017). The PSiCA project offered grants for the sympathetic renovation of historic shop fronts using local tradesmen over an 8 year period.
23-51 New Briggate, Leeds, West Yorkshire.

HERITAGE AND THE ECONOMY 201918
n People spend more in their local economy after investment in the historic environment. In areas that had received investment in the historic environment, approximately one in five visitors in a survey of 1,000 stated they spent more in an area after investment in the historic environment than they did before. One in four businesses stated that the historic environment investment had directly led to an increase in business turnover (AMION and Locum Consulting 2010).
“The development of our historic built environment can drive wider regeneration, job creation, business growth and prosperity.”
Culture White Paper (DCMS, 2016)
n The returns on heritage-led regeneration projects will often outstrip costs. Using a Transparent Economic Assessment model, in 2017 the National Lottery Heritage Fund (NLHF) conducted an ex-post evaluation of six case studies from NLHF’s Heritage Grants Programme (2002-2007).The results showed a net GVA of £8.4m generated annually and 135 direct and indirect jobs supported annually. Over the 10 years, this equated to £84m GVA across just six projects. The combined grant awarded to these six projects was £27.5m, which is a return of over three times what was originally invested. In addition, there were temporary economic benefits of £3.1m net GVA and 70 net jobs created during the construction phases (National Lottery Heritage Fund, 2017).
n Investing in the historic environment generates economic returns for local places. On average, £1 of public sector expenditure on heritage-led regeneration generates £1.60 additional economic activity over a ten year period. These finding are based on a weighted average of the benefit-cost ratio of cumulative net additional GVA to public sector costs (AMION and Locum Consulting, 2010).
CASE STUDY: ALTRINCHAM – FROM FAILING HIGH STREET TO GREAT BRITISH HIGH STREET
Altrincham is a town in Trafford, located 8 miles southwest of Manchester City Centre. In 2010, the town was labelled a
“ghost-town” as it had the worst vacancy rates in the UK, with more than 30% of the shops empty at that moment. Local newspapers attributed this to a combination of high business rates, parking charges, online competition and increasing costs (Manchester Evening News, 2018).
In 2011, Trafford Council created Altrincham Forward bringing the community, members of the public and private stakeholder together to revitalise the town. In 2012, the Council working with shop owners and landlords, developed an action plan to restore the town centre as a 21st Century market town and to improve shop frontages. The Council also invested £1 million in the refurbishment of Altrincham’ s Grade II-listed Market House and covered market and sought a private market operator to transform the Market House (Local Government News,2018). ‘A focus on food, new trading hours and active management and marketing have led to it again becoming a vibrant hub for the town centre’ (Institute of Place Management, 2018). This had a transformational and catalytic impact on the town centre, giving many people a new reason to visit (BBC, 2018).
A number of initiatives also contributed to the transformation of Altrincham.

HERITAGE AND THE ECONOMY 2019 19
For instance, the Council invested in the development of community facilities, a new hospital, a new Health and Wellbeing Hub and a library adjacent to the Market House. In 2014, the Council invested £19 million in creating a landmark gateway to Altrincham – an interchange improving service through greater integration of public transport including bus, taxi, rail, tram and cycling. It had also provided loans of up to £20,000 to allow businesses to set up in the town bringing vacant ground floor premises back into use.
These loans are estimated to have helped lever £587,427 of additional investment and has led to the creation of 77 additional jobs (Local Government News, 2018).
By 2018, Altrincham’s transformation was complete and it won the annual Great British High Street award. Vacancy rates had fallen by almost three quarters to 7.9% in December 2017 (BBC, 2018) and footfall has risen to 1.74 million a year, which represents a 5% annual growth rate (Local Government News, 2018).
Altrincham Market House, Altrincham, Greater Manchester.

HERITAGE AND THE ECONOMY 201920
4. Heritage generates demand and a property price premium
“We appreciate charm, atmosphere, life, peace, good humour and agreeable manners, all of which are part of beauty, and all of which we find abundantly in our architectural heritage” (Building Better, Building Beautiful Commission, 2019)
n Our historic properties form a vital and unique part of our national story. The UK has the oldest housing stock in Europe (EU28), with 38% of the UKs homes dating from before 1946, compared to 29% in France, 20% in Italy, 11% in Spain and just 3% in Cyprus (BRE, 2016).
n Heritage adds to property value. A survey of estate agents found that 82% stated that original features added to a property’s value and 72% felt that original features helped ensure a quicker sale (English Heritage, 2009).
n Proximity to a listed building is associated with additional value and this value is greater than the premium associated with a newly built home. A study of 160,000 data points for six cities in England found that proximity to a listed building increased property prices by between 4.4% and 10.3%. The study concludes that beauty, a sense of place, and confidence that heritage will not be destroyed bring real and predictable value (Create Streets, 2017).
n Property in distinctive areas commands a price premium. Academics at the London School of Economics surveyed 500 residents in 47 conservation areas and analysed property price data related to mortgages granted by the Nationwide Building Society between 1995 and 2010 to gather information on ‘attractiveness’ and ‘distinctiveness’. In conservation areas deemed to be distinctive, the authors found on average a positive price effect of approximately 10%. This rises to 12% in the most ‘distinctive’ conservation areas (Ahlfeldt and Holman, 2017).
n There is a 23% price premium for homes in conservation areas. Research using a hedonic model analysing 1,088,446 house sales between 1995 and 2010 showed that properties in conservation areas sell for 23 % more on average than other houses. Even when location, property features and other factors affecting house prices are adjusted for, a premium of around 9 % was still found (Ahlfeldt et al. 2012).
n House prices are higher on average in town centre conservation areas compared to non–conservation areas. Analysis shows that in 2016, house prices were 50% higher in town centre conservation areas, 33% higher in urban residential conservation areas and 22% higher in rural conservation areas relative to comparable non-conservation areas. Detailed data was analysed for 10,000 conservation areas matched to non-conservation areas with a similar Index of Multiple Deprivation and population size (OCSI, 2017). Note: these are absolute price differences not controlling for other factors.
n The popularity of historic areas is increasing. A study of 789 conservation areas found that house prices are growing at a pace that outstrips growth in non-conservation areas, indicating demand for properties in conservation areas (OCSI, 2017). Property price growth inside conservation areas exceeds comparable properties elsewhere by 0.2% a year (Ahlfeldt et al. 2012).

HERITAGE AND THE ECONOMY 2019 21
Battle of Gheluvelt Memorial Homes, Gheluvelt Park, Barbourne, Worcester, Worcestershire.
n Property values near World Heritage Sites (WHS) are almost £80,000 higher than the UK average. That is 27% more than the average UK property. A study found that the longer an area has had WHS status, the higher the property values (Zoopla, 2015).
n A study looking at how a wide range of built environment and locational factors affected London house prices found: “the most important factors influencing house prices were found to firstly relate to physical built environment housing qualities, particularly house size and age, with older housing being much more desirable. This supports arguments emphasising the value of family housing in London, and of the continuing
appeal of historic high heritage value neighbourhoods.” The results are based on a hedonic price model applied to 240,000 output areas in Greater London between 2000 and 2008 (GLA Economics, 2010).
n Listed properties generate a higher return on investment compared to non-listed properties. A 2011 analysis of the Investment Property Databank (IPD) Index (a leading real estate industry data source for commercial property) shows that at the All Property level, the IPD Listed Property Index has generated a higher level of total return than the IPD Index for three, five, 10 and 30 year time periods (Colliers, 2011).

5. Heritage still has great untapped potential
Our heritage represents an important echo of our past but is also a vital part of our emerging, sustainable future. Today, there are unrealised opportunities in underused and vacant heritage assets which can provide much needed homes and spaces for businesses. Bringing our heritage back into productive use and extending the life of our heritage assets can help us meet our sustainability goals and reduce our carbon footprint.
2019 Heritage at Risk Register for England
4,612 72designated assets on the Heritage at Risk Register in 2019
fewer than in 2018
Listed buildings
(Grade I and Grade II*)
2018 2019837 828
(-9)
Listed places of worship
2018 2019913 915
(+2)
Scheduled monuments
2018 20192,431 2,360
(-71)
Registered parks and gardens
2018 201999 102
(+3)
Registered battlefields
2018 20194 3
(-1)
Protected wreck sites
2018 20194 3
(-1)
Conservation areas
2018 2019396 401
(+5)
HERITAGE AND THE ECONOMY 201922
(Historic England, 2019)
n The untapped potential of designated heritage. There were over 4,612 designated heritage assets ‘at risk’ in 2019. These are sites that are most at risk of being lost as a result of neglect, decay or inappropriate development. Investment in heritage assets at risk can deliver positive environmental and regeneration outcomes (Historic England, 2019).

HERITAGE AND THE ECONOMY 2019 23
Morecambe Winter Gardens, Morecambe, Lancashire.

HERITAGE AND THE ECONOMY 201924
n Underused historic mills in West Yorkshire and Greater Manchester have the capacity to generate thousands of new jobs and new homes. Research in 2017 examined the opportunities provided by vacant and underused textile mills in West Yorkshire and the North West. The research demonstrated that there were approximately 1,350 underused or vacant mills in West Yorkshire, 542 in Greater Manchester and 540 in Lancashire. Applying standard office floor space densities to the total amount of net vacant floor space in West Yorkshire, Greater Manchester and Lancashire’s textile mills illustrates the potential to generate 283,000 new net additional jobs (equivalent to £12.4bn of Gross Value Added per annum) or 52,000 new homes (Historic England, 2017).
n Loss of distinctiveness reduces premium values of heritage. Research in 2017 found that the majority of conservation areas ‘at risk’ exhibit lower average property prices than those not ‘at risk’ (OCSI, 2017). While the research does not conclude that conservation areas ‘at risk’ have lower property prices this can be inferred from the Ahlfeldt and Holman (2017) findings which show that more distinctive areas command higher property prices. Loss of character, neglect and damage of historic or architectural features which lead
to a conservation area to be assessed as ‘at risk’ no doubt reduces the distinctiveness of areas and thus the premium values.
n Lower property premiums for heritage ‘at risk’. While there is a 9% premium on properties in conservation areas, this advantage falls by 4 percentage points to 5% in conservation areas that are classified by local authorities as being ‘at risk’. This evidence is based on a hedonic model analysing 1,088,446 house sales between 1995 and 2010 controlling for location, property features and other factors affecting house prices (Ahlfeldt et al. 2012).
n There are unrealised opportunities for new businesses in underused or vacant heritage assets. Businesses that occupy listed buildings generate £13,000 extra GVA per business per year. This extra GVA is the amount above that generated by an equivalent number of businesses in non-listed buildings. These estimates were based on business occupation data combining two different datasets: National Heritage Lists from England, Scotland, Wales and Northern Ireland and data of non-residential uses in buildings, collated by Ordnance Survey (National Lottery Heritage Fund, 2013).
Average property values in conservation areas, 2016 Average Property
Values, 2016Rural
Conservation AreasTown Centre
Conservation AreasUrban Residential
Conservation Areas
At Risk
Not at Risk
£260,000
£330,000
£270,000
£410,000
£360,000
£380,000
Source: (OCSI, 2017)

HERITAGE AND THE ECONOMY 2019 25
THE RATIONALE FOR GOVERNMENT INTERVENTION IN HERITAGE
The upfront costs of investing in Heritage at Risk and the expected rate of return can be barriers to renewal and a cause of deterioration over time.
The rationale for intervention in relation to heritage is based on the existence of market failures which have led to the decay and abandonment of historic buildings and areas. For example a landmark historic building that is vacant and deteriorating can blight a wider area; investment in the repair and reuse of the same building can act as a flagship of regeneration and renewal. Where the market has allowed this situation to occur investment of public funds is needed to close the “conservation deficit” (the excess costs of repair over the market value of the property in its repaired condition).
Heritage and public goods: Heritage assets have inherent public good characteristics. To varying degrees heritage assets create benefits for both the owners of heritage assets as well as wider society in so far they enhance everyday living environment and are non-excludable and non-rival. ‘Public goods’ are said to be ‘non-rival’ in that one person’s consumption does not limit its consumption by another person, and
‘non-excludable’ in that access to a good is open to all.
Heritage and externalities: A typical feature of public goods is the existence of externalities which are benefits or costs that are not accounted for in a
market transaction. These emerge either as consumption externalities (benefits/ costs shared by heritage owners and consumers/society e.g. more attractive places to live and work) or used for economic purposes through production externalities (benefits/costs accruing other economic activities as a result of heritage e.g. tourism and heritage).
Heritage and information asymmetries: The value of heritage can be difficult to quantify and attribute due to the non-use qualities of heritage. Non –use values are economic values assigned by individuals to goods/ services unrelated to their current or future uses. Information asymmetries mean economic agents can make sub-optimal decisions based on incomplete information. Listing (statutory protection) is a way of addressing these market failures by signalling quality and recognising the value of significant historic properties to the nation.
Heritage and coordination: While the renovation of a landmark is typically led by a team with historical and architectural expertise, the preservation and renovation of the majority of historic buildings is often in the hands of property owners or outside investors who may lack the specialised knowledge to carry out work that reflects the distinctive architectural and historical character of the property. Coordination is also needed in developing and disseminating guidance to assist owners in the maintenance and adaptation of their assets.

HERITAGE AND THE ECONOMY 201926
Apprentice, Shrewsbury Flaxmill Maltings, Shropshire.

THE HERITAGE SECTOR AND THE EUROPEAN UNION
It is estimated that around 15,000 EU nationals were employed in the Heritage Sector in 2016 – representing 7.4% of the total workforce (Cebr, 2019a).
% EU Proportion EU Employment in heritage
Construction 8.8 9,207
Arts 5.6 3,000
Business activities 7.5 1,909
Public administration 4.0 409
Education 4.0 68
TOTAL 7.4 14,593
In 2016, an estimated 48% of firms in the heritage sector seeking to recruit non-UK nationals for hard to fill vacancies recruited from the EU. Compared to other UK sectors, firms in the heritage sector are more likely to recruit from the EU labour market (Cebr, 2019a).
n EU nationals only n Non-EU nationals only n Both EU and non-EU nationals n Don’t know
Heritage
60%
0%Construction Arts Education UK AverageBusiness
Services
10%
20%
30%
40%
50% 4844 43 43 43
45 4644 44
56
6 65 5 534 4 4
8 711
3735
HERITAGE AND THE ECONOMY 2019 27
Source (for both table & graph): Employer Skills Survey 2017, ONS, Cebr analysis
It is estimated that between 2007 and 2016, the EU provided £450 million worth of funding to the heritage sector in England. This figure is likely to be an underestimate as it is difficult to precisely account for all EU funding to England – for example, it is unclear what proportion of funding from the European Regional Development Fund (ERDF) was allocated to heritage projects (Cebr, 2019a).

II. Heritage and the economy: The sum of many parts
Heritage is an important source of economic prosperity and growth. The heritage sector is a complex and multidimensional sector with multiple economic activities dependent and embedded within it.
The economic footprint of heritage, 2018
Direct + Indirect + Induced:
£31bn GVA and 464,000 jobsimpact of direct and indirect employees of the heritage sector‘s spending in the wider economy
Direct + Indirect impacts:
£23.5bn GVA and 352,440 jobspurchases heritage sector makes from businesses in the same and other
industries through their supply chain
Heritage is all around us
Directly provides 198,000 jobs
£14bn GVA
Construction £7143m GVA
(51%)
Architectural and Engineering
activities, technical testing and analysis
£1,986m GVA (14%)
Public administration
and defence, compulsory
social security £780m (6%)
Libraries, Archives,
Museums: £2,279m GVA
(16%)
Source: Cebr, 2019b
HERITAGE AND THE ECONOMY 201928

HERITAGE AND THE ECONOMY 2019 29
Architect working on a drawing. © daniel-mccullough-HtBlQdxfG9k-unsplash
n The heritage sector’s economic value stems from a variety of activities, ranging from conservation and preservation of historic buildings to activities in the natural environment. Historic England commissioned the Centre for Economics and Business Research (Cebr) to conduct a statistical analysis and economic modelling to estimate the ongoing contribution of the heritage sector in England. Cebr`s estimates provided a robust and detailed statistical definition of the heritage sector using a SIC-SOC methodology in which occupations in the heritage sectors were mapped to specific industries. The study demonstrates that the Heritage Sector is an important economic sector producing a total GVA of £31bn and providing over 464,000 jobs (Cebr, 2019b). These are jobs and GVA created either directly; indirectly through purchases in other industries; and induced effects from spending in the wider economy.
n The heritage sector is an important employer and producer of economic wealth. Based on ONS statistics and (Cebr, 2019b), we estimate that in 2018 the average heritage worker produced £71,000 of Gross Value Added (GVA) per year, which was 53% higher than the average worker in the non-financial sector of the UK economy.
n The cumulative growth of heritage employment (2011 to 2018) has outstripped the rest of the UK economy, growing twice as fast as UK employment: 19% compared to 11%. Albeit growth has been volatile, decreasing between 2011-2013 and 2017-2018 and increasingly strongly from 2014 to 2017 (Cebr, 2019b).

Heritage a vital and growing part of our national economy
140%
150%
160%
80%2011 2012 2013 2014 2015 2016 2017 2018
90%
100%
110%
120%
130%
2011GVA: £21.1bnJobs: 388,000
2018*GVA: £31.0bnJobs: 464,000*forecast data
Source: Cebr, 2019b
20%Average
annual growth rate 2.8%
47%Average
annual growth rate 6.7%
2011 = 100%
n GVA growth (£million) n Employment growth (000s)
England’s heritage sector direct GVA comparison with selected UK industries in 2018 (£millions)
England’s heritage sector generated a larger GVA than the security industry, defence industry, aerospace
industry and the arts and culture industry in the UK.
Heritage13,990
Arts & Culture 11,563
Aerospace 11,563
Defence 10,484
Security 5,911
Source: Cebr, 2019b
HERITAGE AND THE ECONOMY 201930

HERITAGE AND THE ECONOMY 2019 31
Victoria Quarter Arcade, Briggate, Leeds, West Yorkshire.

1. Heritage, construction and development
The on-going need to repair, maintain and restore these historic buildings creates strong dependencies between heritage and the construction and development sectors, often requiring specialist heritage skills, knowledge and expertise.
HERITAGE AND THE ECONOMY 201932
Heritage construction and development in numbers
£7.1bnin GVAgenerated by heritage-related construction activities in England, 2018
100,000construction workers involved in heritage-related activities, including building finishing and specialised activities such as bricklaying and stone setting, carpentry, roofing etc.
6,000people employed as archaeologists in England, 2018
24,000architects, building and civil engineers and chartered surveyors involved in heritage-related activities
Source: Cebr, 2018*1919 is used as date to identify traditionally-constructed buildings as they are more likely to be of solid wall construction, whereas around and after this date cavity wall construction became more commonplace. (CITB, English Heritage and Historic Scotland 2013) This change in construction has implications for the way in which a building reacts to its environment, and the skills, materials and investment needed to repair and maintain buildings.

Construction workers on site at East Stoke, Dorset. © Historic England Archive
Type of work undertaken on traditional (pre-1919) buildings in England
Conservation and restoration
Routine repair and maintenance
Retrofit in the interests of energy efficiency
0 10 20 30 40 50 60
Source: (CITB, English Heritage and Historic Scotland, 2013)
HERITAGE AND THE ECONOMY 2019 33

HERITAGE AND THE ECONOMY 201934
HERITAGE AND THE CONSTRUCTION SKILLS CERTIFICATION SCHEME
The construction industry recognises the specialist needs of the built historic environment. Bodies such as the Construction Industry Training Board (CITB), Royal Institute of Chartered Surveyors (RICS) and Construction Skills Certification Scheme (CSCS) all promote or offer heritage-specific training schemes and qualifications.
CSCS cards are available for 370 construction trades. They help workers demonstrate their qualifications and skills to do their job along with health, safety and environmental awareness. Heritage CSCS cards are available for 20 different construction trades, ranging from specialist trades such as specialist lead workers through to more conventional trades such as painter and decorators and bricklayers.
n Builders are the first port of call for advice and repair and maintenance work for 54% of listed building owners. A 2017 survey of 1,345 listed residential building owners, stratified by regions in England and listing grade, found this was the case for over half (54%) of the owners (Ecorys, 2017).
n The survey of listed building owners demonstrates strong demand for building services for listed buildings. A third (35%) of 1,345 surveyed listed building owners had applied for listed building consent in the last five years (Ecorys, 2017).
n The number of listed building consents has been rising since the 2007/08 recession. In 2016/17 there were over 31,000 listed building consent applications – a 15% increase since 2009/10. Listed building consent (LBC) is a form of planning consent required to make alterations to a listed building and is granted by the local authority planning department. LBC is an indicator for the continuing demand for heritage related construction activities (MHCLG, 2018).
n The renovation and restoration of historic buildings creates new jobs. In 2017 the National Lottery Heritage Fund reported the findings of an impact evaluation of grants distributed between 2002 and 2007. The findings show that 60% of the projects led to the creation of new jobs and 22% reported regeneration impacts. By enhancing the
character and distinctiveness of their local areas through the renovation, restoration and improvement of heritage assets, places were seen as more inviting and attracted further investment. A sample of 133 projects was evaluated (which represents 13% of all the completed projects). The impact evaluation consisted of an online survey of 83 projects and case studies of 50 other projects, with in-depth economic modelling of 6 of these projects (NLHF, 2017).
n Commercial archaeology generated total revenue of £228m in 2016-17. These findings are from research commissioned by the Charted Institute for Archaeology (CIfA) and the Federation of Archaeological Managers and Employer (FAME) about archaeological services in the UK. 54 organisations were surveyed highlighting growing pressure on archaeological services due to growing demand, specifically from the HS2 project. The survey also highlighted growing uncertainty regarding the potential implications of the UK leaving the European Union (Landward Research, 2017).
n In Great Britain, between 89% and97% of contractors who work in traditional buildings (pre-1919) do not have the qualifications and specialised knowledge. This lack of specialist skills increases the risks associated with maladaptation and poor maintenance of traditional buildings (Strategic Skill Partnership Progress Report, 2018).

HERITAGE AND THE ECONOMY 2019 35
COMMERCIAL ARCHAEOLOGY IS AN IMPORTANT ASPECT OF MANY CONSTRUCTION AND INFRASTRUCTURE PROJECTS
Archaeological surveying often needs to take place in advance of construction projects to identify and minimise any impact on heritage assets. Archaeologists are also often engaged to keep a watching brief during works to assess any impact on historic sites and have an important role in keeping project on track by ensuring compliance with legislation where heritage assets are involved.
Over 40 major infrastructure projects are planned in the UK during the period 2015-33 with the majority falling in the period 2015-21. The total capital cost is £464.9bn. There is a projected shortage of between 25 and 64% in the available workforce needed to service the archaeological needs of the planned major infrastructure projects in the UK (Historic England, 2016).
Ironbridge, Coalbrookdale, Shropshire

2. Heritage tourism
Heritage is an important part of tourism in England, attracting millions of domestic and international tourists each year. Some tourists visit England primarily to visit heritage attractions, while others take part in heritage activities during visits that are made for other purposes. This in turn supports millions of jobs and contributes to national and local economic growth.
Heritage tourism in numbers
INTERNATIONAL VISITS
17.5m ... heritage-related international inbound visits in 2018.
£9.3bn ... spent by international tourists on heritage-related visits in 2018.
DAY VISITS
186.0m ... day visits were motivated by heritage-related activities in England in 2018.
£4.3bn ... spend generated by heritage-related day visits in England, 2018.
DOMESTIC OVERNIGHT
TRIPS
14.9m ... heritage-related trips in England in 2018.
£3.4bn ... generated by heritage-related trips in England, 2018.
TOTAL TOURISM
218.4m ... heritage-related visits and trips in England in 2018.
£17.0bn ... generated by heritage-related visits and trips in England, 2018.
HERITAGE AND THE ECONOMY 201936
Source: Cebr, 2019b
*A trip refers to the travel by a person from the time of departure from his usual residence until he/she returns: it thus refers to a round trip. A trip is made up of visits to different places. A visitor is someone who is making a visit to a main destination outside his/her usual environment for less than a year for any main purpose [including] holidays, leisure and recreation, business, health, education or other purposes. A visit can be made up of different activities (UNWTO 2010).

HERITAGE AND THE ECONOMY 2019 37
A family enjoys a visit to Carisbrooke Castle, Isle of Wight.
6 out of the top 10 of the most visited paid attractions in England in 2018 were heritage attractions
Tower of London2.8m visitors 2017
Rank 1
Royal Botanic Gardens, Kew
1.9m visitors 2018 Rank 3
St Paul’s Cathedral1.7m visitors 2018
Rank 4
Stonehenge1.6m visitors 2018
Rank 7
Westminster Abbey1.5m visitors 2018
Rank 8
Roman Baths and Pump Room
1.3m visitors 2018 Rank 9
Source: (VisitBritain, 2019)

n According to the Taking Part survey, three quarters of adults (72.8%) in England, or approximately 40 million people, visited a heritage site at least once in 2017/18. This is a statistically significant increase since the survey began in 2005/06 (69.9%) The Taking Part survey is a continuous face to face household survey of adults aged 16 and over and children aged 5 to 15 years old in England, measuring engagement with the cultural sectors (DCMS, 2018).
Visits to heritage sites in the last 12 months
72.8%of adults
(40people) visited a heritage site at least once in 2017/18.
million
HERITAGE AND THE ECONOMY 201938
n Two thirds (34%) of domestic tourists cited being able to visit a historic building or monument as their ‘sole reason’ or a ‘very important reason’ why they took their domestic holiday or short break. This increases to 63% for day visitors. These figures are based on an online survey of 2,427 respondents (TNS, 2015).
n Heritage tourism is more popular in Britain, compared to other Europe nations. 35% of UK citizens “totally agree” that the presence of cultural heritage influences their choice of holiday destinations. This is the 4th highest proportion of the survey respondents from the 28 EU countries (European Commission, 2017).
n Almost three quarters of visitors to historic attractions in England were domestic visitors, including both day trips and longer stays in 2018. The proportion of domestic visitors has been increasing steadily since 2008 (except in 2012 and 2018), suggesting that holiday trends in England are changing with more trips within the UK (BDRC, 2019).
n Heritage is an integral part of the UK brand, driving millions of international visits each year. History and heritage are strong product drivers for most overseas markets. Visit Britain’s GREAT campaign has identified heritage as one the UK’s 12 ‘unique selling points’.
– In 2018, the UK was ranked 5th out of 50 nations in terms of being rich in historic buildings and monuments, and 7th for cultural heritage in the Anholt Gfk Nations Brand Index. This index is based on an online survey to over 20,000 consumers in in 20 panel countries around the world. Survey participants are asked to score 50 countries (including the UK) according to a myriad of aspects such as tourism, culture, exports, governance, immigration and investments.
– The UK was ranked 3rd in the Overall Nations Brand Ranking and 4th in the cultural dimension in 2018 (VisitBritain, 2018).
n ‘Screen tourism’ is an important factor behind the UK’s successful tourism industry.
‘Screen tourism’ refers to the phenomenon in which the depiction of a location on screen subsequently drives tourist visits. A 2015 report into screen tourism estimates that tourists visiting locations featured in film and television programs generated £140 million for the UK economy in 2014. This includes a large number of productions filmed at heritage sites such as Harry Potter, Downton Abbey and Broadchurch. The study is based on site and online surveys of 1,006 individuals in 8 locations. A scaling-up methodology was used and day-spend figures were applied to differentiate between different types of tourists (Olsberg SPI, 2015).
n In a survey of historic attractions, 725 responding sites reported a total of 75.8 million visitors in 2017/18. Since 2000, visits to historic attractions have risen by 58% (BDRC, 2019).

n Tourism is forecast to grow in 2019. Inbound tourism declined in 2018 in comparison to the record levels achieved in 2017. However, Visit Britain forecasts that inbound tourism will grow by 3% to 38.9 million and will boost spending by 7% to 24.5 billion in 2019. It is expected that visits will grow similar to the long-term average, while spending will grow faster than the long-term average due to higher growth from some high-spending long-haul markets (VisitBritain, 2019).
n Heritage visits generate incomes in local economies. A study into heritage and the UK tourism economy, based on a random sample of 62 completed National Lottery Heritage Fund projects funded between 2004 and 2007, estimated that for every £1 spent as part of a heritage visit, 32p is spent on site and the remaining 68p is spent in local businesses including restaurants, cafés, hotels and shops (National Lottery Heritage Fund, 2010).
n In 2015, the heritage tourism sector supported £5.3 billion in tax receipts to the Exchequer. This is equivalent to 0.8 % of all tax collected by the central government that year. This includes £2 billion the heritage tourism sector paid directly; £2.1bn from the heritage tourism sector’s wage payments and subsequent spending of those wages; £1.2 billion in tax receipts from the sector’s purchases. These estimates are based on the GVA and the number of people employed in the heritage tourism sector (Oxford Economics, 2016).
n The financial benefit of World Heritage Sites to the UK is £85 million per year. The United Kingdom National Commission for UNESCO found that the World Heritage Site brand is used as a significant marketing tool boosting tourist numbers and expenditure, local employment and local house prices. Furthermore, the UK’s membership of UNESCO is estimated to have helped the country attract at least £100 million in additional income in 2016 from increased tourism revenue and EU funding (UNESCO, 2016).
Index of visitors to historic properties in England (2000 to 2018)
Indices 2000 = 100%Constant samples (from one year to next only)
60%
2001
2002
2003
2004
2005
2006
2007
2008
2009
2010
2011
2012
2013
2014
2015
2016
2017
2018
80%
100%
120%
140%
180%
160%158%
2000
Source: (BDRC 2019)
HERITAGE AND THE ECONOMY 2019 39

3. Heritage volunteering
Volunteers are vital to the day-to-day running of many heritage organisations. They dedicate significant amounts of time, knowledge and expertise in a wide range of high-skilled and low-skilled roles. These activities range from fundraising, outreach, events and exhibitions staffing, specialist conservation work, to governance roles and trusteeship.
HERITAGE AND THE ECONOMY 201940
Heritage volunteering in numbers
616,000 heritage volunteers in England, 2016
5.7%£520m estimated economic value of heritage
volunteering based on national minimum wage in England, 2016
of all volunteers in England, 2016
Source: Cebr, 2019a
n Using DCMS Taking Part survey data, it is possible to estimate the economic value of heritage volunteering using the replacement-cost method. This method involves estimates of how much it would cost to replace each volunteer with a paid member of staff by attributing an hourly wage to the total number of hours contributed by heritage volunteers.
n In addition to being beneficial to wellbeing, volunteering can help in skills development and support future employability.

41HERITAGE AND THE ECONOMY 2019
Volunteers working at Morecambe Winter Gardens, Morecambe, Lancashire.
HERITAGE AND THE ECONOMY 201942
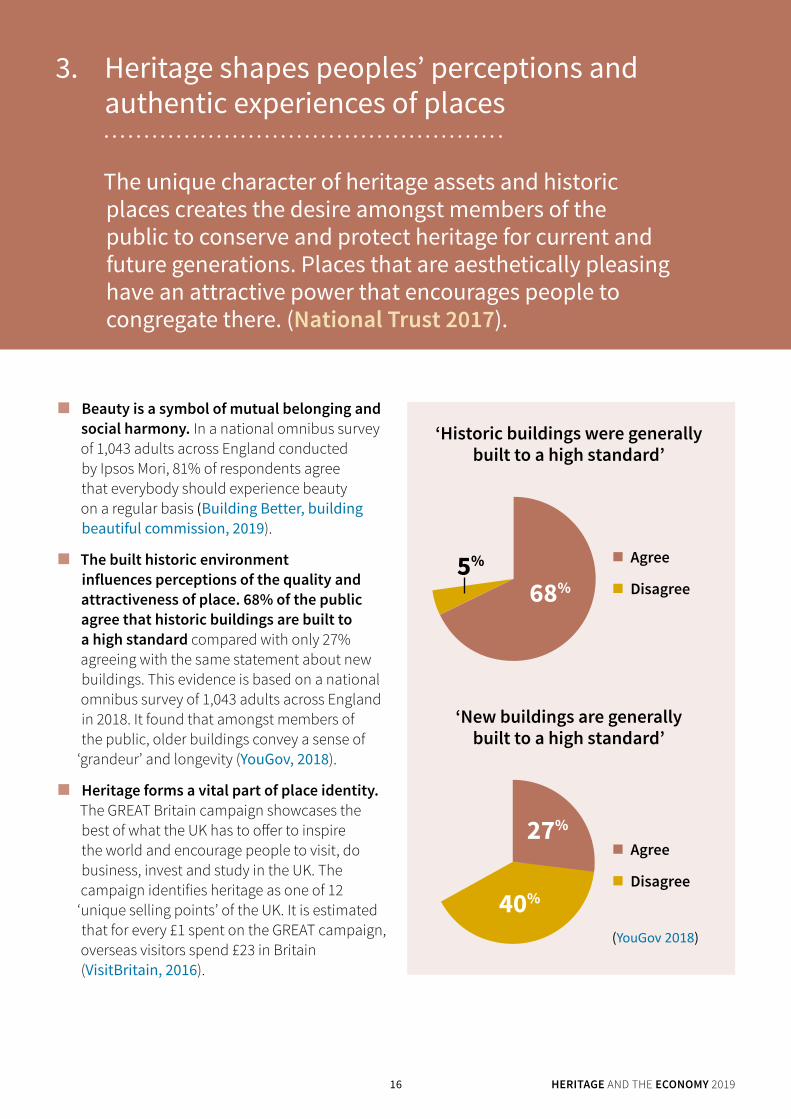
THE SOCIAL IMPACT OF VOLUNTEERING
Volunteering is a cornerstone of National Lottery Heritage Fund’s (NLHF) investments. Most of NLHF’s projects rely on volunteers, who in many cases play important roles in the leadership, management and design of projects. In June 2008 the National Lottery Heritage Fund commissioned BOP consulting to assess the social impact of volunteer participation in funded projects, focusing on the experience of the volunteers. The research used of a mix of quantitative and qualitative approaches to assess 25 randomly selected projects. This included site visits to 11 projects, where almost 100 volunteers were interviewed, and non-participant observation of
volunteering activity. It also involved an in-depth self-complete survey of 14 projects (National Lottery Heritage Fund, 2009).
The research concluded that most National Lottery Heritage Fund volunteers were highly-educated, enjoyed a well-developed social network and gave importance to social and political participation (Heritage Lottery Fund, 2009). Engagement in NLHF projects contributed to deepening volunteers’ knowledge, skills and increased social capital. For more than 33%, volunteering increased self-worth and social engagement. The research found that older participants enjoyed the benefits of volunteering particularly because a process of social
Volunteers at Caen Lock, Devizes, Wiltshire.

HERITAGE AND THE ECONOMY 2019 43
disengagement often comes with age. By contributing to NLHF projects, older volunteers maintained high levels of social participation and engagement (National Lottery Heritage Fund, 2009).
In 2010, the National Lottery Heritage Fund commissioned BOP consulting to revisit the research on the social impact of volunteering. As with previous research, the methodology involved the use of quantitative and qualitative approaches including surveys, non-participatory observation and interviews. The methodological innovation of this research was the inclusion of a control group of volunteers from Oxfam and the employment of econometric analysis of the relationship between mental health and volunteering using the
Understanding Society survey (National Lottery Heritage Fund, 2011).
The research concluded that despite the dominance of older people volunteering in the NLHF projects, younger volunteers benefitted from the most from skills development. Additionally, participants without a degree experienced greater gains in mental health and well-being. In a similar vein, unemployed volunteers were more likely to report that they had subsequently taken a course after their volunteering engagement. The study found little evidence that the reported positive social outcomes of volunteering could be attributed to volunteering in NLHF projects or heritage-based experiences (National Lottery Heritage Fund, 2011).

III. Heritage and the economy: A focus on skills in the heritage sector
SKILLS SHORTAGES AND SKILLS GAPS IN THE HERITAGE SECTOR
Since the financial crisis of 2007/08 there have been concerns about the growing productivity deficit in the UK (Financial Times, 2018; McKinsey, 2018). Compared with the rest of the G7 economies, the UK has continued to display below average real productivity growth in both output per hour and output per worker (ONS, 2018). This is problematic as “productivity matters for welfare” - higher productivity is reliably associated with higher wages, higher consumption levels and improved health indicators (Tenreyro, 2018).
While there are many determinants of productivity, economic literature and empirical studies have demonstrated the importance of skills (Cebr 2019a).
“Increasing levels of skills and rates of capital investment in low-wage sectors can play a part in closing the UK’s relative productivity gap with other countries” (Forth, 2018).
Historic England commissioned the Centre for Economics and Business Research (Cebr) to examine the skills needs and skills gaps of the heritage sector in England. The study used statistical analysis and economic modelling to examine the industrial and occupational footprint of the heritage sector and combined this with data from the Employers Skills Survey to consider the incidence of skills gaps and shortages in heritage sector.
The incidence of the heritage sector’s skills gaps and skills shortages are presented in the figures below. Skills gaps occur when an employer considers that an existing employee lacks the skills, knowledge, experience or qualifications to be fully proficient at their job. Skills shortages occur when employers encounter difficulties finding staff with the appropriate skills, knowledge, experience or qualifications to fill outstanding vacancies at an appropriate wage.
4%...of workers in the heritage sector lacked the skills to do their job in 2016
?...was lost due to skills shortages in the heritage sector in 2016
£140mGVA
1.1%
...of jobs in the heritage sector were vacant due to skills shortages in 2016
HERITAGE AND THE ECONOMY 201944

18
© Centre for Economics and Business Research
Figure 7: Skills gaps and shortages by broad SIC sector by proportion of employers reporting, 2017
Source: Employers Skills Survey 2017, Cebr analysis
9%
18%
10%
15%
19%
13%
10%
15%
11%
20%18%
13%12% 11%
3%
9%
5%4%
7%6% 6%
5%6%
7%9%
7% 7%6%
0%
5%
10%
15%
20%
25%
Prim
ary
Sect
or &
Util
ities
Man
ufac
turin
g
Cons
truc
tion
Who
lesa
le &
Ret
ail
Hote
ls &
rest
aura
nts
Tran
spor
t & S
tora
ge
Info
rmat
ion
& C
omm
unic
atio
ns
Fina
ncia
l Ser
vice
s
Busi
ness
Ser
vice
s
Publ
ic a
dmin
.
Educ
atio
n
Heal
th &
soci
al w
ork
Arts
& O
ther
Ser
vice
s
Herit
age
Incidence of skills gap (proportion of employers) Had at least one skills shortage vacancy (proportion of employers)
19
© Centre for Economics and Business Research
Figure 8: Skills gaps and vacancies by broad SIC, proportion of workforce/vacancies, 2017
Source: Employers Skills Survey 2017, Cebr analysis
4.7%
5.8%
4.0%
5.1%
3.2%
6.7%
4.4% 4.3%
2.9%3.3%
3.9% 4.0%
0.8% 0.7%1.2%
0.6% 0.8% 1.0% 1.1% 1.0%0.4% 0.8% 1.0% 1.1%
0.0%
1.0%
2.0%
3.0%
4.0%
5.0%
6.0%
7.0%
8.0%
Prim
ary
Sect
or &
Util
ities
Man
ufac
turin
g
Cons
truc
tion
Who
lesa
le &
Ret
ail
Tran
spor
t & S
tora
ge
Hote
ls &
rest
aura
nts
Info
rmat
ion
& C
omm
unic
atio
ns
Busi
ness
Ser
vice
s
Educ
atio
n
Heal
th &
soci
al w
ork
Arts
& O
ther
Ser
vice
s
Herit
age
Incidence of skills gap (proficiency of workforce) Skills shortage vacancies as a proportion of total employment in the sector
HERITAGE AND THE ECONOMY 2019 45

HERITAGE AND THE ECONOMY 201946
It is estimated that 11% of firms in the Heritage Sector have a skills gap in their workforce with 6% of firms operating within the heritage sector had at least one skills shortage vacancy. In proportion to the workforce of the heritage sector this translates into an estimated 4.0% of all workers in the heritage sector who are ‘not fully proficient’ in their jobs and 1.1% of all jobs in the heritage sector are vacant due to a skills-shortage in the wider labour force. In comparison with other sectors, the heritage sector has an average incidence of skills gaps but has a relatively high incidence of skill shortage vacancies.
The specific skills lacking in the heritage workforce (skills gaps) appear to be related to the specific skills lacking in candidates (skills shortages). This indicates a degree of interchangeability between the two concepts which makes intuitive sense: an employer who needs a worker with a certain skill has two options
– they could either hire a new worker with the required skill or alternatively they could attempt to utilise a current employee. (Cebr, 2019a)
‘Specialist knowledge needed to perform the role’ is estimated to be the most common skill lacking amongst candidates for jobs in the heritage sector, with an estimated 67% of all heritage employers with a skills shortage vacancy lacking this specific skill amongst candidates (Cebr, 2019a). For instance, a report from University College London on the skills gaps, shortages and needs in the heritage science sector perhaps unsurprisingly
highlights handling digital collections and data as a key technical skill that was lacking (UCL, 2015). By comparison, in the archaeological sector, the most cited skills shortages concerned specific skills on artefact conservation, fieldwork and post-fieldwork analysis (Landward, 2017).
Skills gaps and skills shortages in the economy and in heritage sector are problematic as they have a negative impact on wages, productivity and economic growth. In all, it is estimated that approximately £140 million worth of potential GVA was ‘lost’ in the Heritage Sector due to skills shortages in 2016 (Cebr, 2019a).
The Cebr research examined the ways in which the heritage sector can address some of the skills gaps and skills shortages and concludes:
– Undergraduate university courses are unlikely provide the best platform to improve skills in the Heritage Sector. The reason behind this is two-fold. For highly specialist courses, universities may find it difficult to attract sufficient numbers of students in order to make the course economically viable to run. The specialist skills may also require ‘hands-on’ training that universities struggle to provide. More specialised postgraduate studies and vocational study programmes may offer a better solution.
– The actions undertaken by employers in the Heritage Sector to address skills shortages predominantly focus around recruitment, with an estimated

38% of heritage organisations with skills shortages increasing advertising/recruitment spending and 30% using new recruitment methods in response.
– The main avenue available to address skills gaps focuses around in-work training. The Heritage Sector falls
slightly behind the UK average in terms of proportion of staff receiving training. 36% of firms in the UK reported having their entire workforce engage in training in the previous 12 months, compared to an estimated 31% for the Heritage Sector.
22
© Centre for Economics and Business Research
55%
44%
34%
31%
20%
25%
24%
34%
27%
22%
20%
7%
59%
41%
40%
37%
32%
30%
23%
26%
27%
17%
67%
45%
34%
31%
28%
27%
27%
26%
21%
16%
29%
9%
56%
48%
42%
34%
38%
28%
29%
24%
23%
17%
0% 10% 20% 30% 40% 50% 60% 70% 80%
Specialist skills or knowledge needed to perform the role
Solving complex problems requiring a solution specific tothe situation
Knowledge of how your organisation works
Reading and understanding instructions, guidelines,manuals or reports
Basic numerical skills and understanding
Writing instructions, guidelines, manuals or reports
More complex numerical or statistical skills andunderstanding
Adapting to new equipment or materials
Computer literacy / basic IT skills
Advanced or specialist IT skills
Manual dexterity
Communicating in a foreign language
Ability to manage own time and prioritise own tasks
Customer handling skills
Team working
Managing their own feelings, or handling the feelings ofothers
Managing or motivating other staff
Persuading or influencing others
Sales skills
Setting objectives for others and planning human,financial and other resources
Instructing, teaching or training people
Making speeches or presentations
Skills Shortage in heritage Skills Gap in heritage
Figure 9: Specific skills lacking in the Heritage Sector, 2017
Source: Employers Skills Survey 2017, Cebr analysis
HERITAGE AND THE ECONOMY 2019 47

CULTURAL HERITAGE ATTRACTS HIGHLY SKILLED WORKERS
In an acclaimed Book Cities and the Creative Class (2003), Richard Florida highlights the importance of creative people for regional economic growth. He argues that the reasons why creative people cluster in certain places are the presence of the three T’s: technology, talent and tolerance.
In a similar vein, Backman and Nilsson (2018) analyse the reasons behind migration decisions of highly-qualified individuals. The study uses neighbourhood data from 8,548
observations in Sweden for two time periods: 2001-2006 and 2001-2010. A growth equation using a multilevel random effects model with instruments in the form of clustered centred-means was employed (Backman and Nilsson, 2018).
The study finds that heritage assets and the cultural environment attract highly-educated people to an area. This especially applies to urban areas. An increase in built heritage and culture of one unit leads to an increase of approximately fifty highly-educated people in a neighbourhood in the short run and of seventy nine in the medium run (see graphic below).
Heritage and the location of highly skilled people (2001-2010)
Growth in highly educated
individuals
Built heritages and cultural environments
78.5
Share of high technology manufacturing firms
57.2
Share of knowledge– intensive firms
62.7
Other variables
?
HERITAGE AND THE ECONOMY 201948
***Significant at 1% level, **significant at 5% level, *significant at 10% level. Source: Based on Backman and Nilsson, (2018)

HERITAGE AND THE ECONOMY 2019 49
Labour market characteristics, in terms of the industrial composition, are also important factors explaining the migration decisions of skilled workers. An increase in the share of high technology manufacturing firms of one percentage point leads to an increase of approximately fifty-eight highly educated people in a neighbourhood in the medium run. An increase in the share of knowledge intensive firms of one percentage point leads to an increase of sixty three highly
educated people in a neighbourhood in the medium run.
The study concludes that the preservation and enhancement of cultural heritage, along with industrial policies aimed at promoting the development of knowledge and technological intensive firms, are important to attract highly-educated people. This fosters creativity in the local economy, and spurs economic development.
University of Cambridge.

IV. The ‘Total Economic Value’ of heritage is greater than the sum of all its parts
So far, the economic contribution of heritage has been mainly expressed in terms of traditional economic measures such as Gross Value Added (GVA) and employment. Focusing only on these measures, however, underestimate the so called ‘total economic value’ of heritage which is the greater societal value of heritage to individuals, communities and the public as a whole.
HERITAGE AND THE ECONOMY 201950
n Heritage has a value beyond economic value – heritage has cultural, social and environmental values as well as economic value.
n Many of the benefits obtained from heritage are not supplied (or only partially supplied) in private markets and therefore do not have a market value. Economists have developed the concept of Total Economic Value (TEV) to categorise the different ways in which individuals value goods and services which are not (fully) traded in markets based on use values and non-use values. Non-use values are economic values assigned by individuals to goods/ services unrelated to their current or future uses.
n For unique assets such as heritage, the non-use values can in fact outweigh use values.
n In the absence of assigned market values, businesses, governments and individuals are likely to underinvest in heritage, leading to suboptimal economic outcomes for society– particularly over the long term and between generations.
n It is difficult to capture non-use values using ‘orthodox’ economic methods. Different approaches are needed to capture the ‘Total Economic Value’ of heritage. There are two main methods used to capture the value of non-market goods and services:
Total economic value of heritage
Use values
Direct use value
(eg visiting heritage sites)
Indirect use value
(eg shops near a heritage site)
Non-use values
Option value
(eg option to visit a site in the future)
Existence value
(eg heritage and identity)
Bequest value
(eg future generations visits to
heritage sites)

HERITAGE AND THE ECONOMY 2019 51
Farmers Market, Market Place, Ely. Cambridgeshire.
– Revealed preference techniques involve inferring the price or value which individuals place on something by examining their actual behaviour.
– Stated preference techniques use questionnaires which describe a hypothetical choice in order to obtain estimates of the willingness to pay for a particular outcome.
Non-use values
Revealed preference: based on actual behaviour
Hedonic pricing techniques
(eg house prices and proximity to heritage asset)
Travel cost method
(eg price paid to access/ visit a heritage site)
Stated preference: based on survey questions – hypothetical
Contingent valuation
Wellbeing valuation
Choice modelling

HERITAGE AND THE ECONOMY 201952
There are a small number of valuation studies that have applied these techniques to the heritage sector in England. The evidence is presented in the table below. For more detailed analysis and international examples, see Eftec (2005), Valuation of the Historic Environment.
Table 1: Capturing the non-use values of heritage.
Reference Method Valuation outcome
Nesta and Simetrica (2018)
Contingent valuation of four museums (The Great North Museum, The National Railway Museum, the Ashmolean Museum and the World Museum), four historic cities and their respective cathedrals (Canterbury, York, Lincoln and Winchester). Cultural sites of the same type were chosen according to the similarities of their attributes (size, fees, reputation).
As the percentage mean transfer error of applying a benefit transfer technique was low, it is possible to argue that the economic value of the selected cultural sites of the same type is similar.
User/Non-user Type of Cultural Site
Valuation Scenario
Mean WTP (in £)
Mean Transfer error
User Museum
Entrance fee is established due to public funding cuts.
£6.42 9.5%
Non-user Museum
Annual donation due to public funding cuts.
£3.48 16.8%
User Historic City
One-off donation to avoid the closure of buildings currently open to the public
£9.63 3.2%
Non-user Historic City
One-off donation to avoid the closure of buildings, currently open to the public.
£6.14 12.5%
User Cathedral
One-off donation to avoid the closure of buildings, currently open to the public.
£7.42 10.8%
Non-user Cathedral
One-off donation to avoid the closure of buildings, currently open to the public
£3.75 10.7%
Highways England (2017)
Contingent valuation of the A303 Stonehenge road examining the val-ue that UK residents put on the removal of the A303 from its current lo-cation within the World Heritage Site (WHS), in relation to noise reduc-tion, increased tran-quillity, visual amenity and reduced landscape severance in the vicinity of Stonehenge.
User/ Non-user Valuation scenario
Mean (£ Net
Present Value)
Visitor use values Annual tax for removal of the A303 from its current location £68
Visitor non-use value (road user)
Annual tax for removal of the A303 from its current location £22
Non-use and option values (general population)
Annual tax for removal of the A303 from its current location £14

HERITAGE AND THE ECONOMY 2019 53
Create Streets (2017)
Hedonic Price model-ling using 160,000 data points in six British cities
Proximity to a listed building increased property prices by between 4.4% and 10.3%
Bakhshi et. Al. (2015)
Contingent valuation and wellbeing valuation performed on the Natu-ral History Museum and Tate Liverpool.
User/ Non-user Valuation scenarioNatural History
Museum
Tate Liverpool
Visitor use values Entrance fee (NHM) OR Donation (TL) £6.65 £10.83
visitor non-use value additional donation on top of an entry fee £2.78 £8.00
Non-use and option values
additional donation on top of an entry fee £8.29 £6.10
Fujiwara et. al. (2015)
Wellbeing valuation us-ing data from the British Household Panel Survey and the Understanding Society Surveys using
Activity Type of impact
Increase in likelihood
of reporting good
general health
Reduced likelihood of visiting GP 6+
times per yr/ using psychotherapy
Estimated annual
cost savings
(per person)
Estimated population
level annual NHS cost savings
Heritage GP Visits 2.76%
0.70% £2.59 £82.2M
Psycho-therapy 0.23% £3.50 £111.1M
Eftec (2014) Contingent Valuation examining visitors’ will-ingness to pay (WTP) to enter Castle Acre Priory and Walmer Castle and Gardens
User/ Non-user Valuation scenarioCastle Acre
Priory
Walmer Castle and
Gardens
Visitor (EH member) £ increase in membership fee per year 2.14 3.99
Visitor (non-EH member) £ increase per ticket 2.66 2.73
Non-user (non-EH member) £ increase in general taxes per year 1.83 1.77
Ahlfeldt et al. (2012)
Hedonic price modelling analysing 1,088,446 house sales between 1995 and 2010
Properties in conservation areas sell for 23 % more on average than other houses.
When location, property features and other factors affecting house prices are adjusted for, a premium of around 9% is found.
Jura (2005) Contingent Valuation of willingness to pay (WTP) for the continuation of Bolton’s museum, library and archive service
User/ Non-user Valuation scenarioMean
WTP (£per month)
Users support the continuation of the Bolton’s museum, library and archive service 7.93
Non-users support the continuation of the Bolton’s museum, library and archive service £2.82
Pollicino and Maddison (2004)
Contingent valuation willingness to pay (WTP) for maintenance actions for buildings in Oxford
User/ Non-user Valuation scenarioMean WTP (per year)
Local household WTP for preservation of buildings £30 - £34
Local household WTP for cleaning of buildings £20 - £27
Local household spend WTP for restoration of buildings £20 - £25

HERITAGE AND THE ECONOMY 201954
Pollicino and Maddison (2002)
Contingent valuation valuing aesthetic changes to Lincoln Cathedral due to air pollution.
User/ Non-user Valuation scenarioMean WTP (per hshld per year)
Local household WTP to increase exterior cleaning from 40 years to 10 years £50
County households WTP to increase exterior cleaning from 40 years to 10 years £27
Powe and Willis (1996)
Contingent valuationexamining visitors’ willingness to pay to enter Warkworth Castle.
User/ Non-user Valuation scenario Max WTP
Visitors (user) WTP for recreation and education £1.62
Visitors (user) WTP for preservation £1.41
On average visitors were willing to pay twice as much as the entry fee in order to enter the castle.
Garrod et al. (1996)
A contingent valuation study that sought the WTP towards the restoration of buildings in Grainger Town, Newcastle
Mean WTP per household per year of Newcastle residents in terms of a tax increase to pay towards the restoration of buildings in Grainger Town, was found to range between £10 and £14 (1995 £).Overall, aggregate WTP for restoration was estimated to be almost £1 million, after adjusting for differences in wealth across the aggregating population.
Willis (1994)
Stated Preference - Contingent valuation of access to Durham Cathedral
Revealed preference Visitor user Voluntary contributions £0.44
Stated preference - willingness to pay Visitor user Hypothetical compulsory
charge £0.78
n The Government’s official guidance on the appraisal of public investments, HM Treasury’s Green Book, includes guidance for accounting for non-market values. Significant progress has been made in developing these methods and valuing the benefits of non-market goods and services particularly within the environmental sphere. However much like Gross Domestic Product (GDP) as a metric of societal prosperity, the derived values from these methods are highly debated.
n What remains clear is that the role heritage plays in cultivating our sense of identity, sense of place, wellbeing, civic pride and so on, is complex, multifaceted and is currently not fully considered in vital decision making. This does not lead to efficient economic outcomes.
n The heritage sector is determined to continue to develop the valuation evidence base for heritage to ensure that heritage is accounted for in a robust and comprehensive way that addresses existing market failures facing our heritage and our future generations’ heritage.

HERITAGE AND THE ECONOMY 2019 55
References
Ahlfedt, G. and Holman, N. (2017) ‘Distinctively Different: A New
Approach to Valuing Architectural Amenities’, The Economic
Journal, 128 (608). Available at: https://onlinelibrary.wiley.com/doi/abs/10.1111/ecoj.12429 [Accessed September 2018]
Ahlfeldt, G. Holman, N. and Wendland, N. (2012) An Assessment
of the Effects of Conservation Areas on Value. [PDF] https://historicengland.org.uk/content/docs/research/assessment-ca-valuepdf/ [Accessed September 2018]
AMION and Locum Consulting (2010). Impact of Historic Environment
Regeneration. [PDF] https://historicengland.org.uk/content/heritage-counts/pub/impact-he-regeneration/ [Accessed June
2018] [Accessed September 2018]
Anarchitecture (2017). Derby PSiCA, The benefits of heritage-led
regeneration. [PDF] https://historicengland.org.uk/content/docs/local/derby-psica-legacy-report-pdf/ [Accessed September 2018]
Backmann, M. and Nilsson,P.(2018). The Role of Cultural Heritage in
Attracting Skilled individuals. Journal of Cultural Economics, 42 (1),
pp.111-138. Available at: https://link.springer.com/article/10.1007/s10824-016-9289-2 [Accessed September 2019]
“Bakshi, H. Fujiwara, D. Lawton, R. Mourato, S. and Dolan, P.
(2015). Measuring Economic Value in Cultural Institutions. [PDF]
https://ahrc.ukri.org/documents/project-reports-and-reviews/measuringeconomicvalue/ [Accessed September 2018]”
BBC(2018). Is this the secret to high street success? https://www.bbc.co.uk/news/business-45604235 [Accessed October 2019]
BDRC (2018). Visitor Attraction Trends in England, 2017. https://www.visitbritain.org/annual-survey-visits-visitor-attractions-latest-results [Accessed September 2018]
“BFI (2018). Film, high-end television and animation programmes
production in the UK: full-year 2017 [PDF] https://www.bfi.org.uk/sites/bfi.org.uk/files/downloads/bfi-film-high-end-television-and-animation-programmes-production-in-uk-full-year-2017.pdf [Accessed September 2018]”
Boys Smith, N. Venerandi, A. and Toms,.K. (2017) Beyond Location.
Create Streets. Summary available at: http://www.createstreets.com/projects/create-streets-latest-report-beyond-location-published/ [Accessed September 2018]
Building better, building beautiful commission (2019). Creating
space for beauty. [PDF] https://www.gov.uk/government/publications/creating-space-for-beauty-interim-report-of-the-building-better-building-beautiful-commission [Accessed October
2019]
Centre for Economics and Business Research (2019a). Skill gaps/
need in the heritage sector. [PDF] https://historicengland.org.uk/content/heritage-counts/pub/2013/skills-needs-analysis-2013-repair-maintenance-energy-efficiency-retrofit/ [Accessed
November 2019]
Centre for Economics and Business Research (2019b). The Heritage
Sector in England and its Impact on the Economy. [PDF] https://historicengland.org.uk/content/docs/research/heritage-sector-england-impact-on-economy/ [Accessed November 2019]
Cerisola(2019). A new perspective on the cultural heritage-
development nexus: the role of creativity. Journal of Cultural
Economics, 43 (1), pp. 21-56. Available at: https://ideas.repec.org/a/kap/jculte/v43y2019i1d10.1007_s10824-018-9328-2.html [Accessed September 2019]
CITB, English Heritage and Historic Scotland (2013). Skills Needs
Analysis 2013, Repair, Maintenance and Energy Efficiency Retrofit
of Traditional (Pre-1919) Buildings in England and Scotland. [PDF]
https://content.historicengland.org.uk/content/heritage-counts/pub/2013/skills-needs-analysis-2013-repair-maintenance-energy-efficiency-retrofit.pdf [Accessed September 2018]
Colliers International (2011). Encouraging Investment in Industrial
Heritage at Risk. [PDF] https://historicengland.org.uk/content/docs/research/encouraging-investment-in-industrial-heritage-at-risk-main-report/ [Accessed September 2018]
Colliers International (2018).Creative industries in historic buildings
and environments. [PDF] https://historicengland.org.uk/content/docs/research/creative-industries-summary-report/ [Accessed
October 2019]
Deloitte (2017). Heritage Works: A toolkit of best practice in heritage
regeneration. [PDF] https://historicengland.org.uk/images-books/publications/heritage-works/ [Accessed September 2018]
Department for Digital, Culture, Media and Sport (2016). The Culture
White Paper. [PDF] https://www.gov.uk/government/publications/culture-white-paper [Accessed September 2018]

HERITAGE AND THE ECONOMY 201956
Department for Digital, Culture, Media and Sport (2018). Taking Part
2017/18: quarter 4 statistical release. [URL] https://www.gov.uk/government/statistics/taking-part-201718-quarter-4-statistical-release [Accessed September 2018]
Ecorys (2017). Survey of Listed Building Owners. [PDF] https://historicengland.org.uk/content/docs/research/survey-listed-building-owners-2017-pdf/ [Accessed September 2018]
Eftec (2005). Valuation of the Historic Environment - The scope for
using results of valuation studies in the appraisal and assessment
of heritage-related projects and programmes. [URL] https://historicengland.org.uk/images-books/publications/valuation-historic-environment/valuation-historic-environment-final-rep/
[Accessed September 2018]
Eftec (2014). Economic Valuation of Heritage. [PDF] https://historicengland.org.uk/content/heritage-counts/pub/2014/economic-valuation-of-heritage-report-pdf/ [Accessed September
2018]
European Commission (2017). Special Eurobarometer 466 – Cultural
Heritage. [PDF] http://data.europa.eu/euodp/en/data/dataset/S2150_88_1_466_ENG [Accessed September 2018]
Florida, R (2003) Cities and the Creative Class. City and Community, 2(1).
Forth (2018) Britain’s low-wage sectors have big productivity
deficit, study shows https://www.sharecast.com/news/news-and-announcements--/britains-low-wage-sectors-have-big-productivity-deficit-study-shows--3227035.html
Fujiwara, D. Kudrna, L. Cornwall, T. Laffan, K. and Dolan P. (2015)
Further analysis to value the health and educational benefits of
sport and culture. [PDF] https://assets.publishing.service.gov.uk/government/uploads/system/uploads/attachment_data/file/446273/Health_and_educational_benefits_of_sport_and_culture.pdf [Accessed September 2018]
Garrod, G.D., Willis, K.G., Bjarnadottir, H. and Cockbain, P. (1996)
‘The Nonpriced Benefits of Renovating Historic Buildings – A Case
Study of Newcastle Grainger Town’, Cities 13(6), 423 430.
GLA, Economics (2010). Working Paper 42, ‘Valuing housing and
green spaces: Understanding local amenities, the built environment
and house prices in London’. [PDF] https://www.london.gov.uk/sites/default/files/gla_migrate_files_destination/GLAE-wp-42.pdf [Accessed September 2018]
Heritage Lottery Fund (2010) Investing in Success – Heritage and
the UK tourism economy. [PDF] https://www.heritagefund.org.uk/sites/default/files/media/about_us/hlf_tourism_impact_single.pdf [Accessed September 2018]
Heritage Lottery Fund (2013). New ideas need old buildings. [PDF]
https://www.hlf.org.uk/new-ideas-need-old-buildings [Accessed
September 2018]
Heritage Lottery Fund (2017). Ten Years On: The Impact of the
Heritage Grants Programme 2002-2007. [PDF] https://www.hlf.org.uk/ten-years-impact-heritage-grants-programme-2002-2007
[Accessed September 2018]
Highways England (2017). A303 Stonehenge, Amesbury to Berwick
Down, Technical Appraisal Report. [PDF] https://highwaysengland.citizenspace.com/cip/a303-stonehenge/supporting_documents/Volume%201%20%20TAR%20red%201.pdf [Accessed September 2018]
Historic England (2016). National Infrastructure Development
and Capacity 2015-33: An Assessment [PDF] https://research.historicengland.org.uk/Report.aspx?i=15848 [Accessed
September 2018]
Historic England (2019). Heritage at Risk, National Summary.
[PDF] https://historicengland.org.uk/content/docs/har/har-statistics-2019// [Accessed September 2019]
Houghton, A. (2018) ‘Film studio famous for Blade Runner and The
Italian Job reveals plans for iconic Littlewoods building’, Liverpool
Echo, 7 June. Available at: https://www.liverpoolecho.co.uk/news/business/famous-film-studio-littlewoods-building-14752395
[Accessed September 2018]
Ipsos Mori (2010). People and places: Public attitudes to beauty On
behalf of the Commission for Architecture and the Built Environment.
[PDF] https://www.designcouncil.org.uk/sites/default/files/asset/document/people-and-places.pdf [Accessed September 2018]
Institute of Place Management (2018). https://www.placemanagement.org/special-interest-groups/welcome-to-the-bid-foundation/bid-news/great-recognition-for-new-member/
[Accessed October 2019]
Jura Consultants (2005). Bolton’s Museum, Library and Archive Services,
An Economic Valuation. [PDF] http://webarchive.nationalarchives.gov.uk/20120215214224/http:/research.mla.gov.uk/evidence/documents/bolton_main.pdf [Accessed September 2018]
Lambert Smith Hampton (2018). Sites, Camera, Action – The UK Film
and TV Studio Property Market [PDF] https://static1.squarespace.com/static/5a868eff6f4ca36401a4ec62/t/5ba8f46de79c705ac3ad4a9e/1537799284155/Sites+Camera+Action+Report.pdf [Accessed September 2018]
Landward Research (2017). Archaeological Market Survey 2016-17.
[PDF] https://www.archaeologists.net/sites/default/files/Archaeological%20Market%20Survey%202016-17%20101117.pdf [Accessed September 2018]
https://www.sharecast.com/news/news-and-announcements--/britains-low-wage-sectors-have-big-productiv
https://www.sharecast.com/news/news-and-announcements--/britains-low-wage-sectors-have-big-productiv

HERITAGE AND THE ECONOMY 2019 57
Licciardi, G. Amirtahmasebi, R. (eds), 2012. The Economics
of Uniqueness. Washington: The World Bank. [PDF] http://siteresources.worldbank.org/EXTSDNET/Resources/Economics_of_Uniqueness.pdf [Accessed September 2018]
Lichfields (2018). Risky Business, Investing in Heritage at Risk. [PDF]
[Accessed September 2018]
Local Government News (2018).From ghost town to go to town,
https://www.localgov.co.uk/From-ghost-town-to-go-to-town/45320 [Accessed November 2019]
Manchester Evening News (2018). From ghost town to boom
town-how Altrincham became the place to be https://www.manchestereveningnews.co.uk/news/greater-manchester-news/altrincham-trafford-boom-town-market-14299990 [Accessed
October 2019]
Mc Kinsey (2018) Solving the UK productivity pzzle in the digital age
https://www.mckinsey.com/~/media/mckinsey/featured%20insights/meeting%20societys%20expectations/solving%20the%20united%20kingdoms%20productivity%20puzzle%20in%20a%20digital%20age/mgi-productivity-in-the-uk-discussion-paper-september-2018.ashx [Accessed October 2019]
Ministry for Housing, Communities and Local Government (2018).
‘Table P124: district planning authorities – planning applications
decided, granted, performance agreements and speed of decisions,
by type of development, England’. [URL] https://www.gov.uk/government/statistical-data-sets/live-tables-on-planning-application-statistics [Accessed September 2018]
Moore (2018). High street retail isn’t dying-it just needs to evolve,
Management today, https://www.managementtoday.co.uk/high-street-retail-isnt-dying-just-needs-evolve/future-business/article/1466425 (accessed October 2019)
National Lottery Heritage Fund (2009). Assessment of the social
impact of participation in HLF-funded projects https://www.heritagefund.org.uk/sites/default/files/media/research/social_impact_volunteering_2009.pdf [Accessed October 2019]
National Lottery Heritage Fund (2011). Assessment of the social
impact of volunteering in HLF-funded projects: Yr 3 https://www.heritagefund.org.uk/sites/default/files/media/research/social_impact_volunteering_2011.pdf [Accessed October 2019]
Nesta and Simetrica (2018). Valuing culture and heritage: Results
from research on museums, historic cities and cathedrals. https://www.nesta.org.uk/report/economic-value-heritage/ [Accessed
October 2019]
OCSI (2017). Socio-economic Trends and Growth in Conservation
Areas. [PDF] [Accessed September 2018]
Olsberg SPI (2015) Quantifying Film and Television Tourism in
England. [PDF] https://applications.creativeengland.co.uk/assets/public/resource/140.pdf [Accessed September 2018]
ONS (2018). International comparisons of UK productivity
(ICP), final estimates:2016. https://www.ons.gov.uk/economy/economicoutputandproductivity/productivitymeasures/bulletins/internationalcomparisonsofproductivityfinalestimates/2016 [Accessed October 2019]
Oxford Economics (2016) The Imact of the Heritage Sector. [PDF]
https://www.oxfordeconomics.com/my-oxford/projects/347523
[Accessed September 2018]
Pollicino, M. and Maddison, D. (2004), ‘Using Contingent Valuation
to Value Maintenance Options for Oxford’s Historic Buildings’,
unpublished paper, Institute of Archaeology, University College
London and Institute of Economics, University of Southern
Denmark.
Pollicino, M. and Maddison, D. (2002) ‘Valuing the impacts of air
pollution on Lincoln Cathedral,’ in Navrud, S. and Ready, R. (eds)
(2002) Valuing Cultural Heritage: Applying Environmental Valuation
Techniques to Historic Buildings, Monuments and Artefacts. Edward
Elgar Publising, Cheltenham, UK.
Powe, N. and Willis, K. (1996) “Benefits Received by Visitors to
Heritage Sites: A Case Study of Warkworth Castle”, Leisure Studies
15, 259-275.
Ramidus Consulting (2018) Creative industries in historic buildings
and environments https://historicengland.org.uk/content/docs/research/agile-working-historic-buildings/[Accessed October
2019]
TBR (2016). The role of culture, sport and heritage in place shaping.
[PDF] https://www.gov.uk/government/publications/the-role-of-culture-sport-and-heritage-in-place-shaping [Accessed
September 2018]
Tenreyro, S. (2018). The fall in productivity growth: causes and
implications https://www.bankofengland.co.uk/-/media/boe/files/speech/2018/the-fall-in-productivity-growth-causes-and-implications [Accessed October 2019]
TNS (2015). Valuing Activities. [PDF] https://www.visitbritain.org/sites/default/files/vb-corporate/Documents-Library/documents/England-documents/valuing_activities_-_final_report_fv_7th_october_2015_0.pdf [Accessed September 2018]
UCL (2015) Skill gaps, shortages and needs in the heritage
science sector https://www.ucl.ac.uk/heritage-science-impact/Documents/SKILLS_GAPS_-_FINAL.pdf [Accessed October 2019]
https://www.mckinsey.com/~/media/mckinsey/featured%20insights/meeting%20societys%20expectations/solv
https://www.mckinsey.com/~/media/mckinsey/featured%20insights/meeting%20societys%20expectations/solv
https://www.mckinsey.com/~/media/mckinsey/featured%20insights/meeting%20societys%20expectations/solv
https://www.mckinsey.com/~/media/mckinsey/featured%20insights/meeting%20societys%20expectations/solv
https://www.mckinsey.com/~/media/mckinsey/featured%20insights/meeting%20societys%20expectations/solv
https://www.managementtoday.co.uk/high-street-retail-isnt-dying-just-needs-evolve/future-business/ar
https://www.managementtoday.co.uk/high-street-retail-isnt-dying-just-needs-evolve/future-business/ar

HERITAGE AND THE ECONOMY 201958
UNESCO (2016) Wider Value of UNESCO to the UK 2014-2015. [PDF]
https://www.unesco.org.uk/publication/wider-value-of-unesco-to-the-uk-2014-2015/ [Accessed September 2018]
Valuation Office Agency (2017). Council Tax: Stock of Properties
2017, Table CTSOP4.0. [URL] https://www.gov.uk/government/statistics/council-tax-stock-of-properties-2017 [Accessed
September 2018]
VisitBritain (2016). VisitBritain Annual Review 2015/16. [PDF]
Available at: https://www.visitbritain.org/visitbritainvisitengland-reports-year-record-growth-tourism [Accessed September 2018]
VisitBritain (2019). 2019 Annual survey of visits to visitor attractions.
Latest results [URL] https://www.visitbritain.org/annual-survey-visits-visitor-attractions-latest-results [Accessed October 2019]
VisitBritain (2019). 2019 Inbound Tourism Forecast. [URL] https://www.visitbritain.org/2019-inbound-tourism-forecast [Accessed
October 2019]
VisitEngland (2016). Annual Survey of Visits to Visitor Attractions.
[PDF] https://www.visitbritain.org/annual-survey-visits-visitor-attractions-latest-results [Accessed September 2018]
Willis, K.G. (1994) ‘Paying for Heritage: What Price for Durham
Cathedral?’ Journal of Environmental Planning and Management,
Vol. 37, No. 3.
YouGov (2018). Quality of Places Survey Results. [PDF] https://historicengland.org.uk/content/docs/research/quality-of-places-pdf/ [Accessed September 2018]
Zoopla (2015). ‘Cost of culture: homes near heritage sites worth
on average £80k more’. [Online] https://www.zoopla.co.uk/press/releases/cost-of-culture-homes-near-heritage-sites-worth-on-average-k-more/ [Accessed September 2018]

59HERITAGE AND THE ECONOMY 2019

This document has been prepared as part of Heritage Counts 2019 by Historic England on behalf of the Historic Environment Forum.
November 2019 – Project Code: HE0017
Contact: Brenda Dorpalen, Senior Economist, Policy and Evidence: Analytics Department, Historic England ([email protected])
Front cover: © Historic England Archive. Conservation area, 23-51 New Brigatte, Leeds, West Yorkshire
All images © Historic England unless otherwise stated