
Hepatitis C in England 2019 - assets.publishing.service.gov.uk · Hepatitis C in England: 2019...
68
Hepatitis C in England 2019 Working to eliminate hepatitis C as a major public health threat
Transcript of Hepatitis C in England 2019 - assets.publishing.service.gov.uk · Hepatitis C in England: 2019...

Hepatitis C in England 2019
Working to eliminate hepatitis C as a major public health threat
Hepatitis C in England: 2019 report
2
About Public Health England
Public Health England exists to protect and improve the nation’s health and wellbeing, and
reduce health inequalities. We do this through world-leading science, knowledge
and intelligence, advocacy, partnerships and the delivery of specialist public health
services. We are an executive agency of the Department of Health and Social Care, and a
distinct delivery organisation with operational autonomy. We provide government, local
government, the NHS, Parliament, industry and the public with evidence-based
professional, scientific and delivery expertise and support.
Public Health England
Wellington House
133-155 Waterloo Road
London SE1 8UG
Tel: 020 7654 8000
www.gov.uk/phe
Twitter: @PHE_uk Facebook: www.facebook.com/PublicHealthEngland
Prepared by: Helen Harris, Annastella Costella, Ross Harris and Sema Mandal.
© Crown copyright 2019
You may re-use this information (excluding logos) free of charge in any format or medium,
under the terms of the Open Government Licence v3.0. To view this licence, visit
OGL. Where we have identified any third party copyright information you will need to obtain
permission from the copyright holders concerned.
Published April 2019
PHE publications PHE supports the UN
gateway number: GW-309 Sustainable Development Goals
Hepatitis C in England: 2019 report
3
Foreword
In England, around 113,000 people are chronically infected with hepatitis C (HCV), most of
whom in the present day are drawn from marginalised and underserved groups in society.
Over the last year, Public Health England (PHE) have updated the modelled estimates of
chronic prevalence(1) and numbers diagnosed in England, and new information on the
uptake and outcome of treatment is coming through from the Hepatitis C Patient Registry
and Treatment Outcome System.(2) In addition, the first HCV ribonucleic acid testing data
are now available from the unlinked anonymous monitoring survey of people who inject
drugs, and dry blood spot testing data originating from private laboratories is being
incorporated into laboratory reporting.
PHE are working with stakeholders to distribute resources to help people recognise the risk
factors for HCV infection and to encourage those at risk to seek testing. This includes a
campaign that has now distributed more than 6,900 posters to General Practitioner (GP)
surgeries throughout England, along with videos and banners in different languages for use
via social media. The RCGP e-learning courses for primary care, and for other professionals
working with people at risk of HCV, were updated in 2018(1),(2) - more than 4,600 people
have completed these to date. PHE have also provided data to support the NHS in
identifying people who have been diagnosed with HCV in the past but who may not have
accessed care or cleared their infections, so they can be offered testing and treatment.
An important milestone is that the World Health Organization (WHO) target to reduce HCV-
related mortality by 10% by 2020 has already been exceeded in England - 3 years ahead of
time. However, if we are to keep pace with the planned treatment rates and meet our future
elimination targets, there remains an urgent need to ramp up case finding initiatives and
promote programmes for those who are diagnosed but untreated to engage with local
services. With focused and integrated monitoring, we hope to sustain work with
stakeholders to identify barriers and drive forward improvements across the system to
eliminate HCV as a major public health threat.
In this report, we summarise the current data, the impact of action plans in England to drive
down mortality from HCV and to reduce the number of new infections, and outline the
actions required to make further progress. The findings of this report indicate progress but
also impediments - although a lot has been achieved, there is still much to do. If we are to
eliminate HCV as a major public health threat by 2030, it is essential that we continue to
work in synergy with stakeholders across the whole public health system, and by combining
our efforts we should augment our impact.

Hepatitis C in England: 2019 report
4
Dr Mary Ramsay Head of Immunisation and Countermeasures Service National Infection Service
Professor Geoff Dusheiko Interim Deputy Director for Blood Safety, Hepatitis, Sexually Transmitted Infections and HIV Service National Infection Service

Hepatitis C in England: 2019 report
5
Contents
About Public Health England 2
Foreword 3
Glossary of abbreviations 6
Acknowledgements 7
Executive summary 8
Public health recommendations 12
Introduction 15
Vision and monitoring metrics 16
New monitoring metrics 16
Burden of HCV infection 18
Monitoring impact 20
Reducing HCV-related morbidity and mortality 20 Reducing the number of new (incident) infections 22
Monitoring the coverage of key services 27
Adequate harm reduction 27 Raising awareness and increasing the numbers and proportion diagnosed 30
Increasing the numbers accessing hepatitis C treatment 48
Data sources 58
Appendices 59
References 62
Hepatitis C in England: 2019 report
6
Glossary of abbreviations
BBV Bloodborne virus
DAA Direct-acting antiviral
DBS Dried blood spot
ESLD End-stage liver disease
GHSS Global Health Sector Strategy
HCC Hepatocellular carcinoma
HCV Hepatitis C virus
HJIP Health and Justice Indicators of Performance
HMPPS Her Majesty’s Prison and Probation Service
IPED Image and performance enhancing drugs
NDTMS National Drug Treatment Monitoring System
NSP Needle and syringe programme
ODN Operational Delivery Networks
OST Opioid substitution treatment
PHE Public Health England
PWID People who inject drugs
RNA Ribonucleic acid
SVR Sustained Virological Response
UAM Unlinked Anonymous Monitoring
VCT Voluntary Confidential Testing
WHO World Health Organization

Hepatitis C in England: 2019 report
7
Acknowledgements
Contributors
Maciej Czachorowski, Claire Edmundson, Ellen Heinsbroek, Georgina Ireland, Claire
Reynolds, Reisha Simmonds, Ruth Simmons, and Robert Wolstenholme.
Our thanks also go to Koye Balogun, Ginny Belson, Geoff Dusheiko, Graham Foster, Mike
Gent, Rachel Halford, William Irving, Stephanie Migchelsen, Mary Ramsay, Rhiannon
Taylor, and Ceri Townley for their contributions to the report.
We would also like to thank the clinicians, microbiologists, public health practitioners and
other colleagues who have contributed to the surveillance systems used in this report. In
particular, the drug service staff who support, and participants in, the Unlinked Anonymous
Monitoring (UAM) survey of people who inject drugs; NHS Blood and Transplant; Hospital
Episode Statistics (Copyright © 2019, re-used with the permission of NHS Digital, all rights
reserved); NHS England and Arden & Greater East Midlands Commissioning Support Unit;
and the Office for National Statistics (ONS carried out the original collection and collation of
the data but bears no responsibility for their future analysis or interpretation).
In addition, we would like to acknowledge and thank the staff who work in the laboratories
who contribute to the laboratory surveillance of hepatitis C, the Sentinel Surveillance of
Blood Borne Virus Testing and Alere Toxicology.
Suggested citation
Harris HE, Costella A, Harris R, Mandal S and contributors. Hepatitis C in England, 2019
report: Working to eliminate hepatitis C as a major public health threat. April, 2019. Public
Health England, London.

Hepatitis C in England: 2019 report
8
Executive summary
In May 2016, the UK signed up to the WHO Global Health Sector Strategy (GHSS) on Viral
Hepatitis(3) which commits participating countries to the elimination of HCV as a major public
health threat by 2030. The current report summarises the scale of the HCV problem in 2017
in England, to help support focused action to meet our commitment to reduce the incidence
of chronic HCV infection by 80% and HCV mortality by 65% by 2030 at the latest.
In 2015, there were an estimated 71 million people with chronic HCV infection worldwide.(4)
Most recent estimates suggest that around 113,000 people in England
are living with chronic HCV infection.(1) Injecting drug use continues to be the most
important risk factor for HCV infection, being cited as the risk in around 90% of all laboratory
reports where risk factors have been disclosed.(5) In 2017, 52% of people who had injected
psychoactive drugs, participating in the Unlinked Anonymous Monitoring (UAM) survey of
people who inject drugs (PWID), tested positive for antibodies to HCV (anti-HCV) and 49%
of these people had evidence of current infection. In this survey, the proportion testing
positive for anti-HCV has remained relatively stable over the past decade, although there is
some evidence of an increase since 2011.(5)
If we are to eliminate HCV as a major public health threat, there are 2 key areas where we
need to make progress: we have to reduce the numbers becoming seriously ill or dying from
this infection, whilst at the same time reduce the number of people becoming newly or re-
infected with the virus. In England, our vision is that all people at risk of HCV infection
should have easy access to testing and, once tested, that action should be taken to either
reduce their risk of infection or to prevent further transmission of the virus, and – if viraemic
– place the patient on a treatment pathway.
With a 16% fall in deaths between 2015 and 2017 in England, the WHO target to reduce
HCV-related mortality by 10% by 2020 will have been exceeded 3 years early. This
suggests that increased treatment (a 127% increase in 2017/18 compared to pre-2015
levels) provision together with new direct-acting antiviral (DAA) drugs, particularly in those
with more advanced disease, is having an impact. Falling numbers of liver transplant
registrations (53% fall by 2017, when compared to pre-2015 levels) and liver transplants
undertaken (39% fall by 2017, when compared to pre-2015 levels) in those where post-HCV
cirrhosis and hepatocellular carcinoma (HCC) is given as the indication for transplant, are
also observed. As treatment volumes rise further, the WHO GHSS target for a reduction in
HCV-related mortality of 65% by 2030(3) looks achievable in England. Despite this, only
around 1 half (56% in 2017) of people who had injected psychoactive drugs sampled in the
UAM survey(5) were aware of their current HCV infection. This figure is supported by
modelled estimates that suggest at least 53% of the ever chronically infected population had
been diagnosed or successfully treated by 2018. While the first WHO target of 50% being
diagnosed by 2020 has been met in England, more needs to be done if we are to reach the
Hepatitis C in England: 2019 report
9
90% target by 2030. The lower bound modelled estimate of only 30% of current untreated
chronic infection having been diagnosed, may be an early indication that testing and
diagnosis is not keeping pace with planned treatment targets.
Throughout England, a variety of initiatives are ongoing to increase both professional and
public awareness of HCV to help find patients who are undiagnosed or untreated. The
success of these initiatives is dependent on the significant contribution of numerous
stakeholders working across a range of settings. PHE have provided data to support the
National Health Service (NHS) in identifying people who have been diagnosed with HCV in
the past but who may not have cleared their infections, so they can be offered testing and
treatment where necessary. The Hepatitis C Trust continue their work raising awareness of
HCV infection among key risk groups, including the South Asian population, and by
developing and implementing patient-centred HCV interventions and providing a confidential
helpline. PHE have worked with stakeholders to develop free resources to help people
recognise any risk for HCV infection and to encourage those at risk to seek testing. This has
included a campaign that has distributed more than 6,900 posters to GP surgeries
throughout England, along with videos and banners for use via social media. Royal College
of General Practitioner (RCGP) e-learning courses for primary care, and other professionals
working with people at risk of HCV, were updated in 2018(6),(7) with more than 4,600 people
having completed these to date.
Between 1996 and 2017, there was a more than eightfold increase in the number of
laboratory confirmed reports of HCV in England, with 17,186 reports of individuals testing
positive for anti-HCV and/or HCV ribonucleic acid (RNA) in 2017. In sentinel surveillance,
an 21% increase in testing has been observed, and a 6% increase in testing via GP
surgeries, between 2013 and 2017.
When looking at the main risk groups, both UAM (84% in 2017) and National Drug
Treatment Monitoring System (NDTMS) data (84% in 2017/18) suggest that more than 4-
fifths of people who have ever injected drugs report, or were recorded as having received,
an HCV test respectively. Since dried blood spot (DBS) testing can increase uptake of
testing amongst PWID, it is encouraging that data from sentinel surveillance suggest that
DBS testing now far outweighs testing of venous blood in the drug service setting.
Opt-out bloodborne virus (BBV) testing is now fully implemented across the prison estate,
and among new receptions to English prisons, levels of testing have risen from 5% in
2010/11 to 19% in 2017/18. In the 2017/18 financial year, Health and Justice Indicators of
Performance (HJIP) testing data suggest that, after excluding previously confirmed cases,
75% of new receptions and transfers were offered HCV testing, 26% were tested, 11% of
those tested were found anti-HCV positive but less than half (46%) went on to have HCV
RNA testing. About 40% of those testing positive for HCV RNA received specialist referrals
for their HCV infection. Overall, these data suggest an increasing awareness of HCV in
prisons with significant increases in testing, including DBS testing. Whilst testing volumes

Hepatitis C in England: 2019 report
10
remain sub-optimal, work is ongoing to move from the implementation of BBV testing to
improving the quality of the offer and uptake of testing within prisons.
Testing has been seen to rise in other groups at increased risk of infection. Between 2013
and 2017, testing rose by 17% in the South Asian population, and among people who
identified as being of Eastern European origin testing increased by 76%. When looking at
screening data from low risk populations, NHS Blood and Transplant (NHS BT) testing data
suggest that rates of HCV infection in new and repeat donors remained low (<18/100,000
donations) in 2017. However, the rate of HCV detected in new donors of ‘other white
backgrounds’ was higher at 95/100,000 donors, or about ten times higher than in white-
British donors.
In response to increased levels of HCV infection found in patients with human
immunodeficiency virus (HIV), the British HIV Association announced ambitious targets for
the micro elimination of HCV in patients with HIV, with the aim of curing HCV in 80% of
those co-infected by April 2019, in 90% by April 2020, and 100% by April 2021.(8)
Importantly however, data from the UAM survey suggest that incidence of HCV infection
has not declined significantly in recent years (20/100 person years in 2017, compared to
8/100 in 2011), although there is substantial uncertainty in the estimates and significant
variability between years. In the same survey, transmission among recent initiates to
psychoactive drug use has remained relatively stable, with prevalence of infection in 2017
(23%) being similar to that observed in 2011 (20%). Both laboratory reports and sentinel
surveillance show significant falls in the proportion of young adults testing positive over the
2013-2017 period (in laboratory reports: 2% average decline per year in 15-19 year olds
and an 7% average decline per year in 20-24 year olds; in sentinel surveillance: 15%
average decline per year in first tests in 15-19 year olds and a 7% average decline per year
in 20-24 year olds). However, this may not necessarily correspond to a fall in infections in
young adults as testing patterns may have changed over time.
The proportion of PWID reporting adequate needle and syringe provision remains
suboptimal with 60% of those surveyed who had injected psychoactive drugs reporting
adequate provision for their needs in 2017. Although levels of sharing of needles and
syringes has declined from 24% in 2007 to 18% in 2017, there is no evidence of any decline
over the last 5 years. Together these findings suggest that the WHO GHSS call to reduce
new cases of chronic HCV by 30% by 2020 and 80% by 2030,(1) represents a significant
challenge for health services in England.
Data are now available from the NHS England national HCV Patient Registry and Treatment
Outcome System. As at 31 December 2018, the registry contained records for 30,870
people with at least 1 treatment episode. Treated patients were predominantly white (81%),
with 10% classified as Asian/Asian British. Information on injecting status showed that 22%
were currently injecting/had recently injected drugs and most of those treated reported
Hepatitis C in England: 2019 report
11
acquiring their infection via injecting drug use (73%). Most patients were referred from
primary care (43%), but only 20% came from drug services (13%) and prisons (7%). Data
on disease stage showed that 29% of patients had cirrhosis prior to treatment, 35% had no
evidence of fibrosis and 26% had mild fibrosis. Patients with severe disease were initially
prioritised for treatment, so all Operational Delivery Networks (ODNs) are now treating a
significant proportion of people with mild disease. The majority of patients (84%) were
treated in secondary care, with 8% receiving treatment in drugs services and 7% in prisons.
Amongst those for whom it was possible to determine the outcome of treatment (n=
21,904), 95% achieved a sustained viral response (SVR) 12 weeks after completing
treatment.
Given the numbers treated so far, and assuming the planned scale-up of treatment can be
achieved and a correspondingly high treatment rate continues, statistical modelling(3)
predicts that around 10,400 people will be living with HCV-related cirrhosis or HCC in
England by 2020 and around 5,200 by 2030, representing a fall in HCV-related
cirrhosis/HCC of 30% by 2020 and 65% by 2030 compared with a 2015 baseline.
Overall, with the increasing availability of DAA drugs, the WHO GHSS goals to reduce HCV-
related morbidity and mortality should be within our reach, provided current improvements in
numbers accessing treatment can be sustained in future years. Our ability to sustain the
current increase in numbers accessing treatment will ultimately be limited by our ability to
find and treat those who remain undiagnosed, and to help those who are diagnosed but
untreated to engage with local treatment services; only then will we be able to continue to
see a reduction in avoidable HCV-related deaths. At the other end of the spectrum, there is
currently little evidence of any fall in the number of new HCV infections; if GHSS goals to
reduce these levels are to be reached, then a radical change in our approach to HCV
among PWID is required.
We are interested in receiving your feedback on this report and would be grateful if you
could take 2 minutes to complete this short survey.
Thank you.

Hepatitis C in England: 2019 report
12
Public health recommendations
Making improvements and monitoring metrics
The National Strategic Group for Viral Hepatitis (NSGVH) to consider determining what
‘elimination as a major public health threat’ means for England and whether England
specific milestones should be defined.
PHE to further develop national indicators and tools at both national and local levels, to
help monitor progress towards the WHO GHSS goal to eliminate HCV as a serious
public health threat by 2030 at the latest.(3)
Public health professionals working in local authorities and Clinical Commissioning
Groups (CCG) to consider including HCV in Joint Strategic Needs Assessments and
subsequent health and wellbeing strategies.
Adequate harm reduction/prevention
Commissioners of services for people who inject drugs need to sustain or expand, as
appropriate, the current broad range of provision (including opioid substitution treatment
(OST), needle and syringe programmes (NSP), and patient information) to reduce
transmission of HCV, including among people who inject new psychoactive substances
or image and performance-enhancing drugs (IPED); National Institute for Health and
Care Excellence (NICE) guidance is available on NSP(9) and OST.(10)
PHE to consider how NSPs and their activity might be mapped and monitored.
Health and Justice Leads to help ensure that harm minimisation policies in secure and
detained settings are maintained, including the provision of disinfectant/decontamination
equipment for sharps.
Commissioners of services for people who inject drugs to specify the legal requirement
to report HCV positive laboratory results with patient identifiers to PHE, including those
from DBS testing.
Increasing the numbers and proportion diagnosed
All stakeholders to help improve awareness among professionals, for example by
encouraging participation in e-learning.(7),(6)

Hepatitis C in England: 2019 report
13
All stakeholders to improve the offer and uptake of HCV testing to those at risk of HCV
infection by implementing NICE guidelines.(11)
All stakeholders to continue to produce and disseminate appropriate communications,
including resources, national reporting and infographics, to help mark World Hepatitis
Day (28 July).
BBV prevention services should ensure that testing is sustained or enhanced, as
appropriate,(12) among those attending drug, and other, services; the use of newer
approaches to testing, including use of capillary blood sampling and point of care
testing, that may facilitate testing in non-clinical settings or alleviate delays in onset of
treatment, should be further explored throughout England.
Health and Justice to ensure that bloodborne virus opt-out testing for new receptions to
prisons in England continues to be monitored to inform strategies to improve the offer
and uptake of testing.
Commissioners and providers of drug services to consider implementing bloodborne
virus opt-out testing.
Commissioners and providers of laboratory services to ensure, wherever possible, that
RNA amplification tests are performed on the same sample as the original antibody
assay (reflex testing) to decrease the turnaround time for referral, benefit patient care
and increase cost effectiveness.(13)
Diagnostic laboratories should include patient referral instructions on the laboratory
report, and implement direct reporting of new diagnoses to their ODN, as well as to the
individual requesting the test.
Increasing the numbers accessing hepatitis C treatment
Commissioners of HCV treatment and care services should continue to work with public
health agencies, primary and secondary care clinicians, and other stakeholders to
simplify referral pathways; improve the availability, access and uptake of approved HCV
treatments in primary and secondary care, drug treatment services, prisons and other
settings; and to drive innovative approaches to outreach and patient support under the
supervision of operational delivery networks.
PHE to evaluate the impact of the national re-engagement exercise (the controlled
release of PHE held laboratory data on previously diagnosed patients to support case-
finding and treatment within the NHS).

Hepatitis C in England: 2019 report
14
Treatment and BBV prevention services should ensure that appropriate information and
support are provided to help guard against re-infection among those achieving a SVR
following treatment.
The Department of Health to consider funding a national media campaign to encourage
those with past risk factors but silent disease to come forward for testing, and to
evaluate the impact of the campaign.

Hepatitis C in England: 2019 report
15
Introduction
HCV is a bloodborne virus that is often asymptomatic, and symptoms may not appear
until the liver is severely damaged. Therefore, many individuals with chronic HCV
infection remain undiagnosed and fail to access treatment. These individuals can then
present only later with complications of HCV-related end-stage liver disease (ESLD)
and primary liver cancer, which have poor survival rates.
Globally, viral hepatitis caused 1.34 million deaths in 2015, a number comparable to
deaths caused by tuberculosis and higher than those caused by HIV.(4) However, the
number of deaths due to viral hepatitis is increasing over time, while mortality caused by
tuberculosis and HIV is declining.(4) In 2015, there were an estimated 71 million people
with chronic HCV infection worldwide.(4)
The revolution in HCV treatment through the development of direct-acting antiviral
(DAA) drugs has generated international interest in the global elimination of HCV as a
major public health threat, with the WHO setting elimination targets for 2030.(3),(14) For
HCV, the global vision is that by implementing the GHSS for viral hepatitis, preventative
efforts leading to fewer infections and deaths, as well as treatment efforts resulting in
longer survival, together have the potential to prevent 2.1 million HCV-associated
deaths worldwide by 2030.(13)
In May 2016, the UK signed up to the WHO GHSS on Viral Hepatitis,(3) committing to
meet targets of an 80% reduction in incidence of HCV infection and a 65% reduction in
mortality from HCV by 2030 (see appendix 1).
If we are to tackle HCV infection in England, it is critical that we continue to work with
our partners to improve prevention, raise awareness, increase testing and get more
diagnosed individuals into treatment and care, whilst ensuring that access to HCV
services is equitable. This England report summarises the scale of the HCV problem in
2017, and presents metrics that allow us to monitor our progress (see appendix 2) and
identify where focused action is needed if we are to honour our commitment to eliminate
HCV as a major public health threat by 2030.

Hepatitis C in England: 2019 report
16
Vision and monitoring metrics
HCV is a curable infection, and it is our aspiration to support the WHO in their goal to
eliminate HCV as a major public health threat by 2030 at the latest. This can be
achieved via the collective action of all partner organisations involved in the prevention,
diagnosis, treatment and care of those living with, or at risk of acquiring, HCV infection.
The focus of our vision is captured in the following vision statement:
‘All people at risk of HCV virus infection should have access to testing and, once tested,
action should be taken to either reduce their risk of infection or prevent further
transmission of the virus, and – if infected – place the patient on a treatment pathway’.
To track our progress, it is important to monitor the impact of interventions in the
following 2 key impact areas:
reducing transmission, and hence the number of new (incident) HCV infections
reducing morbidity and mortality due to HCV and its complications
To support this, it is also important to monitor the coverage of services that are critical in
driving down the levels of HCV infection and HCV-related mortality in England, namely
the:
adequacy of harm reduction
numbers and proportion of infected people who are diagnosed
numbers, and ultimately the proportion, of acute and chronically infected people
accessing treatment
The preliminary indicators (see appendix 2), reported in the sections that follow and
summarised in the headline data table,(5) describe our progress and set out the scale of
the challenge ahead so that meaningful goals can be developed and progress towards
achieving them can be monitored.
New monitoring metrics
A number of new indicators are available this year, including: national modelled
estimates of chronic prevalence(1) and numbers diagnosed; sentinel surveillance testing
data presented for drug and prison services, including the contribution of DBS testing;
HCV RNA testing data for 2016 and 2017 from the UAM survey of people who inject
drugs; the first batch of DBS testing data from private laboratories incorporated into
laboratory reporting; and an HCV cascade of care for the English prison estate. In

Hepatitis C in England: 2019 report
17
addition, metrics are available on the uptake and outcome of treatment from the NHS
England Hepatitis C Patient Registry and Treatment Outcome System.(2)
As in previous years, where indicators are missing or in development, placeholders
have been included (see appendix 2). With focused monitoring, we hope to continue to
work with stakeholders to identify barriers and drive forward improvements across the
system to help eliminate HCV as a major public health threat by 2030 at the latest.
Hepatitis C in England: 2019 report
18
Burden of HCV infection
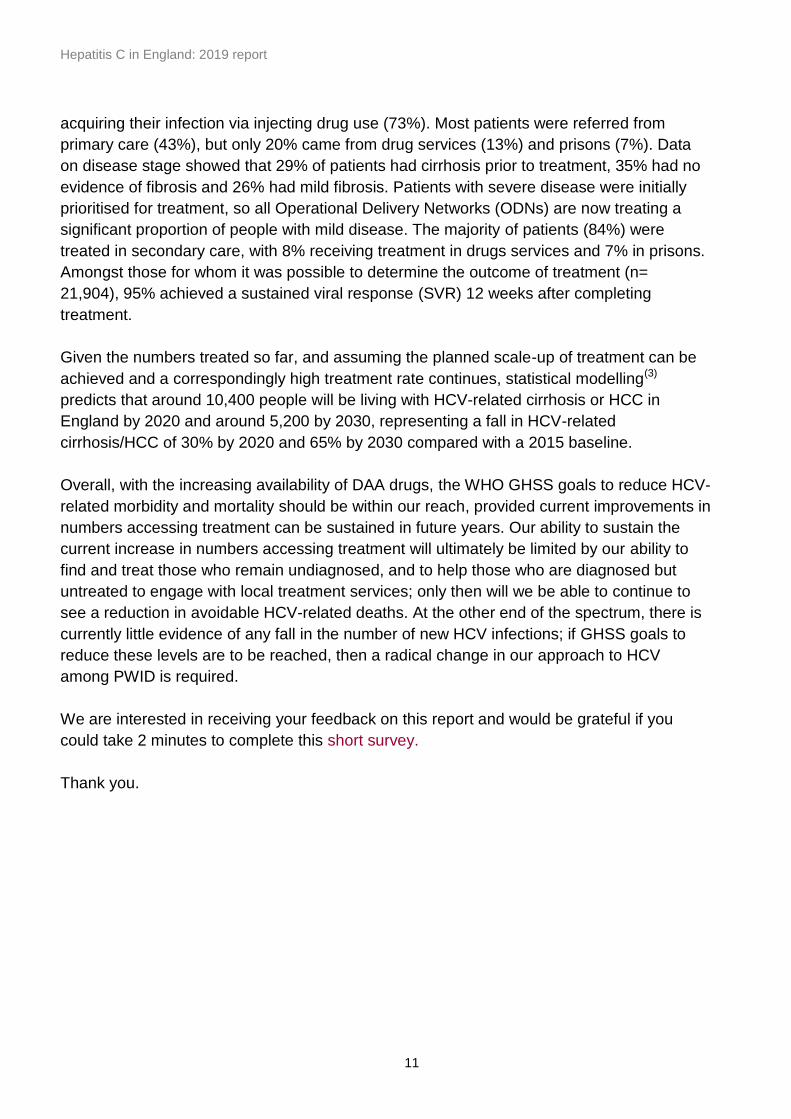
Latest modelled estimates suggest that around 143,000 people (95% credible interval
123,000-161,000) in England were living with chronic HCV infection in 2015.(1)
Prevalence is estimated to have fallen in recent years, and was predicted to decline to
113,000 in 2018 (95% credible interval: 95,000, 132,000) with the advent of new
treatments (Figure 1)(1) The modelling approach is under development and makes use
of multiple sources of routine surveillance data to track progress over time, in contrast to
the previous ‘snapshot’ estimate for 2005.(15) Nevertheless, the 2 models are broadly
consistent.
Figure 1: Estimated chronic prevalence of HCV in England, 2009-2018.(1)
Sentinel Surveillance of Bloodborne Virus Testing suggests that, in 2017, the majority of
infections were either genotype 1 (46.0%) or genotype 3 (44.2%).(16) Injecting drug use
continues to be the most important risk factor for HCV infection, being cited as the risk
in 92.1% of all laboratory reports where risk factors have been disclosed.(5)
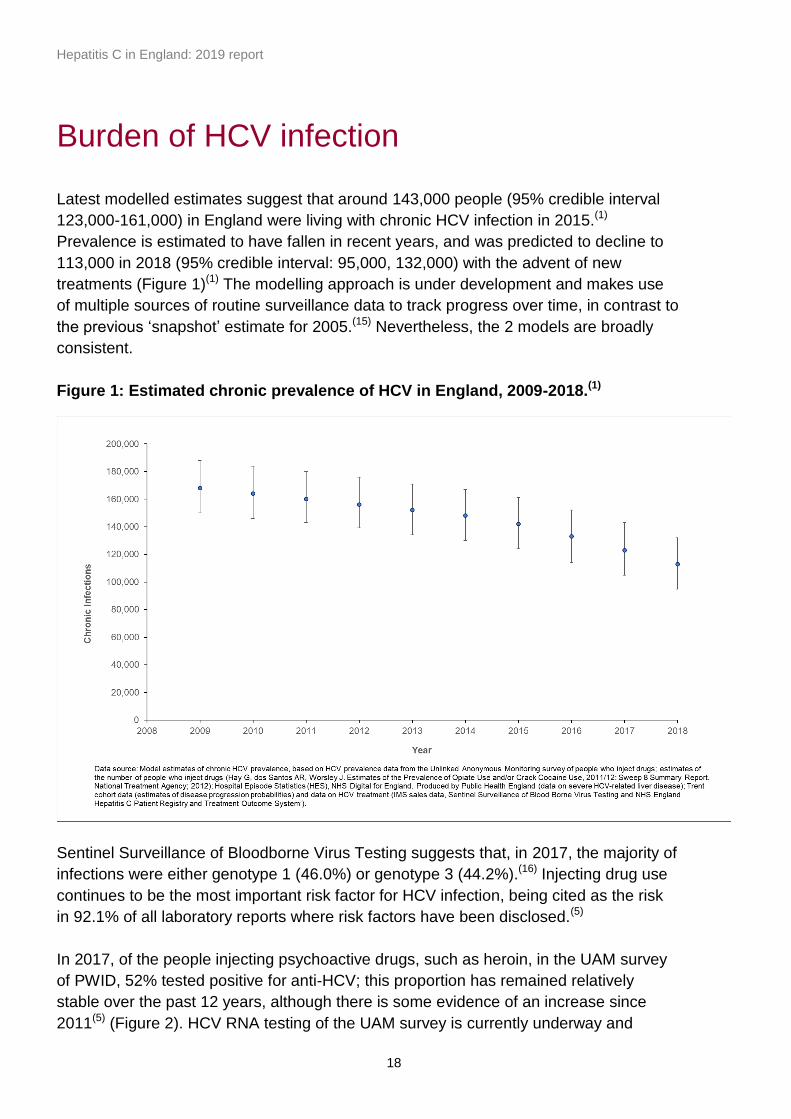
In 2017, of the people injecting psychoactive drugs, such as heroin, in the UAM survey
of PWID, 52% tested positive for anti-HCV; this proportion has remained relatively
stable over the past 12 years, although there is some evidence of an increase since
2011(5) (Figure 2). HCV RNA testing of the UAM survey is currently underway and
Hepatitis C in England: 2019 report
19
results are available for 2016 and 2017 (Figure 2). In 2017, 49.9% of those testing
positive for HCV antibodies had evidence of current infection, lower than observed in
2016 (56%). As further HCV RNA testing results become available for other years,
trends in current infection will be presented.
Figure 2: Trend in HCV prevalence among people injecting psychoactive drugs in
England: 2007 to 2017
Anti-HCV prevalence among people injecting psychoactive drugs and participating in
the UAM survey in 2017 varied across England, being higher in London (68%), the
North West (60%), and the South East (60%), with much lower prevalence seen in the
West Midlands (35%) and the North East (37%).(18)
In England and Wales, levels of infection are also elevated among survey participants
who inject image or performance enhancing drugs (IPED), such as anabolic steroids,
5.1% of whom tested positive for antibodies to HCV during 2014-15.(19) Updated
prevalence data from the 2016-18 IPED survey will be available in the coming months
and published in the HCV in England 2020 report.
Prevalence of infection is not only concentrated in areas with high levels of current and
past injecting drug use, but also in areas where there are high numbers of black and
minority ethnic populations who have close links to countries with a high prevalence of
HCV infection.(20) HCV disproportionately affects populations who are marginalised and
under-served with poorer access to healthcare and poorer health outcomes.

Hepatitis C in England: 2019 report
20
Monitoring impact
If we are to eliminate HCV as a major public health threat, there are 2 key impact areas
where we need to make progress: we need to reduce the numbers becoming seriously
ill or dying from this infection, whilst at the same time reducing the number of people
who become newly or re-infected. Everything we do should have an impact in these 2
areas.
Reducing HCV-related morbidity and mortality
In England, mortality from HCV-related liver disease increased up until 2014, as people
who acquired their infections decades earlier progressed to advanced liver disease and
access to previous treatments had been inadequate.(21) Since the new DAA
drugs(22),(23),(24),(25),(26),(27),(28, 29),(30) have been available, along with ODNs to deliver them,
a fall in the number of HCV-related liver transplants and deaths has been observed.(21)
As these treatments continue to be rolled-out, it is important to monitor trends in severe
HCV-related morbidity and mortality to ensure that treatment is having an impact and
that WHO elimination goals (see appendix 1) are being met.
Metrics to monitor trends in HCV related morbidity and mortality:
registrations for liver transplant and transplants undertaken, where post-HCV
cirrhosis is given as the indication for transplant
death registrations for HCV-related ESLD/HCC
Registrations and liver transplants undertaken, where post-HCV cirrhosis
is given as the indication for transplant
A marker of HCV-related morbidity is the number of English residents with post-HCV
cirrhosis (recorded as either the primary, secondary or tertiary indication for transplant)
registering at NHS BT for a liver transplant. Between 2008 and 2014, registrations have
remained relatively stable averaging 134 per year (Range: 120-152;(5) Figure 3), with
highest numbers of registrations occurring in London (21% between 2008-2017).
However, over the last 3 years, registrations have fallen dramatically by over 50%
(53.0%) compared to earlier years, to a ten-year low of 63 in 2017(5) (Figure 3).
Likewise, liver transplants undertaken for this indication, have remained relatively stable
between 2008 and 2014, averaging 108 transplants per year (Range 93-123). Yet, over
the last 3 years, numbers of transplants exceeded registrations, with the former
decreasing by nearly 40% (38.9%) compared to earlier years.(5) Of all liver transplants
performed in England, the percentage carried out in patients with HCV-related disease
decreased from 20.8% in 2008 to 8.3% in 2017 (15.6% overall throughout the period).(5)
Hepatitis C in England: 2019 report
21
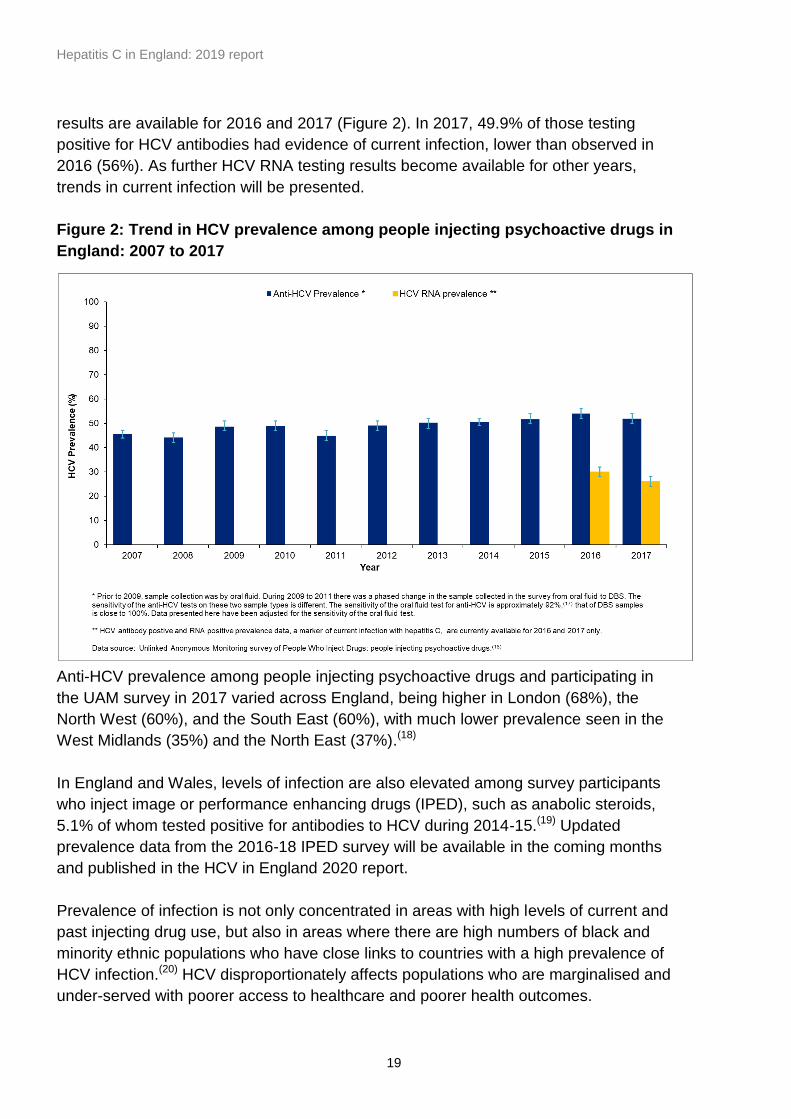
This suggests that new treatments are having an impact with the annual number of
livers transplanted for this indication being down by 42 in 2017 compared to earlier
(2008-2014) years. Whilst the fall in numbers does not seem to be the result of
increased removals from the list because of improved condition (personal
communication), it is possible that fewer patients are listed for transplantation, perhaps
following a potential positive influence on severe disease progression resulting in
patients failing to meet the threshold for registration. However, it is not possible to rule
out a degree of deferring listing pending delayed assessment of the impact of treatment
on clinical condition. It will therefore take longer to assess whether this is the start of an
established trend rather than simply an adjustment phenomenon, however, the early
signs are encouraging.
Figure 3. Number of first patient registrations in England where post-HCV
cirrhosis was given as either the primary, secondary or tertiary indication for
transplant and the number of liver transplants undertaken in patients who were
HCV positive (RNA or antibody) at transplant: 2008 to 2017*

Hepatitis C in England: 2019 report
22
Deaths from HCV-related ESLD/HCC
Between 2005 and 2014, death registrations for HCV-related ESLD and HCC in
England more than doubled, rising from 182 in 2005 to 381 in 2014[4] (Figure 4). Since
2014, however, deaths have been falling, with a fall of 16.3% between 2014 and 2017.
With a fall in deaths of 16.1% by 2017, from a 2015 baseline, the WHO target to reduce
HCV-related mortality by 10% by 2020 (see appendix 1) will have been exceeded 3
years early in England. The fall in registered deaths is likely to be the result of increased
access to DAA drugs that were introduced from 2014/15 (Figure 26), particularly for
those individuals with more advanced disease.(31)
Figure 4. Death registrations for ESLD* or HCC in those with HCV mentioned on their death certificate in England: 2005 to 2017**
Reducing the number of new (incident) infections
Monitoring the impact of prevention measures on the incidence of infection remains a
challenge as incident infection is difficult to measure directly. Ideally, we would monitor
the actual or estimated number of new HCV infections that arise annually in PWID as
well as any that result from net migration, and monitor this over time. However, the
former is difficult to estimate because much of the acute infection is asymptomatic and
undiagnosed and there is considerable uncertainty around the number of PWID in
England.(32-35) Added to this, it is also difficult to select a sentinel population of PWID for
monitoring that is representative of PWID as a whole. As a result, a number of methods
Hepatitis C in England: 2019 report
23
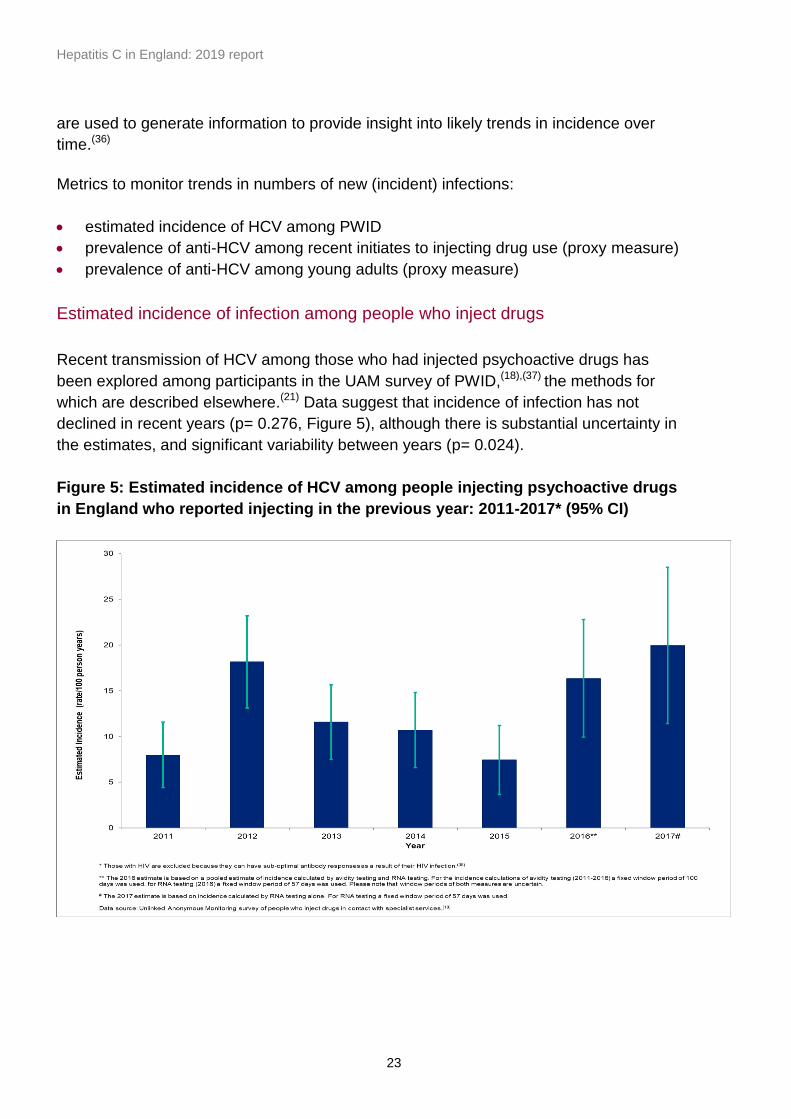
are used to generate information to provide insight into likely trends in incidence over
time.(36)
Metrics to monitor trends in numbers of new (incident) infections:
estimated incidence of HCV among PWID
prevalence of anti-HCV among recent initiates to injecting drug use (proxy measure)
prevalence of anti-HCV among young adults (proxy measure)
Estimated incidence of infection among people who inject drugs
Recent transmission of HCV among those who had injected psychoactive drugs has
been explored among participants in the UAM survey of PWID,(18),(37) the methods for
which are described elsewhere.(21) Data suggest that incidence of infection has not
declined in recent years (p= 0.276, Figure 5), although there is substantial uncertainty in
the estimates, and significant variability between years (p= 0.024).
Figure 5: Estimated incidence of HCV among people injecting psychoactive drugs
in England who reported injecting in the previous year: 2011-2017* (95% CI)
Hepatitis C in England: 2019 report
24
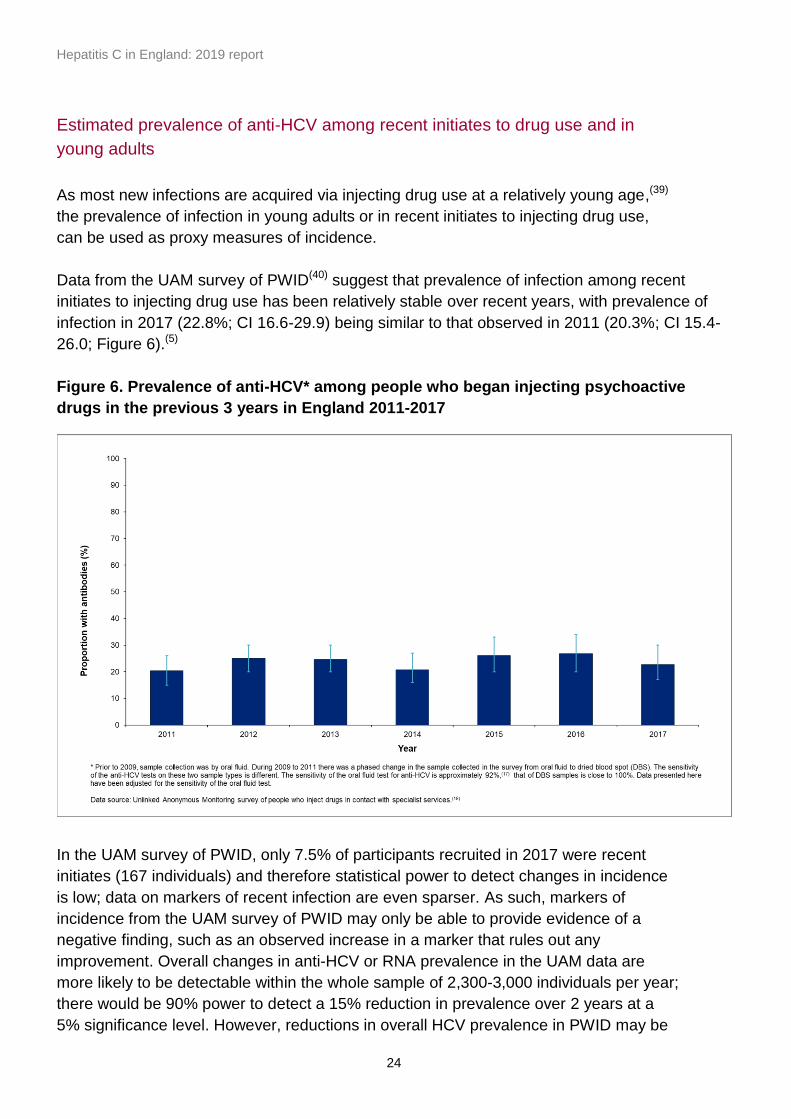
Estimated prevalence of anti-HCV among recent initiates to drug use and in
young adults
As most new infections are acquired via injecting drug use at a relatively young age,(39)
the prevalence of infection in young adults or in recent initiates to injecting drug use,
can be used as proxy measures of incidence.
Data from the UAM survey of PWID(40) suggest that prevalence of infection among recent
initiates to injecting drug use has been relatively stable over recent years, with prevalence of
infection in 2017 (22.8%; CI 16.6-29.9) being similar to that observed in 2011 (20.3%; CI 15.4-
26.0; Figure 6).(5)
Figure 6. Prevalence of anti-HCV* among people who began injecting psychoactive
drugs in the previous 3 years in England 2011-2017
In the UAM survey of PWID, only 7.5% of participants recruited in 2017 were recent
initiates (167 individuals) and therefore statistical power to detect changes in incidence
is low; data on markers of recent infection are even sparser. As such, markers of
incidence from the UAM survey of PWID may only be able to provide evidence of a
negative finding, such as an observed increase in a marker that rules out any
improvement. Overall changes in anti-HCV or RNA prevalence in the UAM data are
more likely to be detectable within the whole sample of 2,300-3,000 individuals per year;
there would be 90% power to detect a 15% reduction in prevalence over 2 years at a
5% significance level. However, reductions in overall HCV prevalence in PWID may be
Hepatitis C in England: 2019 report
25
more related to the number achieving viral clearance following treatment than any
impact on incidence of harm reduction.
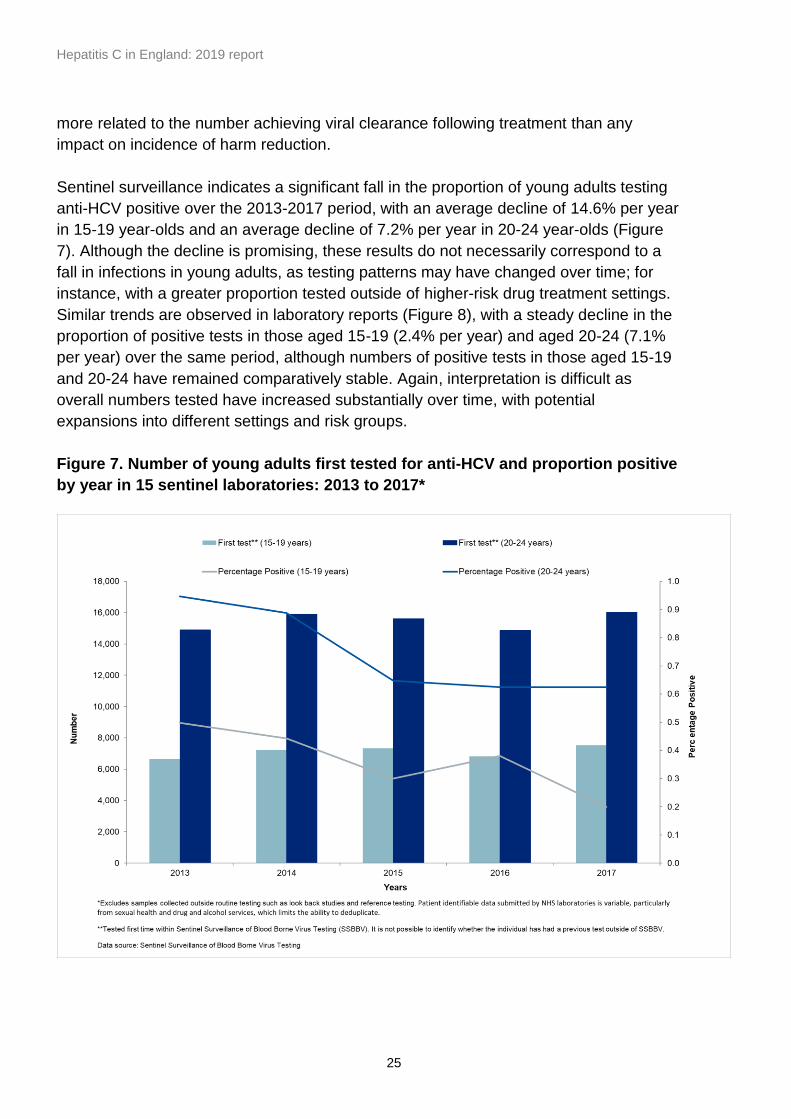
Sentinel surveillance indicates a significant fall in the proportion of young adults testing
anti-HCV positive over the 2013-2017 period, with an average decline of 14.6% per year
in 15-19 year-olds and an average decline of 7.2% per year in 20-24 year-olds (Figure
7). Although the decline is promising, these results do not necessarily correspond to a
fall in infections in young adults, as testing patterns may have changed over time; for
instance, with a greater proportion tested outside of higher-risk drug treatment settings.
Similar trends are observed in laboratory reports (Figure 8), with a steady decline in the
proportion of positive tests in those aged 15-19 (2.4% per year) and aged 20-24 (7.1%
per year) over the same period, although numbers of positive tests in those aged 15-19
and 20-24 have remained comparatively stable. Again, interpretation is difficult as
overall numbers tested have increased substantially over time, with potential
expansions into different settings and risk groups.
Figure 7. Number of young adults first tested for anti-HCV and proportion positive
by year in 15 sentinel laboratories: 2013 to 2017*

Hepatitis C in England: 2019 report
26
Figure 8. Laboratory reports of HCV in young adults in England: 2006-2017*/**
Overall, estimates and proxy indicators of HCV incidence provide no convincing
evidence that the targets to reduce new cases of chronic HCV by 30% by 2020, and
80% by 2030(3) (see appendix 1), will be met. If these goals are to be achieved, a
radical change in the response to HCV among PWID is required.
Hepatitis C in England: 2019 report
27
Monitoring the coverage of key services
Eliminating HCV as a major public health threat by driving down HCV-related mortality
and preventing new infections from occurring/re-occurring is feasible with the tools and
approaches currently available in England. Investment in 3 core intervention areas is
needed: (i) ensuring adequate harm reduction for PWID, (ii) increasing the proportion of
viraemic individuals who are diagnosed, and (iii) increasing the proportion of viraemic
individuals who access and complete treatment, achieving a SVR.
Adequate harm reduction
Harm reduction interventions for PWID, including access to sterile injecting equipment
via NSP and effective drug dependence treatment, can prevent and control HCV among
PWID.(42),(43),(44),(45),(46),(47),(48) Specifically, OST is associated with a reduction in the risk
of HCV acquisition, which is strengthened in studies that assess the combination of
OST and NSP.(48) Therefore, optimal access to clean injecting equipment and OST is
key in curbing the spread of HCV, particularly given that it also has the potential to
prevent re-infection after treatment.
Metrics to monitor trends in the adequacy of harm reduction:
estimated adequacy of NSP coverage among PWID
sharing of injecting equipment by PWID
proportion of opioid dependent PWID receiving OST
NSP coverage
Studies in Europe suggest high NSP coverage to be associated with a reduction in the
risk of HCV acquisition,(48) and that NSP is a highly effective, low-cost, intervention that
can be cost saving in certain settings.(49)
The GHSS on viral hepatitis(3) and the draft action plan for the health sector response to
viral hepatitis in the WHO European region(14) call for a comprehensive package of harm
reduction services to be in place for all PWID, including a major global increase in
provision of sterile needles and syringes, from an estimated baseline of 20 needles and
syringes per PWID per year to 200 by 2020 and 300 by 2030(3) (see appendix 1).
However, these inevitably somewhat arbitrary figures, do not make any allowance for
individual differences in need. In order to better reflect the adequacy of needle and
syringe provision, data from the UAM survey of PWID(40) are presented here on self-
reported adequacy of needle and syringe provision(5) (Figure 9). In this metric, needle
and syringe provision is considered ‘adequate’ when the reported number of needles
received, met or exceeded the number of times the individual injected.
Hepatitis C in England: 2019 report
28
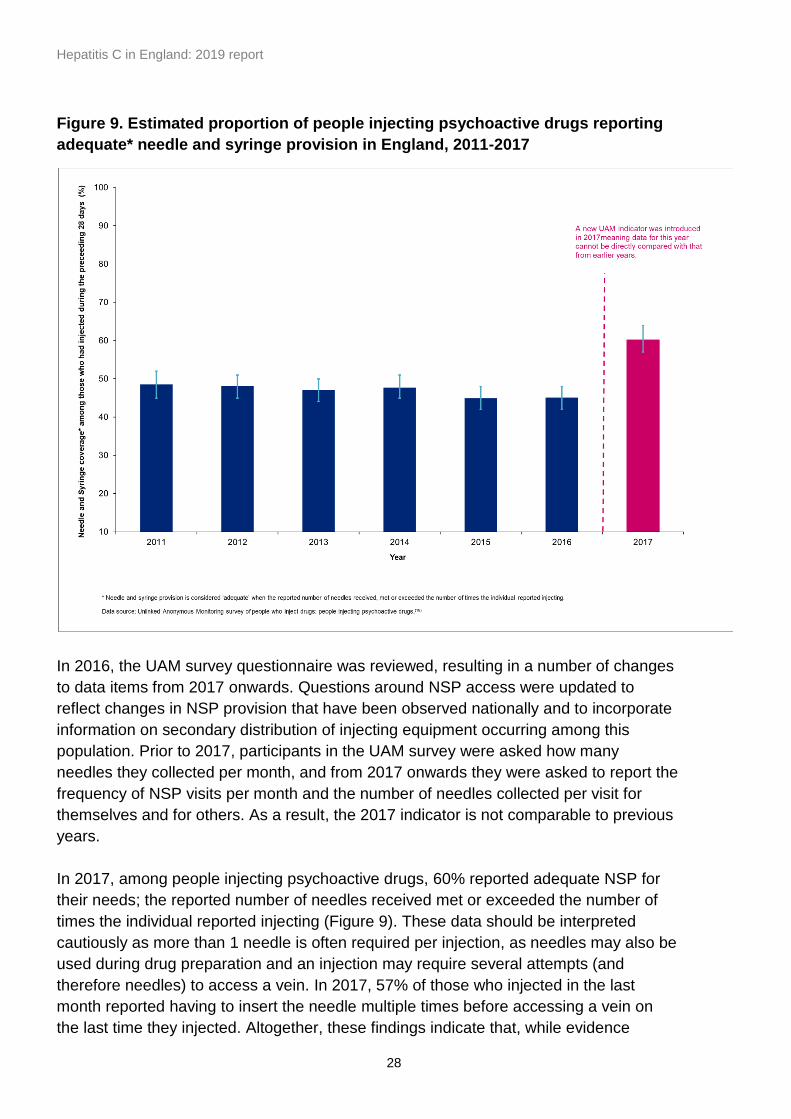
Figure 9. Estimated proportion of people injecting psychoactive drugs reporting
adequate* needle and syringe provision in England, 2011-2017
In 2016, the UAM survey questionnaire was reviewed, resulting in a number of changes
to data items from 2017 onwards. Questions around NSP access were updated to
reflect changes in NSP provision that have been observed nationally and to incorporate
information on secondary distribution of injecting equipment occurring among this
population. Prior to 2017, participants in the UAM survey were asked how many
needles they collected per month, and from 2017 onwards they were asked to report the
frequency of NSP visits per month and the number of needles collected per visit for
themselves and for others. As a result, the 2017 indicator is not comparable to previous
years.
In 2017, among people injecting psychoactive drugs, 60% reported adequate NSP for
their needs; the reported number of needles received met or exceeded the number of
times the individual reported injecting (Figure 9). These data should be interpreted
cautiously as more than 1 needle is often required per injection, as needles may also be
used during drug preparation and an injection may require several attempts (and
therefore needles) to access a vein. In 2017, 57% of those who injected in the last
month reported having to insert the needle multiple times before accessing a vein on
the last time they injected. Altogether, these findings indicate that, while evidence
Hepatitis C in England: 2019 report
29
suggests that the majority of PWID may be accessing NSP,(36),(50) the amount of
equipment provided needs to be increased, provision better targeted, and awareness of
transmission risks needs to be raised among PWID.
Sharing of injecting equipment and associated paraphernalia by PWID
As sharing of injecting equipment and associated paraphernalia is the main route of
transmission of infection among PWID, it is important to monitor levels of sharing within
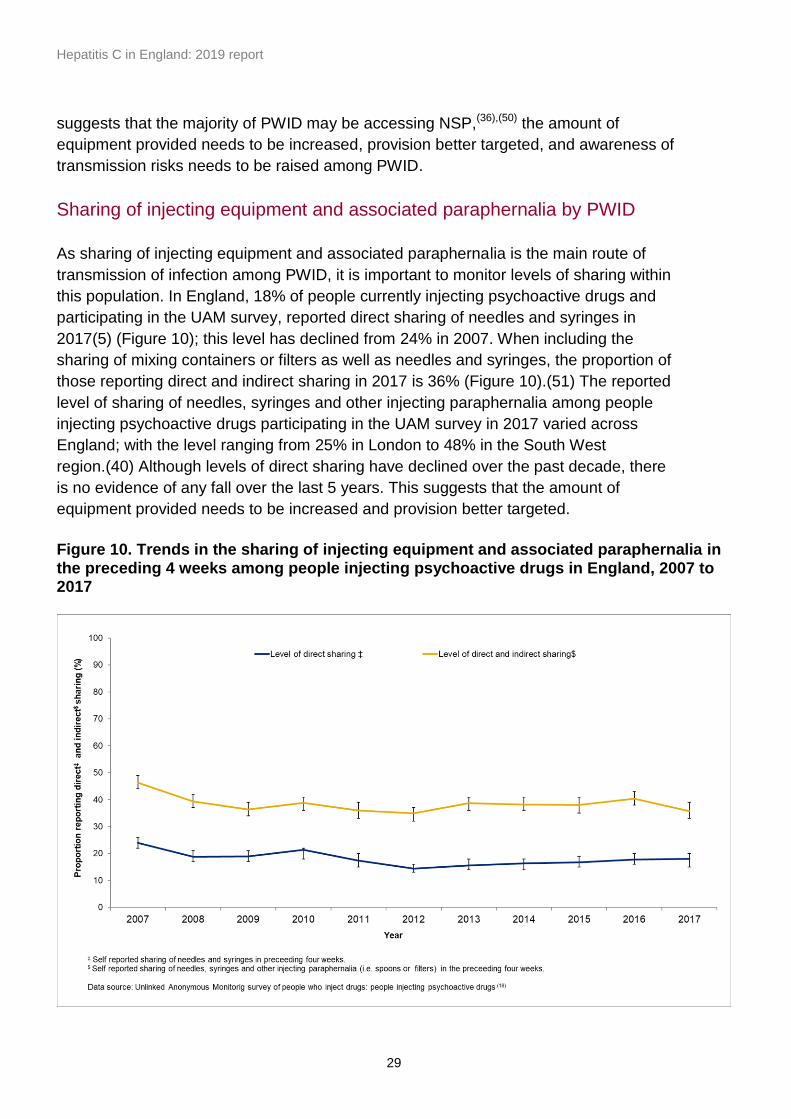
this population. In England, 18% of people currently injecting psychoactive drugs and
participating in the UAM survey, reported direct sharing of needles and syringes in
2017(5) (Figure 10); this level has declined from 24% in 2007. When including the
sharing of mixing containers or filters as well as needles and syringes, the proportion of
those reporting direct and indirect sharing in 2017 is 36% (Figure 10).(51) The reported
level of sharing of needles, syringes and other injecting paraphernalia among people
injecting psychoactive drugs participating in the UAM survey in 2017 varied across
England; with the level ranging from 25% in London to 48% in the South West
region.(40) Although levels of direct sharing have declined over the past decade, there
is no evidence of any fall over the last 5 years. This suggests that the amount of
equipment provided needs to be increased and provision better targeted.
Figure 10. Trends in the sharing of injecting equipment and associated paraphernalia in the preceding 4 weeks among people injecting psychoactive drugs in England, 2007 to 2017
Hepatitis C in England: 2019 report
30
Among those IPED in England and Wales, 13% reported that they had ever shared a
needle, syringe or vial in 2014-2015.(40)
Drug treatment
The draft action plan for the health sector response to viral hepatitis in the WHO
European region(14) calls for at least 40% of opioid dependent PWID to be receiving
OST by 2020, a figure already estimated to have been exceeded in England with 55.5%
receiving OST in 2011/12.(5) Their call for at least 90% of PWID to be receiving targeted
HCV information, education and communications(14) has yet to be quantified in England,
although there are a variety of targeted information and education communications
available (see section on raising awareness, pages 34-35).
Raising awareness and increasing the numbers and proportion diagnosed
Early diagnosis of HCV infection is important for the most effective treatment and care
and prevention of progression to more advanced liver disease, yet in 2015, of the 71
million persons estimated to be living with HCV infection globally, only 20% knew their
diagnosis.(4) In the UK, levels of awareness of infection are well above the 20% global
average, but are still suboptimal with positive results not always linking individuals into
treatment and care services.(52)
Metrics to monitor trends in awareness, numbers and proportions diagnosed:
proportion of PWID testing positive for HCV who are aware of their positive status
lower bound estimates of the proportion of chronic HCV infection diagnosed
numbers of GPs, and others working with groups at risk of HCV infection,
completing RCGP HCV e-learning courses
trend in numbers tested and proportion positive in the general population and
primary care
trend in numbers tested and proportion positive in key risk groups including PWID,
those in secure and detained settings, and individuals of South Asian and Eastern
European origin
offer and uptake of HCV testing among PWID
uptake of HCV testing in English prisons
HCV testing cascade in the English prison estate
rates of infection in the blood donor population, along with risk factors for acquisition
of infection
Hepatitis C in England: 2019 report
31
Estimated proportion diagnosed or aware of their HCV status
An estimate of the proportion of PWID diagnosed can be obtained from the UAM
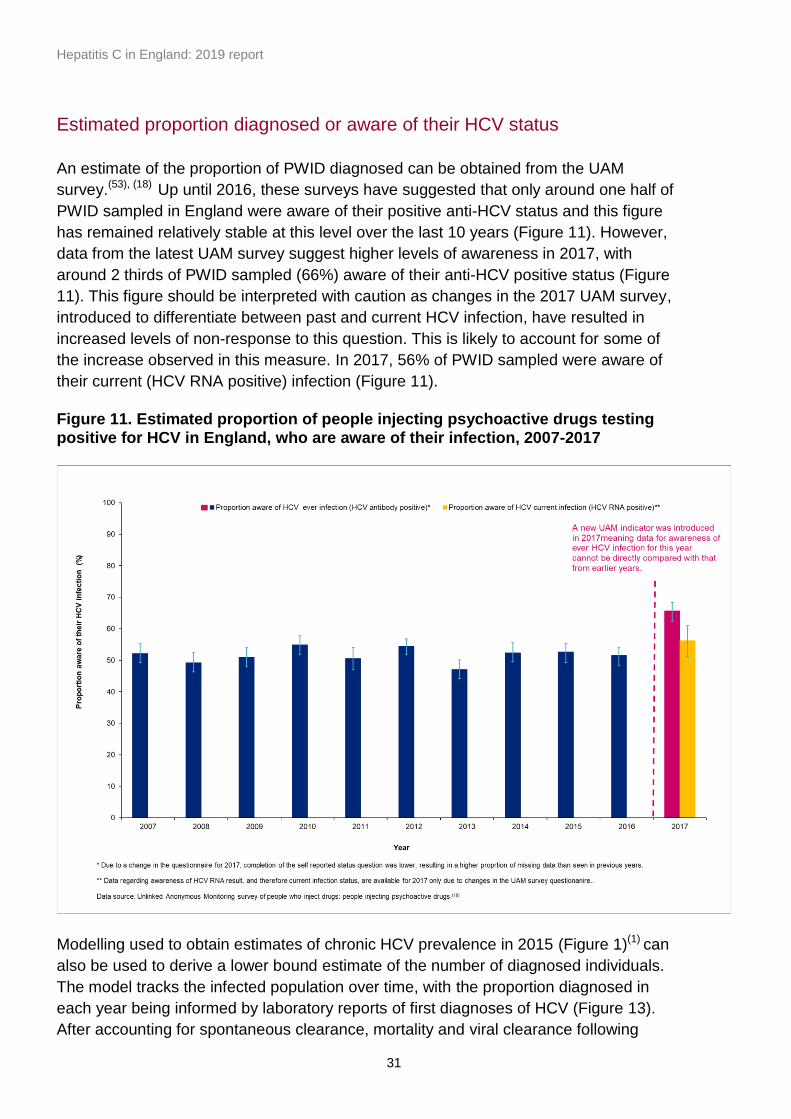
survey.(53), (18) Up until 2016, these surveys have suggested that only around one half of
PWID sampled in England were aware of their positive anti-HCV status and this figure
has remained relatively stable at this level over the last 10 years (Figure 11). However,
data from the latest UAM survey suggest higher levels of awareness in 2017, with
around 2 thirds of PWID sampled (66%) aware of their anti-HCV positive status (Figure
11). This figure should be interpreted with caution as changes in the 2017 UAM survey,
introduced to differentiate between past and current HCV infection, have resulted in
increased levels of non-response to this question. This is likely to account for some of
the increase observed in this measure. In 2017, 56% of PWID sampled were aware of
their current (HCV RNA positive) infection (Figure 11).
Figure 11. Estimated proportion of people injecting psychoactive drugs testing positive for HCV in England, who are aware of their infection, 2007-2017
Modelling used to obtain estimates of chronic HCV prevalence in 2015 (Figure 1)(1) can
also be used to derive a lower bound estimate of the number of diagnosed individuals.
The model tracks the infected population over time, with the proportion diagnosed in
each year being informed by laboratory reports of first diagnoses of HCV (Figure 13).
After accounting for spontaneous clearance, mortality and viral clearance following
Hepatitis C in England: 2019 report
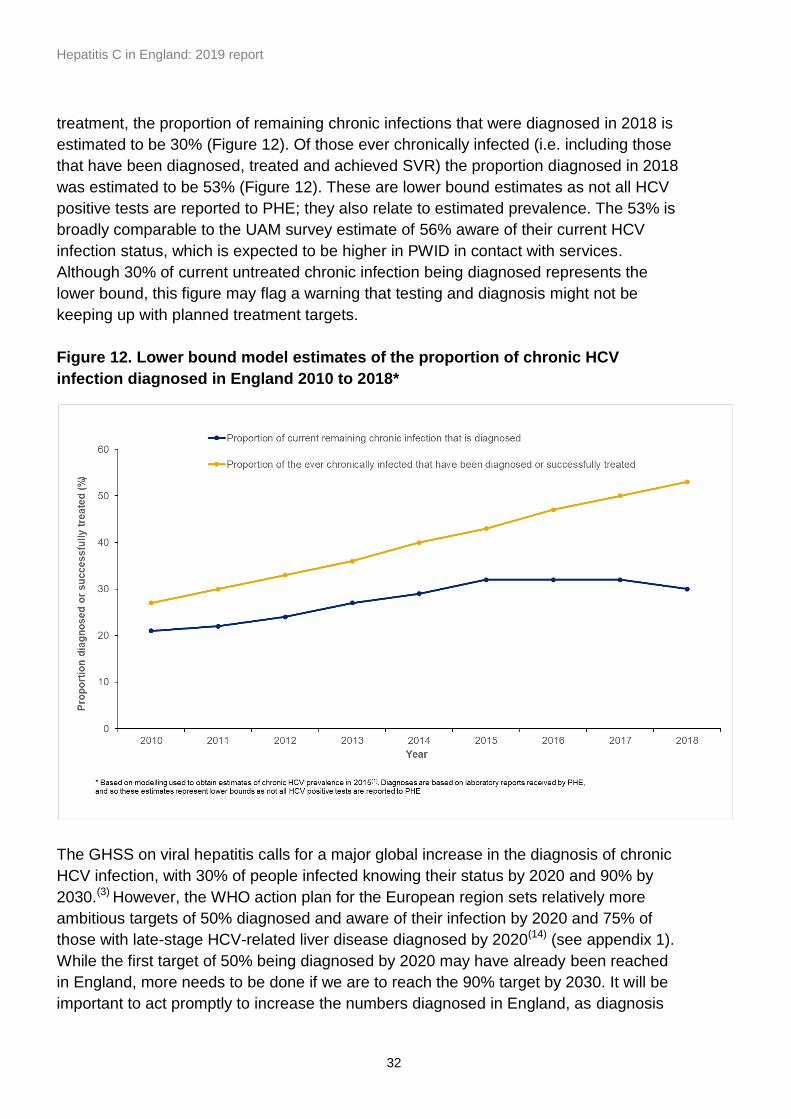
32
treatment, the proportion of remaining chronic infections that were diagnosed in 2018 is
estimated to be 30% (Figure 12). Of those ever chronically infected (i.e. including those
that have been diagnosed, treated and achieved SVR) the proportion diagnosed in 2018
was estimated to be 53% (Figure 12). These are lower bound estimates as not all HCV
positive tests are reported to PHE; they also relate to estimated prevalence. The 53% is
broadly comparable to the UAM survey estimate of 56% aware of their current HCV
infection status, which is expected to be higher in PWID in contact with services.
Although 30% of current untreated chronic infection being diagnosed represents the
lower bound, this figure may flag a warning that testing and diagnosis might not be
keeping up with planned treatment targets.
Figure 12. Lower bound model estimates of the proportion of chronic HCV
infection diagnosed in England 2010 to 2018*
The GHSS on viral hepatitis calls for a major global increase in the diagnosis of chronic
HCV infection, with 30% of people infected knowing their status by 2020 and 90% by
2030.(3) However, the WHO action plan for the European region sets relatively more
ambitious targets of 50% diagnosed and aware of their infection by 2020 and 75% of
those with late-stage HCV-related liver disease diagnosed by 2020(14) (see appendix 1).
While the first target of 50% being diagnosed by 2020 may have already been reached
in England, more needs to be done if we are to reach the 90% target by 2030. It will be
important to act promptly to increase the numbers diagnosed in England, as diagnosis
Hepatitis C in England: 2019 report
33
very quickly becomes a limiting factor for ODNs as they successfully treat their known
diagnosed population.
To reduce the levels of undiagnosed infection, it is necessary to raise awareness of
HCV and to roll out (and monitor) testing to more individuals at risk of infection,
including priority populations like PWID, those in secure and detained settings, and to
populations with close links to countries with a high prevalence of HCV infection.(11)
There are also those who may no longer be in contact with services because they
acquired their infections many years earlier, for example following a past period of
injecting drug use or via blood transfusion before the introduction of routine screening of
the blood supply in 1991.
Raising awareness
HCV is usually asymptomatic in the early years of infection, so many individuals are
unaware of their positive status. There are also other individuals who may have been
tested in the past but have not accessed treatment. Raising both professional and
public awareness remains a priority therefore, and an important component of reducing
the burden of HCV infection.
To ensure that as many eligible people as possible are treated with the new more
effective treatments, PHE have provided data to support the NHS in identifying people,
registered with a GP, who have been diagnosed with HCV in the past but who may not
have cleared their infections.(54) The NHS is in the process of contacting these patients
to offer testing, so those with current infection can be referred for assessment for
treatment.
As in previous years, a variety of initiatives are ongoing to increase public awareness of
HCV. Many of these are specifically designed to target those at highest risk of infection,
including past or current PWID, those in secure and detained settings, and individuals of
South Asian origin. The success of all these initiatives has been dependent on the
significant contribution of numerous stakeholders working across a range of settings.
For example, The Hepatitis C Trust’s South Asian Outreach Officer leads awareness
and testing events within the South Asian community at Melas, Mosques and other
community centres, in partnership with community leaders and local health authorities,
to help raise awareness of HCV in the South Asian community. Other services include
the Trust’s outreach and testing van as well as the development and implementation of
patient centred HCV interventions in collaboration with drug providers, including staff
training, peer-to-peer education, buddying, and the provision of a confidential helpline
(+44 (0) 20 7089 6221).
World Hepatitis Day, held on 28 July each year, continues to provide a focus for raising
awareness of HCV. In previous years, PHE have launched a HCV testing quiz, hosted

Hepatitis C in England: 2019 report
34
by The Hepatitis C Trust and now completed by over 7,100 people, to encourage
people to find out whether they might have been exposed to the virus and would benefit
from an HCV test. A linking poster campaign, fronted by TV’s Dr Christian Jessen,
involved the distribution of posters to GP surgeries throughout England, encouraging
people to take the quiz to see whether they might be at risk of infection. Over 6,900
posters have been distributed to date; these posters are available from the Health and
Social Care Publications Order line along with a guidance factsheet (+44 (0) 300 123
1003; Product code: HEPCQUIZ001).
Further resources developed by PHE, in collaboration with stakeholders, include
posters in Urdu, along with risk videos and banners for social media in different
languages co-branded by the World Hepatitis Alliance, The British Liver Trust and The
Hepatitis C Trust. These free resources help people to recognise any risk for infection
and encourage those at risk to seek testing.
The RCGP Certificate in the Detection, Diagnosis and Management of Hepatitis B and
C in Primary Care was developed to help raise awareness in primary care and among
other professionals working with groups at high risk of viral hepatitis infection. By the
end of February 2017, 2,827 individuals had completed the e-learning module.(5) In
November 2018, the course was updated(6) and by the end of February 2019, 78
individual’s had completed the updated course.(5) A further RCGP course, ‘Hepatitis C:
Enhancing Prevention, Testing and Care’ is also available and comprises 4 lessons:
understanding HCV; preventing transmission; testing and diagnosis; and treatment and
care.(7) This course was updated in January 2018, and by the end of February, 2019,
1754 individuals had completed this e-learning module.(5) Other downloadable
resources are also available, like those accessible via the International Network on
Hepatitis in Substance Users.
A PHE drugs commissioning support pack for adults(55) is available and outlines
principles that local areas might consider when developing plans for integrated alcohol
and drugs prevention, treatment and recovery systems. The pack includes data and
prompts relating to HCV testing and pathways to treatment and support for HCV. A PHE
‘Turning Evidence Into Practice’ briefing gives an overview of the main issues relating to
HCV that local providers and commissioners of drug and hepatitis treatment should be
aware of, with advice on improving access to, and completion of, HCV treatment.(56)
Since 2013/14, PHE in partnership with NHS England and Her Majesty’s Prison and
Probation Service (HMPPS) have overseen the rollout of BBV testing in adult prisons on
an ‘opt-out’ basis. A significant milestone was reached in April 2018, when after more
than 4 years of implementation, the programme was successfully rolled out across the
entire adult prison estate. The challenge moving forward will be increasing BBV testing
levels to within the upper NHS England performance standard (see section ‘Testing and
diagnosis in secure and detained settings; pages 43-45). To this end, focus will move
Hepatitis C in England: 2019 report
35
from programme implementation to improving the quality and uptake of testing within
prisons. This will entail a ‘whole system approach’ that will see collaboration between
public, private and third sector agencies to improve peer support networks, identify BBV
lead nurses, standardise testing offer and organise various stakeholder engagement
events with a focus on improving testing and treatment rates in prisons.
Overall, the non-government organisation (NGO) sector has been particularly influential
and their work is essential and complements government and public sector initiatives in
this important area.
Testing and diagnosis
In England, testing and diagnosis monitoring data are available from a variety of
surveillance systems: the UAM survey of PWID,(40) Sentinel Surveillance of Blood Borne
Virus Testing, Laboratory Reporting, the NDTMS, the NHS BT/PHE Epidemiology Unit
Blood Donor Surveillance Scheme and via HJIPs. Trends in HCV diagnosis and testing
are useful for monitoring the impact of awareness-raising initiatives and prevention
activity; this in turn helps to track national progress in controlling the infection.
Monitoring testing and diagnosis is useful at both a population level, as well as in sub-
groups that are at increased risk of infection. Monitoring HCV in blood donors, who are
at low risk of bloodborne virus infection, is also very useful for identifying new groups of
individuals who may be at risk of infection.
NICE public health guidance exists to help focus activity to ensure that more people at
increased risk of HCV (and HBV) infection are offered testing.(11)
Testing and diagnosis in the general population and primary care
Over the last 2 decades (1996-2017), there has been a more than eightfold increase in
the number of laboratory confirmed reports of HCV in England (Figure 13). In 2017,
17,186 laboratory reports of individuals testing positive for anti-HCV and/or HCV RNA
were reported (Figure 13).(5) Although de-duplication procedures have been undertaken
to prevent double counting of individuals, the quality of reports is such that linking is
unlikely to be complete. Around 2-thirds of laboratory reports (69.1%) were in men and
almost 1 half (44.8%) of all reports received were in individuals aged between 25 and
39 years (Figures 14 and 15).

Hepatitis C in England: 2019 report
36
Figure 13. Number of laboratory reports* of HCV from England: 1996 to 2017**
Figure 14: Age and sex distribution, where reported, of laboratory reports of HCV from England: 1996 to 2017*/**/†
Hepatitis C in England: 2019 report
37
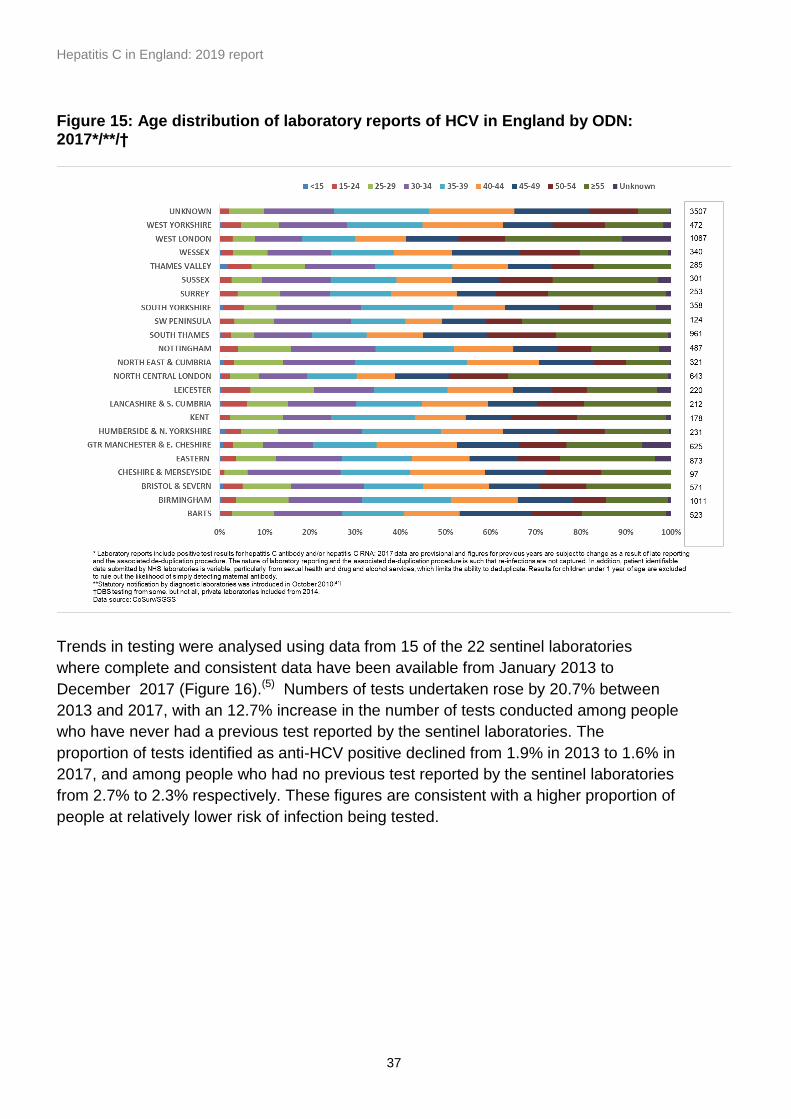
Figure 15: Age distribution of laboratory reports of HCV in England by ODN: 2017*/**/†
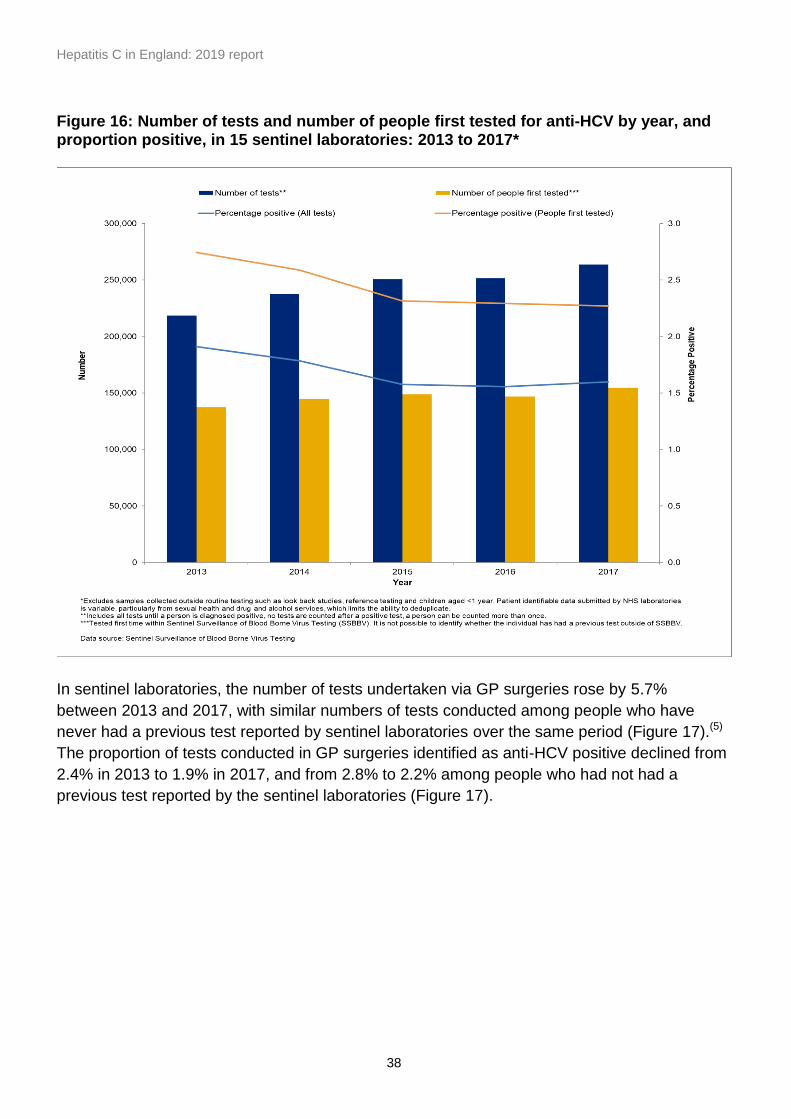
Trends in testing were analysed using data from 15 of the 22 sentinel laboratories
where complete and consistent data have been available from January 2013 to
December 2017 (Figure 16).(5) Numbers of tests undertaken rose by 20.7% between
2013 and 2017, with an 12.7% increase in the number of tests conducted among people
who have never had a previous test reported by the sentinel laboratories. The
proportion of tests identified as anti-HCV positive declined from 1.9% in 2013 to 1.6% in
2017, and among people who had no previous test reported by the sentinel laboratories
from 2.7% to 2.3% respectively. These figures are consistent with a higher proportion of
people at relatively lower risk of infection being tested.
Hepatitis C in England: 2019 report
38
Figure 16: Number of tests and number of people first tested for anti-HCV by year, and proportion positive, in 15 sentinel laboratories: 2013 to 2017*
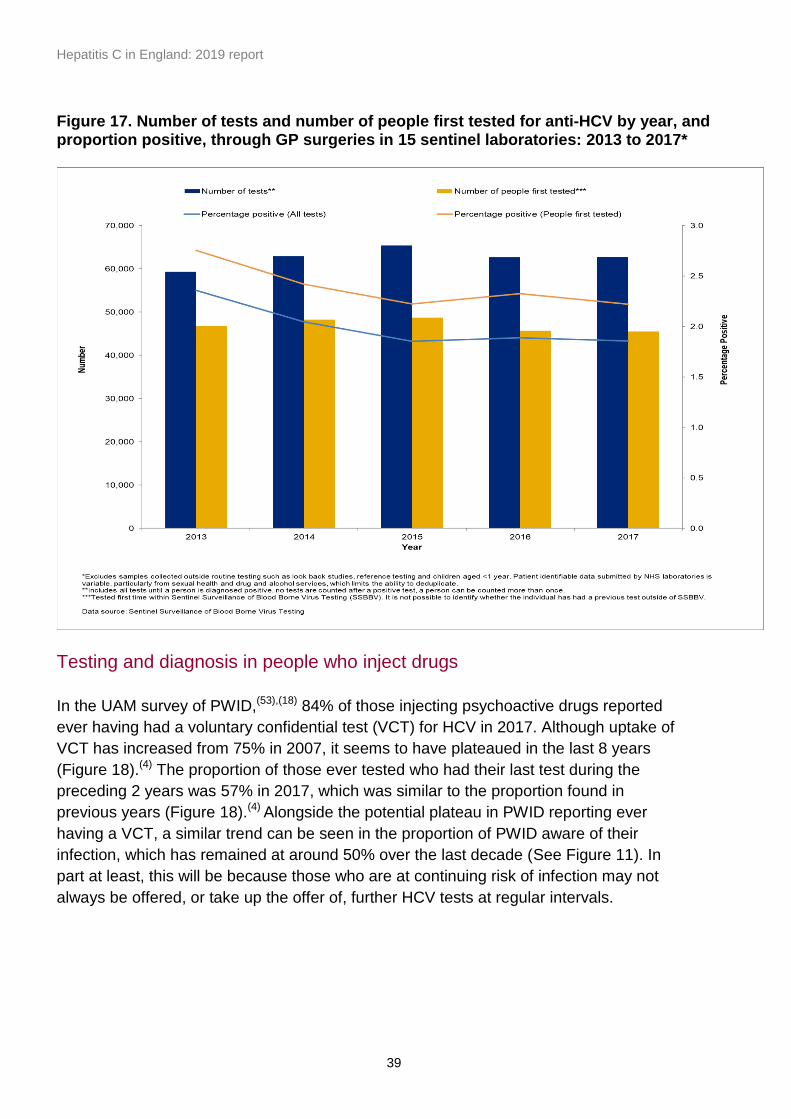
In sentinel laboratories, the number of tests undertaken via GP surgeries rose by 5.7%
between 2013 and 2017, with similar numbers of tests conducted among people who have
never had a previous test reported by sentinel laboratories over the same period (Figure 17).(5)
The proportion of tests conducted in GP surgeries identified as anti-HCV positive declined from
2.4% in 2013 to 1.9% in 2017, and from 2.8% to 2.2% among people who had not had a
previous test reported by the sentinel laboratories (Figure 17).
Hepatitis C in England: 2019 report
39
Figure 17. Number of tests and number of people first tested for anti-HCV by year, and proportion positive, through GP surgeries in 15 sentinel laboratories: 2013 to 2017*
Testing and diagnosis in people who inject drugs
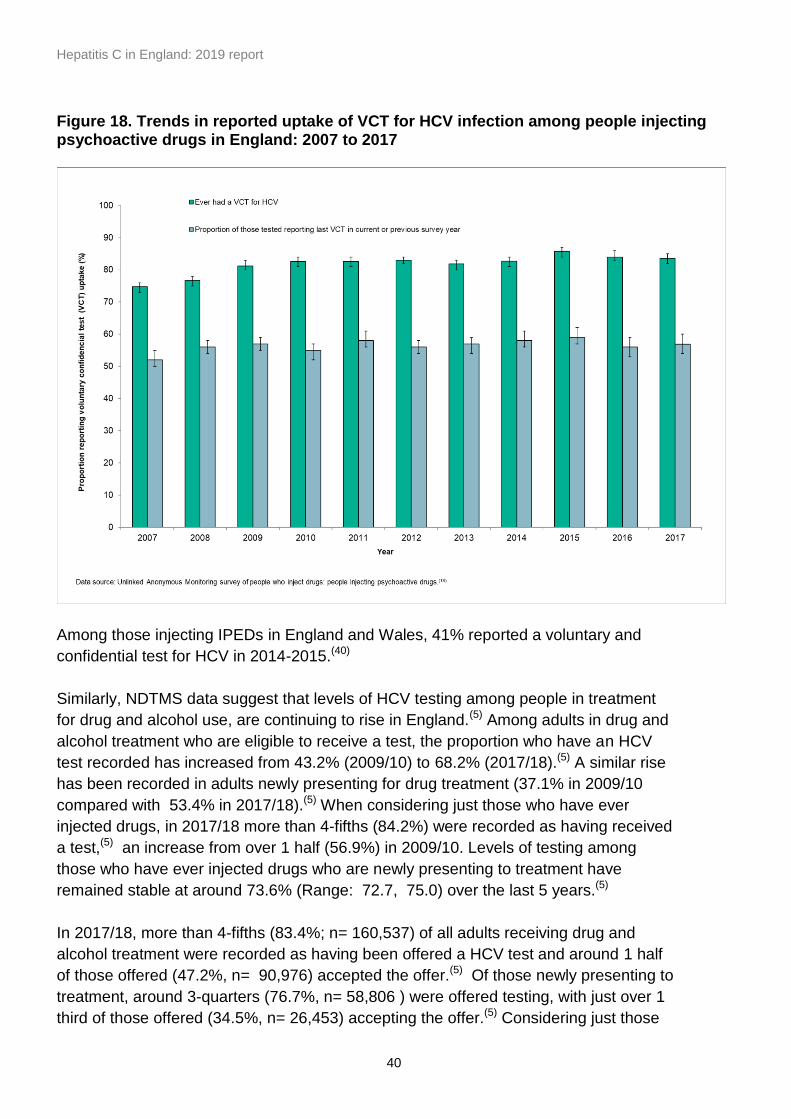
In the UAM survey of PWID,(53),(18) 84% of those injecting psychoactive drugs reported
ever having had a voluntary confidential test (VCT) for HCV in 2017. Although uptake of
VCT has increased from 75% in 2007, it seems to have plateaued in the last 8 years
(Figure 18).(4) The proportion of those ever tested who had their last test during the
preceding 2 years was 57% in 2017, which was similar to the proportion found in
previous years (Figure 18).(4) Alongside the potential plateau in PWID reporting ever
having a VCT, a similar trend can be seen in the proportion of PWID aware of their
infection, which has remained at around 50% over the last decade (See Figure 11). In
part at least, this will be because those who are at continuing risk of infection may not
always be offered, or take up the offer of, further HCV tests at regular intervals.
Hepatitis C in England: 2019 report
40
Figure 18. Trends in reported uptake of VCT for HCV infection among people injecting psychoactive drugs in England: 2007 to 2017
Among those injecting IPEDs in England and Wales, 41% reported a voluntary and
confidential test for HCV in 2014-2015.(40)
Similarly, NDTMS data suggest that levels of HCV testing among people in treatment
for drug and alcohol use, are continuing to rise in England.(5) Among adults in drug and
alcohol treatment who are eligible to receive a test, the proportion who have an HCV
test recorded has increased from 43.2% (2009/10) to 68.2% (2017/18).(5) A similar rise
has been recorded in adults newly presenting for drug treatment (37.1% in 2009/10
compared with 53.4% in 2017/18).(5) When considering just those who have ever
injected drugs, in 2017/18 more than 4-fifths (84.2%) were recorded as having received
a test,(5) an increase from over 1 half (56.9%) in 2009/10. Levels of testing among
those who have ever injected drugs who are newly presenting to treatment have
remained stable at around 73.6% (Range: 72.7, 75.0) over the last 5 years.(5)
In 2017/18, more than 4-fifths (83.4%; n= 160,537) of all adults receiving drug and
alcohol treatment were recorded as having been offered a HCV test and around 1 half
of those offered (47.2%, n= 90,976) accepted the offer.(5) Of those newly presenting to
treatment, around 3-quarters (76.7%, n= 58,806 ) were offered testing, with just over 1
third of those offered (34.5%, n= 26,453) accepting the offer.(5) Considering just those

Hepatitis C in England: 2019 report
41
who have ever injected drugs, nearly 90% were offered a test (88.6%, n= 85,841), and
nearly 3-fifths of those offered (57.7%, n= 55,969) accepted the offer in 2017/18.(5). A
similar proportion of those newly presenting to treatment were offered testing (82.7%,
n= 22,948), with just over 40% offered (43,1%, n=11,956) accepting the offer.(5)
Data from sentinel surveillance suggests that DBS testing now far outweighs testing of
venous blood in the drug service setting, and numbers tested using DBS are likely to be
higher as DBS testing data are not yet available from all providers. While the numbers
of first tests and all tests increased by around 1 third (36.3% and 31.8% respectively)
between 2013 and 2014, both have since fallen between 2014 and 2017 by 44.8% and
32.6% respectively. However, it is possible that this fall may be partly explained by data
from private laboratories not yet having been incorporated into sentinel surveillance.
Figure 19. Number of tests and number of people first tested for anti-HCV by year, and proportion positive, through drug services in 15 sentinel laboratories: 2013 to 2017*
Hepatitis C in England: 2019 report
42
Testing and diagnosis among people in secure and detained settings
HCV affects a larger proportion of people in prison and other detention centres than the
wider population, principally as a result of the relatively higher levels of injecting drug
use that are observed among this population.(57),(58)
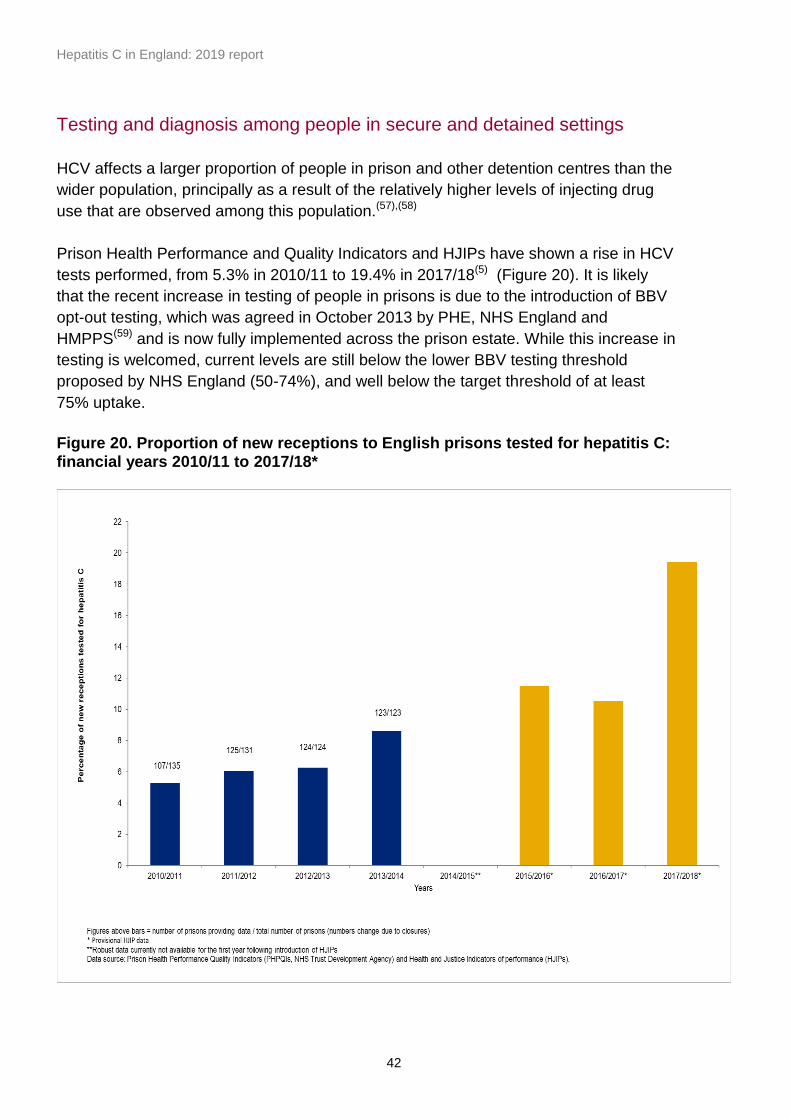
Prison Health Performance and Quality Indicators and HJIPs have shown a rise in HCV
tests performed, from 5.3% in 2010/11 to 19.4% in 2017/18(5) (Figure 20). It is likely
that the recent increase in testing of people in prisons is due to the introduction of BBV
opt-out testing, which was agreed in October 2013 by PHE, NHS England and
HMPPS(59) and is now fully implemented across the prison estate. While this increase in
testing is welcomed, current levels are still below the lower BBV testing threshold
proposed by NHS England (50-74%), and well below the target threshold of at least
75% uptake.
Figure 20. Proportion of new receptions to English prisons tested for hepatitis C: financial years 2010/11 to 2017/18*
Hepatitis C in England: 2019 report
43
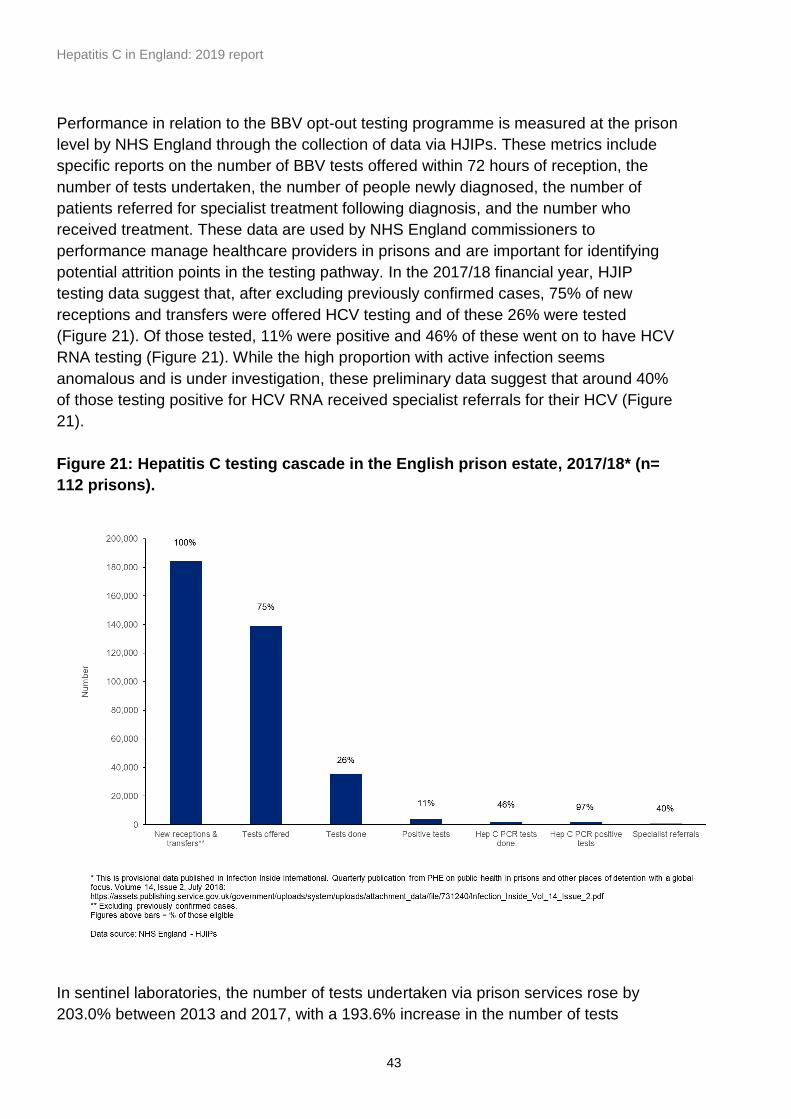
Performance in relation to the BBV opt-out testing programme is measured at the prison
level by NHS England through the collection of data via HJIPs. These metrics include
specific reports on the number of BBV tests offered within 72 hours of reception, the
number of tests undertaken, the number of people newly diagnosed, the number of
patients referred for specialist treatment following diagnosis, and the number who
received treatment. These data are used by NHS England commissioners to
performance manage healthcare providers in prisons and are important for identifying
potential attrition points in the testing pathway. In the 2017/18 financial year, HJIP
testing data suggest that, after excluding previously confirmed cases, 75% of new
receptions and transfers were offered HCV testing and of these 26% were tested
(Figure 21). Of those tested, 11% were positive and 46% of these went on to have HCV
RNA testing (Figure 21). While the high proportion with active infection seems
anomalous and is under investigation, these preliminary data suggest that around 40%
of those testing positive for HCV RNA received specialist referrals for their HCV (Figure
21).
Figure 21: Hepatitis C testing cascade in the English prison estate, 2017/18* (n=
112 prisons).
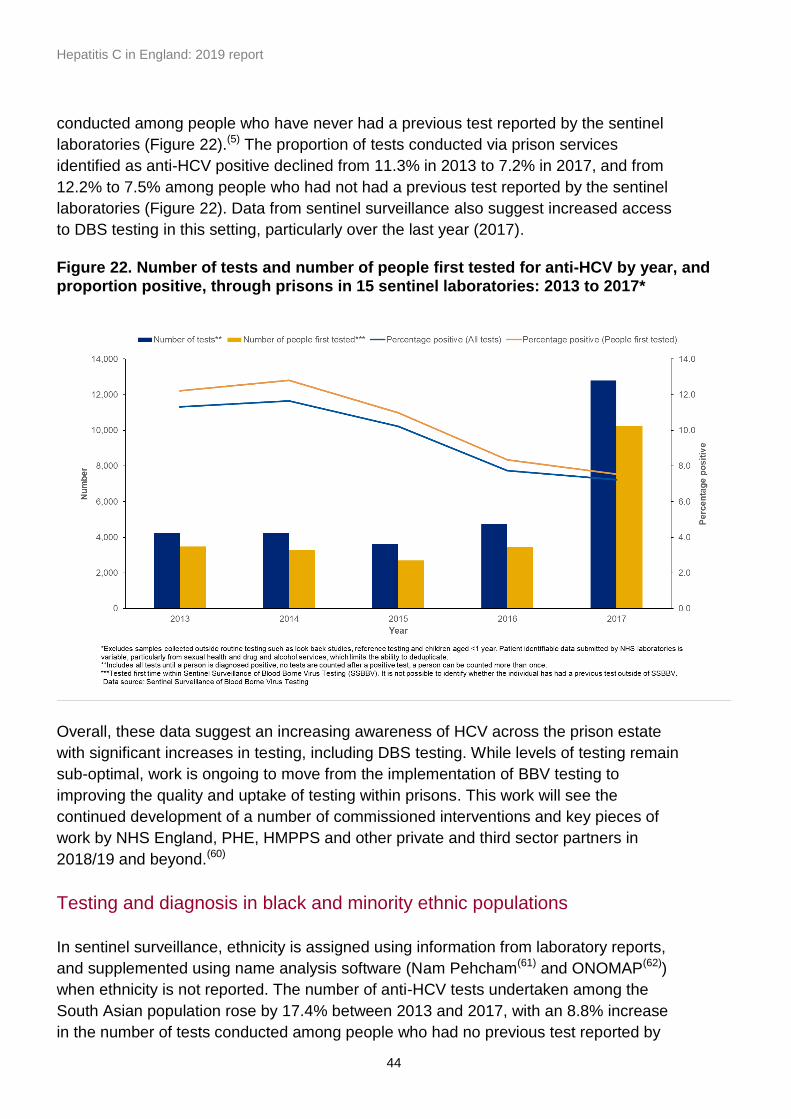
In sentinel laboratories, the number of tests undertaken via prison services rose by
203.0% between 2013 and 2017, with a 193.6% increase in the number of tests
Hepatitis C in England: 2019 report
44
conducted among people who have never had a previous test reported by the sentinel
laboratories (Figure 22).(5) The proportion of tests conducted via prison services
identified as anti-HCV positive declined from 11.3% in 2013 to 7.2% in 2017, and from
12.2% to 7.5% among people who had not had a previous test reported by the sentinel
laboratories (Figure 22). Data from sentinel surveillance also suggest increased access
to DBS testing in this setting, particularly over the last year (2017).
Figure 22. Number of tests and number of people first tested for anti-HCV by year, and proportion positive, through prisons in 15 sentinel laboratories: 2013 to 2017*
Overall, these data suggest an increasing awareness of HCV across the prison estate
with significant increases in testing, including DBS testing. While levels of testing remain
sub-optimal, work is ongoing to move from the implementation of BBV testing to
improving the quality and uptake of testing within prisons. This work will see the
continued development of a number of commissioned interventions and key pieces of
work by NHS England, PHE, HMPPS and other private and third sector partners in
2018/19 and beyond.(60)
Testing and diagnosis in black and minority ethnic populations
In sentinel surveillance, ethnicity is assigned using information from laboratory reports,
and supplemented using name analysis software (Nam Pehcham(61) and ONOMAP(62))
when ethnicity is not reported. The number of anti-HCV tests undertaken among the
South Asian population rose by 17.4% between 2013 and 2017, with an 8.8% increase
in the number of tests conducted among people who had no previous test reported by

Hepatitis C in England: 2019 report
45
the sentinel laboratories (Figure 23). The overall increase in testing may be a reflection
of targeted awareness-raising campaigns that have taken place among South Asian
communities over recent years. Over this period (2013 to 2017), 1.3% of tests among
people of South Asian origin were anti-HCV positive, declining from 1.6% in 2013 to
1.1% in 2017; the corresponding figures for people of South Asian origin who had no
previous test reported by the sentinel laboratories were 2.4% and 1.6% respectively
(Figure 23). These figures are consistent with an expanding testing programme, with a
higher proportion of individuals at relatively lower risk of infection being tested.
Figure 23: Number of tests and number of people first tested for anti-HCV by year, and proportion positive, in people of South Asian* origin in 15 sentinel laboratories: 2013 to 2017**
Sentinel surveillance data indicates that the number of tests among people who were
identified as being of Eastern European origin (using laboratory reported ethnicity and
ONOMAP(62) name analysis software), increased by 76.0% between 2013 and 2017,
with a similar increase (74.0%) over the same period in the number of tests conducted
among people who have never had a previous test reported by the sentinel laboratories
(Figure 24).(5) Over this period, 3.4% of tests among people of Eastern European origin
were anti-HCV positive, and 4.8% among people of Eastern European origin who had
no previous test reported by the sentinel laboratories (Figure 24).(5) These figures
suggest that these individuals may be at relatively increased risk of having acquired

Hepatitis C in England: 2019 report
46
HCV and/or that testing of this ethnic group is more targeted at higher risk individuals
than in the general population.
Figure 24: Number of tests and number of people first tested for anti-HCV by year, and proportion positive, in people of Eastern European origin* in 15 sentinel laboratories: 2013 to 2017**
Testing to establish levels of co-infection with HIV
In people with HCV, HIV co-infection can lead to faster progression to liver
disease.(63),(64) In order to estimate levels of co-infection among the HCV population in
England, adults with current HCV infection reported to sentinel surveillance were linked
to the PHE national HIV database. Results suggest that between 2008 and 2014, 5.0%
of adults with a current HCV infection were diagnosed with HIV infection; around 2
thirds reported their probable route of HIV transmission as sex between men, and
nearly 1 quarter reported injecting drug use.(65)
In response to increased levels of HCV infection among patients with HIV, the British
HIV Association announced ambitious targets for the micro elimination of HCV in
patients with HIV, with the aim of curing HCV in 80% of those co-infected by April 2019,
90% by April 2020, and 100% by April 2021.(8)
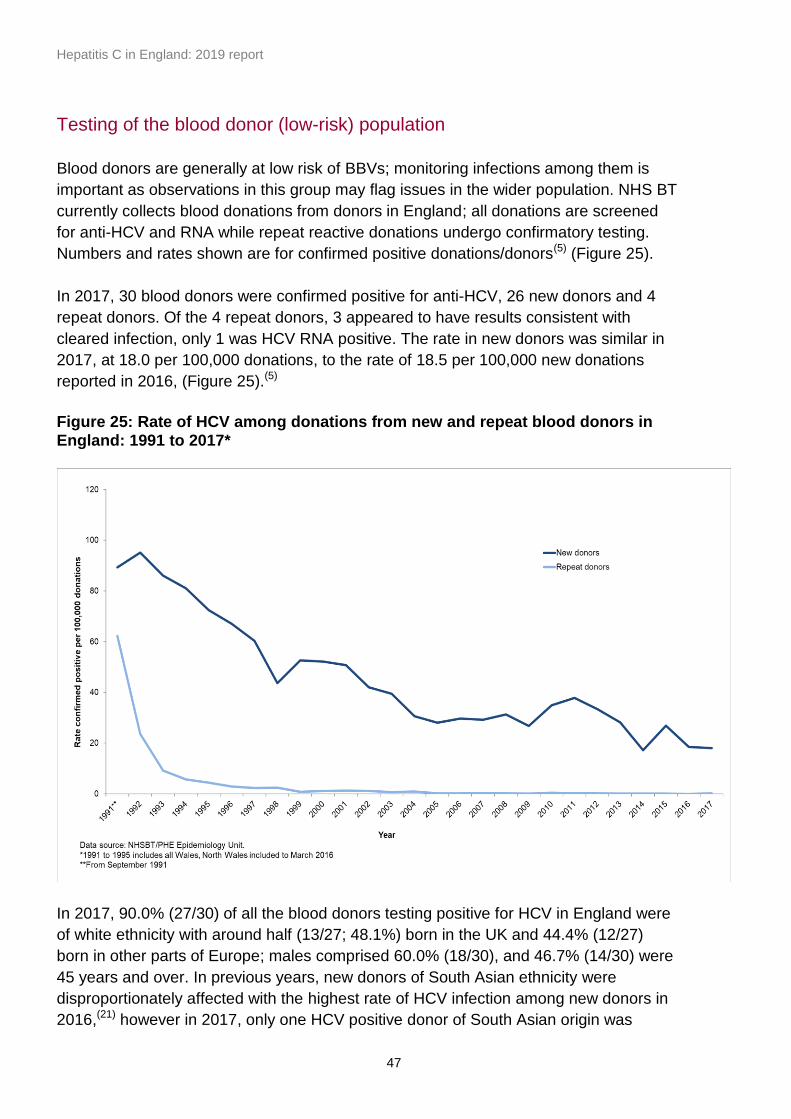
Hepatitis C in England: 2019 report
47
Testing of the blood donor (low-risk) population
Blood donors are generally at low risk of BBVs; monitoring infections among them is
important as observations in this group may flag issues in the wider population. NHS BT
currently collects blood donations from donors in England; all donations are screened
for anti-HCV and RNA while repeat reactive donations undergo confirmatory testing.
Numbers and rates shown are for confirmed positive donations/donors(5) (Figure 25).
In 2017, 30 blood donors were confirmed positive for anti-HCV, 26 new donors and 4
repeat donors. Of the 4 repeat donors, 3 appeared to have results consistent with
cleared infection, only 1 was HCV RNA positive. The rate in new donors was similar in
2017, at 18.0 per 100,000 donations, to the rate of 18.5 per 100,000 new donations
reported in 2016, (Figure 25).(5)
Figure 25: Rate of HCV among donations from new and repeat blood donors in England: 1991 to 2017*
In 2017, 90.0% (27/30) of all the blood donors testing positive for HCV in England were
of white ethnicity with around half (13/27; 48.1%) born in the UK and 44.4% (12/27)
born in other parts of Europe; males comprised 60.0% (18/30), and 46.7% (14/30) were
45 years and over. In previous years, new donors of South Asian ethnicity were
disproportionately affected with the highest rate of HCV infection among new donors in
2016,(21) however in 2017, only one HCV positive donor of South Asian origin was
Hepatitis C in England: 2019 report
48
identified. The rates of HCV in new donors of ‘other white background’ were high, as in
previous years(21) at 95 per 100,000 donors, or about ten times higher than in white-
British donors. The 4 repeat HCV positive donors were all in the 45 and over age group,
3 females and 3 white-British, and 1 of white-other background.
Similar to 2016, 15.4% of HCV positive new donors (4/26) had no risk factor assigned.
People with a history of injecting use are permanently deferred from donating in the UK,
although donors do not always disclose this behaviour. The number and proportion of
HCV positive donors reporting injecting drug use varies each year but is currently at a
very low level; in 2017, 3 reported a history of injecting and a further 2 females reported
partners who had injected drugs. One donor reported sex between men, which has
been rarely reported in HCV positive blood donors. Where known, and similar to 2016,
possible blood contact covering a wide range of not necessarily causal exposures,
accounted for 40.9% of HCV cases (9/22), half abroad (5/9; 55.6%). A further 27.3%
(6/22) were assigned as originating from a country with higher prevalence of HCV than
the UK without any other possible exposure reported (1 from India, 1 from Egypt, 1 from
Afghanistan, 2 from Poland and 1 from Latvia). One other donor had a history of
transfusion abroad in the 1980s. No risk was identified for the 3 repeat donors, the
fourth had only a history of tattoos with apparent cleared infection.
Increasing the numbers accessing hepatitis C treatment
The GHSS on viral HCV calls for 3 million people with chronic HCV to have been
treated by 2020, and by 2030 treatment coverage to reach 80% of the eligible
population.(1) However, the WHO action plan for the European region sets relatively
more ambitious targets of 75% of diagnosed patients with chronic HCV having
accessed treatment by 2020, with more than 90% of these cured, and 90% of all
diagnosed patients being linked into care and adequately monitored by 2020(14) (see
appendix 1). Worldwide, it is estimated that 7 per cent of those diagnosed with HCV
were started on treatment in 2015.(4) In the era of pegylated interferon and ribavirin
treatment in England, this figure was estimated to be higher, but still suboptimal, with
around 20% of those testing positive for HCV RNA thought to have accessed
treatment.(66)
While prevention activity is crucial in reducing the rate of new infections, numbers
already infected would remain high for many years without effective HCV treatment,
which has the potential to dramatically reduce the number of deaths in the short and
medium term.(67)
From the public health perspective, DAA drugs offer a considerable advantage over
previous HCV treatments because their all-oral, shorter treatment durations, and
improved safety profiles make them easier to roll out in community/outreach settings
where it is easiest to reach many of those infected. While the high price of these drugs

Hepatitis C in England: 2019 report
49
represents a major barrier to access in many countries worldwide, these medicines are
being rolled out in England in accordance with national
recommendations.(22),(23),(24),(25),(26),(27),(28),(68),(31),(69)
Metrics to monitor numbers/access to hepatitis C treatment:
numbers initiating HCV treatment
based on the above, annual predictions of the number of people expected to be
living with HCV related end-stage liver disease/hepatocellular carcinoma in 2020
and 2030
numbers of people originating from, or born in, South Asia accessing treatment
services
proportion of treatments in those currently injected drugs
proportion of referrals from services for key risk groups, like drugs services and
prisons.
disease stage of those accessing treatment
proportion of people treated outside traditional secondary and tertiary care settings
via outreach services
Treatment initiations in England
As we work towards producing estimates of the proportion of the chronically infected
population who achieve a SVR following treatment, NHS England commissioning data
suggest significant increases in the number of people accessing treatment since 2014
(Figure 26). Between 2008 and 2014, provisional estimates suggest that numbers
initiating HCV treatment in England remained relatively stable at around 5,100 initiations
per year (Mean: 5,096; Range: 4,738-5,484;(5) Figure 26). However, between 2015/16
and 2017/18, NHS England data suggest that significantly more people (27,028 in total)
accessed treatment than in earlier years, 18.3% more in 2015/16 than mean 2008-2014
levels (935/5096*100), 56.5% more in 2016/17 than in 2015/16 (3409/6031*100), and
22.4% more in 2017/18 than in 2016/17 (2117/9440*100). This is the result of access to
DAA drugs that have been coming online since 2014/15.(23),(27),(28),(26),(24)
In 2017, Arden and Greater East Midlands Commissioning Support Unit were commissioned by
NHS England to produce a HCV patient registry and treatment outcome system to capture
more detailed information for patients.(2) Following system rollout in May/June 2017, NHS HCV
ODNs throughout England have been inputting data into the system, supported by the
Commissioning for Quality and Innovation (CQUIN) framework, which supports improvements
in the quality of services and the creation of new, improved patterns of care.(70) These registry
data (yellow bars, Figure 26) suggest that just over 24,000 people (n= 24,061) were treated
between 2015/16 and 2017/18, less than estimated via commissioning data (2,967 less when
subsequent treatments are excluded or 2,779 less when subsequent treatments are included).
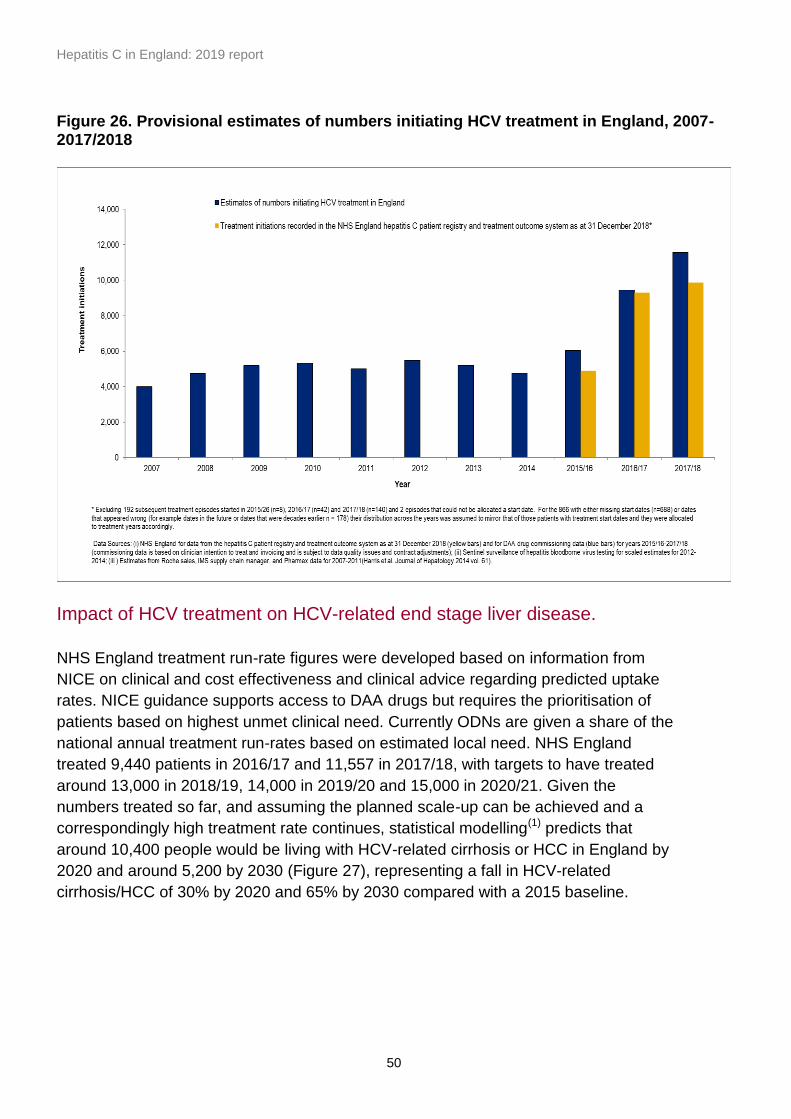
Hepatitis C in England: 2019 report
50
Figure 26. Provisional estimates of numbers initiating HCV treatment in England, 2007- 2017/2018
Impact of HCV treatment on HCV-related end stage liver disease.
NHS England treatment run-rate figures were developed based on information from
NICE on clinical and cost effectiveness and clinical advice regarding predicted uptake
rates. NICE guidance supports access to DAA drugs but requires the prioritisation of
patients based on highest unmet clinical need. Currently ODNs are given a share of the
national annual treatment run-rates based on estimated local need. NHS England
treated 9,440 patients in 2016/17 and 11,557 in 2017/18, with targets to have treated
around 13,000 in 2018/19, 14,000 in 2019/20 and 15,000 in 2020/21. Given the
numbers treated so far, and assuming the planned scale-up can be achieved and a
correspondingly high treatment rate continues, statistical modelling(1) predicts that
around 10,400 people would be living with HCV-related cirrhosis or HCC in England by
2020 and around 5,200 by 2030 (Figure 27), representing a fall in HCV-related
cirrhosis/HCC of 30% by 2020 and 65% by 2030 compared with a 2015 baseline.

Hepatitis C in England: 2019 report
51
Figure 27. Estimated prevalence of HCV-related compensated cirrhosis and first occurrences of HCV-related ESLD/HCC (right axis); estimates from modelling the HCV epidemic and disease burden.(1)
These figures are based on a number of modelling assumptions.(1) In those diagnosed,
treatment rates are assumed equal across disease stages. In practice, those with
cirrhosis have been prioritised and therefore the impact may be greater than that
predicted here, especially in the short term. More rapid diagnosis and treatment of those
with cirrhosis could potentially halve ESLD/HCC by 2020.(1) Conversely, rates of post-
SVR disease progression in those with cirrhosis are assumed to be low, but long-term
outcomes are not yet well-quantified;(71) achieving SVR may not necessarily prevent
progression to ESLD/HCC. It is also assumed that diagnosis rates remain stable in
future, and the number of infected individuals available to be treated keeps pace with
planned treatment levels. If treatment cannot keep pace with planned delivery, the
impact will be correspondingly less.
Despite the potential limitations of modelling, a substantial reduction in severe HCV-
related disease is likely; and it is inevitable that DAA drugs will have a dramatic impact
in comparison to previous interferon-based therapy.(21) Although treating those with
cirrhosis is imperative, a rising number of those infected are progressing to cirrhosis and
may transmit infection to others. Therefore, treatment of mild and moderate stage
Hepatitis C in England: 2019 report
52
disease is also required to maintain reductions in HCV-related disease and reduce the
numbers becoming newly or re-infected.(29)
Access to treatment and outcome
Many HCV infections occur in marginalised communities, including PWID and black and
minority ethnic populations. It is therefore important to ensure that care pathways exist
that allow these individuals, as well as others, to access treatment and care.
Data are now available from the NHS England national HCV Patient Registry and
Treatment Outcome System, the content, completeness and preliminary findings from
which have been reported elsewhere.(2) These data allow us to see whether treatment is
reaching key risk groups and help us to understand how much treatment is being
delivered outside traditional secondary and tertiary care settings via outreach services.
As at 31 December 2018, the register contained 39,420 records, of which 978 were
excluded as they represented duplicate records (152 were duplicate treatment
episodes; 826 were people with a treatment episode who appeared again just as a
registry entry, or who had no treatment episodes but appeared in the register more than
once). The remaining 38,442 records were for: 7,235 people who had no treatment;
30,537 people who had just 1 treatment episode in the register; 329 people with 2
treatment episodes; and 4 people with 3 treatment episodes in the register. (Figure 28).

Hepatitis C in England: 2019 report
53
Figure 28. Distribution of patient treatment episodes, and patients yet to be
treated, in the HCV Patient Registry and Treatment Outcome System, by ODN
Focusing on the ‘first’ treatments for individuals with a treatment episode in the register
(30,870 people in total by the end of 2018; yellow bars, Figure 26), 71.1% of patients
were male and patients’ average age was 50.6 (SD: 11.9) years. Patients were
predominantly white (80.9%), with 9.8% Asian/Asian British and 4.2% classified as
Black/African/Caribbean/Black British. Twenty eight percent were born outside the UK.
The mean date of HCV diagnosis was 2011, with around half (49.6%) of infections
having been first diagnosed in 2013 or earlier, and almost a third (31.6%) having a first
diagnosis after 2015. Most infections were genotype 1 (52.9%) with a further 37.5%
genotype 3. Information on injecting status was provided for 67.9% of the sample, and
showed 21.5% to be people who had currently/recently injected drugs (injected in the
last 3 years), 34.1% were recorded as never having injected drugs, while most (44,5%)
were reported to be people who had injected drugs in the past but were no longer
injecting. The distribution of injecting status amongst those accessing treatment, varied
considerably by ODN (Figure 29), and it is encouraging to see a significant proportion of
people who currently/recently injected drugs accessing treatment in a number of ODNs
in the North (Figure 29). Where route of transmission was known (60.9%), the majority
acquired their infection via injecting drug use (72.6%) or via non-occupational contact
with blood in a healthcare setting (11.0%), although other routes were reported.
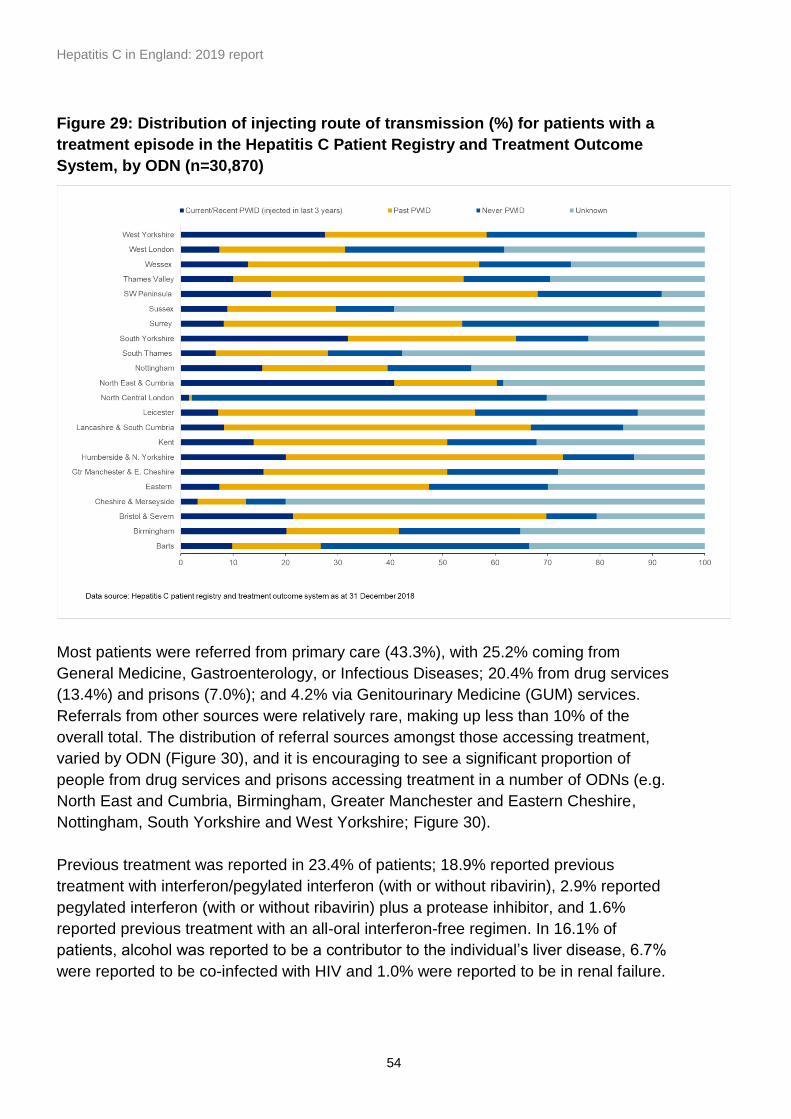
Hepatitis C in England: 2019 report
54
Figure 29: Distribution of injecting route of transmission (%) for patients with a
treatment episode in the Hepatitis C Patient Registry and Treatment Outcome
System, by ODN (n=30,870)
Most patients were referred from primary care (43.3%), with 25.2% coming from
General Medicine, Gastroenterology, or Infectious Diseases; 20.4% from drug services
(13.4%) and prisons (7.0%); and 4.2% via Genitourinary Medicine (GUM) services.
Referrals from other sources were relatively rare, making up less than 10% of the
overall total. The distribution of referral sources amongst those accessing treatment,
varied by ODN (Figure 30), and it is encouraging to see a significant proportion of
people from drug services and prisons accessing treatment in a number of ODNs (e.g.
North East and Cumbria, Birmingham, Greater Manchester and Eastern Cheshire,
Nottingham, South Yorkshire and West Yorkshire; Figure 30).
Previous treatment was reported in 23.4% of patients; 18.9% reported previous
treatment with interferon/pegylated interferon (with or without ribavirin), 2.9% reported
pegylated interferon (with or without ribavirin) plus a protease inhibitor, and 1.6%
reported previous treatment with an all-oral interferon-free regimen. In 16.1% of
patients, alcohol was reported to be a contributor to the individual’s liver disease, 6.7%
were reported to be co-infected with HIV and 1.0% were reported to be in renal failure.
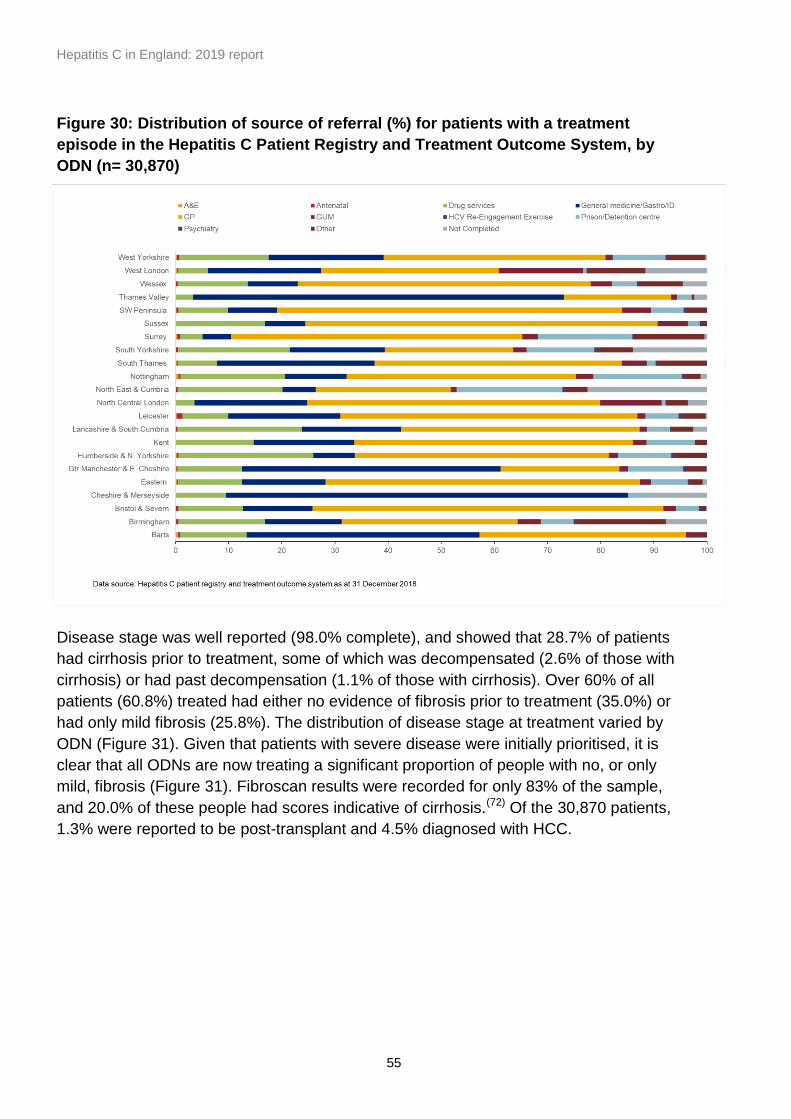
Hepatitis C in England: 2019 report
55
Figure 30: Distribution of source of referral (%) for patients with a treatment
episode in the Hepatitis C Patient Registry and Treatment Outcome System, by
ODN (n= 30,870)
Disease stage was well reported (98.0% complete), and showed that 28.7% of patients
had cirrhosis prior to treatment, some of which was decompensated (2.6% of those with
cirrhosis) or had past decompensation (1.1% of those with cirrhosis). Over 60% of all
patients (60.8%) treated had either no evidence of fibrosis prior to treatment (35.0%) or
had only mild fibrosis (25.8%). The distribution of disease stage at treatment varied by
ODN (Figure 31). Given that patients with severe disease were initially prioritised, it is
clear that all ODNs are now treating a significant proportion of people with no, or only
mild, fibrosis (Figure 31). Fibroscan results were recorded for only 83% of the sample,
and 20.0% of these people had scores indicative of cirrhosis.(72) Of the 30,870 patients,
1.3% were reported to be post-transplant and 4.5% diagnosed with HCC.
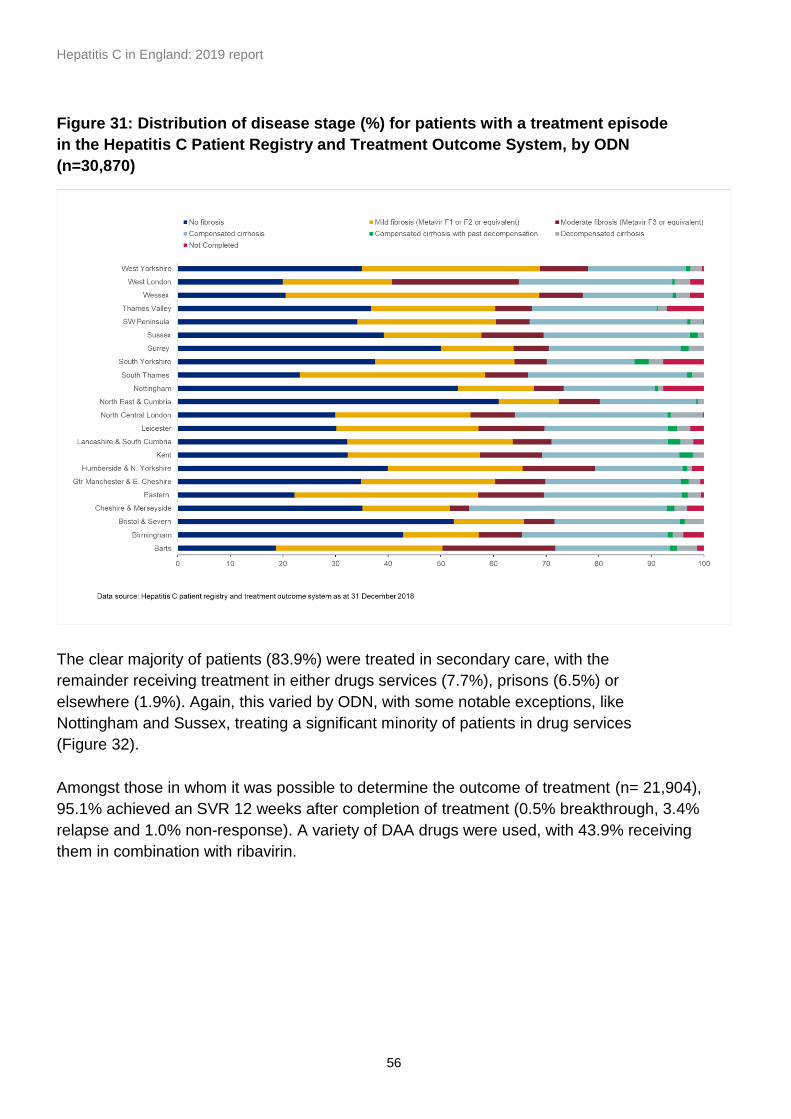
Hepatitis C in England: 2019 report
56
Figure 31: Distribution of disease stage (%) for patients with a treatment episode
in the Hepatitis C Patient Registry and Treatment Outcome System, by ODN
(n=30,870)
The clear majority of patients (83.9%) were treated in secondary care, with the
remainder receiving treatment in either drugs services (7.7%), prisons (6.5%) or
elsewhere (1.9%). Again, this varied by ODN, with some notable exceptions, like
Nottingham and Sussex, treating a significant minority of patients in drug services
(Figure 32).
Amongst those in whom it was possible to determine the outcome of treatment (n= 21,904),
95.1% achieved an SVR 12 weeks after completion of treatment (0.5% breakthrough, 3.4%
relapse and 1.0% non-response). A variety of DAA drugs were used, with 43.9% receiving
them in combination with ribavirin.
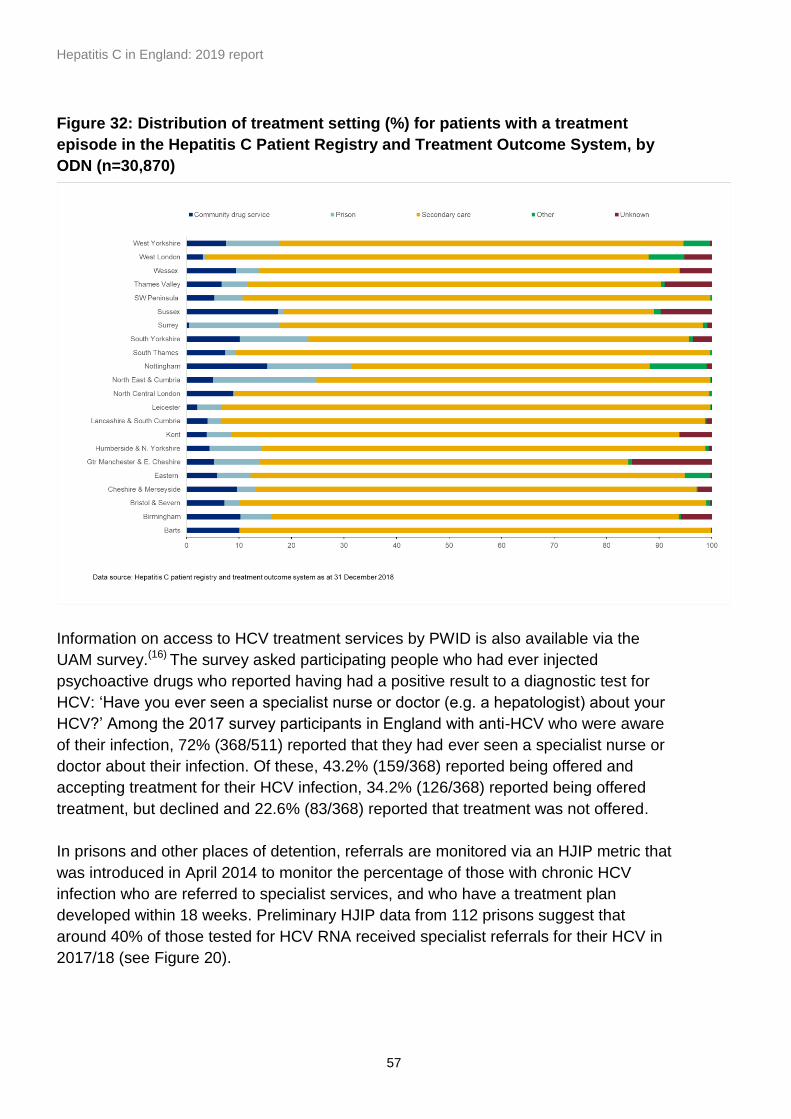
Hepatitis C in England: 2019 report
57
Figure 32: Distribution of treatment setting (%) for patients with a treatment
episode in the Hepatitis C Patient Registry and Treatment Outcome System, by
ODN (n=30,870)
Information on access to HCV treatment services by PWID is also available via the
UAM survey.(16) The survey asked participating people who had ever injected
psychoactive drugs who reported having had a positive result to a diagnostic test for
HCV: ‘Have you ever seen a specialist nurse or doctor (e.g. a hepatologist) about your
HCV?’ Among the 2017 survey participants in England with anti-HCV who were aware
of their infection, 72% (368/511) reported that they had ever seen a specialist nurse or
doctor about their infection. Of these, 43.2% (159/368) reported being offered and
accepting treatment for their HCV infection, 34.2% (126/368) reported being offered
treatment, but declined and 22.6% (83/368) reported that treatment was not offered.
In prisons and other places of detention, referrals are monitored via an HJIP metric that
was introduced in April 2014 to monitor the percentage of those with chronic HCV
infection who are referred to specialist services, and who have a treatment plan
developed within 18 weeks. Preliminary HJIP data from 112 prisons suggest that
around 40% of those tested for HCV RNA received specialist referrals for their HCV in
2017/18 (see Figure 20).
Hepatitis C in England: 2019 report
58
Data sources
Hepatitis C patient registry and treatment outcome system:
https://www.ardengemcsu.nhs.uk/case-studies/developing-clinical-registry-system-
hepatitis-c
Office for National Statistics mortality data:
https://www.ons.gov.uk/peoplepopulationandcommunity/birthsdeathsandmarriages/deaths
People who inject drugs: HIV and viral hepatitis monitoring.
https://www.gov.uk/government/statistics/people-who-inject-drugs-hiv-and-viral-
hepatitis-monitoring
Hospital Episode Statistics, NHS Digital:
http://content.digital.nhs.uk/hes
NHS England Specialised Commissioning:
www.england.nhs.uk/commissioning/spec-services/
NHS Blood and Transplant/PHE Epidemiology Unit:
www.gov.uk/guidance/blood-tissue-and-organ-donors-surveillance-schemes
PHE Sentinel Surveillance of Hepatitis C Testing:
www.gov.uk/government/publications/sentinel-surveillance-of-blood-borne-virus-testing-
in-england-2016
Prison Health:
https://www.gov.uk/government/collections/public-health-in-prisons

Hepatitis C in England: 2019 report
59
Appendices
Appendix 1.* WHO GHSS targets(3) for viral hepatitis, relevant to HCV in the
UK context, with 2020 targets updated to reflect the draft action plan for the
health sector response to viral hepatitis in the WHO European Region.(14)
TARGET AREA
2020 TARGETS(14)
2030 TARGETS(3)
Impact targets
Incidence: New cases of chronic viral hepatitis C infection
30% reduction
80% reduction
Mortality: Viral hepatitis C deaths
10% reduction
65% reduction
Service coverage targets
Blood safety:**Proportion of donations screened in a quality-assured manner
100%
100%
Safe injections:*** Percentage of injections administered with safety engineered devices in and out of health facilities
50%
90%
Harm reduction: A comprehensive package of harm reduction services to all PWID(73) including:
At least 200 sterile needles and syringes provided per person who injects drugs per year At least 40% of opioid dependent PWID receive OST 90% of PWID receiving targeted HCV information, education and communication
At least 300 sterile needles and syringes provided per person who injects drugs per year
Proportion of people with chronic HCV diagnosed and aware of their infection
50% [75% of estimated number of patients at late stage of viral hepatitis-related liver disease (cirrhosis or HCC) diagnosed]
90%
Treatment coverage of people diagnosed with chronic HCV who are eligible for treatment
75% (>90% cured) [90% of diagnosed patients with chronic HCV are linked to care and adequately monitored]
80%
* Abstracted from the WHO Global Health Sector Strategy for Viral Hepatitis(3) and modified to reflect the draft action plan for the health sector response to viral hepatitis in the WHO European Region
(14)
** In England, 2020 and 2030 targets are already met.(74)
***In England, 2020 and 2030 targets are already met in the health care setting as the UK follows the EU Directive for the prevention of sharps injuries in the health care setting,
(75) by using safety engineered
devices.

Hepatitis C in England: 2019 report
60
Appendix 2. Preliminary indicators to monitor the impact of key
interventions to tackle hepatitis C virus in England
Burden, Impact and Service Coverage Monitoring Areas • Preliminary Indicator (UK indicators in red; Placeholders* in italics)
Data source
Burden Reducing the burden of infection in England • Estimated prevalence of HCV infection • Risk factors for infection from laboratory reports • Trend in anti-HCV prevalence among PWID
Modelled estimate(1) CoSurv/SGSS UAM survey
Impact 1. Reducing HCV-related morbidity and mortality
• Estimated incidence of HCV-related ESLD/HCC • Registrations for liver transplants in patients with HCV • First liver transplants undertaken in patients with HCV
(% of all liver transplants) • First liver transplants undertaken in patients with HCV HCC (% of all liver transplants in patients with HCV) • Death (registrations) from HCV-related ESLD/HCC
HES NHS BT NHS BT NHS BT ONS
2. Reducing the number of new (incident) infections
• Estimated incidence of HCV among people injecting psychoactive drugs • Prevalence of anti-HCV among recent initiates to drug
use • Number of HCV tests performed in young adults (and
proportion testing positive) in sentinel laboratories • Number of HCV laboratory reports in young adults (and
proportion of all reports they represent) • Placeholder: Estimated number of new infections originating injecting drug use and net migration
UAM survey UAM survey Sentinel surveillance CoSurv/SGSS TBC
Service coverage
1. Adequate harm reduction • Estimated proportion of PWID reporting adequate Needle and syringe provision • Sharing of injecting equipment and associated paraphernalia among PWID • Number of current and past PWID in drug treatment • Proportion of opioid dependent PWID receiving OST • Placeholder: Proportion of PWID receiving targeted HCV information
UAM survey UAM survey NDTMS NDTMS; Hay et
al.(35)
TBC
2. Increasing awareness and the numbers and
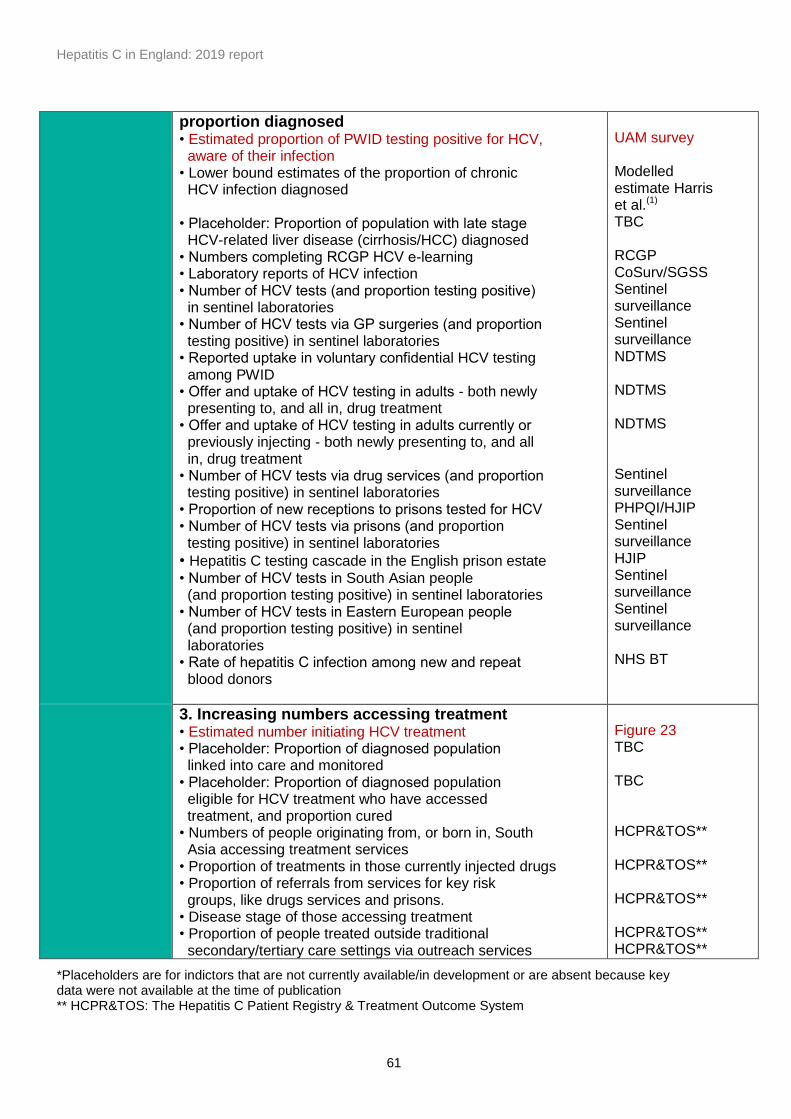
Hepatitis C in England: 2019 report
61
proportion diagnosed • Estimated proportion of PWID testing positive for HCV, aware of their infection • Lower bound estimates of the proportion of chronic HCV infection diagnosed • Placeholder: Proportion of population with late stage HCV-related liver disease (cirrhosis/HCC) diagnosed • Numbers completing RCGP HCV e-learning • Laboratory reports of HCV infection • Number of HCV tests (and proportion testing positive) in sentinel laboratories • Number of HCV tests via GP surgeries (and proportion testing positive) in sentinel laboratories • Reported uptake in voluntary confidential HCV testing among PWID • Offer and uptake of HCV testing in adults - both newly presenting to, and all in, drug treatment • Offer and uptake of HCV testing in adults currently or previously injecting - both newly presenting to, and all in, drug treatment • Number of HCV tests via drug services (and proportion testing positive) in sentinel laboratories • Proportion of new receptions to prisons tested for HCV • Number of HCV tests via prisons (and proportion testing positive) in sentinel laboratories
• Hepatitis C testing cascade in the English prison estate
• Number of HCV tests in South Asian people (and proportion testing positive) in sentinel laboratories • Number of HCV tests in Eastern European people (and proportion testing positive) in sentinel laboratories • Rate of hepatitis C infection among new and repeat blood donors
UAM survey Modelled estimate Harris et al.(1) TBC RCGP CoSurv/SGSS Sentinel surveillance Sentinel surveillance NDTMS NDTMS NDTMS Sentinel surveillance PHPQI/HJIP Sentinel surveillance HJIP Sentinel surveillance Sentinel surveillance NHS BT
3. Increasing numbers accessing treatment • Estimated number initiating HCV treatment • Placeholder: Proportion of diagnosed population linked into care and monitored • Placeholder: Proportion of diagnosed population eligible for HCV treatment who have accessed treatment, and proportion cured • Numbers of people originating from, or born in, South Asia accessing treatment services • Proportion of treatments in those currently injected drugs • Proportion of referrals from services for key risk groups, like drugs services and prisons. • Disease stage of those accessing treatment • Proportion of people treated outside traditional secondary/tertiary care settings via outreach services
Figure 23 TBC TBC HCPR&TOS** HCPR&TOS** HCPR&TOS** HCPR&TOS** HCPR&TOS**
*Placeholders are for indictors that are not currently available/in development or are absent because key data were not available at the time of publication ** HCPR&TOS: The Hepatitis C Patient Registry & Treatment Outcome System
Hepatitis C in England: 2019 report
62
References
1. Ross J. Harris HH, Sema Mandal, Mary Ramsay, Peter Vickerman, Matthew Hickman, Daniela De Angelis. Monitoring the hepatitis C epidemic in England and evaluating intervention scale-up using routinely collected data. Available at: https://doi.org/10.1111/jvh.13063 [Accessed 12/03/2019] Journal of Viral Hep. 2019;00:1-12. 2. Public Health England. Hepatitis C treatment monitoring in England (data to end April 2018). 2018. Available from:https://www.gov.uk/government/publications/hepatitis-c-treatment-monitoring-in-england [Accessed 18/02/2019]. 3. World Health Organization. Global health sector strategy on viral hepatitis, 2016-2021. Towards Ending Viral hepatitis. 2016. Available from: http://apps.who.int/iris/bitstream/10665/246177/1/WHO-HIV-2016.06-eng.pdf?ua=1. [Accessed: 01/03/2019]. 4. World Health Organization. Global Hepatitis report, 2017. Available from: http://www.who.int/hepatitis/publications/global-hepatitis-report2017/en/ [Accessed: 01/03/2019]. 5. Public Health England. Hepatitis C in England 2019 Headline Data Table. 2019. Available from:https://www.gov.uk/government/publications/hepatitis-c-in-the-uk. 6. Royal College of General Practitioners. Hepatitis B & C. 2019. Available from: http://elearning.rcgp.org.uk/course/info.php?id=279 [Accessed: 01/03/2019]. 7. Royal College of General Practitioners. Hepatitis C: Enhancing prevention, Testing and Care. 2015. Available from: http://elearning.rcgp.org.uk/course/search.php?search=Hepatitis+C%3A+ [Accessed: 01/03/2019]. 8. The Lancet HIV. Microelimination could be a big deal for HCV and HIV services. The Lancet HIV; 2018 [e605-e70]. Available from: https://www.thelancet.com/journals/lanhiv/article/PIIS2352-3018(18)30299-6/fulltext [Accessed: 01/03/2019]. 9. National Institute for Health and Clinical Excellence (NICE). Needle and syringe programmes. Public health guideline [PH52] 2014 [Available from: https://www.nice.org.uk/guidance/ph52 [Accessed: 01/03/2019]. 10. National Institute for Health and Clinical Excellence (NICE). Methadone and buprenorphine for the management of opioid dependence. Technology appraisal guidance [TA114] 2007 [Available from: https://www.nice.org.uk/Guidance/ta114 [Accessed: 01/03/2019]. 11. National Institute for Health and Clinical Excellence (NICE). Hepatitis B and C testing: people at risk of infection. NICE guidelines [PH43]. 2013. Available from: https://www.nice.org.uk/guidance/ph43. [Accessed 01/03/2019]
Hepatitis C in England: 2019 report
63
12. Department of Health. Clinical Guidelines on Drug Misuse and Dependence Update 2017. Independent Expert Working Group. 2017. Available from: https://www.gov.uk/government/publications/drug-misuse-and-dependence-uk-guidelines-on-clinical-management [Accessed: 01/03/2019]. 13. Chapko M, K. , Dufour DR, Hatia RI, Drobeniuc J, Ward JW, Teo CG. Cost-effectiveness of strategies for testing current hepatitis C virus infection. Hepatology. 2015;65(5):1396-404. 14. World Health Organization. Action plan for the health sector response to viral hepatitis in the WHO European Region. Regional Committee for Europe 66th Session, Copenhagen, Denmark, 12-15 September 2016. Available from: http://www.euro.who.int/en/about-us/governance/regional-committee-for-europe/66th-session/documentation/working-documents/eurrc6610-action-plan-for-the-health-sector-response-to-viral-hepatitis-in-the-who-european-region [Accessed 01/03/2019]. 15. Harris RJ, Ramsay M, Hope VD, Brant L, Hickman M, Foster GR, et al. Hepatitis C prevalence in England remains low and varies by ethnicity: an updated evidence synthesis. European Journal of Public Health. 2012;22(2):187-92. 16. Public Health England. Sentinel Surveillance of blood borne virus testing in England: 2017. 2018. Available at: https://www.gov.uk/government/publications/sentinel-surveillance-of-blood-borne-virus-testing-in-england-2017 [Accessed 18/02/2019] 17. Judd A, Parry J, Hickman M, McDonald T, Jordan L, Lewis K, et al. Evaluation of a modified commercial assay in detecting antibody to hepatitis C virus in oral fluids and dried blood spots. Journal of Medical Virology. 2003;71(1):49-55. 18. Public Health England. People who inject drugs: HIV and viral hepaitits unlinked anonymous monitoring survey tables (psychoactive): 2018 update. 2018. Available at: https://assets.publishing.service.gov.uk/government/uploads/system/uploads/attachment_data/file/729816/UAM_Survey_of_PWID_data_tables_2018.pdf [Accessed: 19/03/2019]. 19. Public Health England. Shooting Up Infections among people who injected drugs in the UK, 2015. An update: November 2016. 2016. Available from: https://www.gov.uk/government/uploads/system/uploads/attachment_data/file/567231/Shooting_Up_2016_Update.pdf. [Accessed 08/03/2019]. 20. Uddin G, Shoeb D, Solaiman S, Marley R, Gore C, Ramsay M, et al. Prevalence of chronic viral hepatitis in people of south Asian ethncity living in England: the prevalence cannot necessarily be predicted from the prevalence in the country of origin. Journal of Viral Hepatitis. 2010;17:327-35. 21. Public Health England. Hepatitis C in England 2018. 2018. Available from: https://assets.publishing.service.gov.uk/government/uploads/system/uploads/attachment_data/file/693917/HCV_in_England_2018.pdf. [Accessed 01/03/2019]. 22. National Institute for Health and Clinical Excellence (NICE). Simeprevir in combination with peginterferon alfa and ribavirin for treating genotypes 1 and 4 chronic hepatitis C. NICE technology appraisal guidance TA331. 2015. Available from: http://www.nice.org.uk/guidance/ta331. [Accessed 09/07/2018].
Hepatitis C in England: 2019 report
64
23. National Institute for Health and Clinical Excellence (NICE). Sofosbuvir for treating chronic hepatitis C. NICE technology appraisal guidance TA330. 2015. Available from:https://www.nice.org.uk/guidance/ta330 [Accessed 08/03/2019]. 24. National Institute for Health and Clinical Excellence (NICE). Ombitasvir–paritaprevir–ritonavir with or without dasabuvir for treating chronic hepatitis C. NICE technology appraisal guidance [TA365]. 2015. Available from: https://www.nice.org.uk/guidance/ta365. [Accessed 08/03/2019] 25. National Institute for Health and Clinical Excellence (NICE). Daclatasvir for treating chronic hepatitis C. 2015. Available from: https://www.nice.org.uk/guidance/ta364. [Accessed 09/07/2018] 26. National Institute for Health and Clinical Excellence (NICE). Ledipasvir–sofosbuvir for treating chronic hepatitis C. 2015. Available from: https://www.nice.org.uk/guidance/ta363. [Accessed 08/03/2019] 27. National Institute for Health and Clinical Excellence (NICE). Sofosbuvir–velpatasvir for treating chronic hepatitis C. 2017. Available from: https://www.nice.org.uk/guidance/ta430 [Accessed 08/03/2019] 28. National Institute for Health and Clinical Excellence (NICE). Elbasvir–grazoprevir for treating chronic hepatitis C. 2016. Available from: https://www.nice.org.uk/guidance/TA413/chapter/2-The-technology [Accessed 08/03/2019] 29. National Institute for Health and Clinical Excellence (NICE). Glecaprevir–pibrentasvir for treating chronic hepatitis C. Technology appraisal guidance [TA499]. 2018. Available from: https://www.nice.org.uk/guidance/ta499. [Accessed 08/03/2019] 30. National Institute for Health and Clinical Excellence (NICE). Sofosbuvir–velpatasvir–voxilaprevir for treating chronic hepatitis C. Technology appraisal guidance [TA507]. 2018. Available from: https://www.nice.org.uk/guidance/ta507 [Accessed 08/03/2019]. 31. NHS England. Clinical Commissioning Policy Statement: Treatment of chronic Hepatitis C in patients with cirrhosis. Available from: https://www.england.nhs.uk/commissioning/wp-content/uploads/sites/12/2015/06/hep-c-cirrhosis-polcy-statmnt-0615.pdf. [Accessed 08/03/2019]. 2015. Report No: NHS England B07/P/a. 32. King R, Bird SM, Overstall AM, Hay G, Hutchinson SJ. Estimating prevalence of injecting drug users and associated heroin-related death rates in England by using regional data and incorporating prior information. Journal of Royal Statistical Society (Series A) Statistical Society. 2014;177(1):209–36. 33. Hay G, Gannon M, MacDougall J, Millar T, Eastwood C, McKeganey N. National and regional estimates of the prevalence of opiate use and/or crack cocaine use 2005/06: a summary of key findings. Research Development and Statistics Directorate, Home Office. Home Office Online Report 21/07. 2007. Available from: http://webarchive.nationalarchives.gov.uk/20110218135832/rds.homeoffice.gov.uk/rds/pdfs07/rdsolr2107.pdf. [Accessed 08/03/2019].

Hepatitis C in England: 2019 report
65
34. Jones HE, Welton NJ, Ades AE, Pierce M, Davies W, Coleman B, et al. Problem drug use prevalence estimation revisited: Heterogeneity in capture-recapture and the role of external evidence. Addiction. 2016;111(3):438–47. 35. Hay G, Rael dos Santos A, Worsley J. Estimates of the Prevalence of Opiate Use and/or Crack Cocaine Use, 2011/12: Sweep 8 report. 2014. Liverpool John Moores University. Available from: http://www.nta.nhs.uk/facts-prevalence.aspx. [Accessed 16/03/2018]. 36. Public Health England. Hepatitis C in the UK 2015 report. 2015. Available at: https://www.gov.uk/government/uploads/system/uploads/attachment_data/file/448710/NEW_FINAL_HCV_2015_IN_THE_UK_REPORT_28072015_v2.pdf. [Accessed 08/03/2019]. 37. Public Health England. Hepatitis C in the UK 2017. 2017. Available from: https://www.gov.uk/government/publications/hepatitis-c-in-the-uk. [Accessed 08/03/2019]. 38. Cullen KJ, Hope VD, Croxford S, Shute J, Ncube F, Parry JV. Factors associated with recently acquired hepatitis C virus infection in people who inject drugs in England, Wales and Northern Ireland: new findings from an unlinked anonymous monitoring survey. Epidemiology and Infection. 2015;143(7):1398-407. 39. Health Protection Agency. Health Protection Agency (HPA). Hepatitis C in the UK 2008. Health Protection Agency Centre for Infections. 2008. Available from: http://webarchive.nationalarchives.gov.uk/20140722091854/http://www.hpa.org.uk/Publications/InfectiousDiseases/BloodBorneInfections/HepatitisCInTheUK/ [Accessed 08/03/2019]. 40. Public Health England. People who Inject drugs: HIV and viral hepatitis monitoring. Unlinked Anonymous Monitoring survey. 2017. Available from: https://www.gov.uk/government/statistics/people-who-inject-drugs-hiv-and-viral-hepatitis-monitoring [Accessed 08/03/2019]. 41. Health Protection Agency, Department of Health, Chartered Institute of Environmental Health. Health Protection Legislation (England) - Guidance 2010. 2010. Available from: www.gov.uk/government/organisations/public-health-england/about/our-governance [Accessed 20/02/2018]. 42. Martin NK, Vickerman P, Foster GR, Hutchinson SJ, Goldberg DJ, Hickman M. Can antiviral therapy for hepatitis C reduce the prevalence of HCV among injecting drug user populations? A modeling analysis of its prevention utility. Journal of Hepatology. 2011;54(6):1137-44. 43. Hagan H, Pouget E, Jarlais DC. A systematic Review and Meta-Analysis of Interventions to Prevent Hepatitis C Virus Infection In People Who Inject Drugs. Journal of Infectious Diseases. 2011;204:74-83. 44. Turner K, Hutchinson S, Vickerman P, Hope V, Craine N, Palmateer N, et al. The impact of needle and syringe provision and opiate substitution therapy on the incidence of Hepatitis C virus in injecting drug users: pooling of UK evidence. Addiction. 2011;106(11):1978-88.
Hepatitis C in England: 2019 report
66
45. Allen EJ, Palmateer NE, Hutchinson SJ, Cameron S, Goldberg DJ, Taylor A. Association between harm reduction intervention uptake and recent hepatitis C infection among people who inject drugs attending sites that provide sterile injecting equipment in Scotland. International Journal of Drug Policy. 2012;23(5):346-52. 46. Martin NK, Vickerman P, Grebely J, Hellard M, Hutchinson SJ, Lima VD, et al. HCV treatment for prevention among people who inject drugs: Modeling treatment scale-up in the age of direct-acting antivirals. Hepatology. 2013;58(5):1598-609. 47. Palmateer NE, Taylor A, Goldberg DJ, Munro A, Aitken C, Shepherd SJ, et al. Rapid decline in HCV incidence among people who inject drugs associated with national scale-up in coverage of a combination of harm reduction interventions. PLoS One. 2014;9(8):e104515. 48. Platt L MS, Reed J, Vickerman P, Hagan H, French C, Jordan A, Degenhardt L, Hope V, Hutchinson S, Maher L, Palmateer N, Taylor A, Bruneau J, Hickman M. Needle syringe programmes and opioid substitution therapy for preventing hepatitis C transmission in people who inject drugs. Cochrane Database of Systematic Reviews 2017. 2017(9). 49. Sweeney S WZ, Platt L, Guinness L, Hickman M, Hope V, Maher L, Iversen J, Hutchinson SJ, Smith J, Ayres R, Hainey I, Vickerman P. Evaluating the cost-effectiveness of existing needle and syringe programmes in preventing hepatitis C transmission in people who inject drugs. Addiction. 2019;Mar;114 (3):560-70. 50. Public Health England. Unlinked Anonymous Monitoring Survey of People Who Inject Drugs: data tables. July 2018. London, Public Health England. Available at: https://www.gov.uk/government/publications/people-who-inject-drugs-hiv-and-viral-hepatitis-monitoring. 51. Public Health England. Shooting Up: Infections among people who inject drugs in the UK, 2016. An update, November 2017. Shooting Up: Infections among people who inject drugs in the UK, 2016 An update, November 2017. Available from: https://www.gov.uk/government/uploads/system/uploads/attachment_data/file/663003/Shooting_Up_2017_report.pdf [Accessed: 08/03/2019]. 52. All-Party Parliamentary Group. Eliminating Hepatitis C in England. All-Party Parliamentary Group on Liver Health Inquiry Report. 2018. Available at: http://www.appghep.org.uk/download/reports/Eliminating%20Hep%20C%20APPG.pdf [Accessed: 19/03/2019]. 53. Public Health England. Public Health England. Shooting Up: Infections among people who injected drugs in the UK, 2017. An update: November 2018. Available from: https://assets.publishing.service.gov.uk/government/uploads/system/uploads/attachment_data/file/756502/Shooting_up_2018.pdf [Accessed 19/03/2019]. 54. Public Health England. Hepatitis C: patient re-engagement exercise. 2018. Available from: https://www.gov.uk/government/publications/hepatitis-c-patient-re-engagement-exercise [ Accessed: 08/03/2019].

Hepatitis C in England: 2019 report
67
55. Public Health England. Adults – drugs commissioning support pack 2018-19: principles and indicators. Planning for drug prevention, treatment and recovery in adults. 2017. Available from: https://www.gov.uk/government/publications/alcohol-drugs-and-tobacco-commissioning-support-pack [Accessed: 08/03/2019]. 56. Public Health England. Improving access to, and completion of, hepatitis C treatment. Available from: https://www.gov.uk/government/publications/treating-substance-misuse-and-related-harm-turning-evidence-into-practice/improving-access-to-hepatitis-c-treatment-turning-evidence-into-practice [Accessed 08/03/2019]. 2015. 57. Stewart D. The Problems and needs of newly sentenced prisoner: results from a national survey. Ministry of Justice; 2008. Available from: http://webarchive.nationalarchives.gov.uk/20100505212400/http://www.justice.gov.uk/publications/docs/research-problems-needs-prisoners.pdf [Accessed 08/03/2019]. 58. Ministry of Justice. Gender differences in substance misuse and mental health issuess among prisoners, 2013. Results from the Surveying Prisoner Crime Reduction (SPCR) longitudinal cohort study of prisoners. 2013. Available from: www.gov.uk/government/uploads/system/uploads/attachment_data/file/220060/gender-substance-misuse-mental-health-prisoners.pdf [Accessed 08/03/2019]. 59. NHS England. National Partnership Agreement between: The National Offender Management Service, NHS England and Public Health England for the Co-Commissioning and Delivery of Healthcare Services in Prisons in England 2015-2016. 2014. Available from: https://www.gov.uk/government/uploads/system/uploads/attachment_data/file/460445/national_partnership_agreement_commissioning-delivery-healthcare-prisons_2015.pdf [Accessed 08/03/2019]. 60. Public Health England. Infection Inside International. Quarterly publication from PHE on public health in prisons and other places of detention with a global focus. Availalbe from: https://assets.publishing.service.gov.uk/government/uploads/system/uploads/attachment_data/file/731240/Infection_Inside_Vol_14_Issue_2.pdf [Accessed 18/02/2019]. 2018 Contract No: 2. 61. Cummins CWH, Cheng K, Maric R, Silcoks P, Varghese C. An assessment of the Nam Pehchan computer program for the identification of names of south Asian ethnic origin. Journal of Public Health Medicine. 1999;21(4):401-6. 62. ONOMAP. 2012. Available from www.onomap.org [Accessed 08/03/2019]. 63. Graham CS, Baden LR, Yu, Mrus JM, Carnie J, Heeren T, et al. Influence of Human Immunodeficiency Virus Infection on the Course of Hepatitis C Virus Infection:A Meta-Analysis. Clinical Infectious Diseases. 2001;33:562-9. 64. Benhamou Y BM, Di V M, Charlotte F, Azria F, Coutellier a, et al. Liver fibrosis progression in human immunodeficiency virus and hepatitis C virus coinfected patients. The Multivirc Group. Hepatology, 1999;30(0270–9139):1054–8. 65. Ireland G DV, Kirwan P, Croxford S, Lattimore S, Sabin C, Porter K, Mandal S, Simmons R. Prevalence of diagnosed HIV infection among persons with hepatitis C virus infection: England. HIV Medicine. 2018;19(10):708-15.
Hepatitis C in England: 2019 report
68
66. Simmons R, Ireleand, G., Irving W., Hickman M., Sabin, C., Ijaz, S., Ramsay, M., Lattimore, S., Mandal, S. Establishing the cascade of care for hepatitis C in England-benchmarking to monitor impact of direct acting antivirals. Journal of Viral Hep. 2018:1-9. 67. Harris RJ, Thomas B, Griffiths J, Costella A, Chapman R, M R. Increased uptake and new therapies are needed to advert rising hepatitis C- related end stage liver disease in England: modelling the predicated impact of treatment under different scenarios. Journal of Hepatology. 2014;61(3):530-7. 68. Harris RJ, Martin, N. K., Rand E, Mandal S, Mutimer D, Vickerman P, Ramsay ME, et al. New treatments for hepatitis C virus (HCV): scope for preventing liver disease and HCV transmission in England. Journal of Viral Hepatitis. 2016(8):631-43. 69. NHS England. Interim Clinical Commissioning Policy Statement: Sofosbuvir + Daclatasvir/Ledipasvir +/- Ribivirin for defined patients with Hepatitis C. April 2014. Available from: http://www.natap.org/2014/HCV/sofosbuvir-pol-stat.pdf [Accessed 08/03/2019]. 2014. Report No: NHS England A02/PS/b. 70. NHS England. Commissioning for Quality and Innovation. 2018. Available from: https://www.england.nhs.uk/nhs-standard-contract/cquin/ [Accessed 08/03/2019]. 71. Innes HA. HS, Allen S, Bhattacharyya D, Bramley P, Delahooke TES, et al. Excess liver-related morbidity of chronic hepatitis C patients, who achieve a sustained viral response, and are discharged from care. Hepatology. 2011;54(5):1547-58. 72. EASL. European Association for the Study of the Liver. EASL Recommendations on Treatment of Hepatitis C 2018. Available from: https://doi.org/10.1016/j.jhep.2018.03.026 [Accessed 24/09/2018]. Journal of Hepatology. 2018;69(26):461-511. 73. World Health Organization. WHO, UNODC, UNAIDS technical guide for countries to set targets for universal access to HIV prevention, treatment and care for injecting drug users – 2012 revision. 2013. Available from: http://www.who.int/hiv/pub/idu/targets_universal_access/en/. [Accessed: 09/07/2018]. 74. Joint United Kingdom (UK) Blood Transfusion and Tissue Transplantation Services Professional Advisory Committee. Guidelines for the Blood Transfusion Services in the UK. Available from: http://www.transfusionguidelines.org/ [Accessed 09/07/2018]. 75. European Agency for Safety and Health at Work. Directive 2010/32/EU - prevention from sharp injuries in the hospital and healthcare sector. 2010. Available from: https://osha.europa.eu/en/legislation/directives/council-directive-2010-32-eu-prevention-from-sharp-injuries-in-the-hospital-and-healthcare-sector. [Accessed 08/03/2019].


![Hepatitis B virus and hepatitis C virus play different ... · alcoholic cirrhosis, hepatitis viruses, tobacco and metabolic diseases[4]. Hepatitis viruses, including hepatitis B virus](https://static.fdocuments.in/doc/165x107/60e46cab5bd9101a6f539e91/hepatitis-b-virus-and-hepatitis-c-virus-play-different-alcoholic-cirrhosis.jpg)