
Hemodynamics Lecture ARMC
68
Hemodynamics Hemodynamics Opal Dy RN BSN Opal Dy RN BSN ARMC SICU ARMC SICU
-
Upload
osdccrn -
Category
Health & Medicine
-
view
610 -
download
1
Transcript of Hemodynamics Lecture ARMC

HemodynamicsHemodynamics
Opal Dy RN BSNOpal Dy RN BSNARMC SICUARMC SICU

DefinitionDefinition
• Invasive: The use of invasive monitoring equipment to Invasive: The use of invasive monitoring equipment to augment and verify hemodynamic assessments.augment and verify hemodynamic assessments.
• Non-invasive: The use of CRITICAL THINKING skills Non-invasive: The use of CRITICAL THINKING skills during assessment to determine hemodynamic status.during assessment to determine hemodynamic status.
Hemodynamic PrinciplesHemodynamic Principles
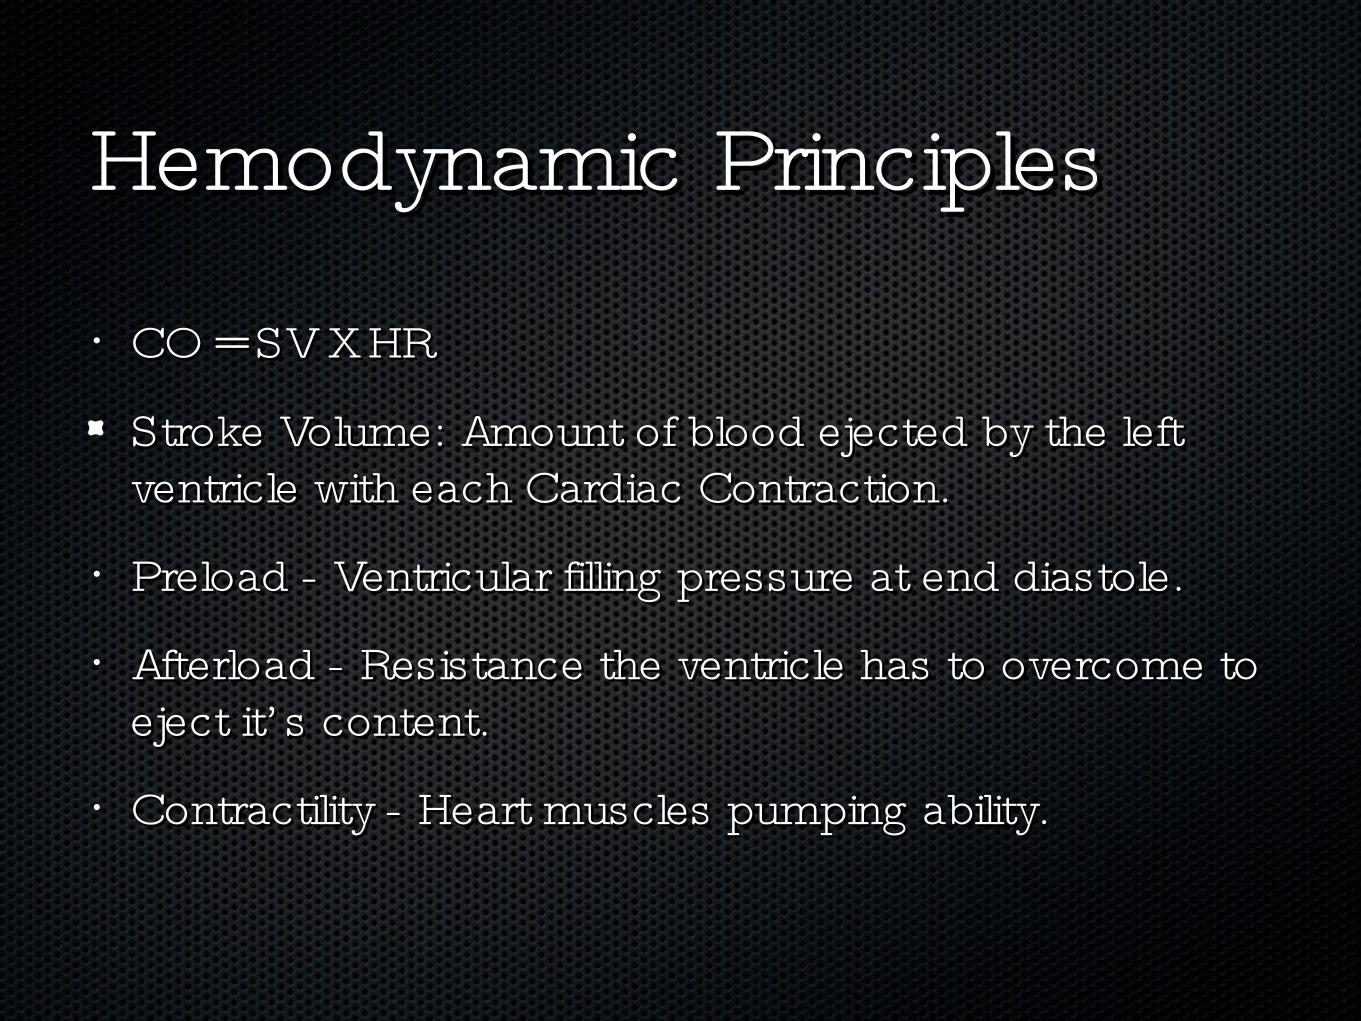
• CO = SV X HRCO = SV X HR
Stroke Volume: Amount of blood ejected by the left Stroke Volume: Amount of blood ejected by the left ventricle with each Cardiac Contraction.ventricle with each Cardiac Contraction.
• Preload - Ventricular filling pressure at end diastole.Preload - Ventricular filling pressure at end diastole.• Afterload - Resistance the ventricle has to overcome to Afterload - Resistance the ventricle has to overcome to
eject it’ s content.eject it’ s content.• Contractility - Heart muscles pumping ability.Contractility - Heart muscles pumping ability.

Skin and GutSkin and Gut• The first “ things to go” when CO fallsThe first “ things to go” when CO falls
Indicators of diminished blood supply are:Indicators of diminished blood supply are:• Cool, clammy skinCool, clammy skin• Pale, ashen or cyanotic skin colorPale, ashen or cyanotic skin color
Diminished bowel soundsDiminished bowel sounds• Diarrhea or constipationDiarrhea or constipation
Increased NG tube drainageIncreased NG tube drainage
Kidneys and LungsKidneys and Lungs
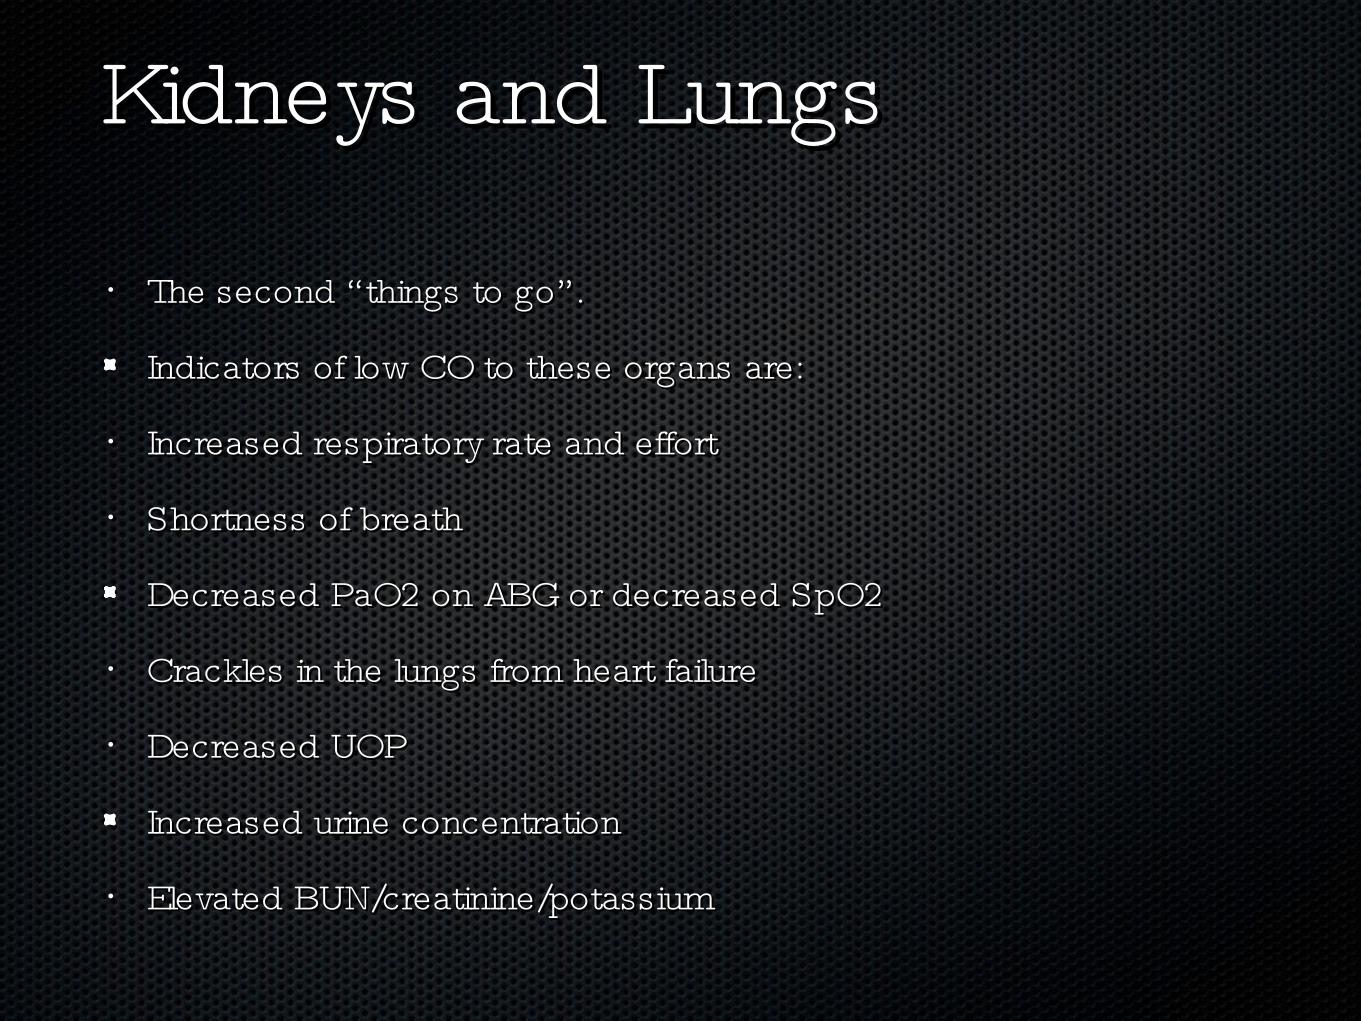
• The second “ things to go” .The second “ things to go” .
Indicators of low CO to these organs are:Indicators of low CO to these organs are:
• Increased respiratory rate and effortIncreased respiratory rate and effort
• Shortness of breathShortness of breath
Decreased PaO2 on ABG or decreased SpO2Decreased PaO2 on ABG or decreased SpO2
• Crackles in the lungs from heart failureCrackles in the lungs from heart failure
• Decreased UOPDecreased UOP
Increased urine concentrationIncreased urine concentration
• Elevated BUN/creatinine/potassiumElevated BUN/creatinine/potassium
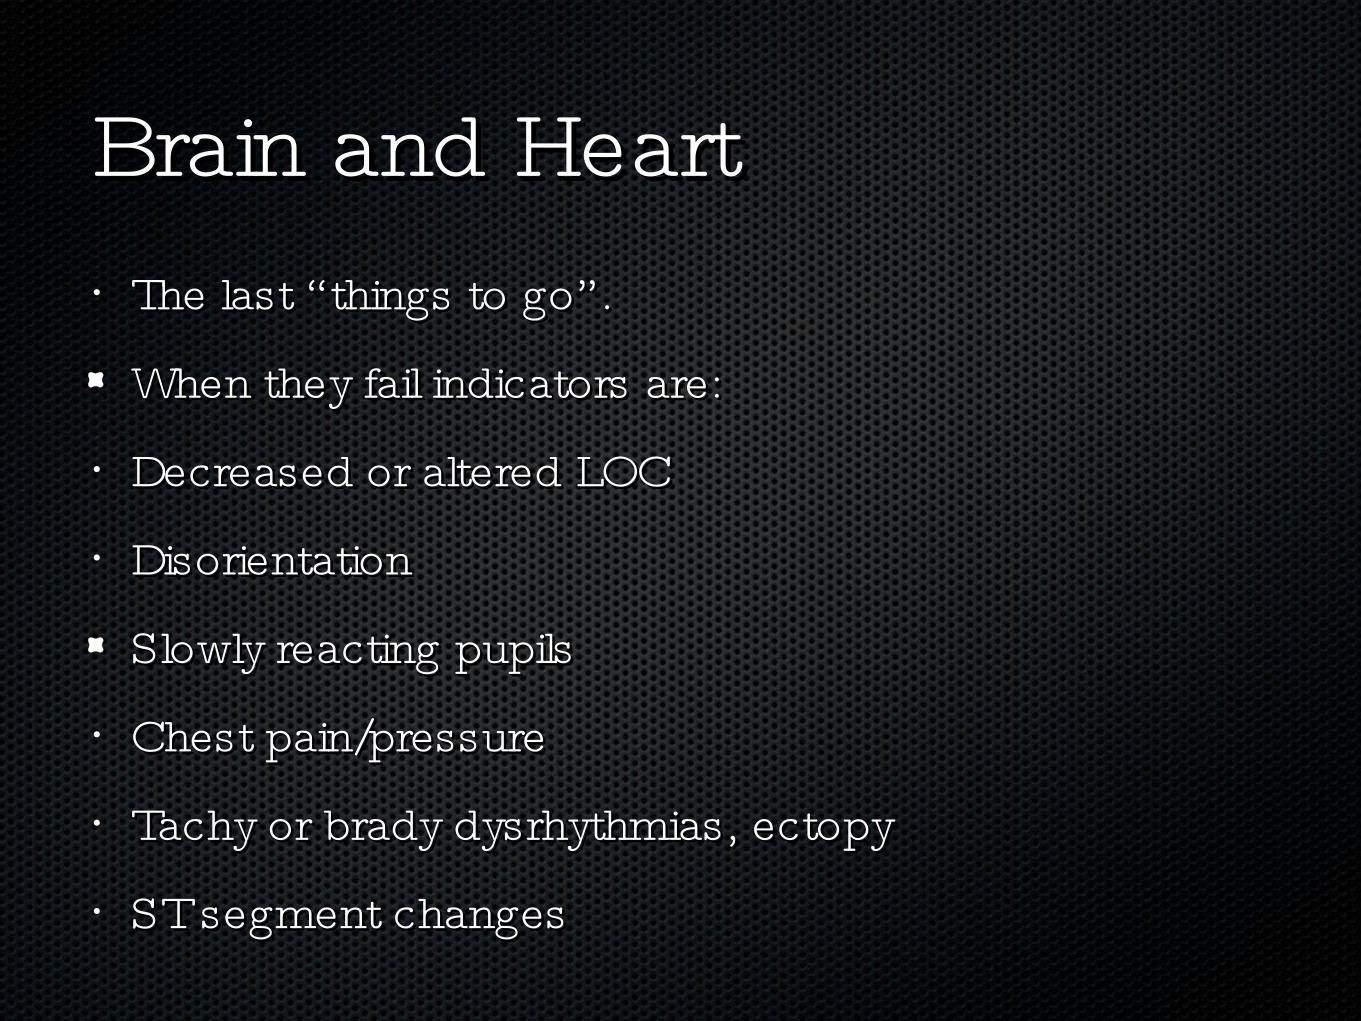
Brain and HeartBrain and Heart• The last “ things to go” .The last “ things to go” .
When they fail indicators are:When they fail indicators are:• Decreased or altered LOCDecreased or altered LOC• DisorientationDisorientation
Slowly reacting pupilsSlowly reacting pupils• Chest pain/pressureChest pain/pressure• Tachy or brady dysrhythmias, ectopyTachy or brady dysrhythmias, ectopy• ST segment changesST segment changes
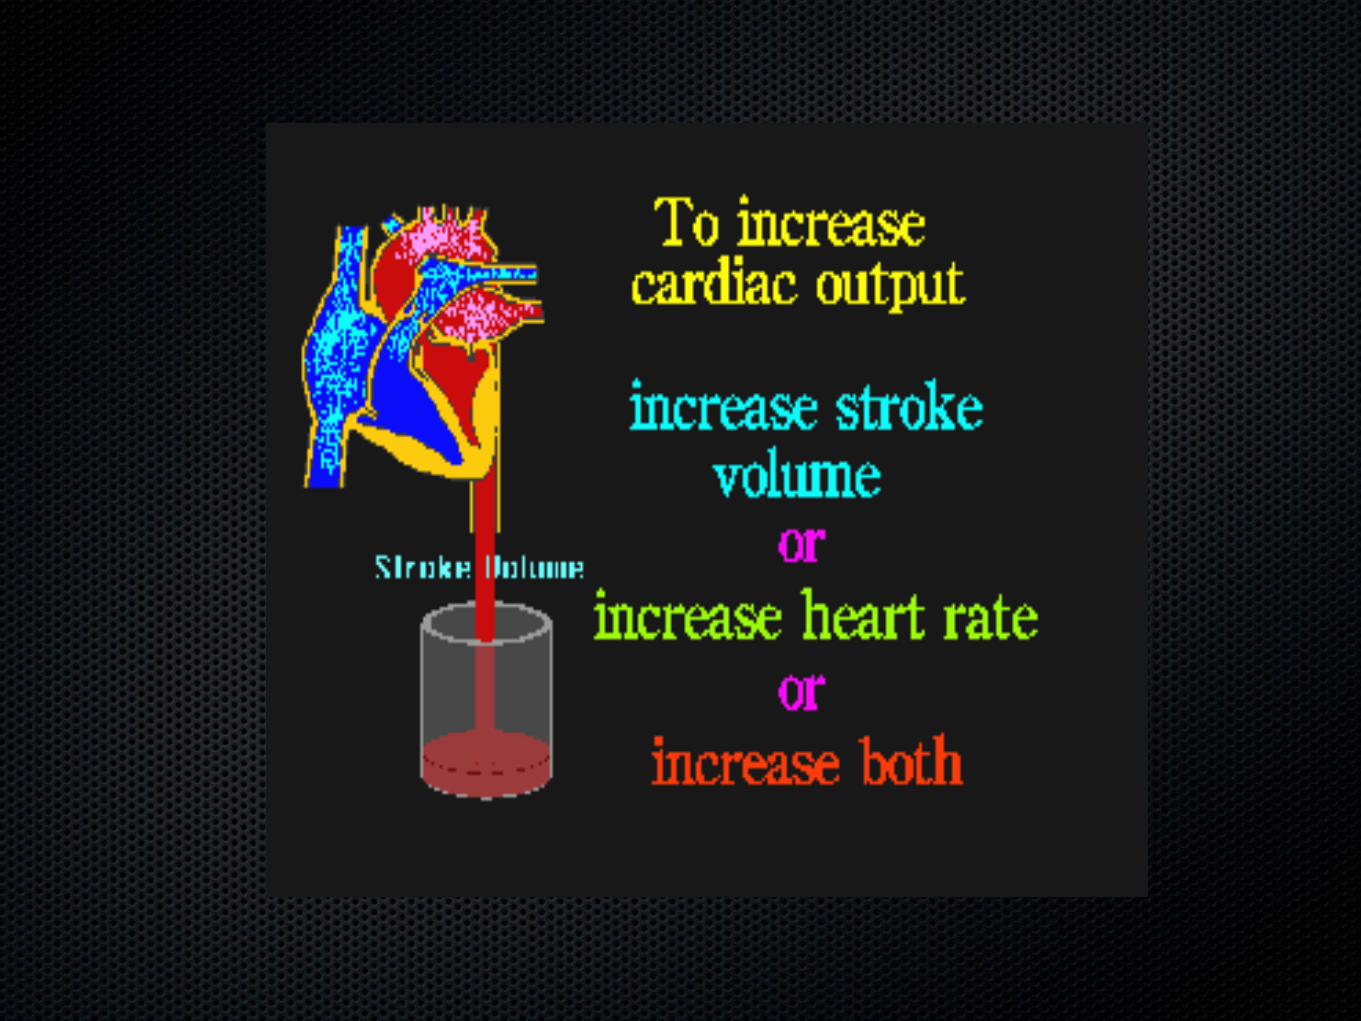
Cardiac OutputCardiac Output
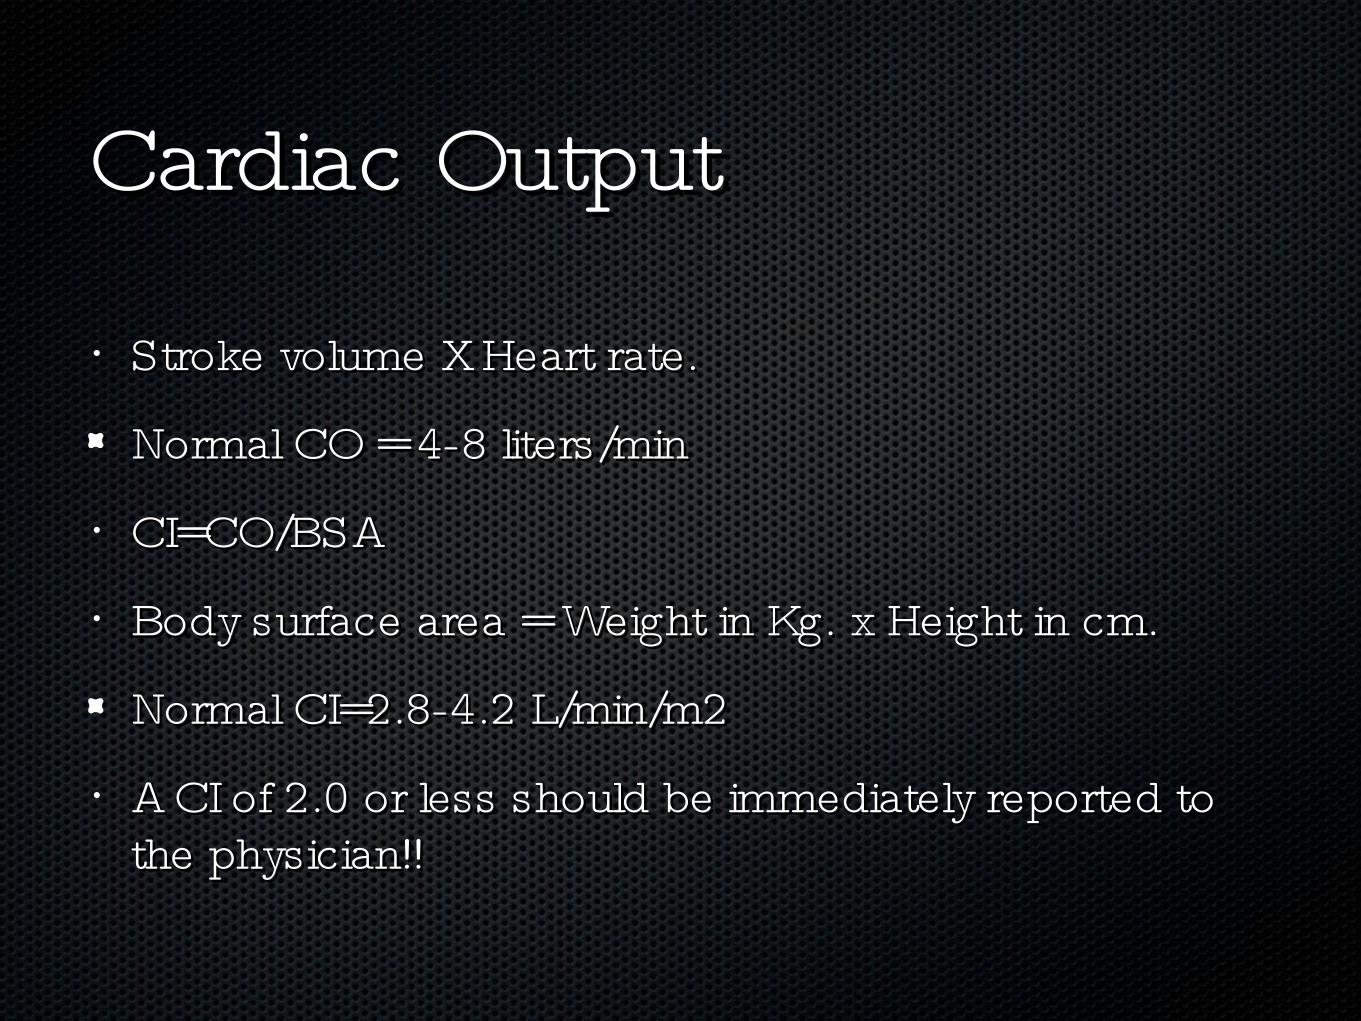
• Stroke volume X Heart rate.Stroke volume X Heart rate.
Normal CO = 4-8 liters/minNormal CO = 4-8 liters/min• CI=CO/BSACI=CO/BSA• Body surface area = Weight in Kg. x Height in cm.Body surface area = Weight in Kg. x Height in cm.
Normal CI=2.8-4.2 L/min/m2Normal CI=2.8-4.2 L/min/m2• A CI of 2.0 or less should be immediately reported to A CI of 2.0 or less should be immediately reported to
the physician!!the physician!!
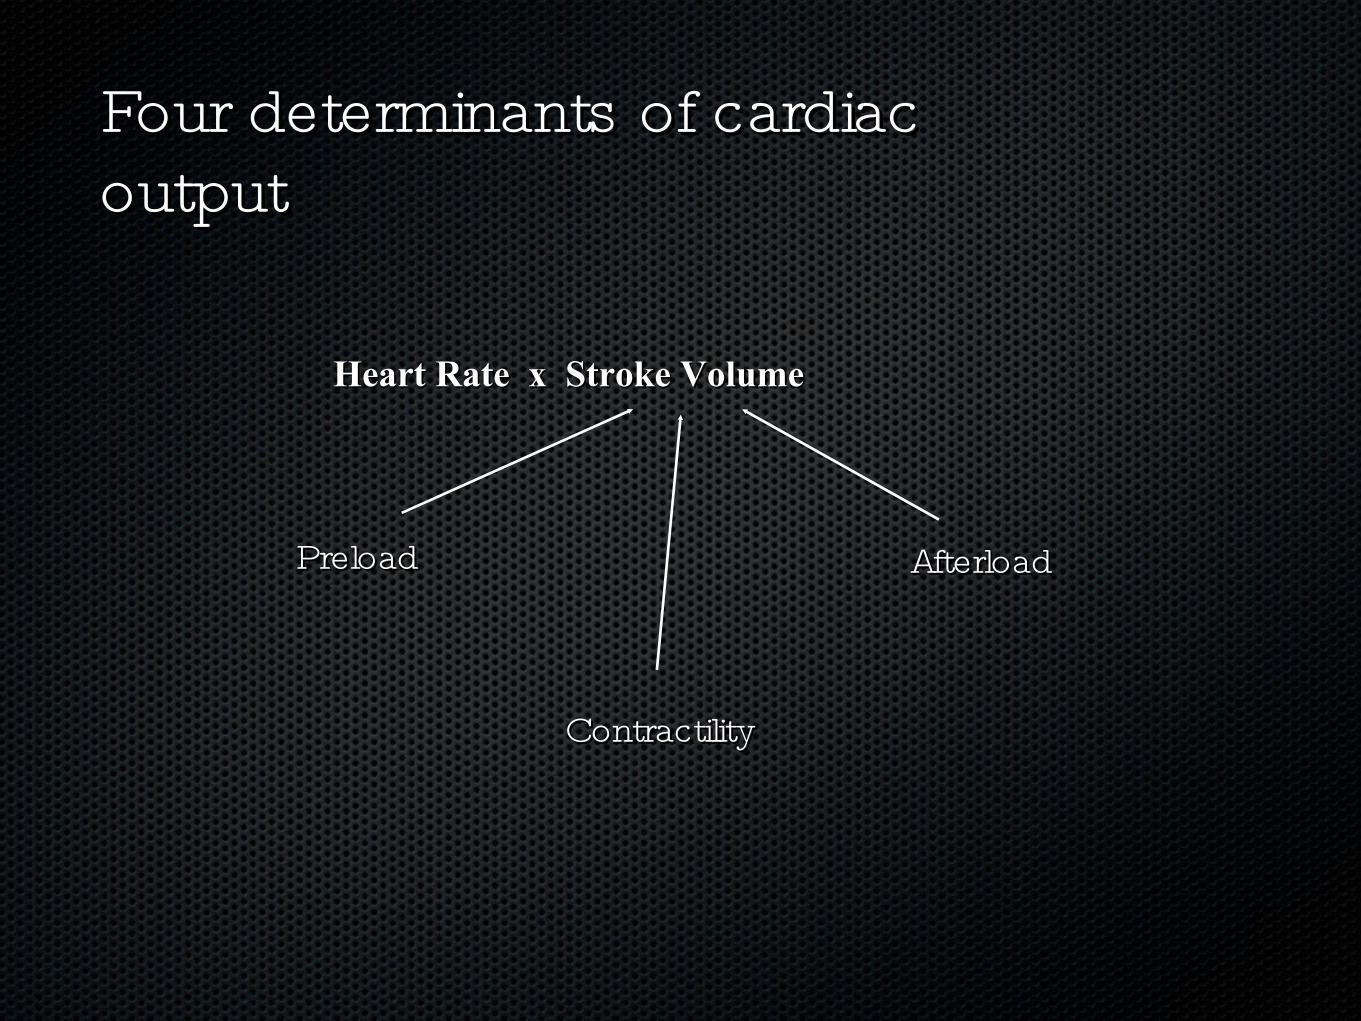
Four determinants of cardiac Four determinants of cardiac outputoutput
Heart Rate x Stroke VolumeHeart Rate x Stroke Volume
ContractilityContractility
AfterloadAfterloadPreloadPreload
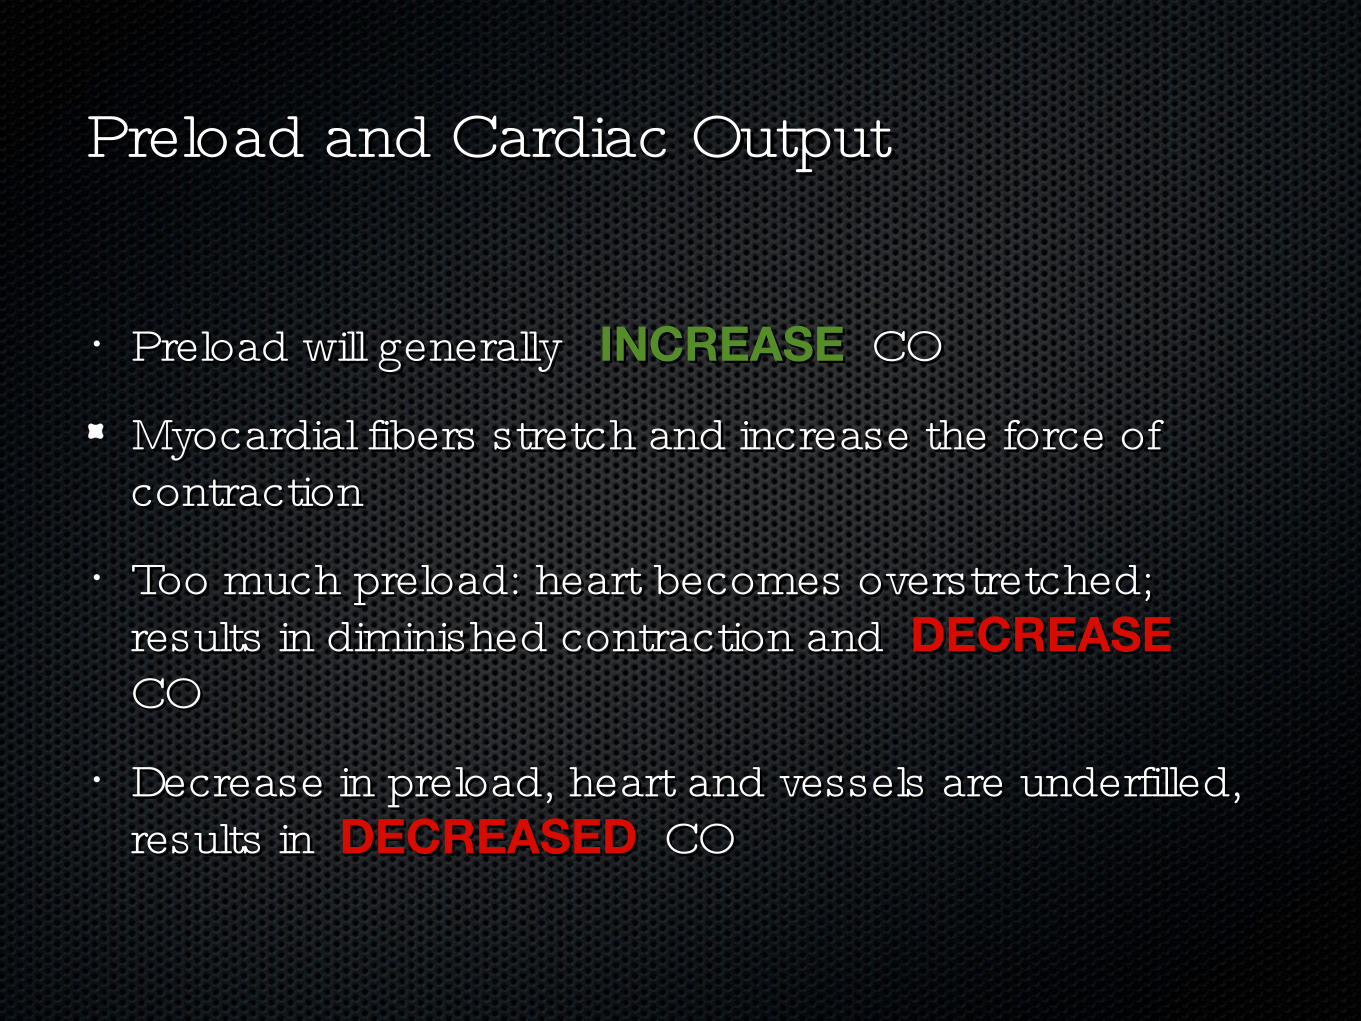
Preload and Cardiac OutputPreload and Cardiac Output
• Preload will generally Preload will generally INCREASEINCREASE CO CO
Myocardial fibers stretch and increase the force of Myocardial fibers stretch and increase the force of contractioncontraction
• Too much preload: heart becomes overstretched; Too much preload: heart becomes overstretched; results in diminished contraction and results in diminished contraction and DECREASEDECREASE COCO
• Decrease in preload, heart and vessels are underfilled, Decrease in preload, heart and vessels are underfilled, results in results in DECREASEDDECREASED CO CO
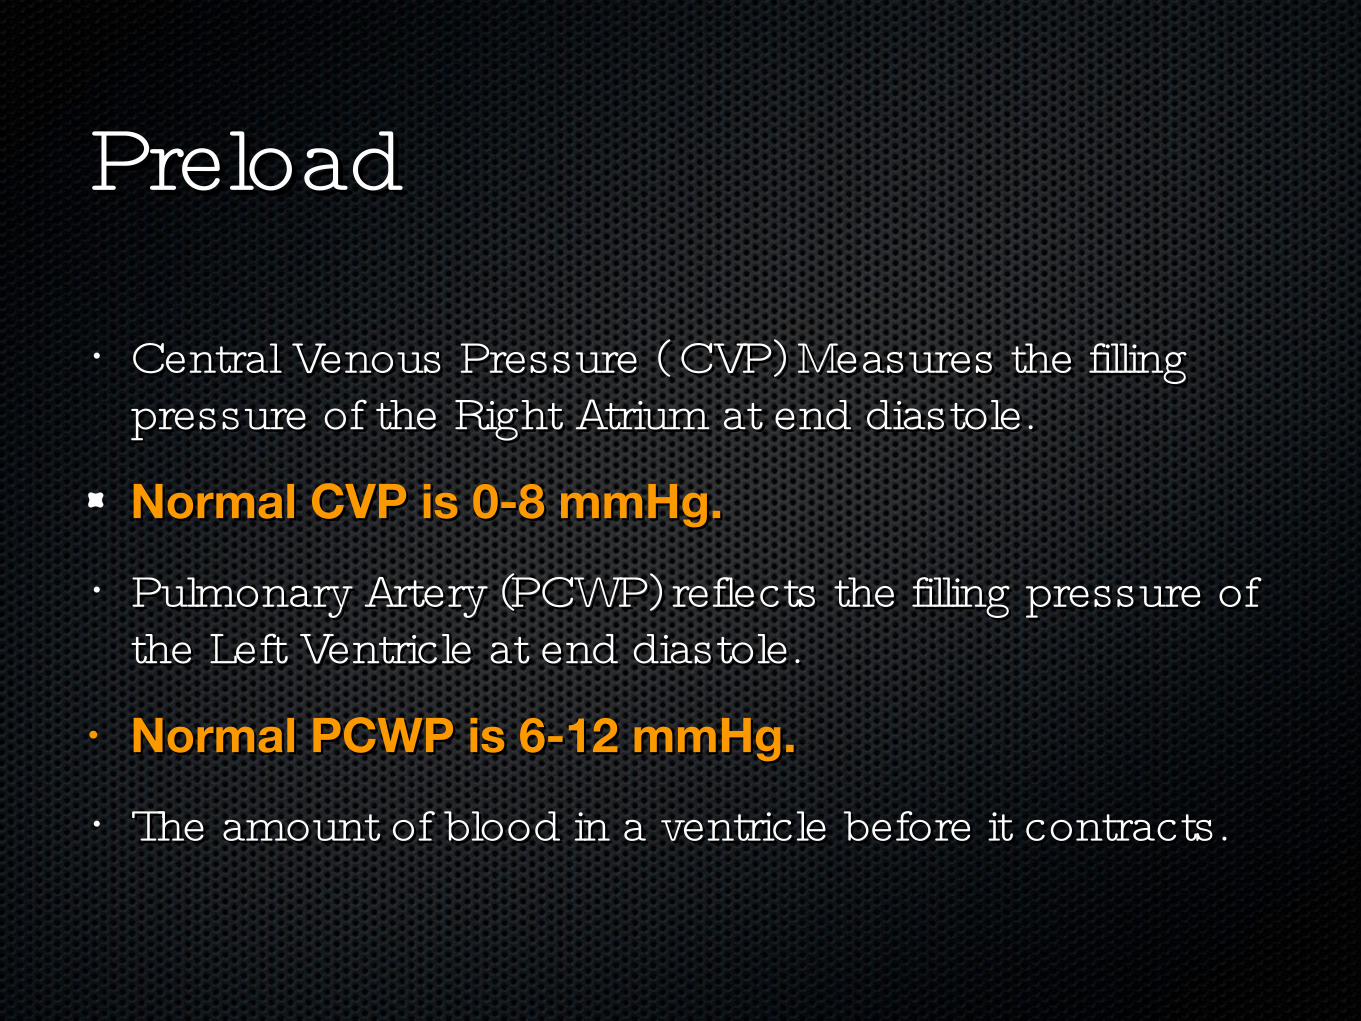
PreloadPreload
• Central Venous Pressure ( CVP) Measures the filling Central Venous Pressure ( CVP) Measures the filling pressure of the Right Atrium at end diastole. pressure of the Right Atrium at end diastole.
Normal CVP is 0-8 mmHg.Normal CVP is 0-8 mmHg.
• Pulmonary Artery (PCWP) reflects the filling pressure of Pulmonary Artery (PCWP) reflects the filling pressure of the Left Ventricle at end diastole.the Left Ventricle at end diastole.
• Normal PCWP is 6-12 mmHg. Normal PCWP is 6-12 mmHg.
• The amount of blood in a ventricle before it contracts.The amount of blood in a ventricle before it contracts.
Low CVPLow CVP
• Decreased Venous return to the heart.Decreased Venous return to the heart.
Hypovolemia.Hypovolemia.• Volume LossVolume Loss

Elevated CVPElevated CVP
• Fluid Overload.Fluid Overload.
Heart Failure.Heart Failure.• Cardiac Tamponade.Cardiac Tamponade.• Tricuspid valve Regurgitation.Tricuspid valve Regurgitation.• Increased Intrathoracic/Pulmonic pressures.Increased Intrathoracic/Pulmonic pressures.
Left Heart PreloadLeft Heart Preload• The amount of blood in the LV at the end of diastoleThe amount of blood in the LV at the end of diastole
Measured by the pulmonary capillary wedge pressure Measured by the pulmonary capillary wedge pressure (PCWP)(PCWP)
• Normal PCWP 6-12Normal PCWP 6-12• Obtained when PA balloon is inflated.Obtained when PA balloon is inflated.• This blocks off all pressures from right side and all the This blocks off all pressures from right side and all the
PA catheter “ see” is the filling pressure of Left side of PA catheter “ see” is the filling pressure of Left side of heart.heart.
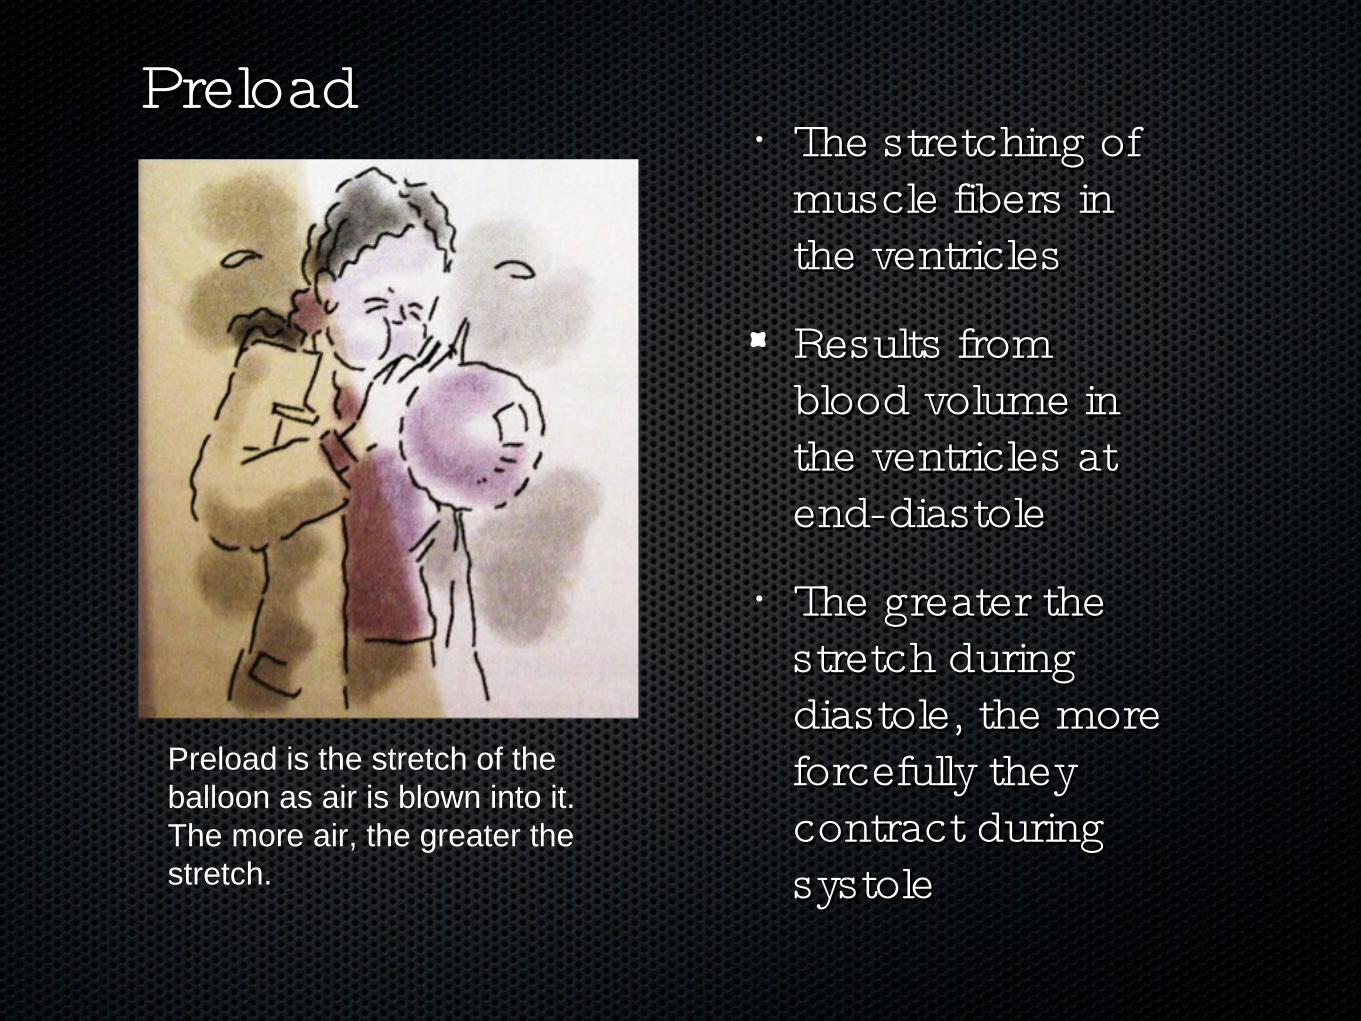
Preload is the stretch of the balloon as air is blown into it. The more air, the greater the stretch.
• The stretching of The stretching of muscle fibers in muscle fibers in the ventriclesthe ventricles
Results from Results from blood volume in blood volume in the ventricles at the ventricles at end-diastoleend-diastole
• The greater the The greater the stretch during stretch during diastole, the more diastole, the more forcefully they forcefully they contract during contract during systolesystole
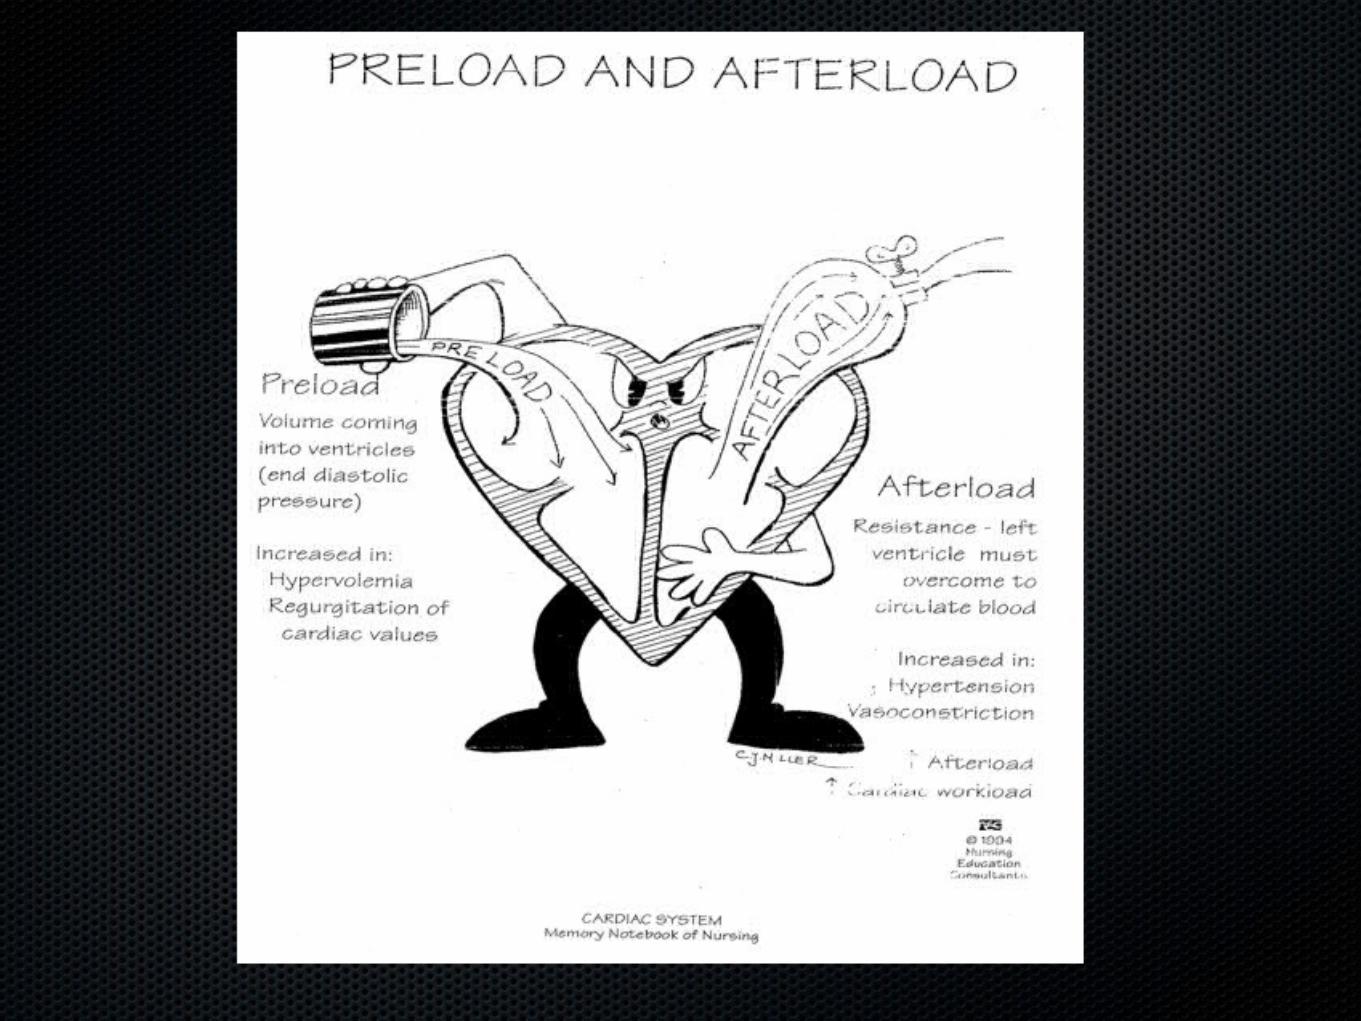
PreloadPreload
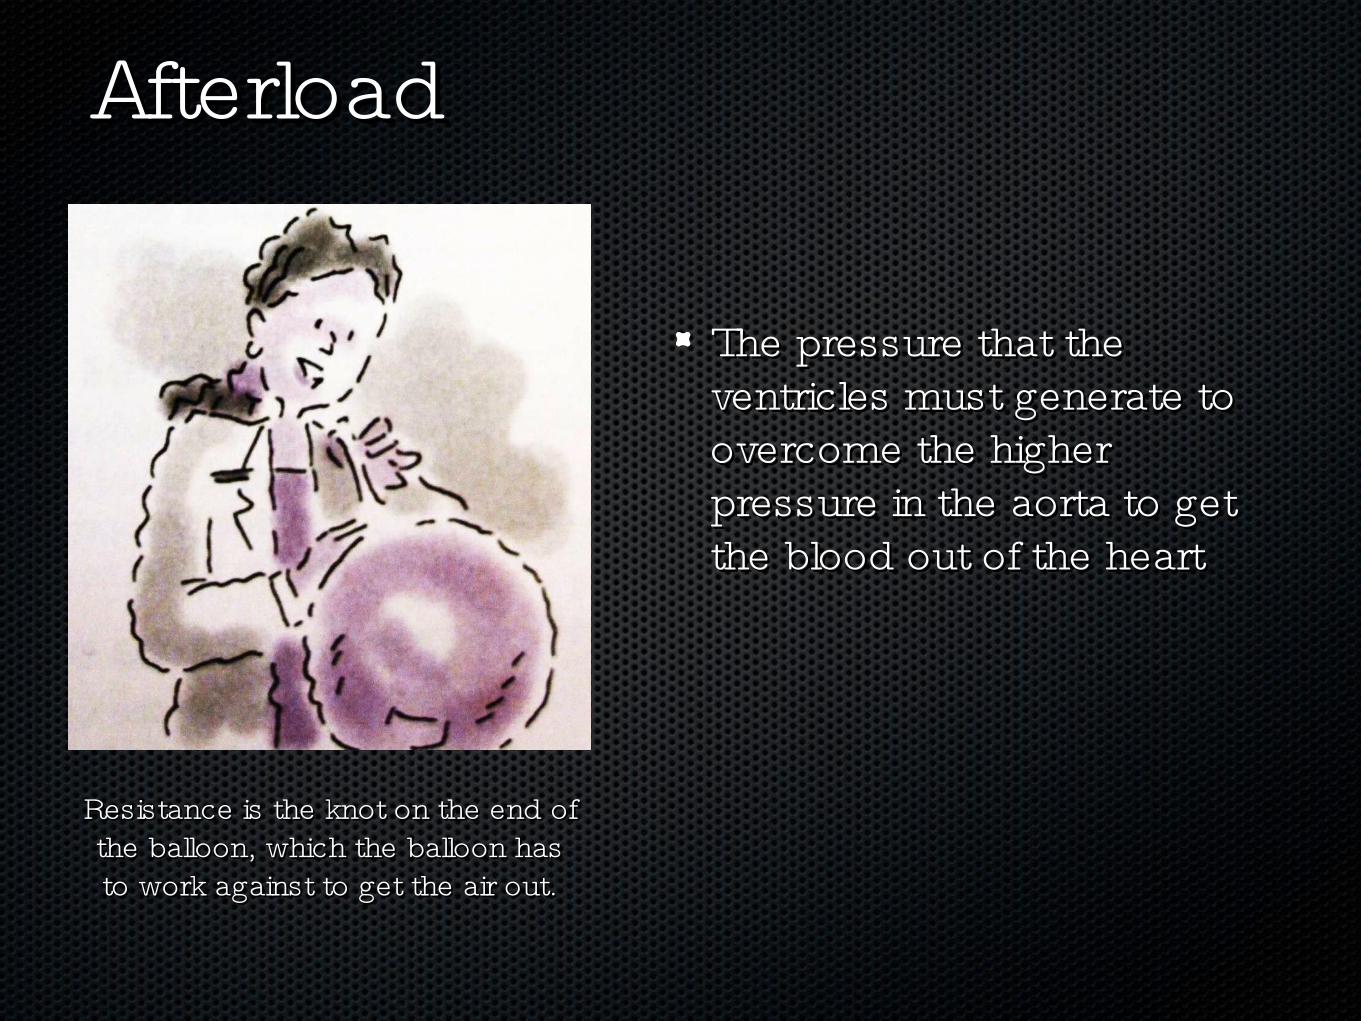
The pressure that the The pressure that the ventricles must generate to ventricles must generate to overcome the higher overcome the higher pressure in the aorta to get pressure in the aorta to get the blood out of the heartthe blood out of the heart
AfterloadAfterload
Resistance is the knot on the end of Resistance is the knot on the end of the balloon, which the balloon has the balloon, which the balloon has to work against to get the air out.to work against to get the air out.
Factors Affecting AfterloadFactors Affecting Afterload
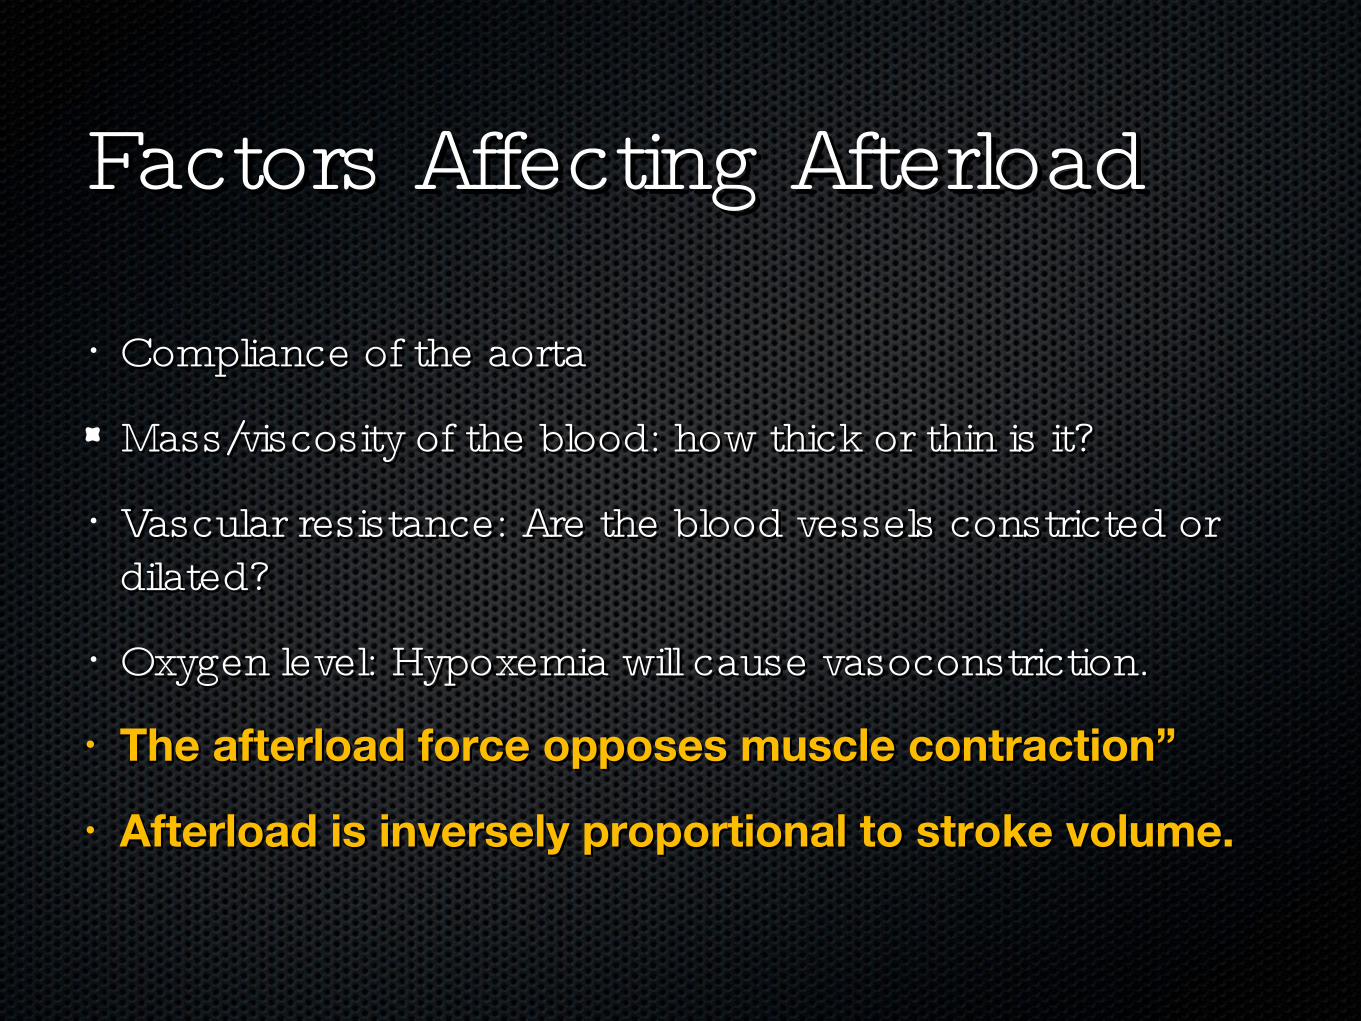
• Compliance of the aortaCompliance of the aorta
Mass/viscosity of the blood: how thick or thin is it?Mass/viscosity of the blood: how thick or thin is it?
• Vascular resistance: Are the blood vessels constricted or Vascular resistance: Are the blood vessels constricted or dilated?dilated?
• Oxygen level: Hypoxemia will cause vasoconstriction.Oxygen level: Hypoxemia will cause vasoconstriction.
• The afterload force opposes muscle contraction”The afterload force opposes muscle contraction”
• Afterload is inversely proportional to stroke volume.Afterload is inversely proportional to stroke volume.
• Determined by force and velocity of muscle contraction Determined by force and velocity of muscle contraction when loading conditions (preload and afterload) are held when loading conditions (preload and afterload) are held constant.constant.
• Can be influenced by neural, humoral or pharmacological Can be influenced by neural, humoral or pharmacological factors.factors.
ContractilityContractility
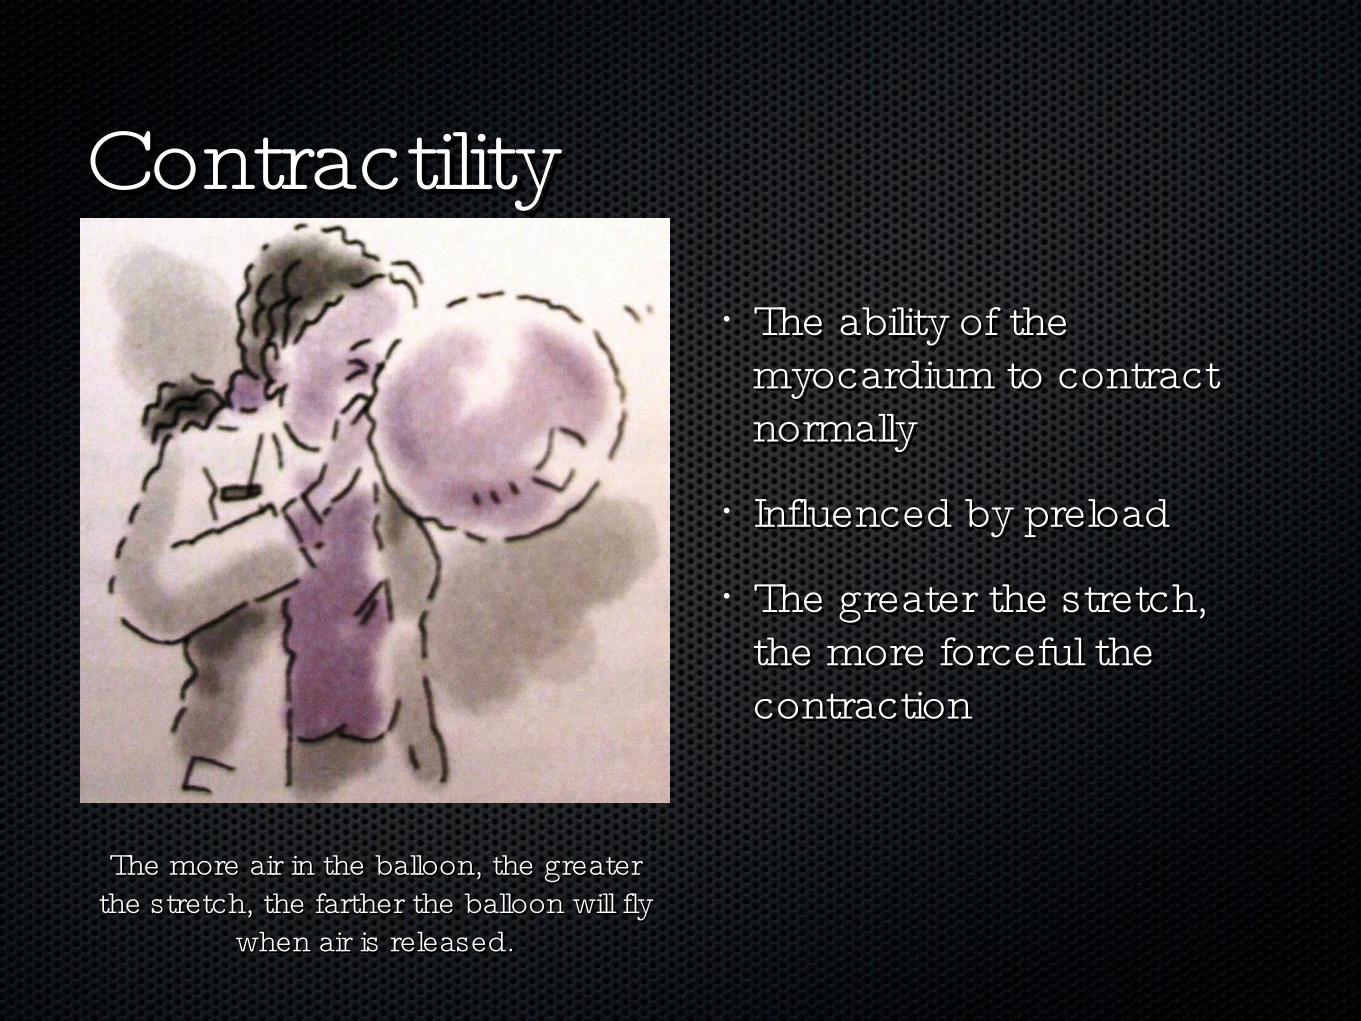
• The ability of the The ability of the myocardium to contract myocardium to contract normallynormally
• Influenced by preloadInfluenced by preload
• The greater the stretch, The greater the stretch, the more forceful the the more forceful the contractioncontraction
ContractilityContractility
The more air in the balloon, the greater The more air in the balloon, the greater the stretch, the farther the balloon will fly the stretch, the farther the balloon will fly
when air is released.when air is released.
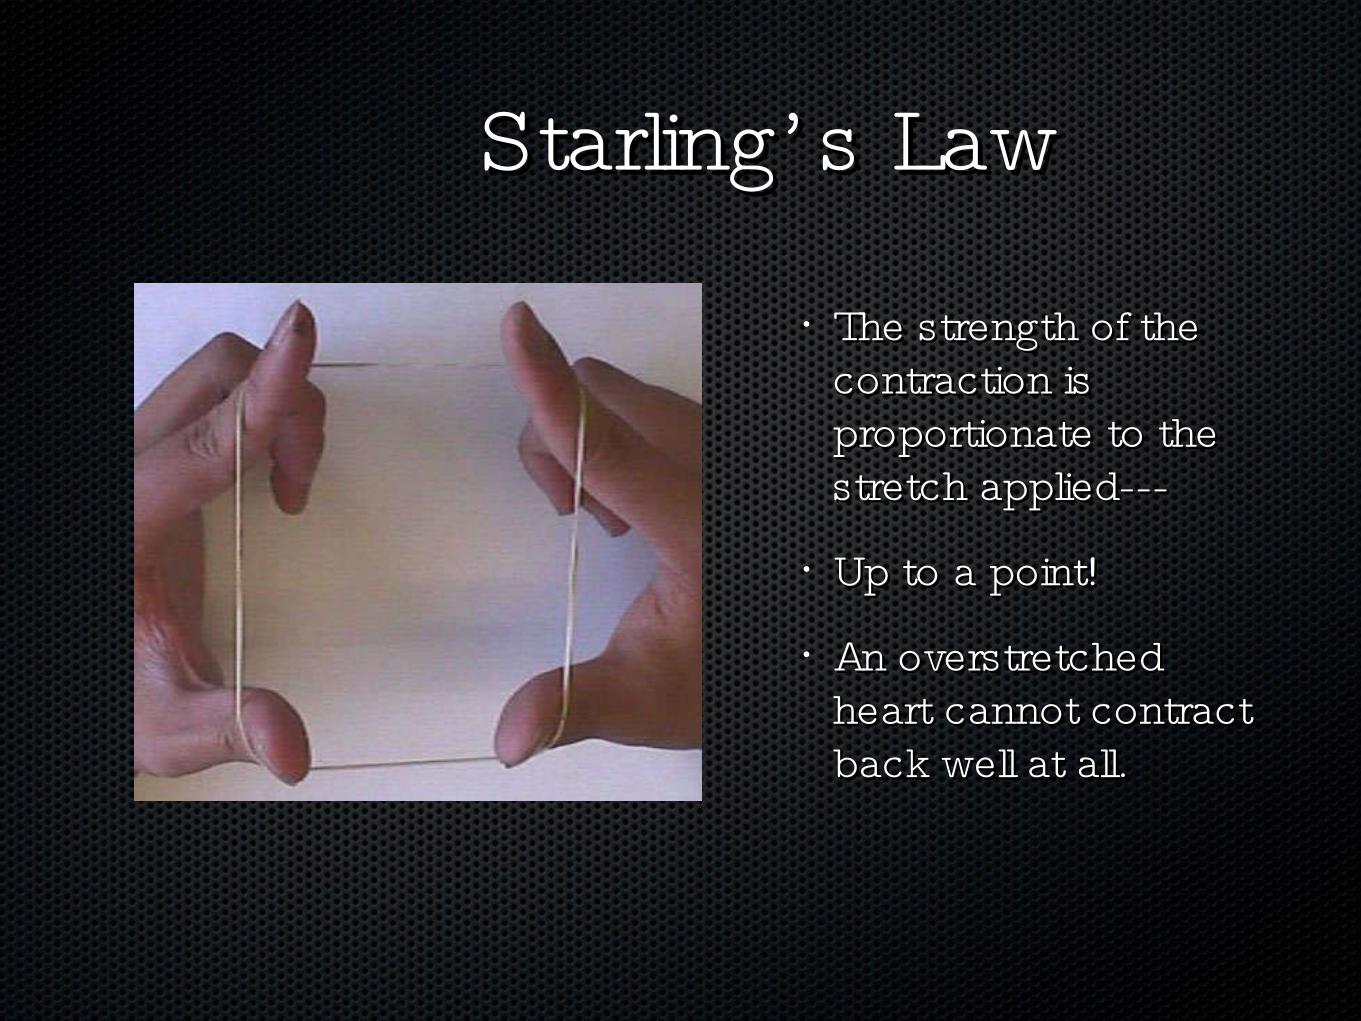
Starling’ s LawStarling’ s Law
• The strength of the The strength of the contraction is contraction is proportionate to the proportionate to the stretch applied---stretch applied---
• Up to a point!Up to a point!
• An overstretched An overstretched heart cannot contract heart cannot contract back well at all.back well at all.
Increased ContractilityIncreased Contractility
• ““ Fight or Flight”Fight or Flight”
• Sympathetic responseSympathetic response
• Catecholamine releaseCatecholamine release
• Increased contractility also increased myocardial oxygen Increased contractility also increased myocardial oxygen demanddemand
Decreased contractilityDecreased contractility• Decreased contractility Decreased contractility
• Decreased stroke volumeDecreased stroke volume
• Decreased myocardial oxygen demandDecreased myocardial oxygen demand
• Contractility decreases with:Contractility decreases with:
• HypoxiaHypoxia
• Metabolic acidosisMetabolic acidosis
• Myocardial infarctionMyocardial infarction
• HyperkalemiaHyperkalemia
• HypercapniaHypercapnia
• HypocalcemiaHypocalcemia
Common Treatment Common Treatment Strategies:Strategies:• Reducing preload when LV or RV failure is present without Reducing preload when LV or RV failure is present without
hypotensionhypotension
• Increasing preload when hypovolemia is presentIncreasing preload when hypovolemia is present
• Increasing contractility when LV failure is presentIncreasing contractility when LV failure is present
• Reducing afterload when LV failure without hypotension is Reducing afterload when LV failure without hypotension is presentpresent
• Increasing afterload when systemic hypotension exists.Increasing afterload when systemic hypotension exists.
Increasing Preload:Increasing Preload:
• Crystalloids & colloidsCrystalloids & colloids
• Crystalloids: NS or LRCrystalloids: NS or LR
• Takes 1000 ml to increase blood volume by 200 mlTakes 1000 ml to increase blood volume by 200 ml
• Colloids used when acute vascular loss existsColloids used when acute vascular loss exists
• Use PCWP to determine when a satisfactory increase in Use PCWP to determine when a satisfactory increase in preload has occurred.preload has occurred.
Improving Contractility:Improving Contractility:• Can occur through:Can occur through:
• Preload reductionPreload reduction
• Afterload reductionAfterload reduction
• Direct contractile stimulationDirect contractile stimulation
• Contractile stimulating drugs in the ICU setting:Contractile stimulating drugs in the ICU setting:
• DobutamineDobutamine
• DopamineDopamine
• AmrinoneAmrinone
Afterload Reduction:Afterload Reduction:• Improves cardiac performance by reducing the Improves cardiac performance by reducing the
resistance facing the ventricle during contraction.resistance facing the ventricle during contraction.
• Other factors, such as blood viscosity and valvular Other factors, such as blood viscosity and valvular resistance, can influence afterloadresistance, can influence afterload
• Agents that reduce arterial resistance:Agents that reduce arterial resistance:
• Calcium channel blockersCalcium channel blockers
• ACE inhibitorsACE inhibitors
• Arteriolar dilatorsArteriolar dilators
• Beta blockersBeta blockers

Afterload Increase and Afterload Increase and Increasing the BP:Increasing the BP:• Increasing afterload with vasopressors is the most potent Increasing afterload with vasopressors is the most potent
method.method.
• Hypovolemia must be corrected before using vasopressorsHypovolemia must be corrected before using vasopressors
• Vasopressors increase myocardial oxygen consumptionVasopressors increase myocardial oxygen consumption
• May increase the BP but not the blood flowMay increase the BP but not the blood flow
• Common agents: norepinephrine, dopamine, Common agents: norepinephrine, dopamine, phenylephrinephenylephrine
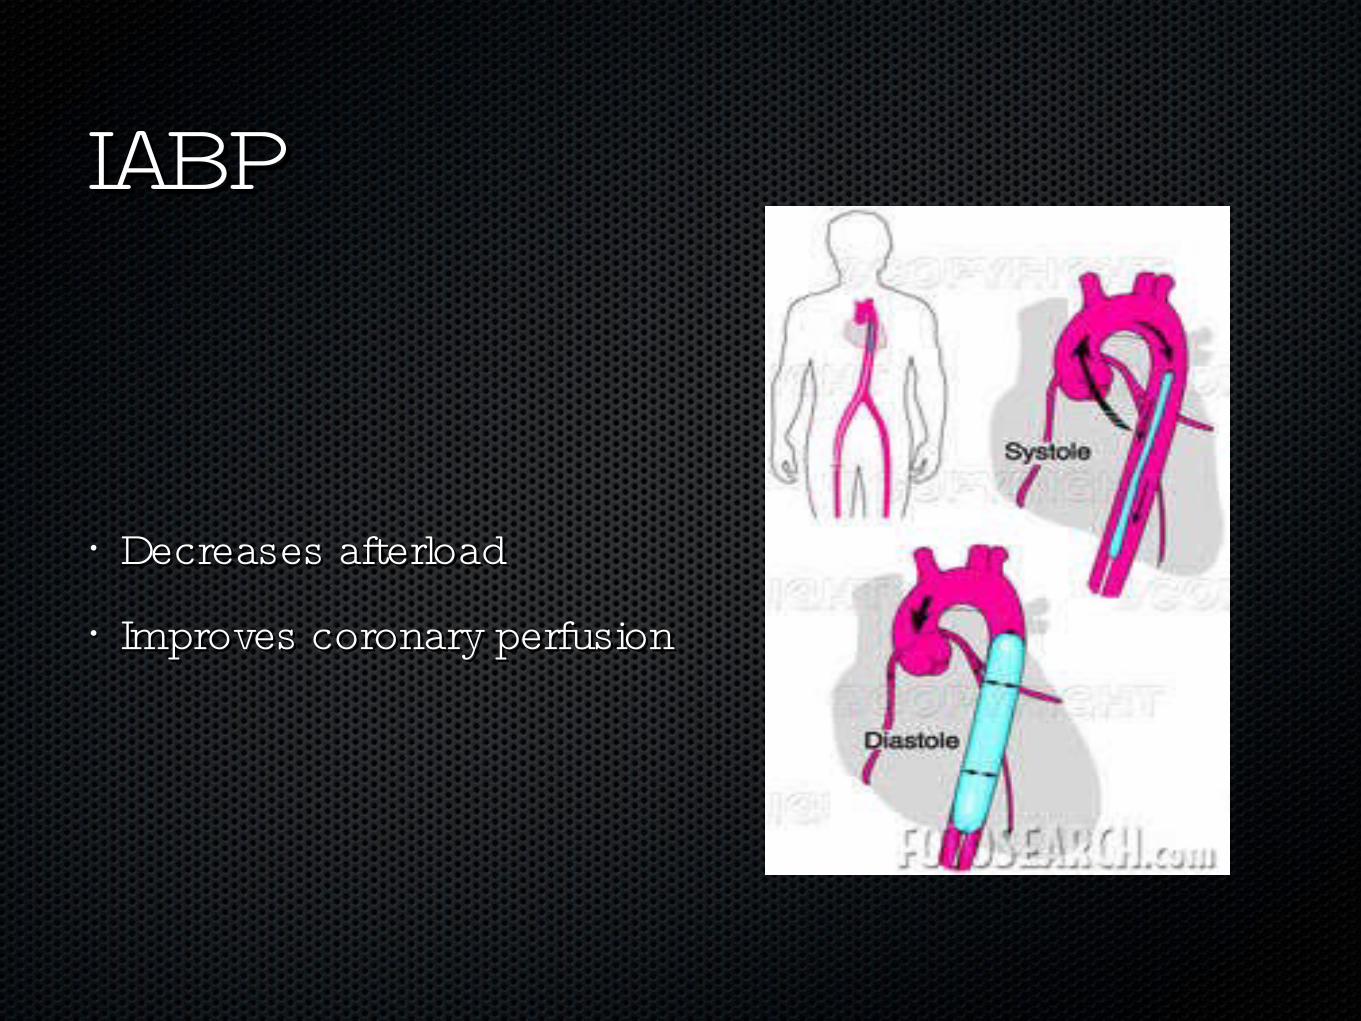
IABPIABP
• Decreases afterloadDecreases afterload
• Improves coronary perfusionImproves coronary perfusion
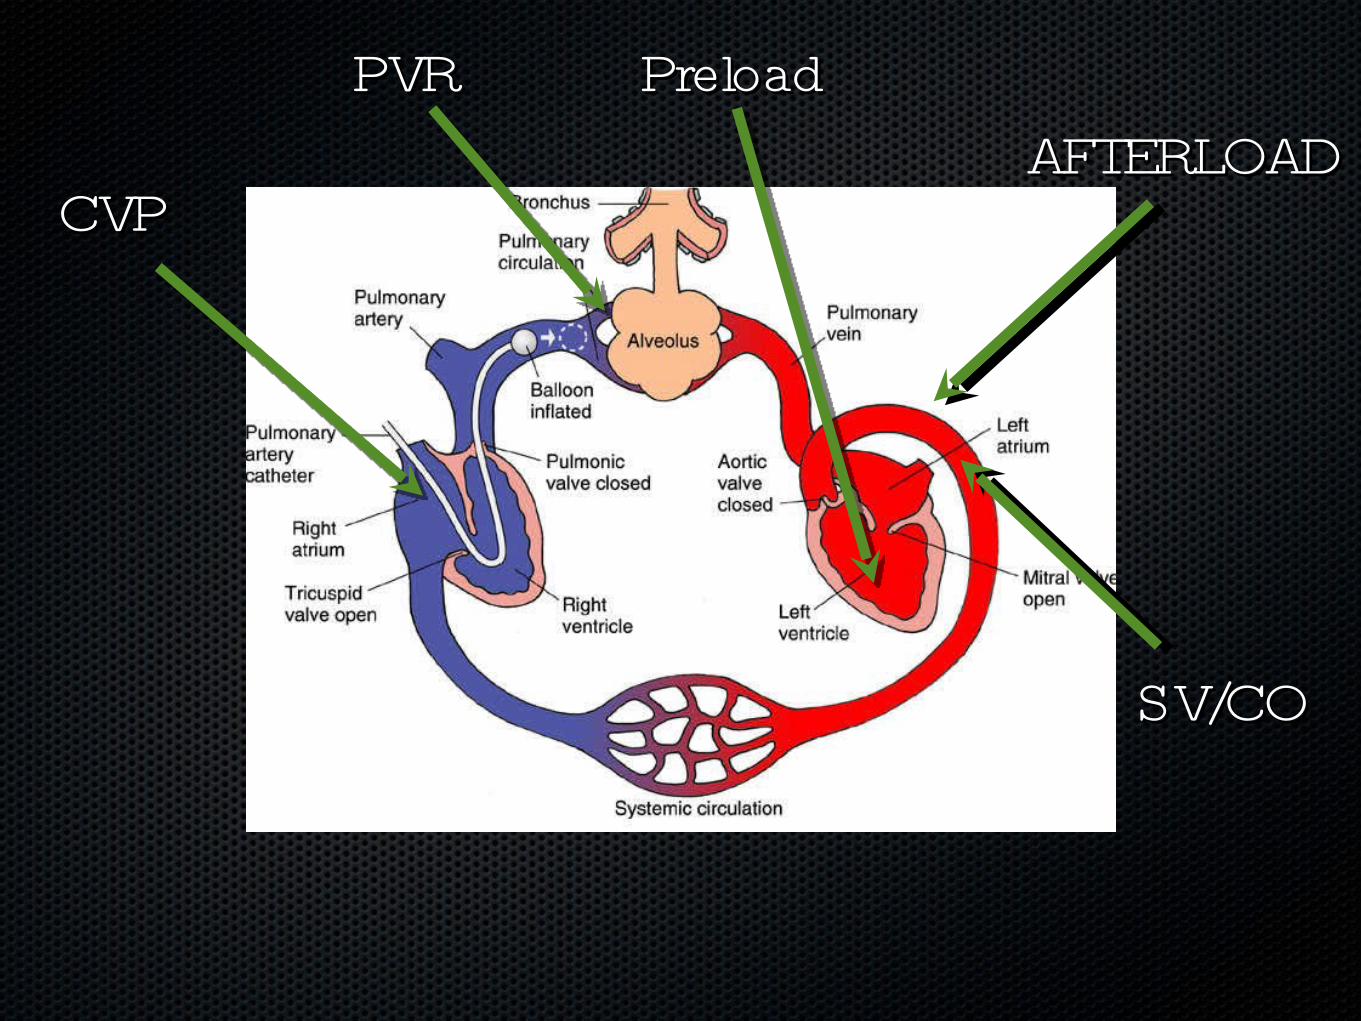
AFTERLOADAFTERLOADPreloadPreloadPVRPVR
CVPCVP
SV/COSV/CO

Hemodynamic Hemodynamic MonitoringMonitoring
Practical ApplicationsPractical Applications
Examples of hemodynamic Examples of hemodynamic monitoring devices:monitoring devices:
• Arterial LinesArterial Lines
• RA/CVPRA/CVP
• Pulmonary Artery CatheterPulmonary Artery Catheter
• SvO2/CCO CatheterSvO2/CCO Catheter
• Bedside BP cuffBedside BP cuff
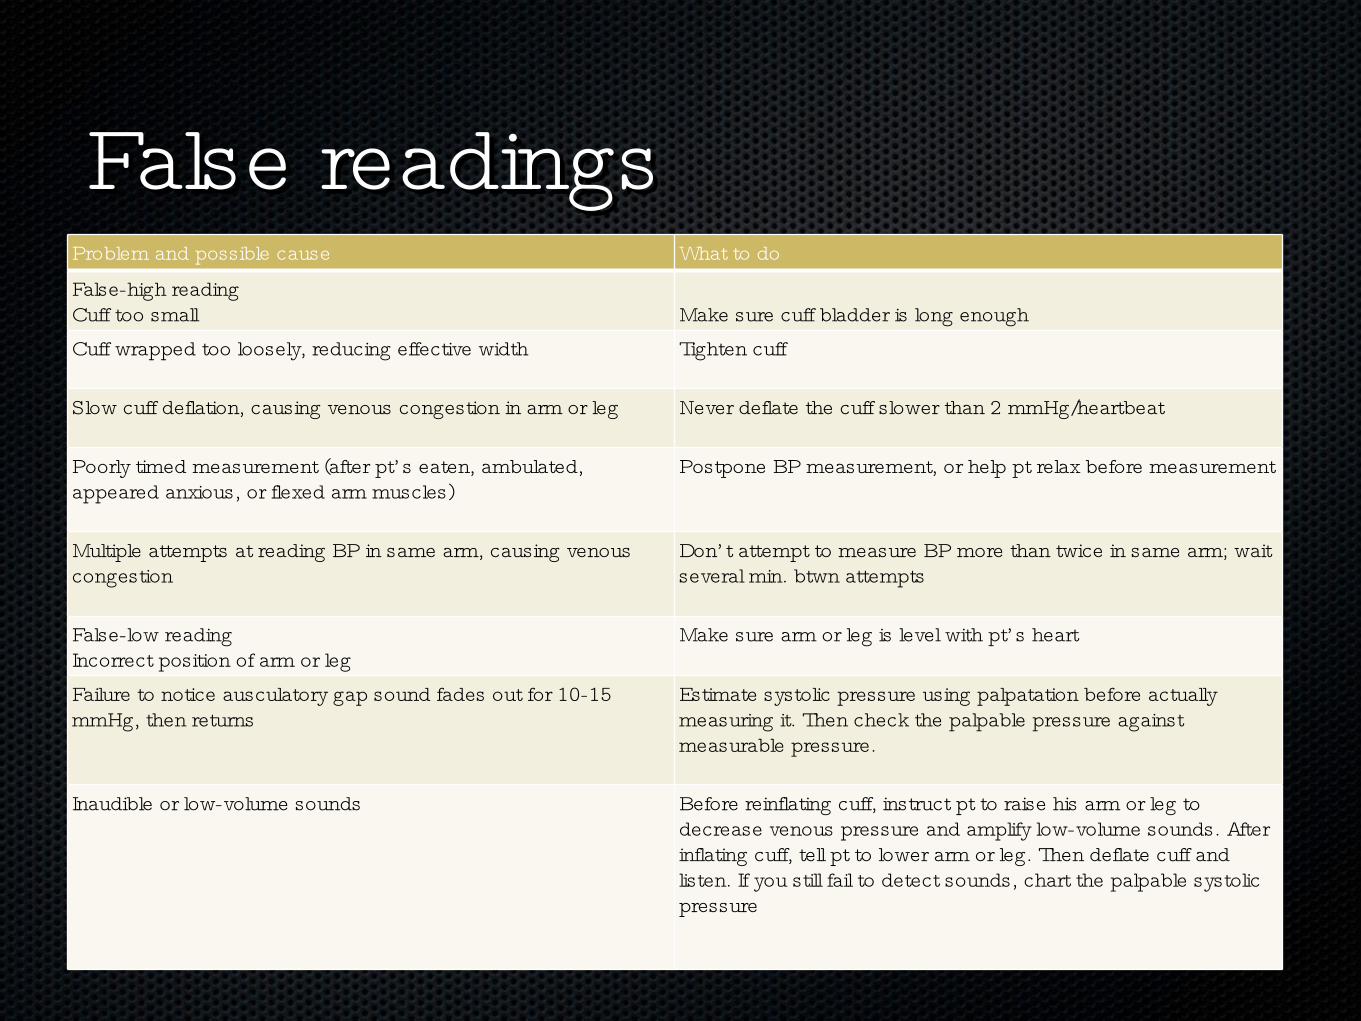
Problem and possible cause What to do
False-high readingCuff too small Make sure cuff bladder is long enoughCuff wrapped too loosely, reducing effective width Tighten cuff
Slow cuff deflation, causing venous congestion in arm or leg Never deflate the cuff slower than 2 mmHg/heartbeat
Poorly timed measurement (after pt’ s eaten, ambulated, appeared anxious, or flexed arm muscles)
Postpone BP measurement, or help pt relax before measurement
Multiple attempts at reading BP in same arm, causing venous congestion
Don’ t attempt to measure BP more than twice in same arm; wait several min. btwn attempts
False-low readingIncorrect position of arm or leg
Make sure arm or leg is level with pt’ s heart
Failure to notice ausculatory gap sound fades out for 10-15 mmHg, then returns
Estimate systolic pressure using palpatation before actually measuring it. Then check the palpable pressure against measurable pressure.
Inaudible or low-volume sounds Before reinflating cuff, instruct pt to raise his arm or leg to decrease venous pressure and amplify low-volume sounds. After inflating cuff, tell pt to lower arm or leg. Then deflate cuff and listen. If you still fail to detect sounds, chart the palpable systolic pressure
False readingsFalse readings
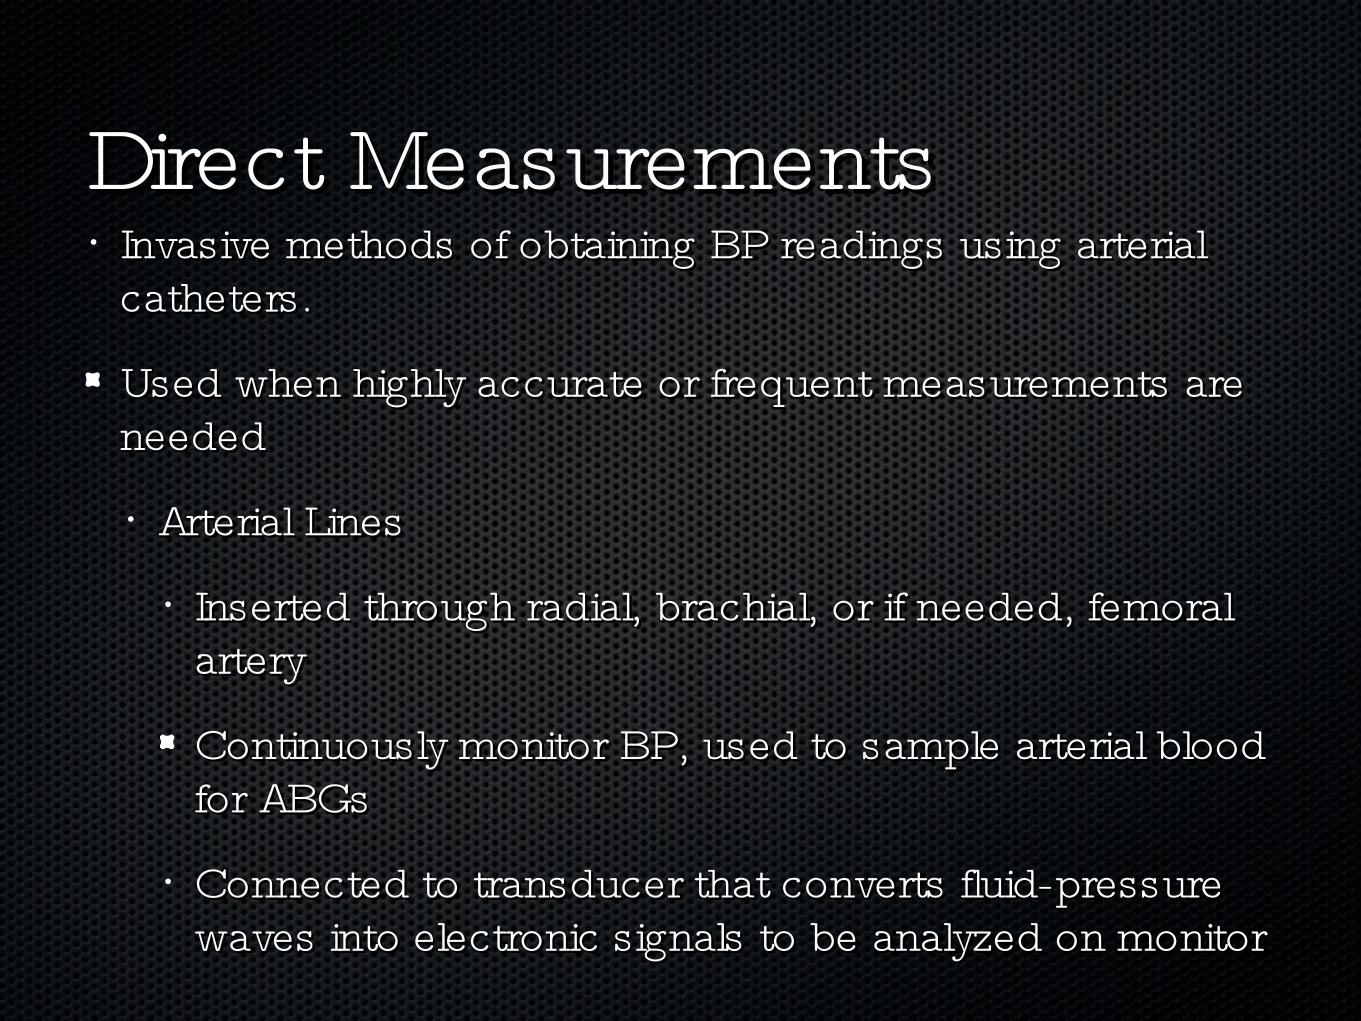
• Invasive methods of obtaining BP readings using arterial Invasive methods of obtaining BP readings using arterial catheters. catheters.
Used when highly accurate or frequent measurements are Used when highly accurate or frequent measurements are neededneeded
• Arterial LinesArterial Lines
• Inserted through radial, brachial, or if needed, femoral Inserted through radial, brachial, or if needed, femoral arteryartery
Continuously monitor BP, used to sample arterial blood Continuously monitor BP, used to sample arterial blood for ABGsfor ABGs
• Connected to transducer that converts fluid-pressure Connected to transducer that converts fluid-pressure waves into electronic signals to be analyzed on monitorwaves into electronic signals to be analyzed on monitor
Direct MeasurementsDirect Measurements
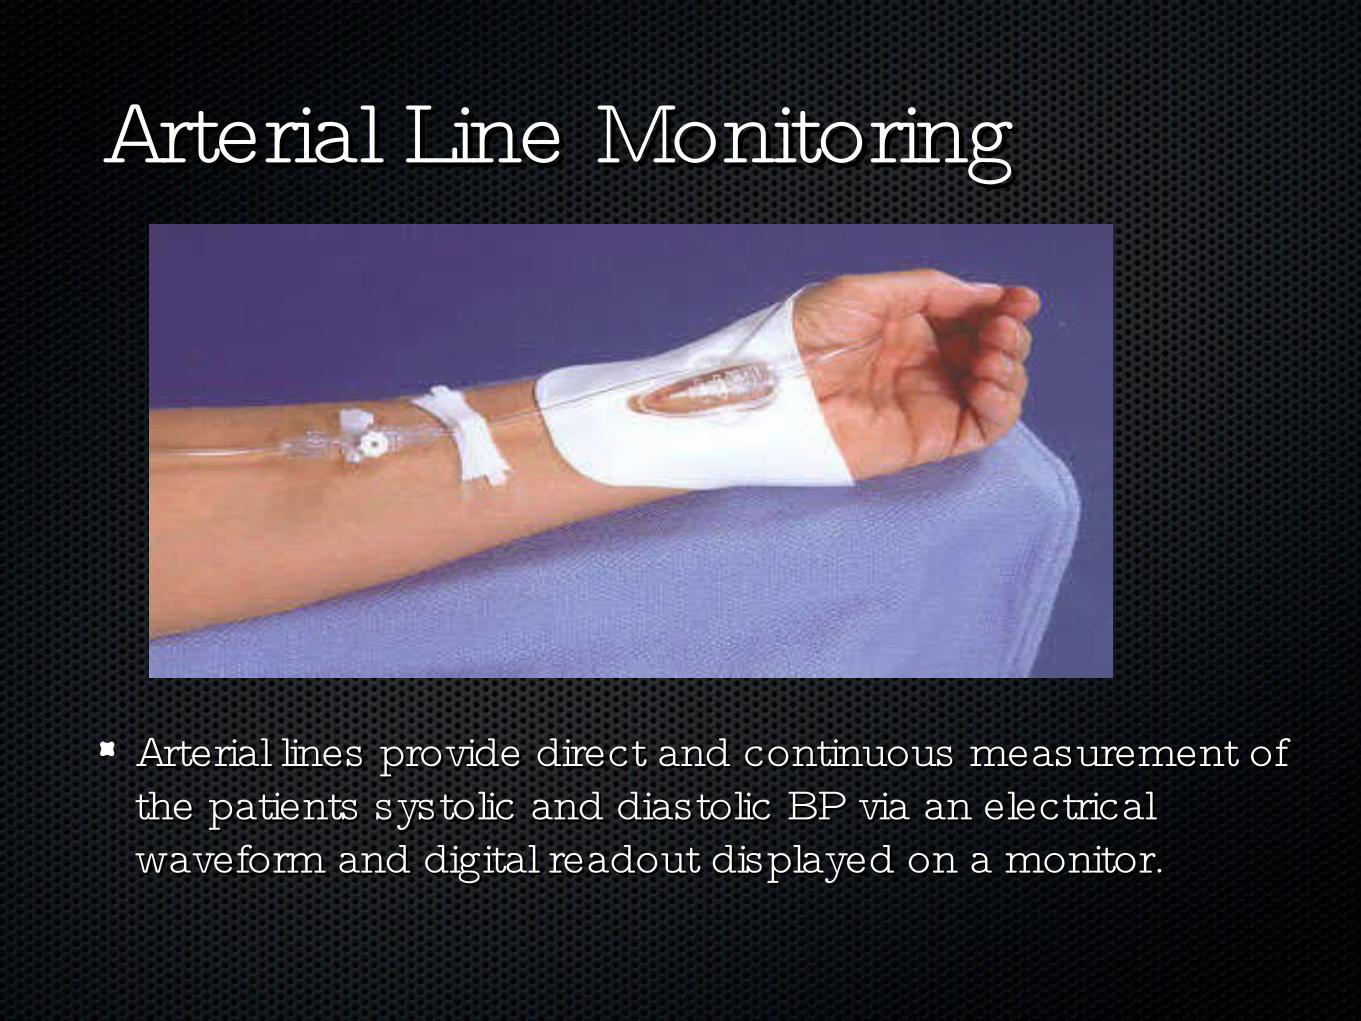
Arterial Line MonitoringArterial Line Monitoring
Arterial lines provide direct and continuous measurement of Arterial lines provide direct and continuous measurement of the patients systolic and diastolic BP via an electrical the patients systolic and diastolic BP via an electrical waveform and digital readout displayed on a monitor.waveform and digital readout displayed on a monitor.
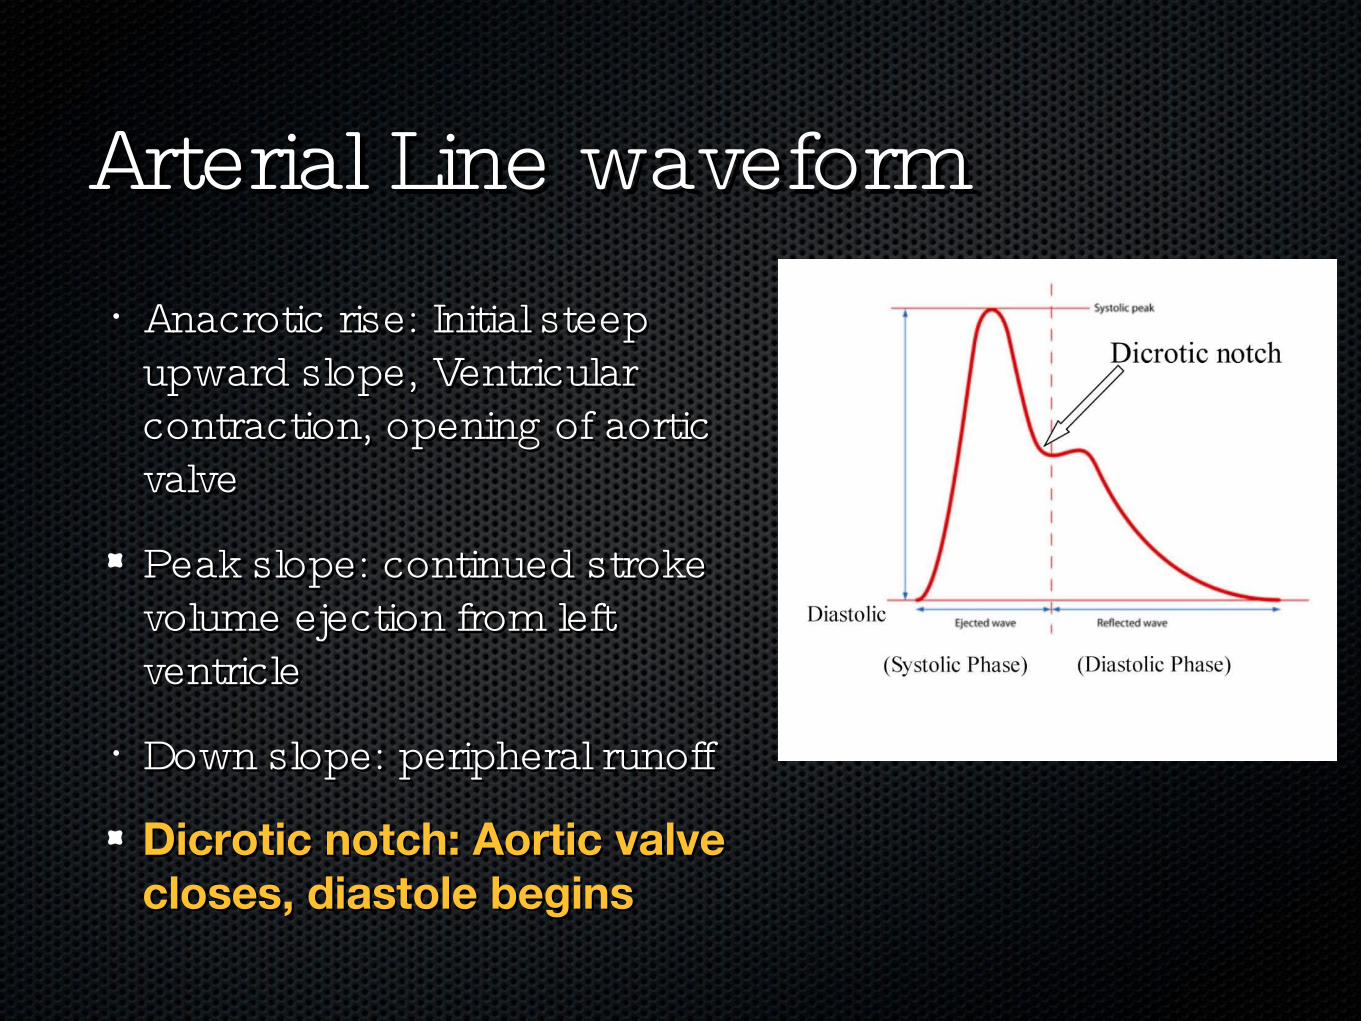
• Anacrotic rise: Initial steep Anacrotic rise: Initial steep upward slope, Ventricular upward slope, Ventricular contraction, opening of aortic contraction, opening of aortic valvevalve
Peak slope: continued stroke Peak slope: continued stroke volume ejection from left volume ejection from left ventricleventricle
• Down slope: peripheral runoffDown slope: peripheral runoff
Dicrotic notch: Aortic valve Dicrotic notch: Aortic valve closes, diastole beginscloses, diastole begins
Arterial Line waveformArterial Line waveform
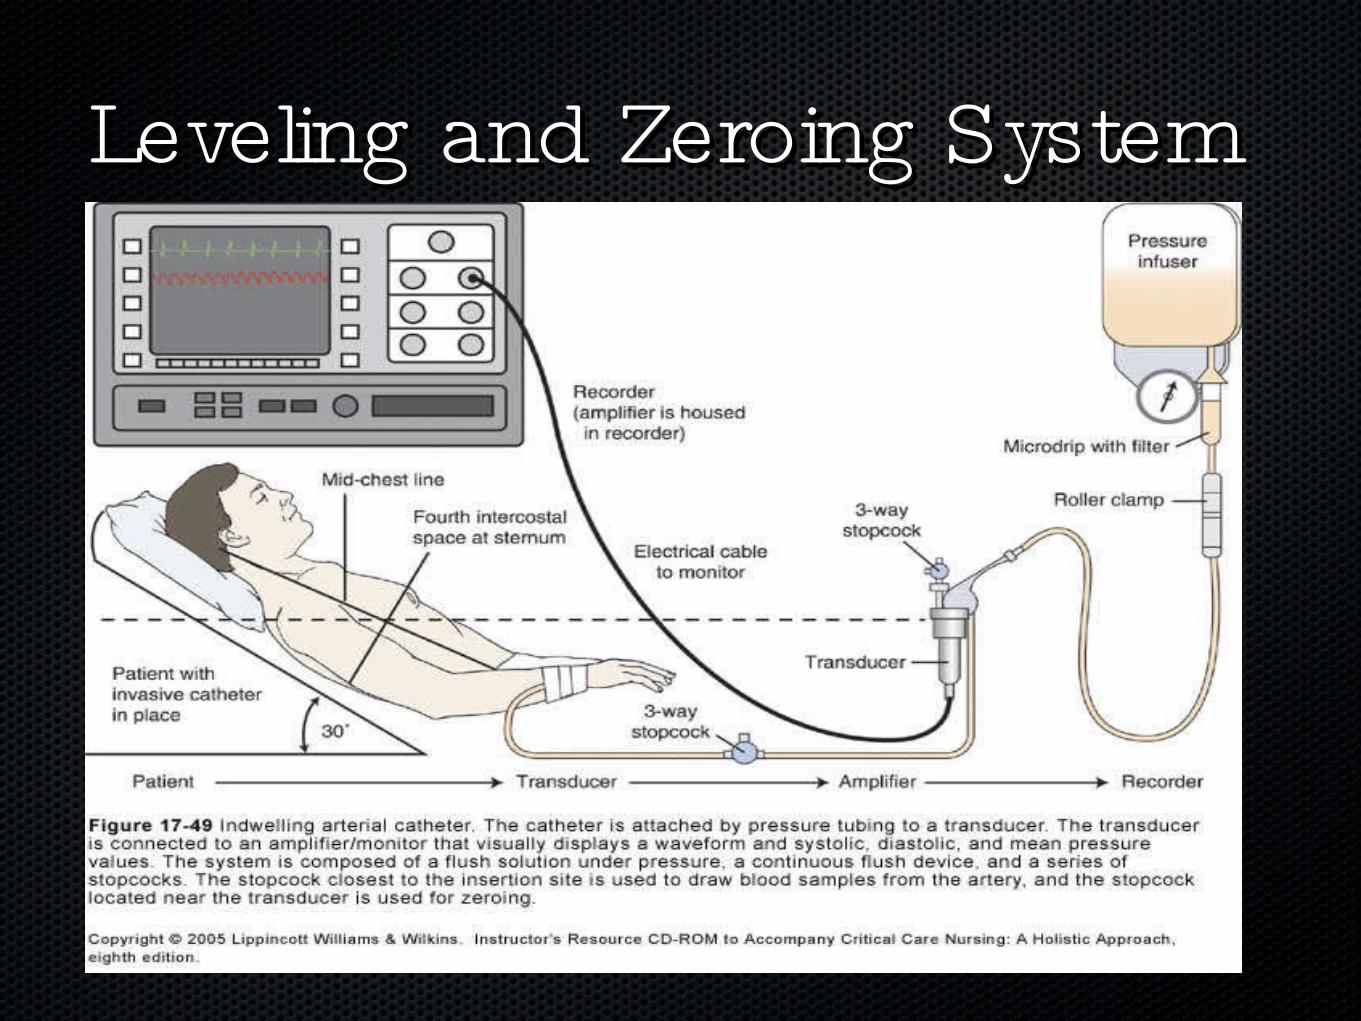
Leveling and Zeroing SystemLeveling and Zeroing System
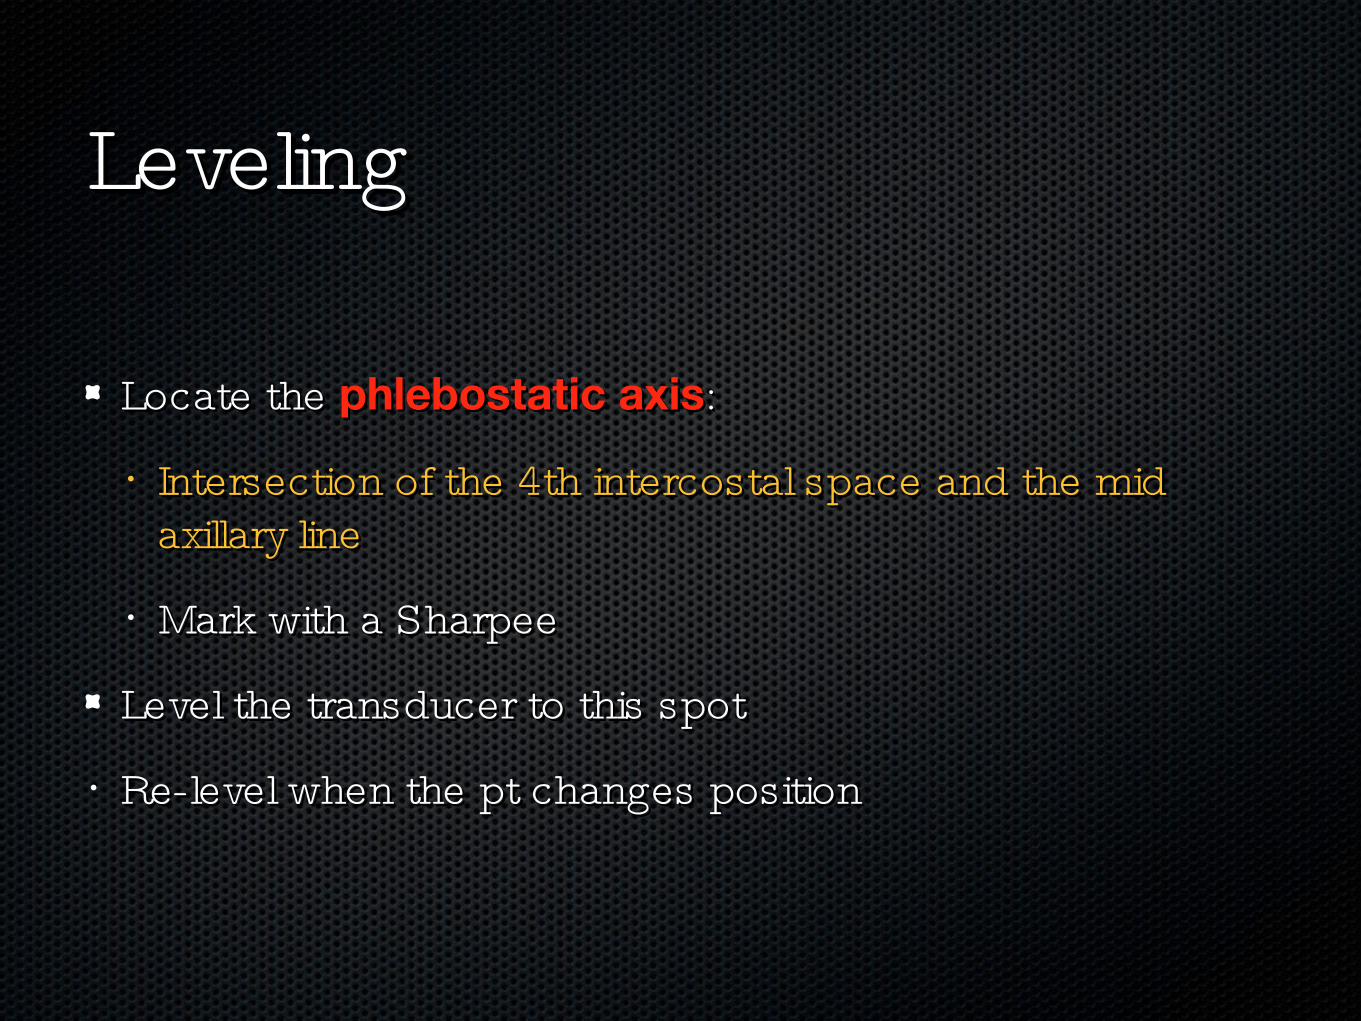
LevelingLeveling
Locate the Locate the phlebostatic axisphlebostatic axis::
• Intersection of the 4th intercostal space and the mid Intersection of the 4th intercostal space and the mid axillary lineaxillary line
• Mark with a SharpeeMark with a Sharpee
Level the transducer to this spotLevel the transducer to this spot
• Re-level when the pt changes positionRe-level when the pt changes position
ZeroingZeroing• Remove the dead end cap closest to the air-fluid interfaceRemove the dead end cap closest to the air-fluid interface
Turn the transducer stop cock off to the pt.Turn the transducer stop cock off to the pt.
• Press the “ zero” button on the monitorPress the “ zero” button on the monitor
• Turn the stopcock back to midlineTurn the stopcock back to midline
Replace the capReplace the cap
• Fast flush the line to perform the square wave testFast flush the line to perform the square wave test
Square Wave TestSquare Wave Test
• The only way to confirm accuracy of a pressure monitoring The only way to confirm accuracy of a pressure monitoring system is to perform a square wave testsystem is to perform a square wave test
Procedure:Procedure:
• Fast flush for 1 secondFast flush for 1 second
• Quickly release the deviceQuickly release the device
Note square wave pattern on monitorNote square wave pattern on monitor
• Should be (-), (+), (-), then return of wave.Should be (-), (+), (-), then return of wave.
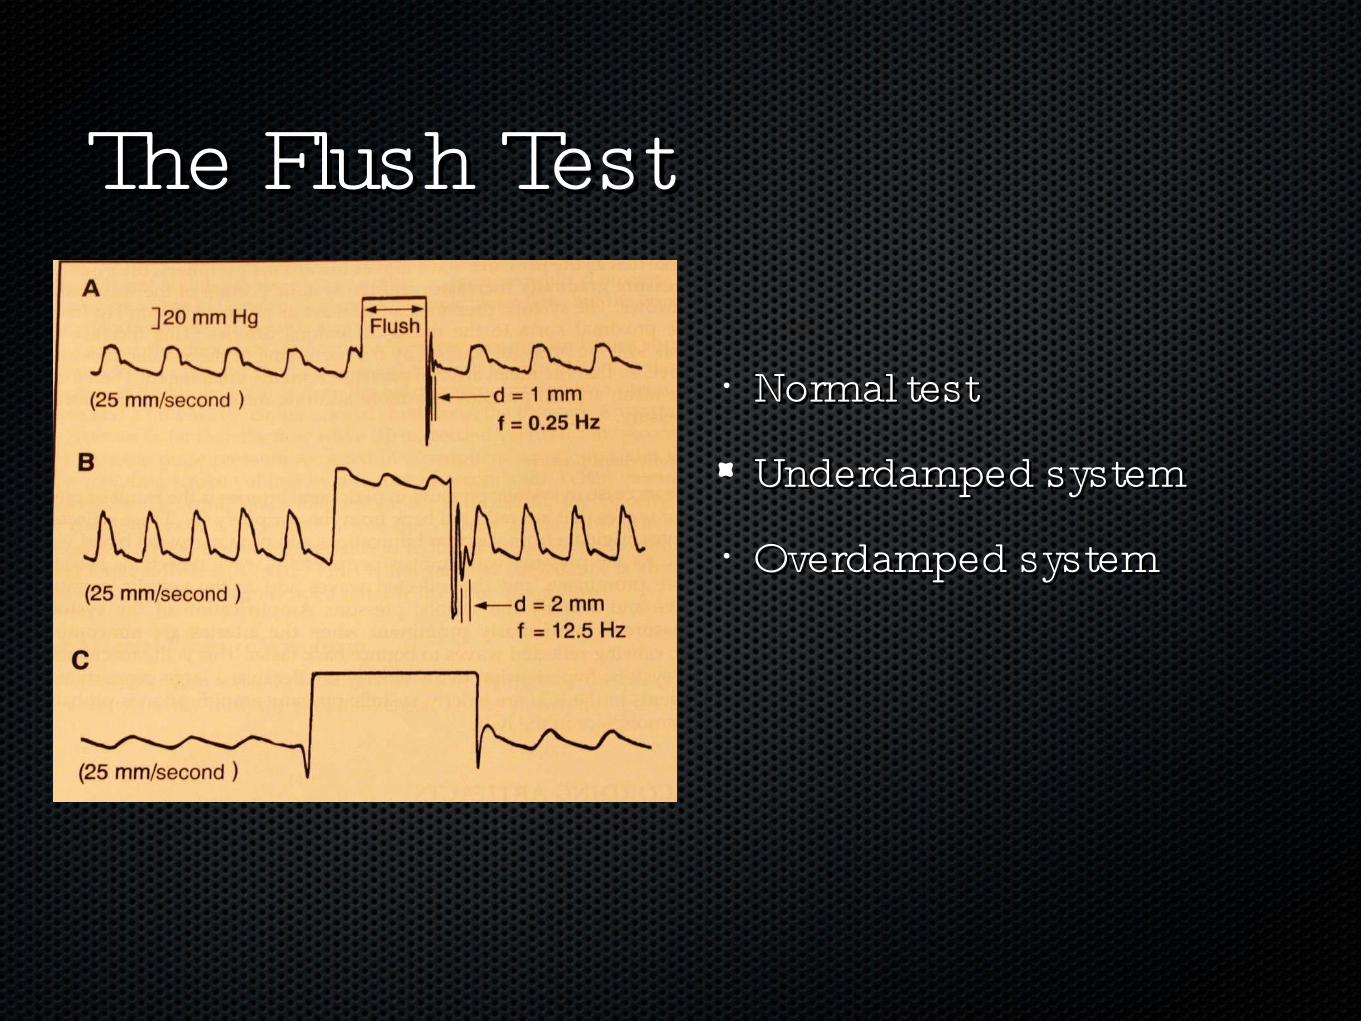
• Normal testNormal test
Underdamped systemUnderdamped system
• Overdamped systemOverdamped system
The Flush TestThe Flush Test
OverdampenedOverdampened• Effect:Effect:
Underestimates SBPUnderestimates SBP
• Overestimates DBPOverestimates DBP
• CausesCauses
Air bubblesAir bubbles
• Blood clotsBlood clots
• Kinked tubingKinked tubing
Loose connectionsLoose connections
• Compliant tubingCompliant tubing
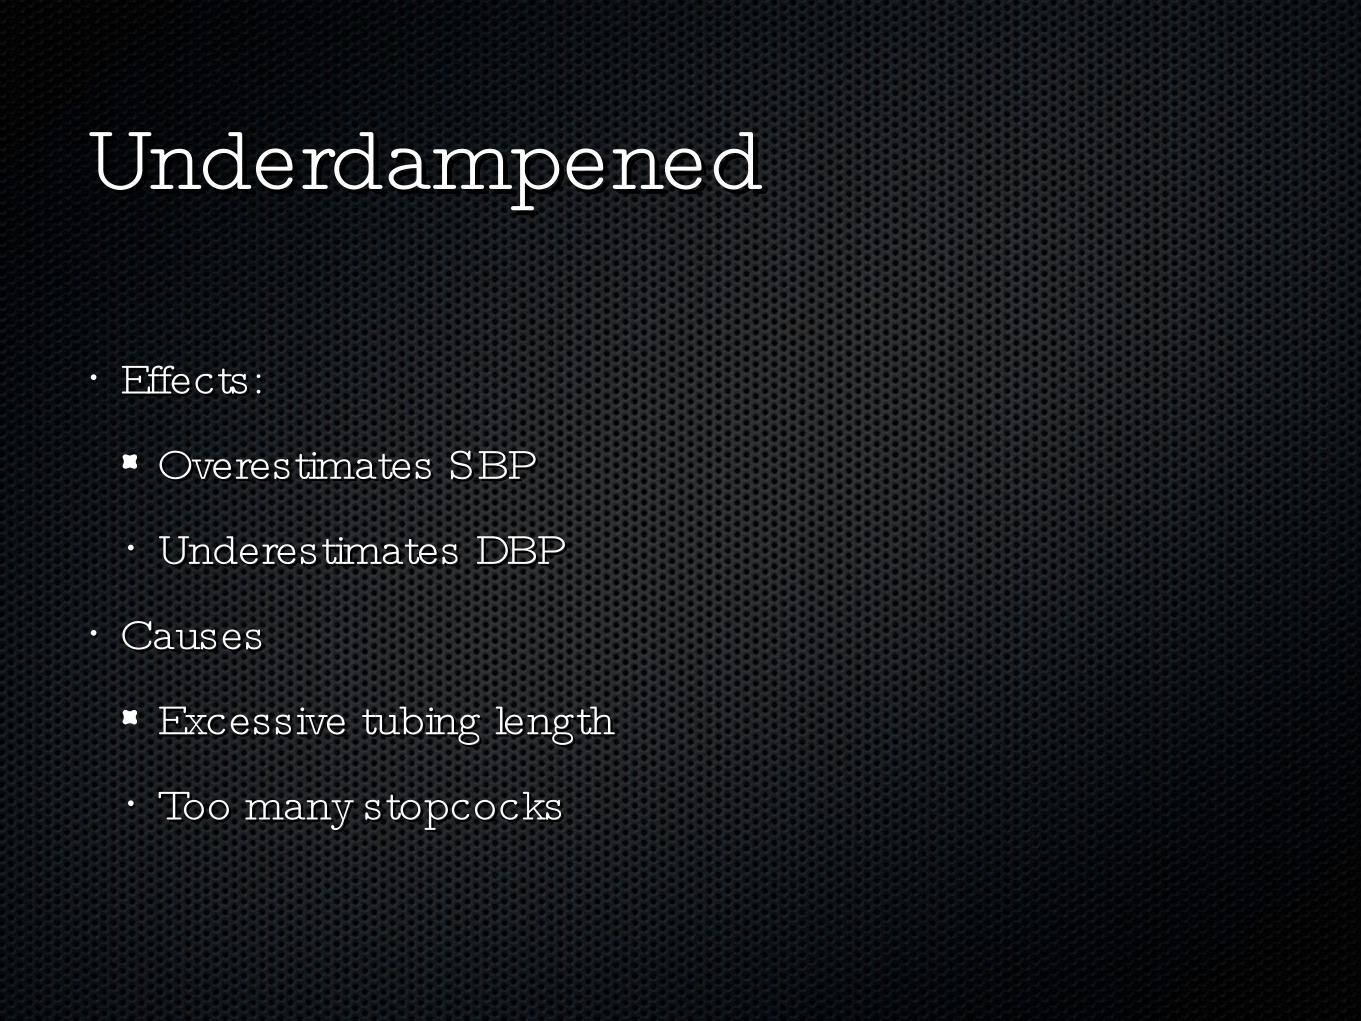
UnderdampenedUnderdampened
• Effects:Effects:
Overestimates SBPOverestimates SBP
• Underestimates DBPUnderestimates DBP
• CausesCauses
Excessive tubing lengthExcessive tubing length
• Too many stopcocksToo many stopcocks

NEVER INFUSE ANYTHING NEVER INFUSE ANYTHING INTO AN A-LINE !!!!!!!INTO AN A-LINE !!!!!!!
Central Venous Pressure/Central Venous Pressure/RA Pressure MonitoringRA Pressure Monitoring
• Tip of the catheter located in right atrium or superior vena Tip of the catheter located in right atrium or superior vena cavacava
RA pressure (AKA CVP) measures venous return to the RA pressure (AKA CVP) measures venous return to the right heartright heart
• RA/CVP pressure is used to determine the “ preload” or RA/CVP pressure is used to determine the “ preload” or volume status of the right heartvolume status of the right heart
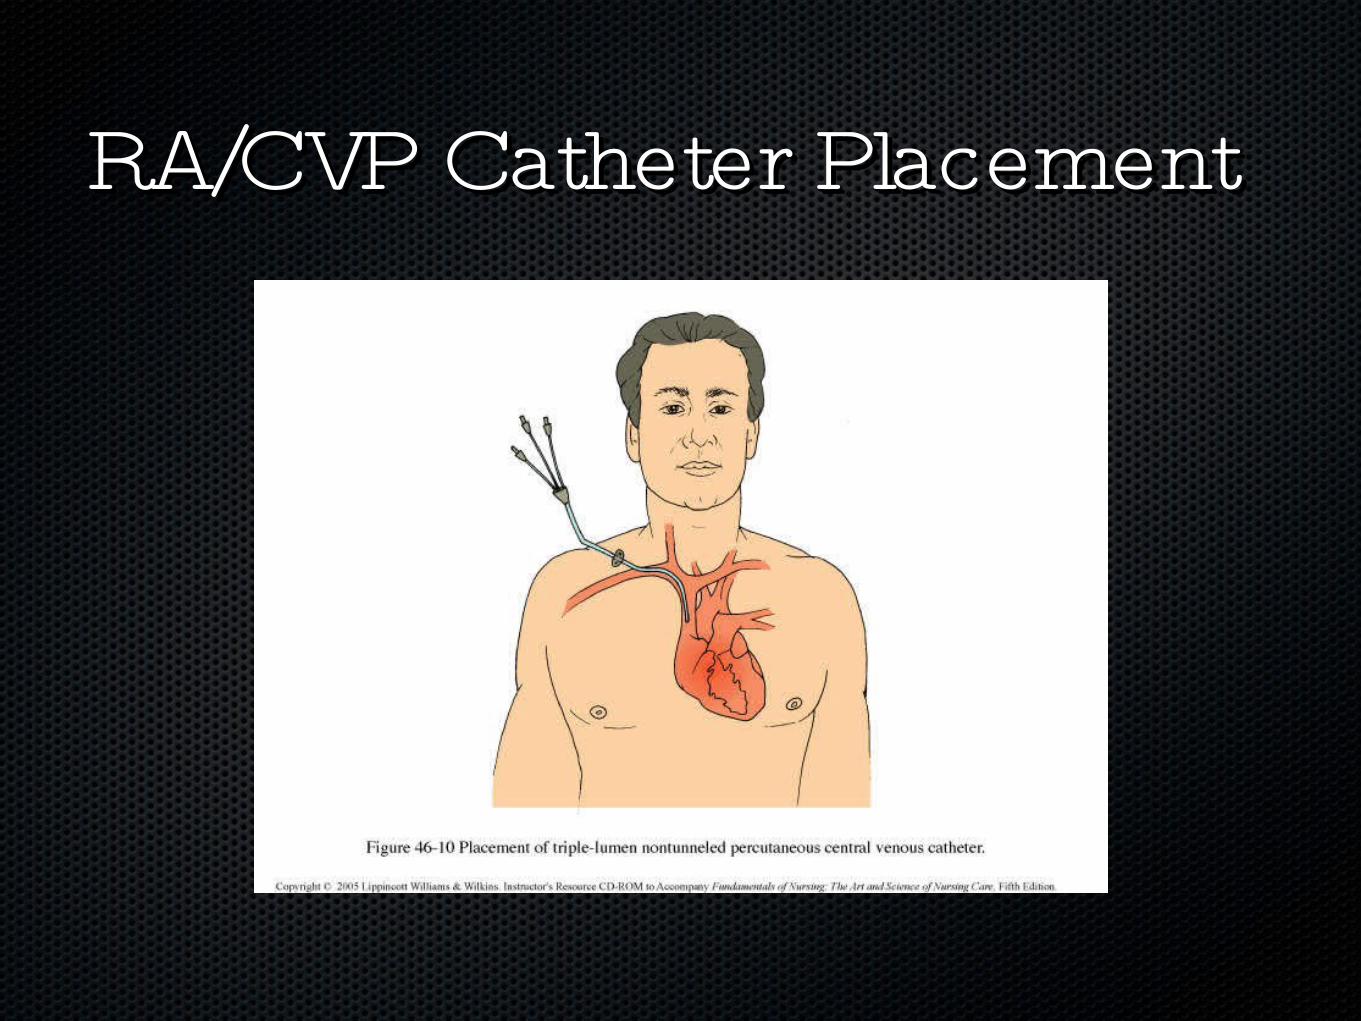
RA/CVP Catheter PlacementRA/CVP Catheter Placement
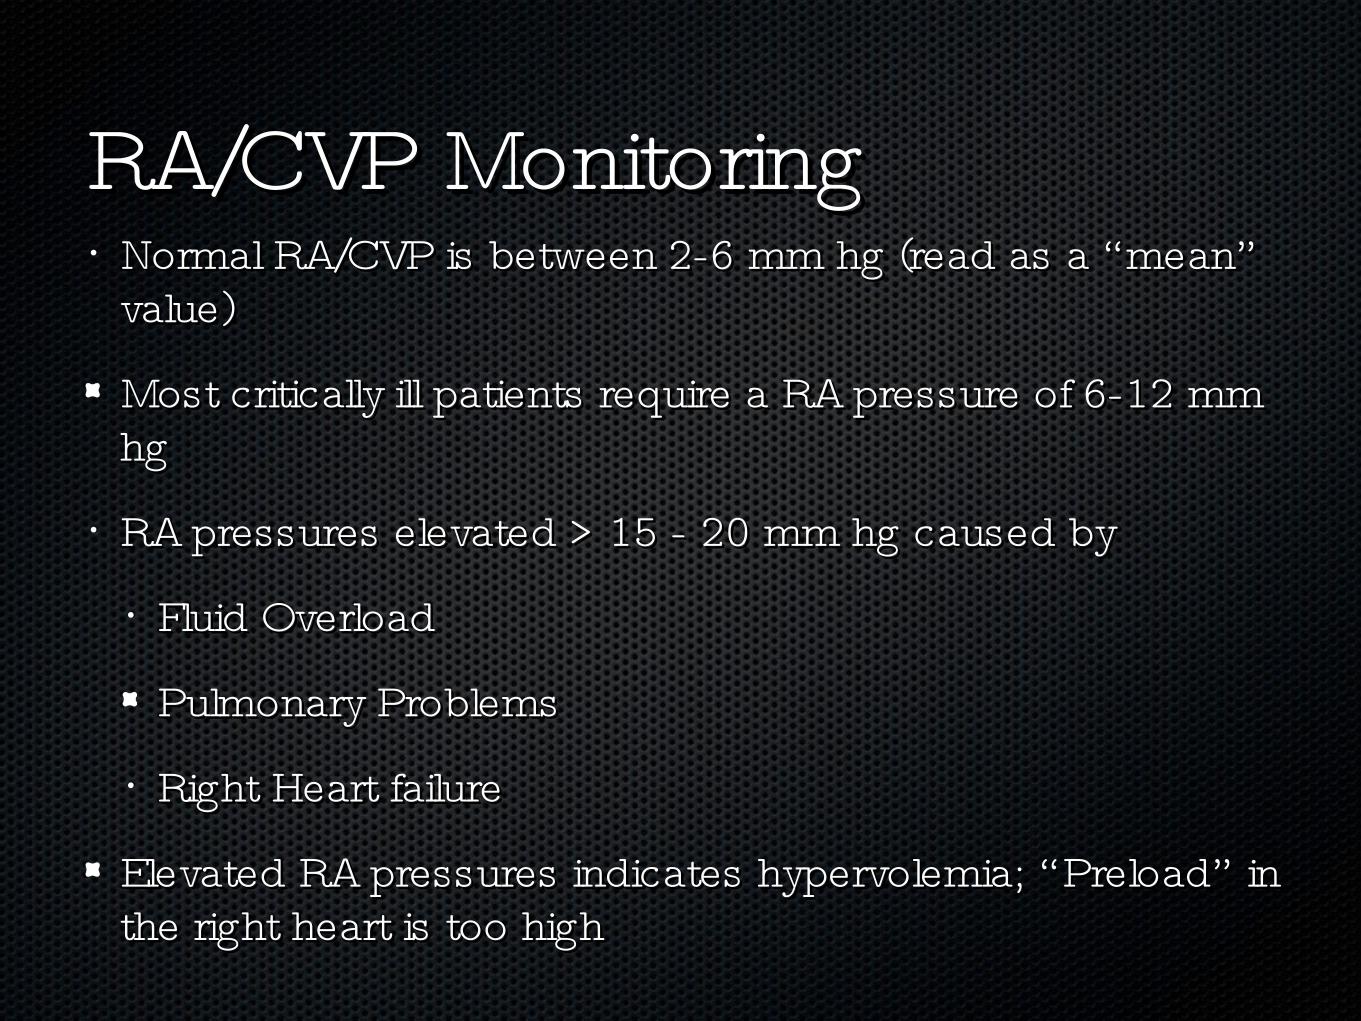
RA/CVP MonitoringRA/CVP Monitoring• Normal RA/CVP is between 2-6 mm hg (read as a “ mean” Normal RA/CVP is between 2-6 mm hg (read as a “ mean”
value)value)
Most critically ill patients require a RA pressure of 6-12 mm Most critically ill patients require a RA pressure of 6-12 mm hg hg
• RA pressures elevated > 15 - 20 mm hg caused byRA pressures elevated > 15 - 20 mm hg caused by
• Fluid OverloadFluid Overload
Pulmonary Problems Pulmonary Problems
• Right Heart failureRight Heart failure
Elevated RA pressures indicates hypervolemia; “ Preload” in Elevated RA pressures indicates hypervolemia; “ Preload” in the right heart is too high the right heart is too high
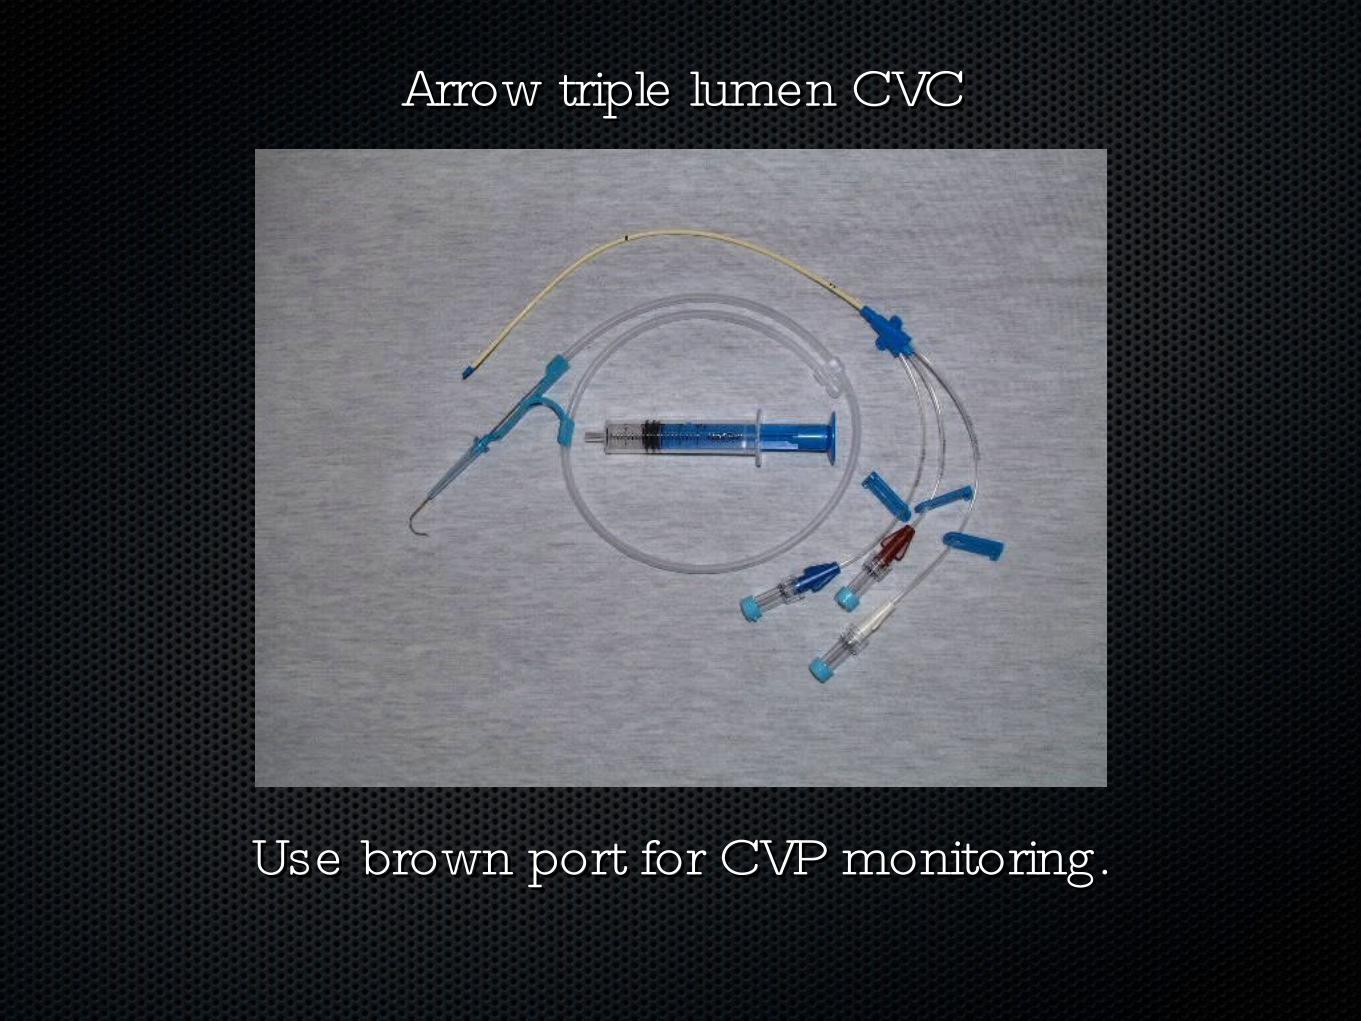
Use brown port for CVP monitoring.Use brown port for CVP monitoring.
Arrow triple lumen CVCArrow triple lumen CVC
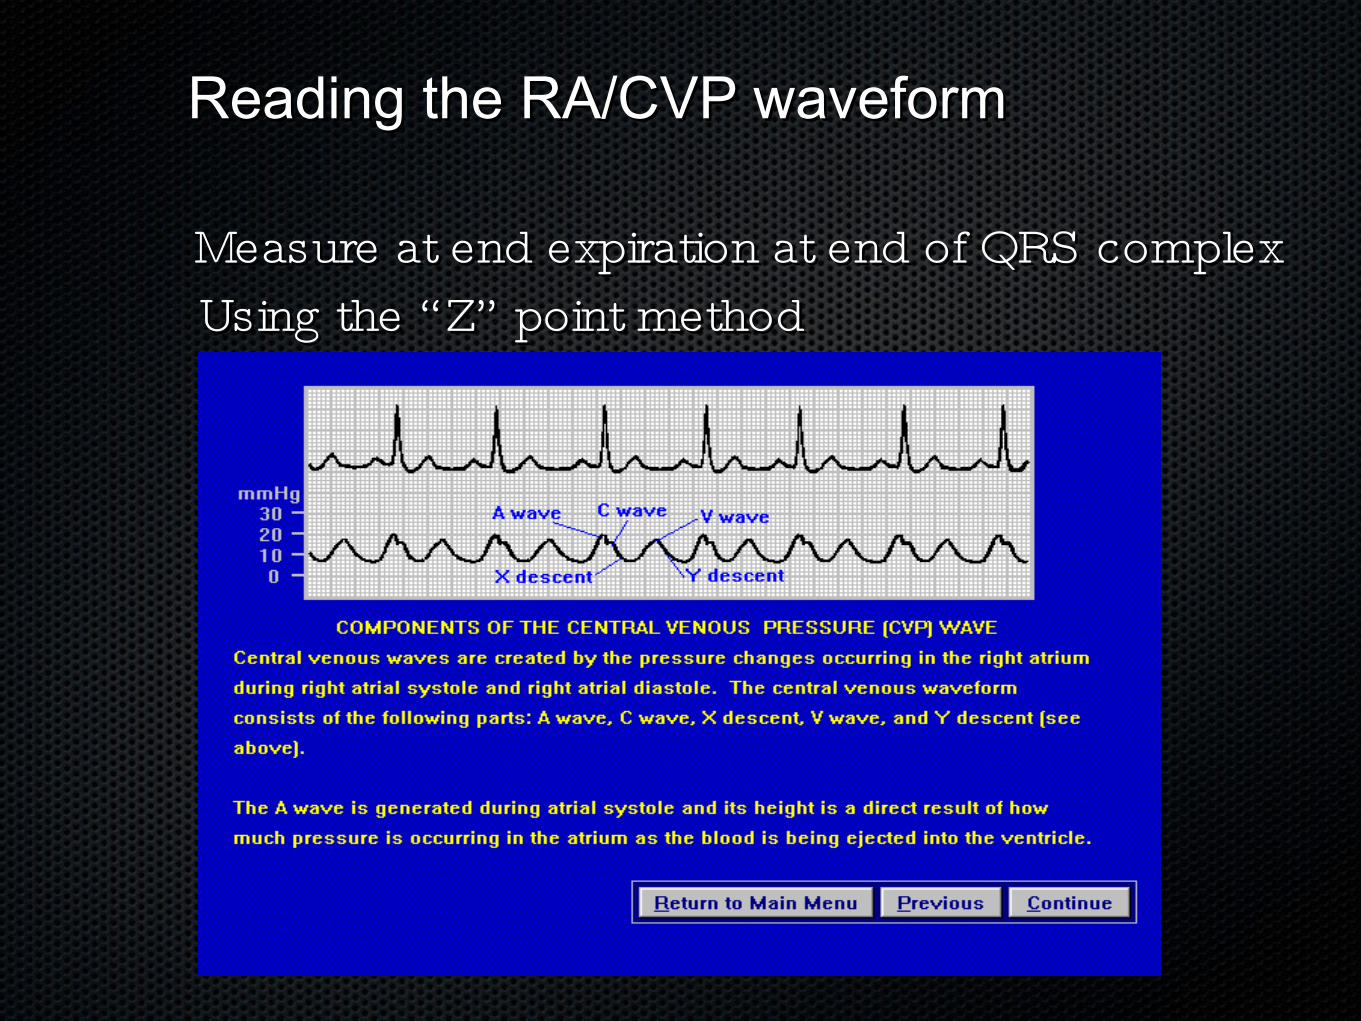
Reading the RA/CVP waveformReading the RA/CVP waveform
Measure at end expiration at end of QRS complexMeasure at end expiration at end of QRS complexUsing the “ Z” point methodUsing the “ Z” point method
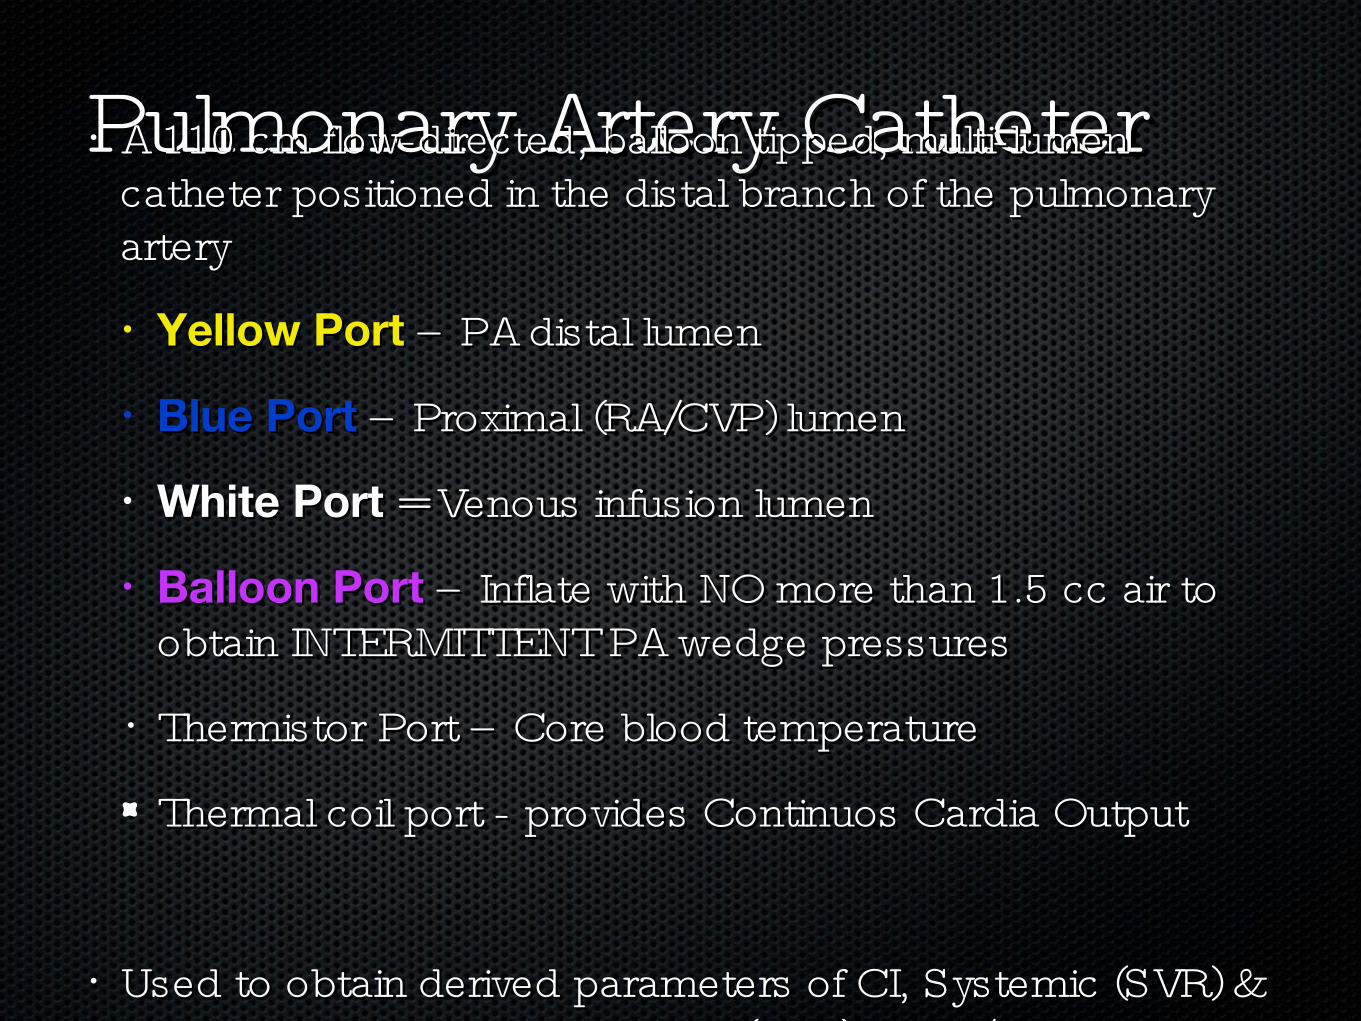
Pulmonary Artery CatheterPulmonary Artery Catheter• A 110 cm flow-directed, balloon tipped, multi-lumen A 110 cm flow-directed, balloon tipped, multi-lumen catheter positioned in the distal branch of the pulmonary catheter positioned in the distal branch of the pulmonary arteryartery
• Yellow PortYellow Port – PA distal lumen – PA distal lumen
• Blue PortBlue Port – Proximal (RA/CVP) lumen– Proximal (RA/CVP) lumen
• White PortWhite Port = Venous infusion lumen = Venous infusion lumen
• Balloon PortBalloon Port – Inflate with NO more than 1.5 cc air to – Inflate with NO more than 1.5 cc air to obtain INTERMITTENT PA wedge pressuresobtain INTERMITTENT PA wedge pressures
• Thermistor Port – Core blood temperatureThermistor Port – Core blood temperature
Thermal coil port - provides Continuos Cardia OutputThermal coil port - provides Continuos Cardia Output
• Used to obtain derived parameters of CI, Systemic (SVR) & Used to obtain derived parameters of CI, Systemic (SVR) & Pulmonary Vascular Resistance (PVR); Sv02/CCO Pulmonary Vascular Resistance (PVR); Sv02/CCO monitoringmonitoring
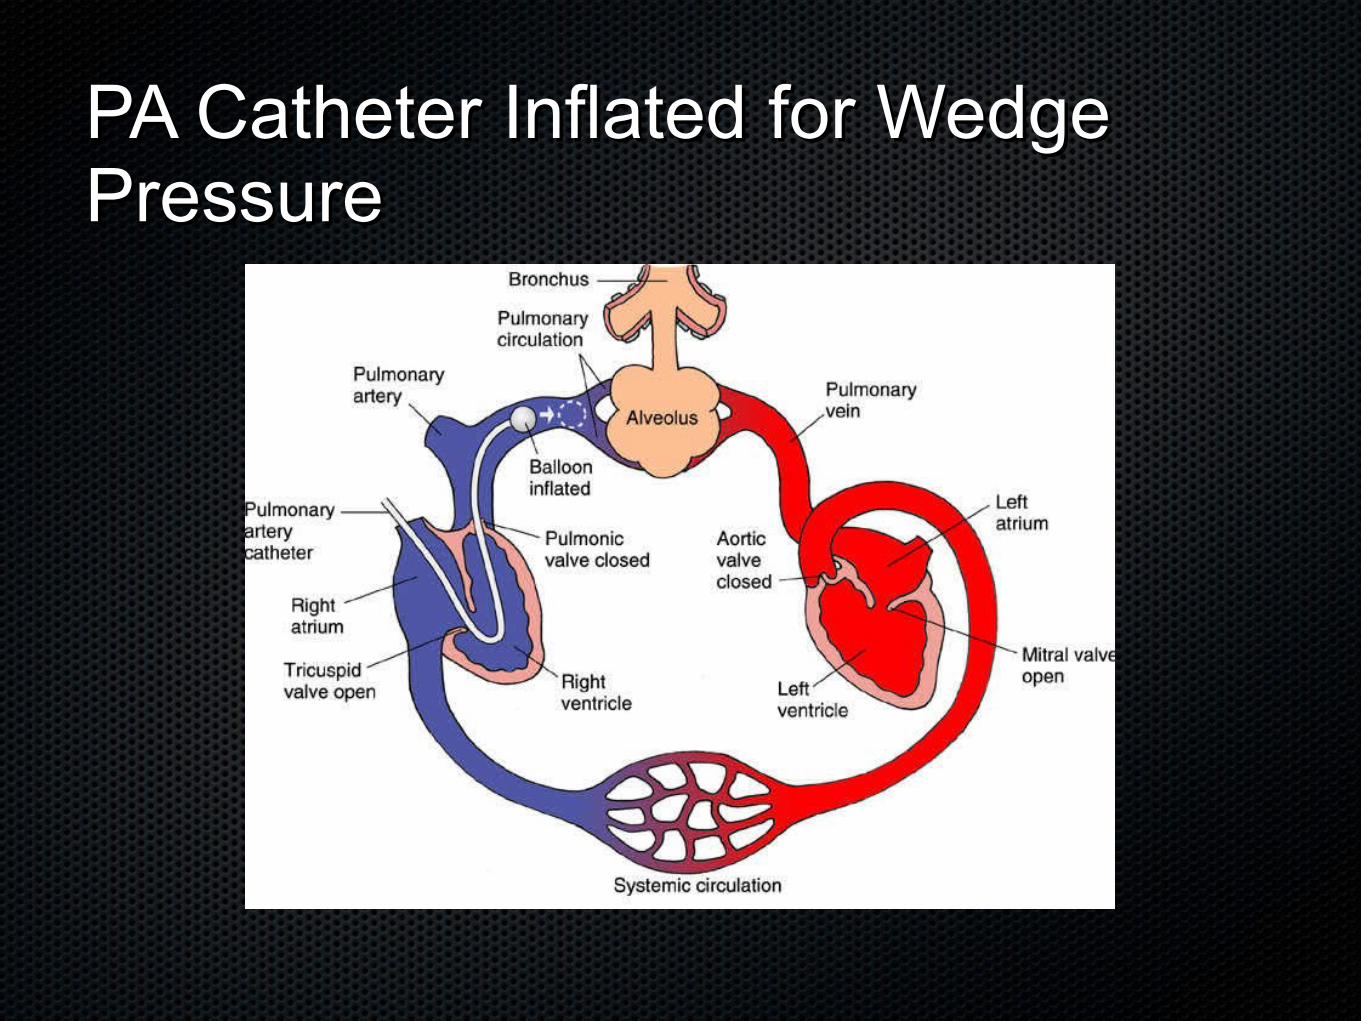
PA Catheter Inflated for Wedge PA Catheter Inflated for Wedge PressurePressure
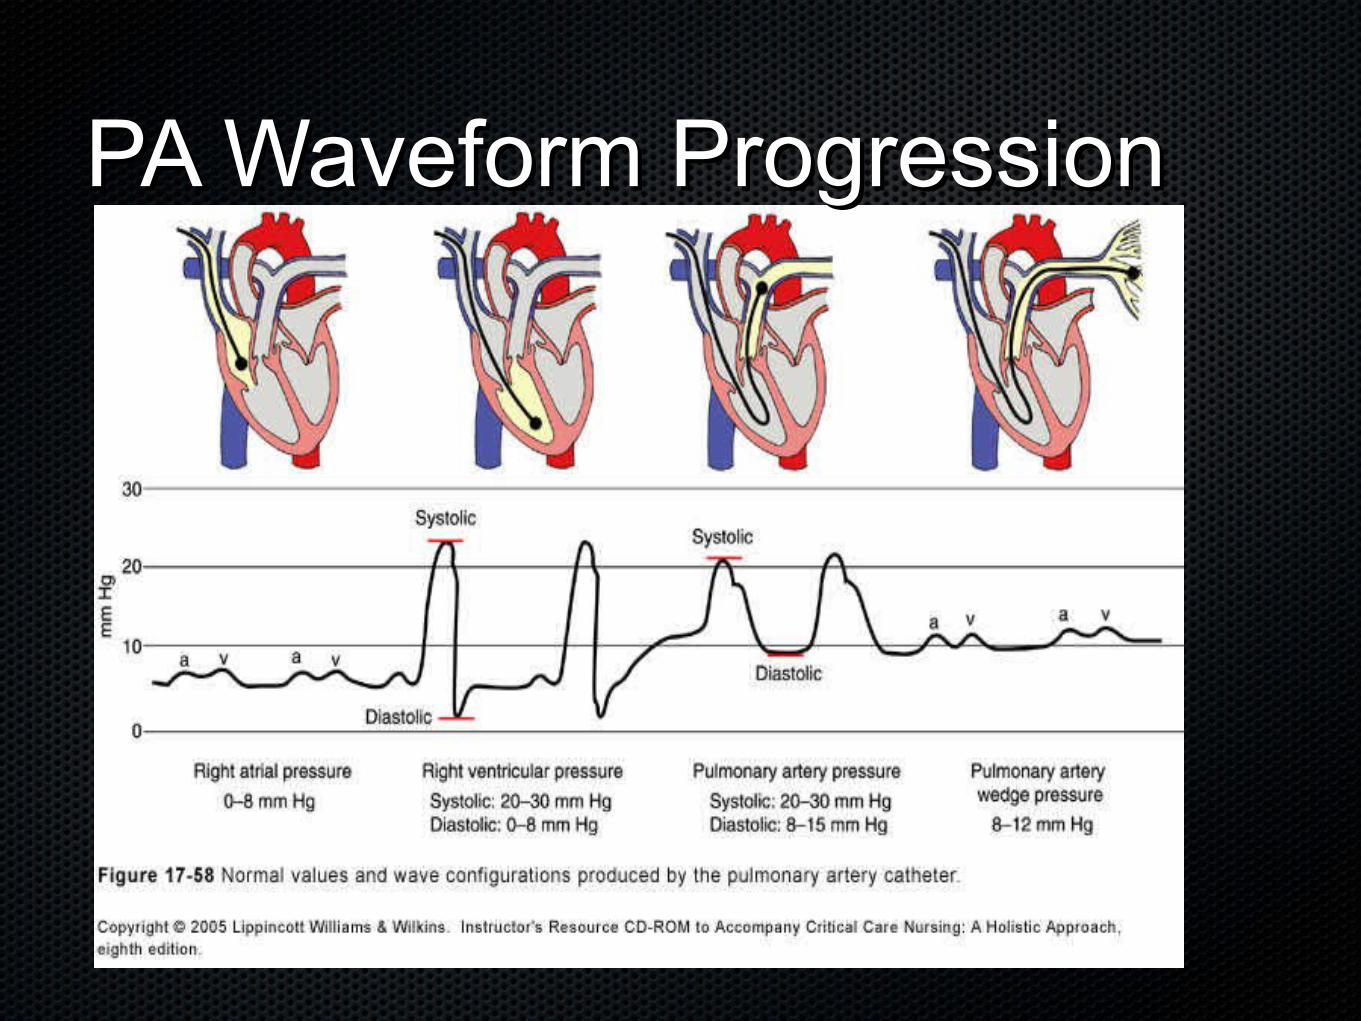
PA Waveform ProgressionPA Waveform Progression
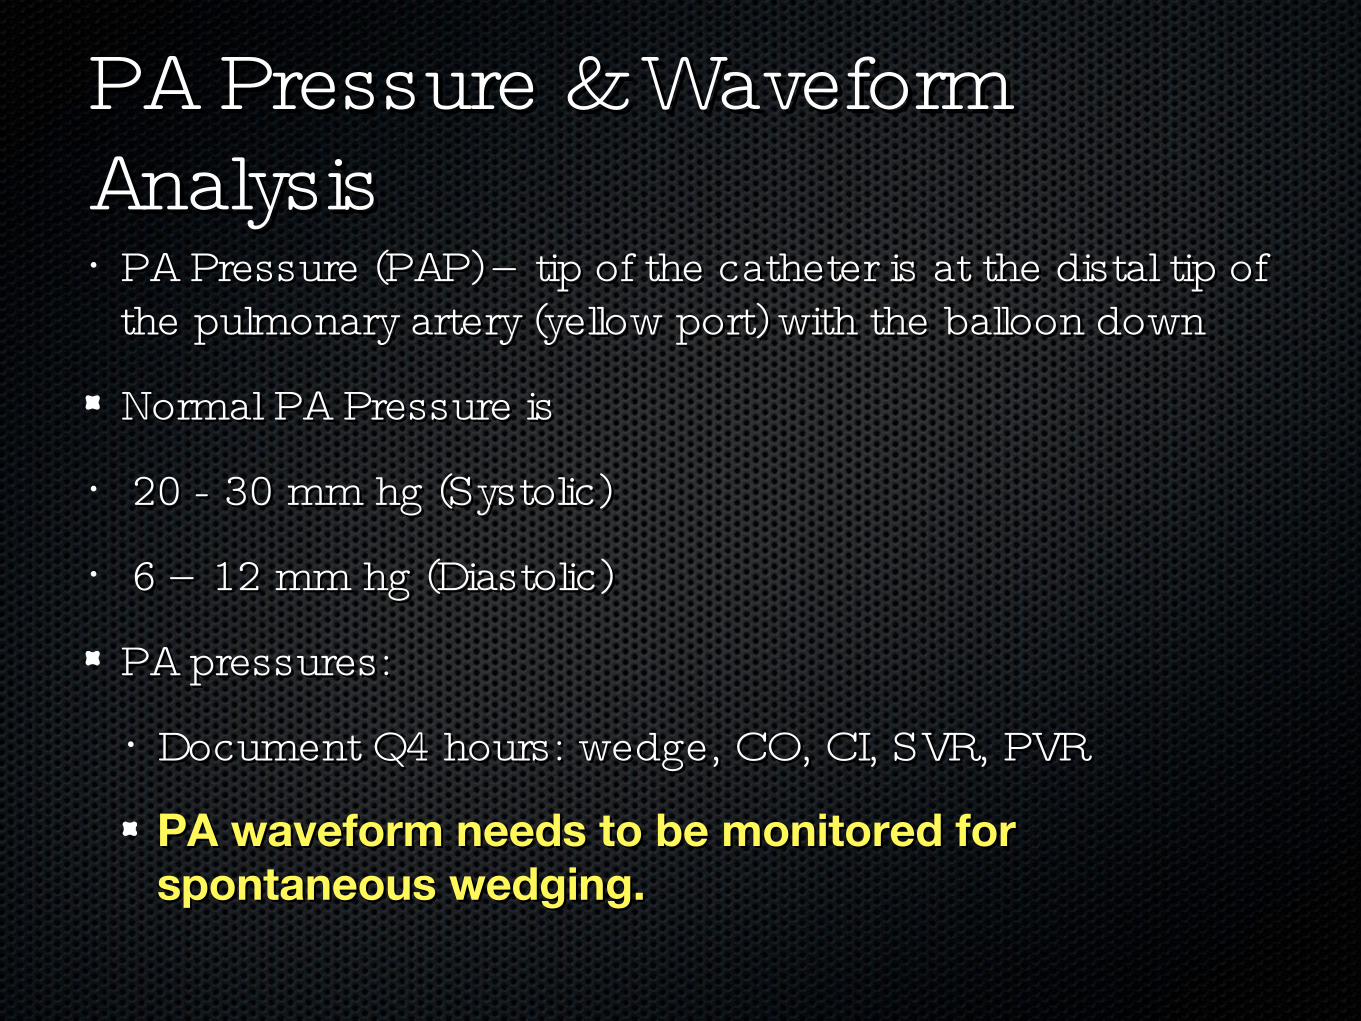
PA Pressure & Waveform PA Pressure & Waveform AnalysisAnalysis• PA Pressure (PAP) – tip of the catheter is at the distal tip of PA Pressure (PAP) – tip of the catheter is at the distal tip of
the pulmonary artery (yellow port) with the balloon downthe pulmonary artery (yellow port) with the balloon down
Normal PA Pressure isNormal PA Pressure is
• 20 - 30 mm hg (Systolic) 20 - 30 mm hg (Systolic)
• 6 – 12 mm hg (Diastolic)6 – 12 mm hg (Diastolic)
PA pressures:PA pressures:
• Document Q4 hours: wedge, CO, CI, SVR, PVRDocument Q4 hours: wedge, CO, CI, SVR, PVR
PA waveform needs to be monitored for PA waveform needs to be monitored for spontaneous wedging.spontaneous wedging.

PA Wedge Pressure PA Wedge Pressure • PA wedge pressure – obtained by inflating distal balloon PA wedge pressure – obtained by inflating distal balloon
port w/ no more than 1.5 ccport w/ no more than 1.5 cc
Inflate the balloon slowly observe for a change in waveform Inflate the balloon slowly observe for a change in waveform from PA to “ Wedge” .from PA to “ Wedge” .
• Only use as much air as needed to obtain wedge.Only use as much air as needed to obtain wedge.
• Make a mental note of how much air is needed to wedgeMake a mental note of how much air is needed to wedge
Inflation will block off all pressures from right side of Inflation will block off all pressures from right side of heart – it “sees” ahead to the left side of the heartheart – it “sees” ahead to the left side of the heart
• Do NOT inflate for longer than 15 seconds (prolonged Do NOT inflate for longer than 15 seconds (prolonged inflation will result in pulmonary infarction, PA rupture & inflation will result in pulmonary infarction, PA rupture & hemorrhage) hemorrhage)
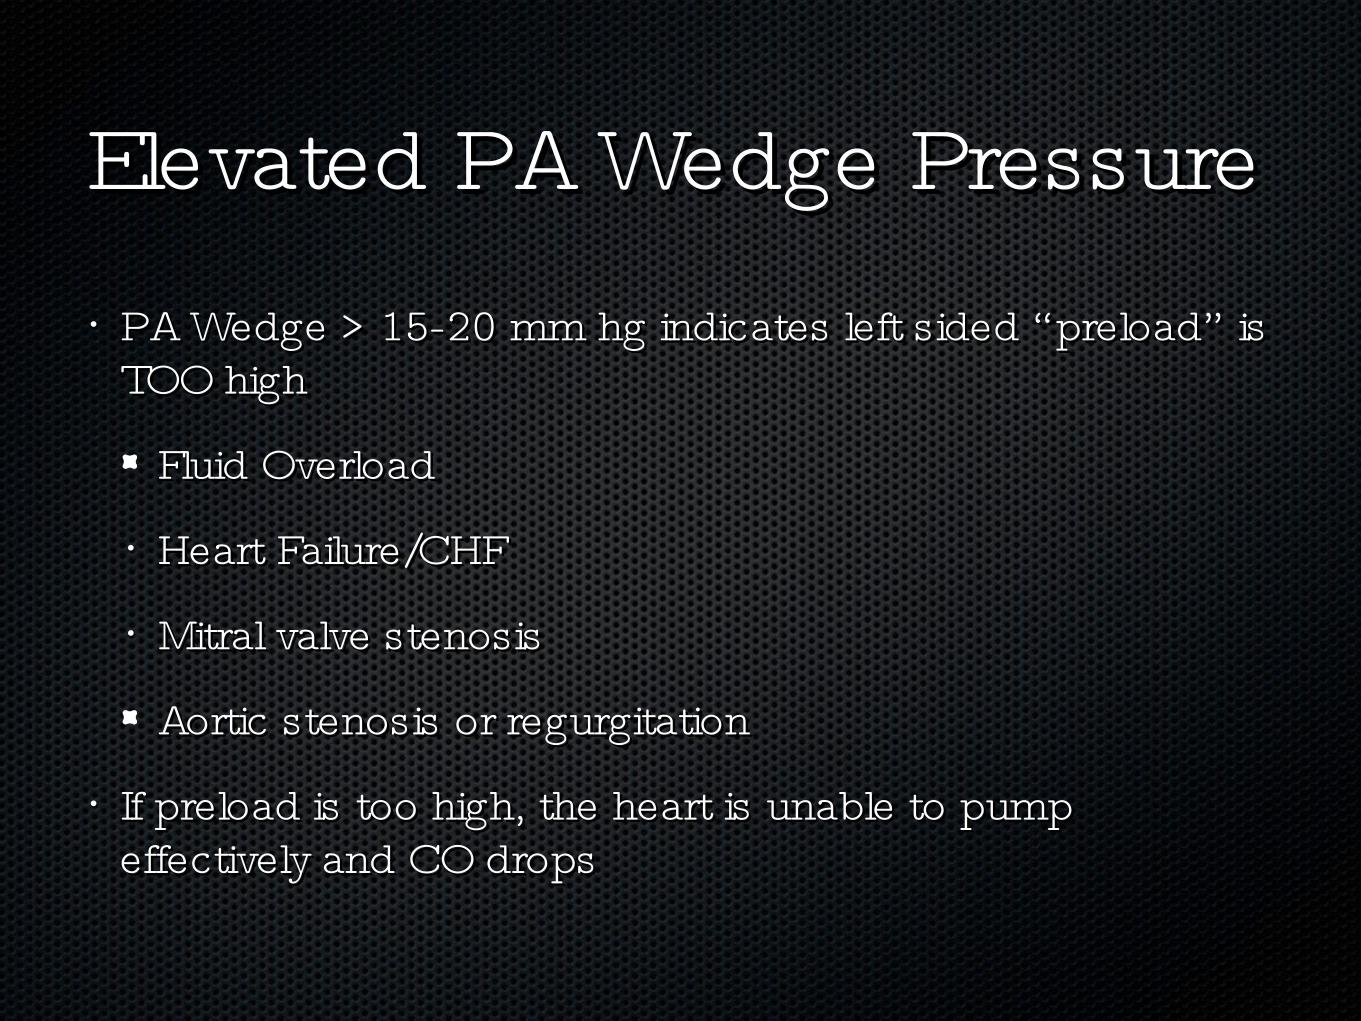
Elevated PA Wedge PressureElevated PA Wedge Pressure• PA Wedge > 15-20 mm hg indicates left sided “ preload” is PA Wedge > 15-20 mm hg indicates left sided “ preload” is
TOO highTOO high
Fluid OverloadFluid Overload
• Heart Failure/CHFHeart Failure/CHF
• Mitral valve stenosisMitral valve stenosis
Aortic stenosis or regurgitationAortic stenosis or regurgitation
• If preload is too high, the heart is unable to pump If preload is too high, the heart is unable to pump effectively and CO dropseffectively and CO drops
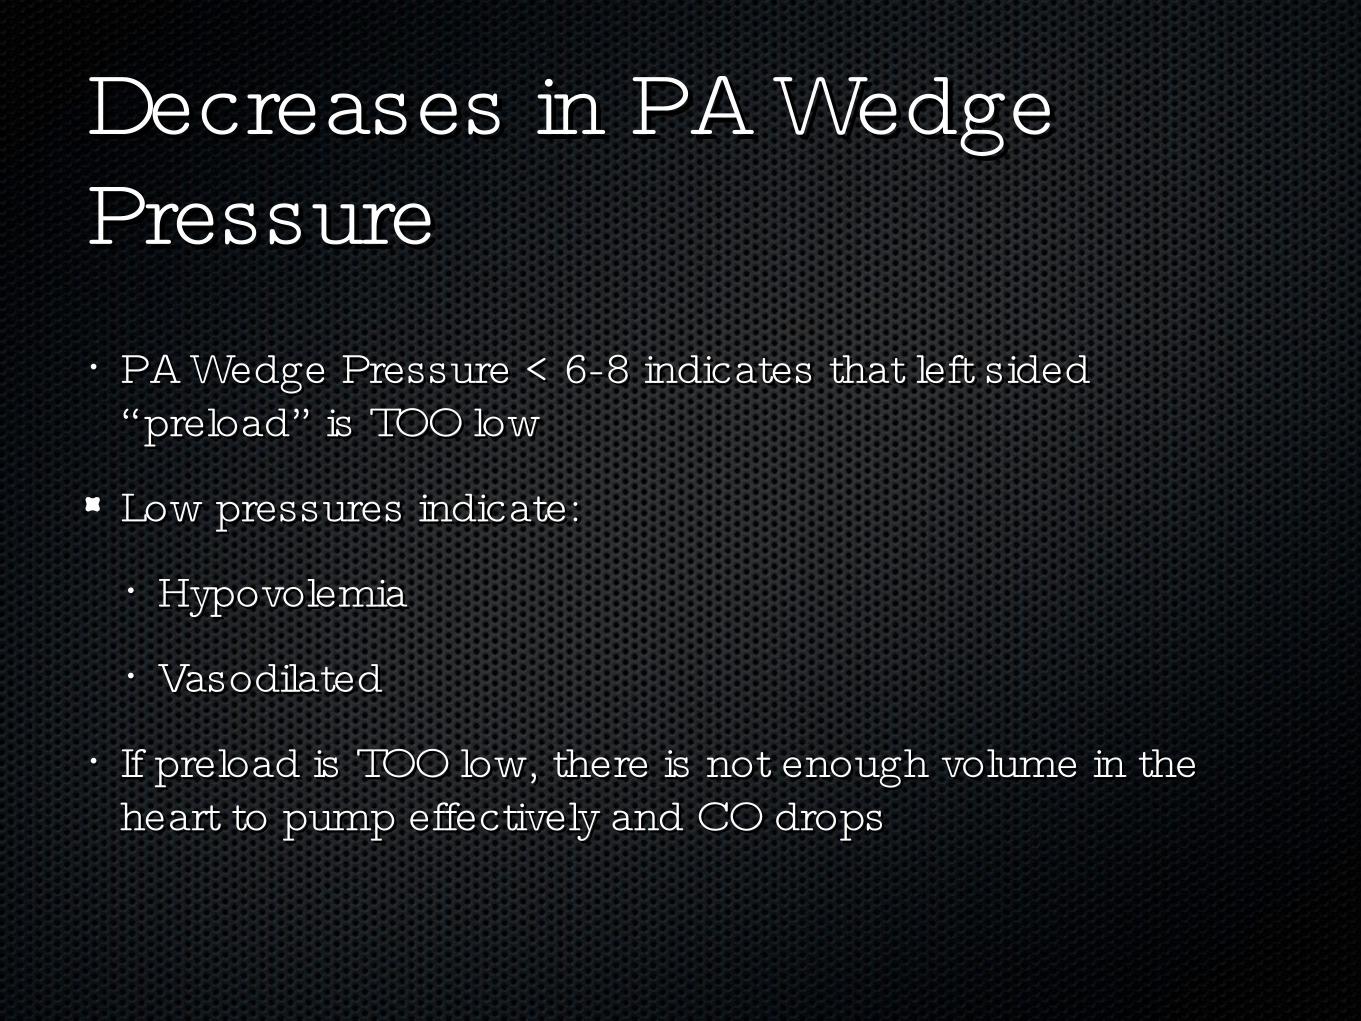
Decreases in PA Wedge Decreases in PA Wedge Pressure Pressure • PA Wedge Pressure < 6-8 indicates that left sided PA Wedge Pressure < 6-8 indicates that left sided
“ preload” is TOO low“ preload” is TOO low
Low pressures indicate:Low pressures indicate:
• HypovolemiaHypovolemia
• VasodilatedVasodilated
• If preload is TOO low, there is not enough volume in the If preload is TOO low, there is not enough volume in the heart to pump effectively and CO dropsheart to pump effectively and CO drops

What the hell are you talking about ?What the hell are you talking about ?
Cardiac Output ParametersCardiac Output Parameters
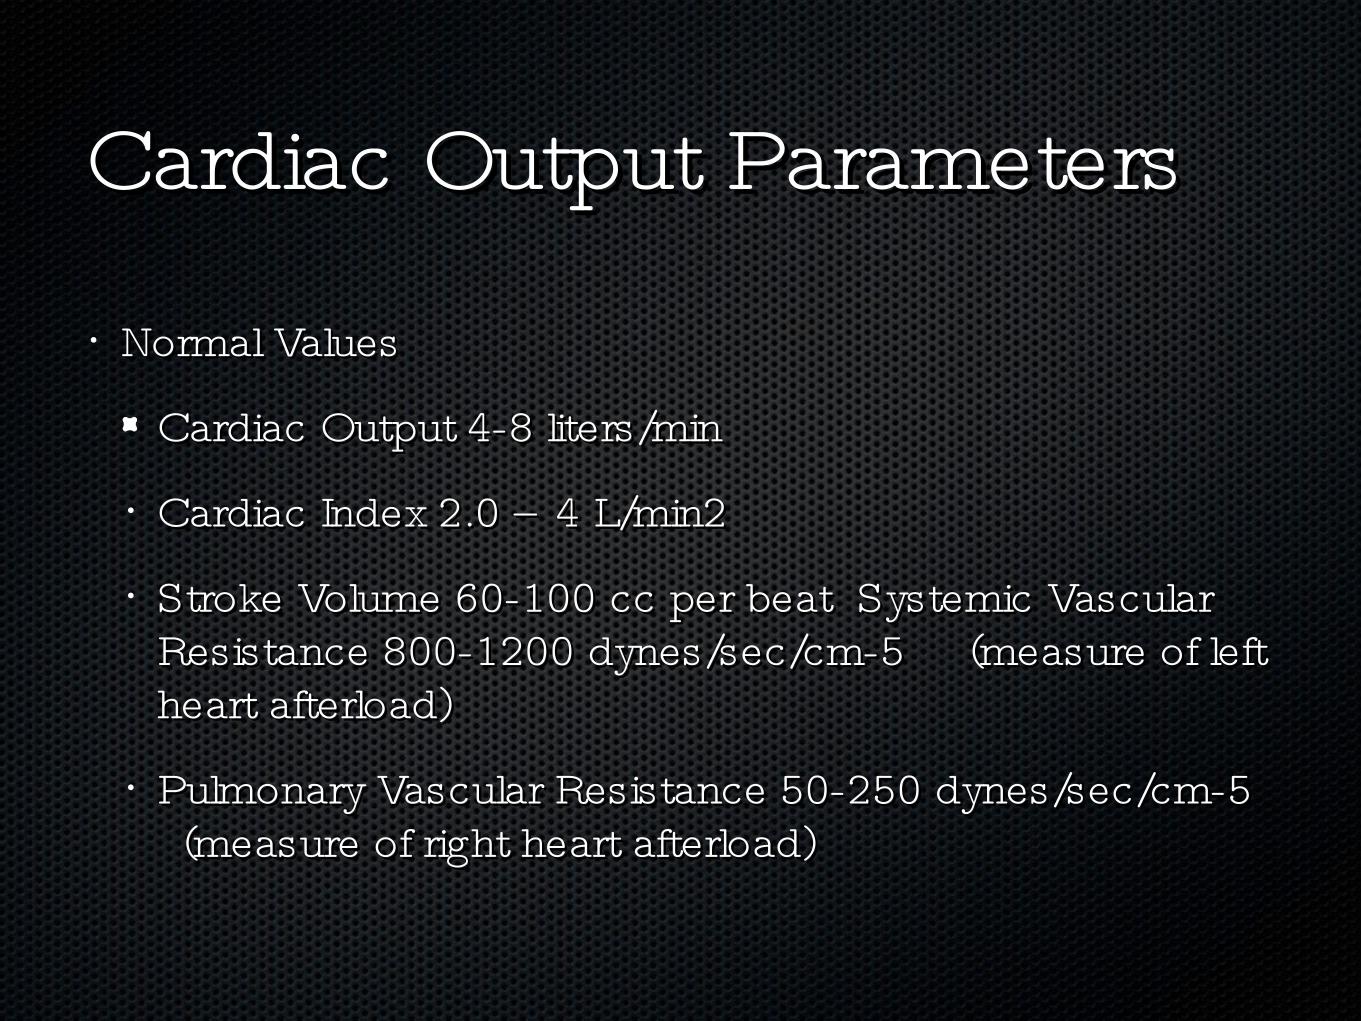
• Normal ValuesNormal Values
Cardiac Output 4-8 liters/minCardiac Output 4-8 liters/min
• Cardiac Index 2.0 – 4 L/min2Cardiac Index 2.0 – 4 L/min2
• Stroke Volume 60-100 cc per beat Systemic Vascular Stroke Volume 60-100 cc per beat Systemic Vascular Resistance 800-1200 dynes/sec/cm-5 (measure of left Resistance 800-1200 dynes/sec/cm-5 (measure of left heart afterload)heart afterload)
• Pulmonary Vascular Resistance 50-250 dynes/sec/cm-5 Pulmonary Vascular Resistance 50-250 dynes/sec/cm-5 (measure of right heart afterload) (measure of right heart afterload)
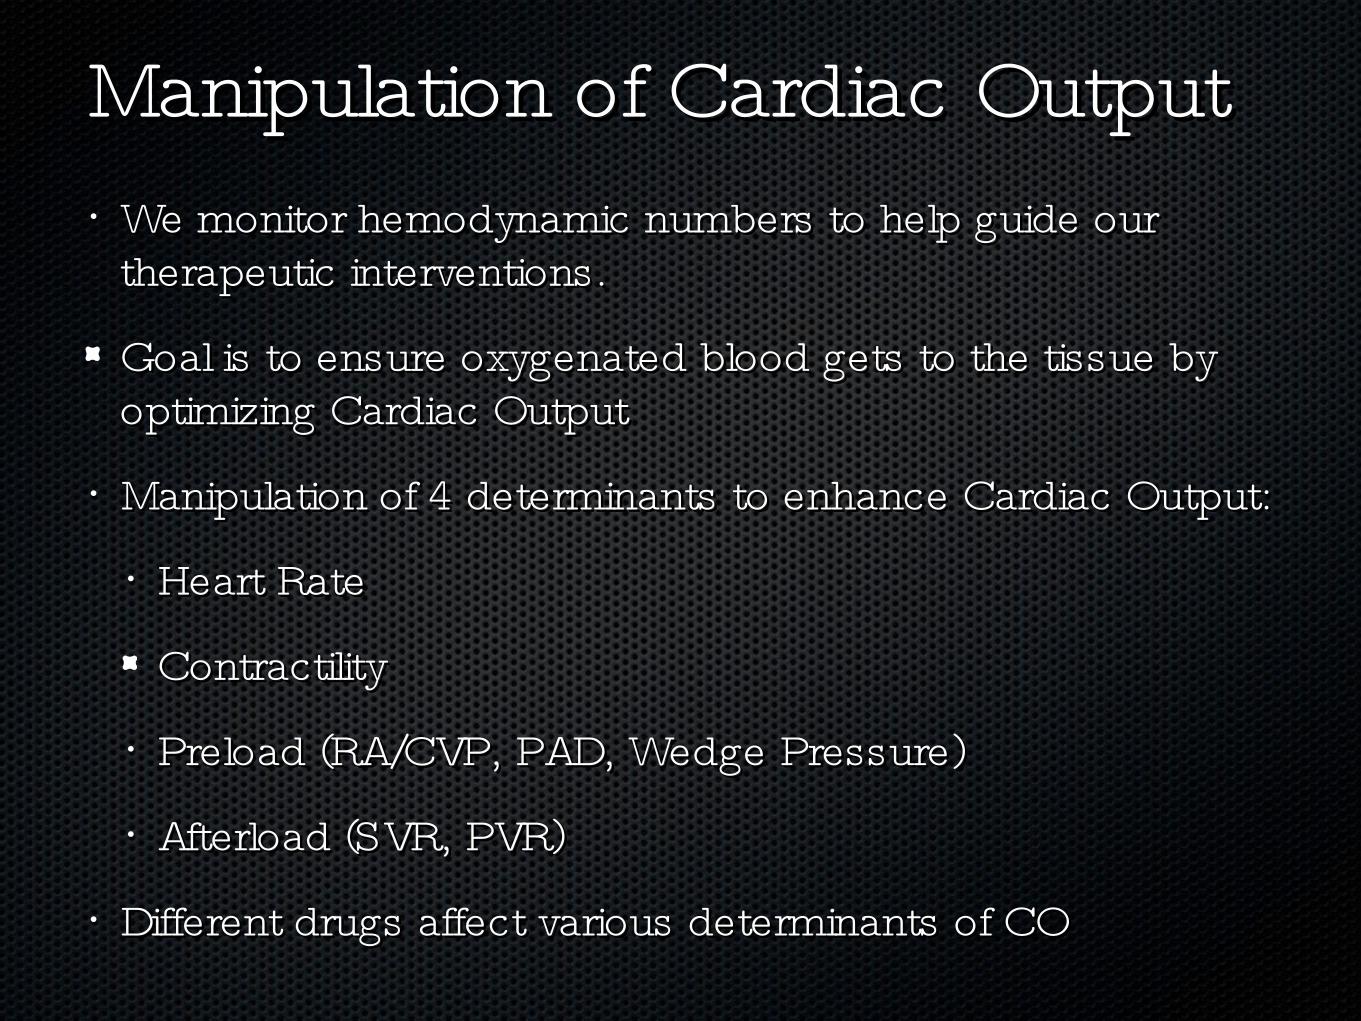
Manipulation of Cardiac OutputManipulation of Cardiac Output• We monitor hemodynamic numbers to help guide our We monitor hemodynamic numbers to help guide our
therapeutic interventions.therapeutic interventions.
Goal is to ensure oxygenated blood gets to the tissue by Goal is to ensure oxygenated blood gets to the tissue by optimizing Cardiac Outputoptimizing Cardiac Output
• Manipulation of 4 determinants to enhance Cardiac Output:Manipulation of 4 determinants to enhance Cardiac Output:
• Heart Rate Heart Rate
ContractilityContractility
• Preload (RA/CVP, PAD, Wedge Pressure)Preload (RA/CVP, PAD, Wedge Pressure)
• Afterload (SVR, PVR)Afterload (SVR, PVR)
• Different drugs affect various determinants of CODifferent drugs affect various determinants of CO
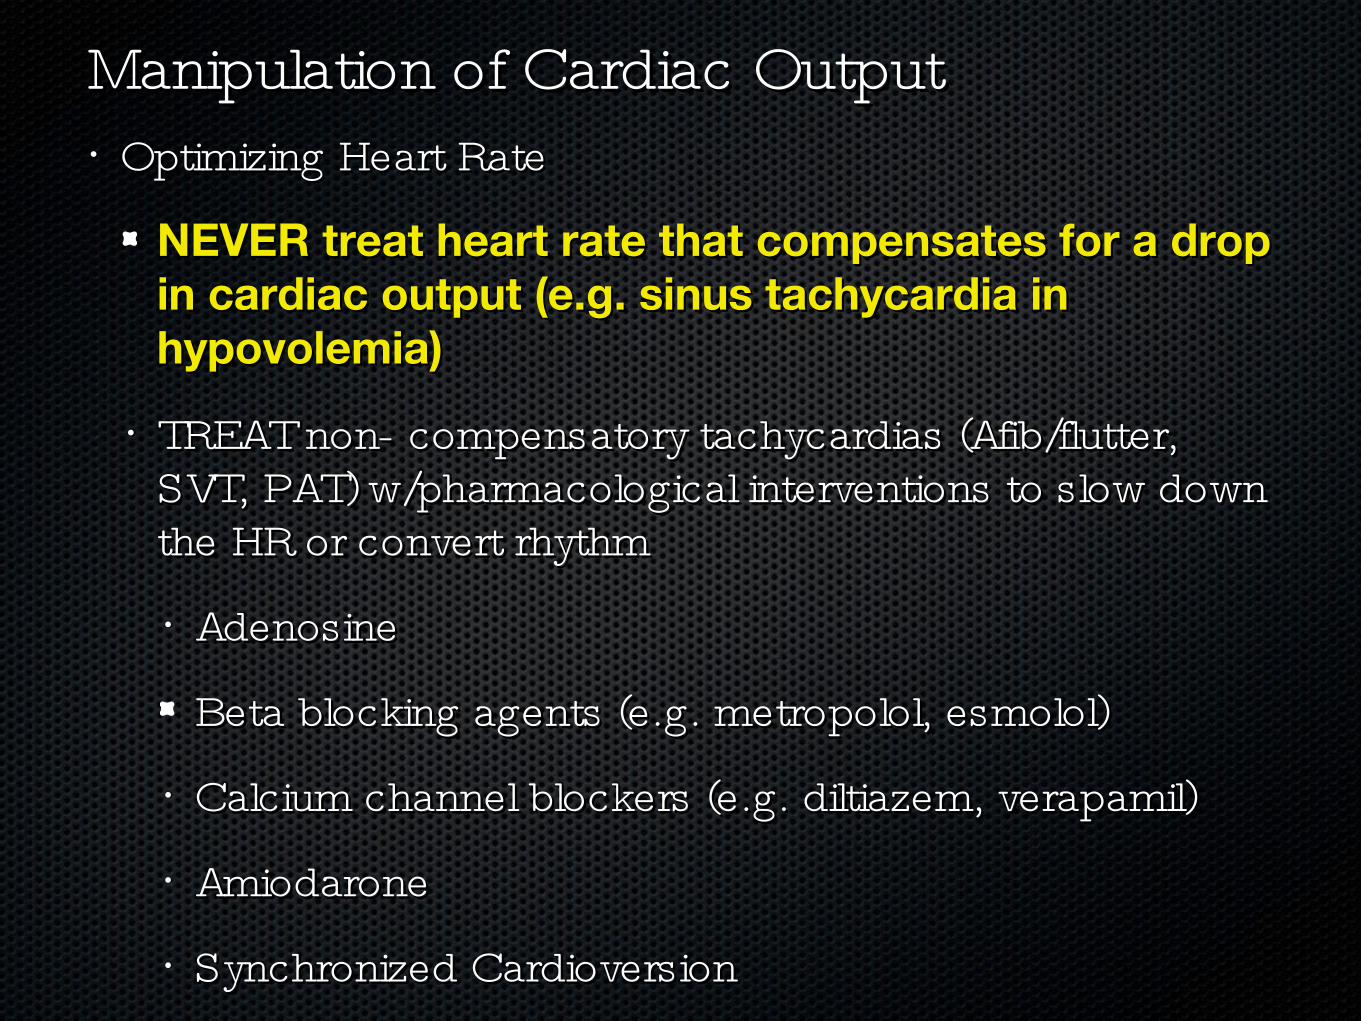
Manipulation of Cardiac OutputManipulation of Cardiac Output• Optimizing Heart RateOptimizing Heart Rate
NEVER treat heart rate that compensates for a drop NEVER treat heart rate that compensates for a drop in cardiac output (e.g. sinus tachycardia in in cardiac output (e.g. sinus tachycardia in hypovolemia)hypovolemia)
• TREAT non- compensatory tachycardias (Afib/flutter, TREAT non- compensatory tachycardias (Afib/flutter, SVT, PAT) w/pharmacological interventions to slow down SVT, PAT) w/pharmacological interventions to slow down the HR or convert rhythmthe HR or convert rhythm
• AdenosineAdenosine
Beta blocking agents (e.g. metropolol, esmolol)Beta blocking agents (e.g. metropolol, esmolol)
• Calcium channel blockers (e.g. diltiazem, verapamil)Calcium channel blockers (e.g. diltiazem, verapamil)
• AmiodaroneAmiodarone
• Synchronized CardioversionSynchronized Cardioversion

PharmacotherapyPharmacotherapy• Preload Manipulation:Preload Manipulation:
Volume expansion or reductionVolume expansion or reduction
• Afterload Manipulation:Afterload Manipulation:
• Vasopressors & vasodilatorsVasopressors & vasodilators
Contractility Manipulation:Contractility Manipulation:
• + and – Inotropes+ and – Inotropes
• Combination therapy:Combination therapy:
Inotropes + vasodilatorsInotropes + vasodilators
• Combined InotropesCombined Inotropes
Combined VasodilatorsCombined Vasodilators
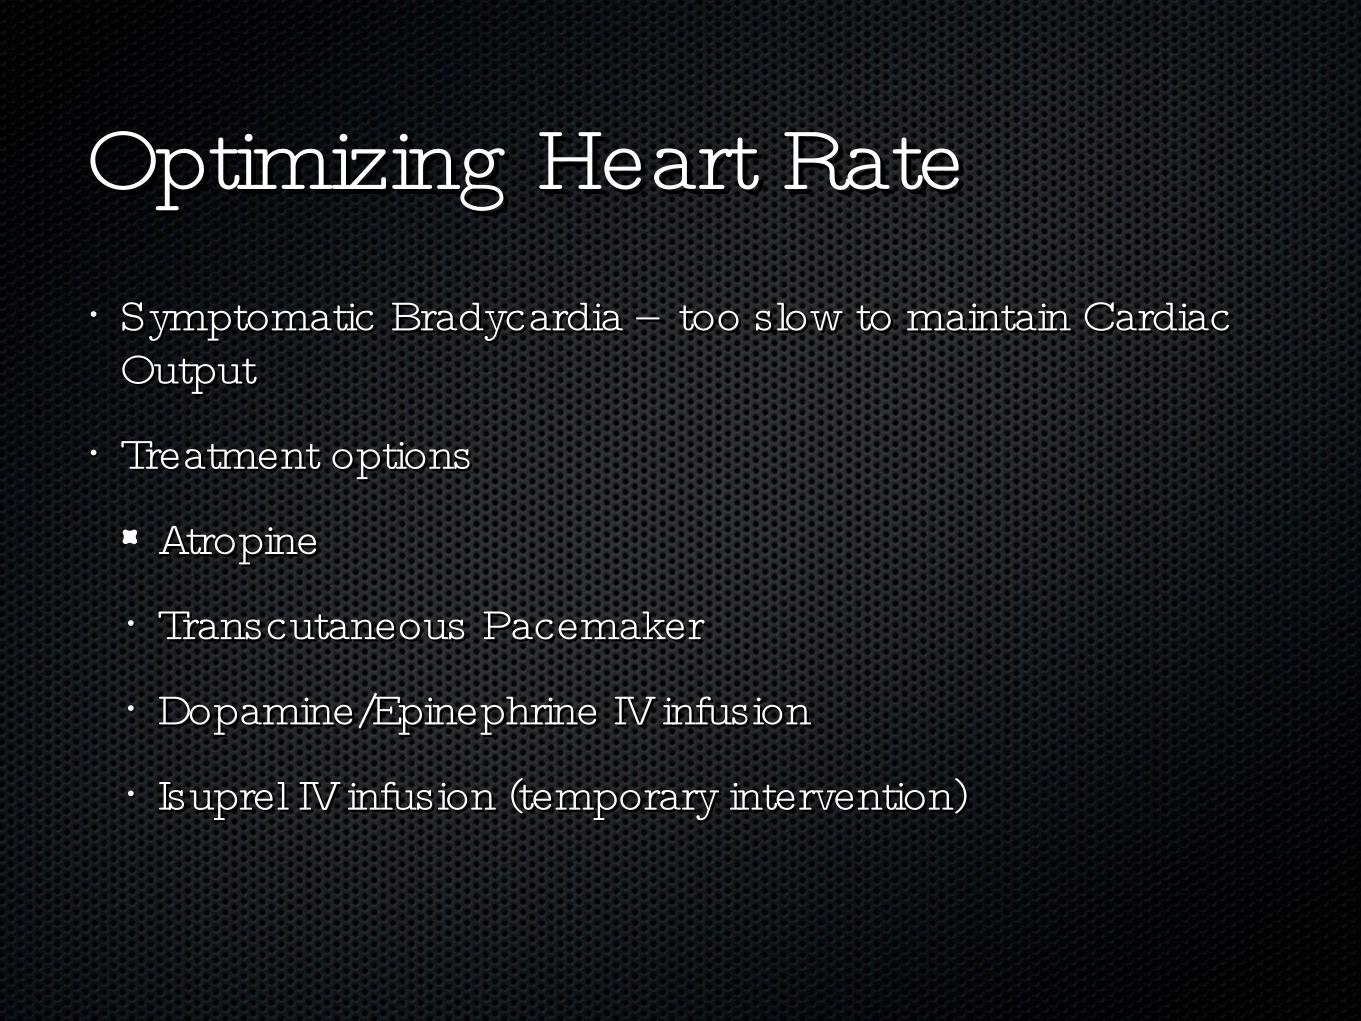
Optimizing Heart RateOptimizing Heart Rate• Symptomatic Bradycardia – too slow to maintain Cardiac Symptomatic Bradycardia – too slow to maintain Cardiac
Output Output
• Treatment optionsTreatment options
AtropineAtropine
• Transcutaneous Pacemaker Transcutaneous Pacemaker
• Dopamine/Epinephrine IV infusionDopamine/Epinephrine IV infusion
• Isuprel IV infusion (temporary intervention)Isuprel IV infusion (temporary intervention)
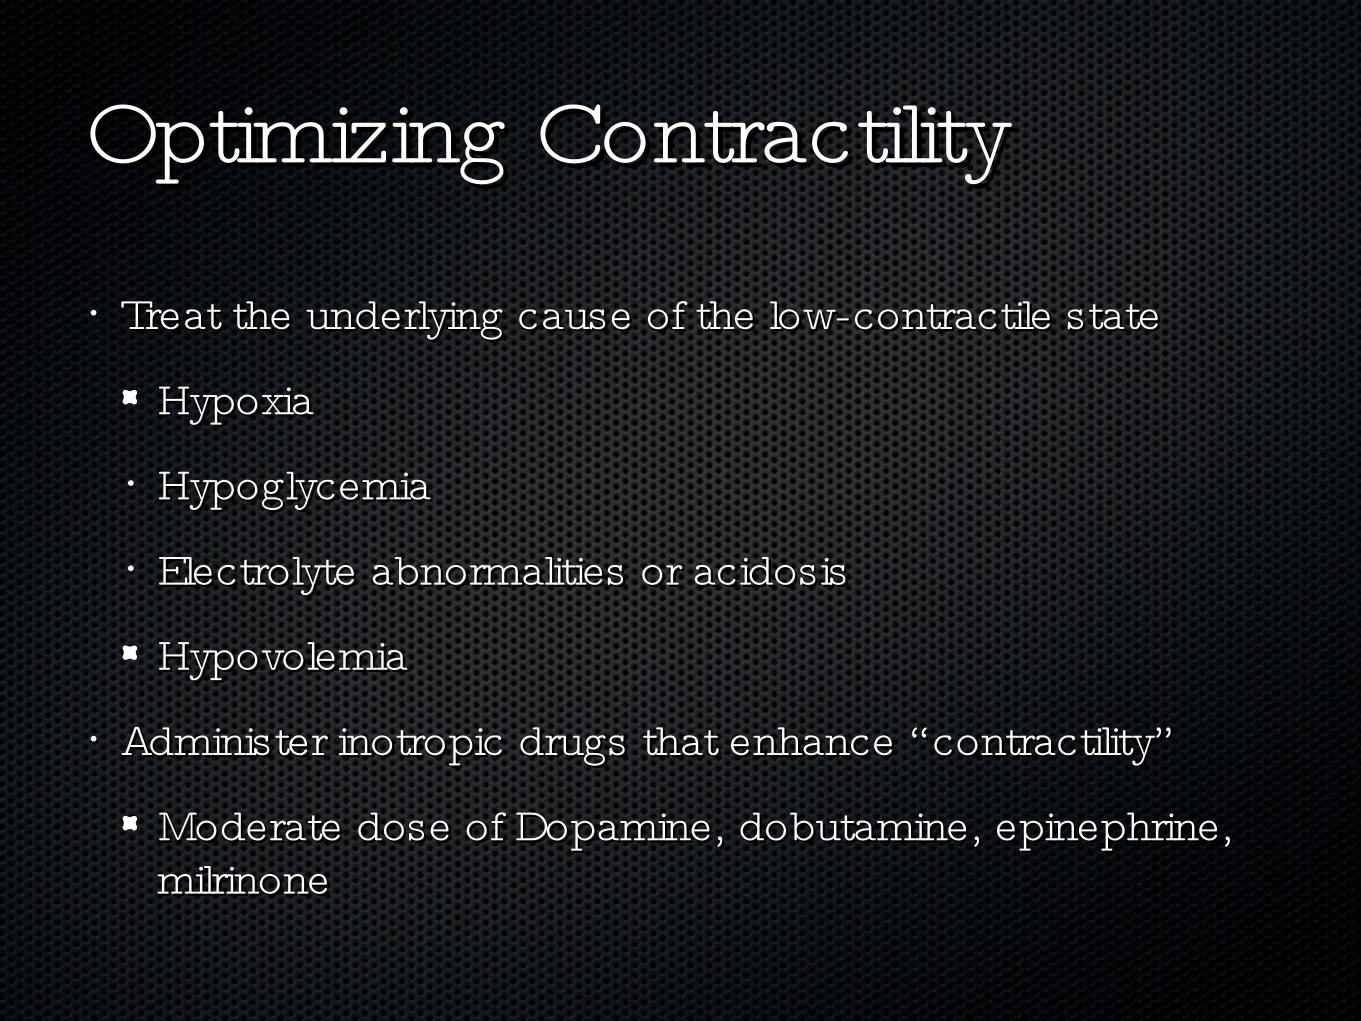
Optimizing ContractilityOptimizing Contractility
• Treat the underlying cause of the low-contractile stateTreat the underlying cause of the low-contractile state
HypoxiaHypoxia
• HypoglycemiaHypoglycemia
• Electrolyte abnormalities or acidosisElectrolyte abnormalities or acidosis
HypovolemiaHypovolemia
• Administer inotropic drugs that enhance “ contractility”Administer inotropic drugs that enhance “ contractility”
Moderate dose of Dopamine, dobutamine, epinephrine, Moderate dose of Dopamine, dobutamine, epinephrine, milrinone milrinone
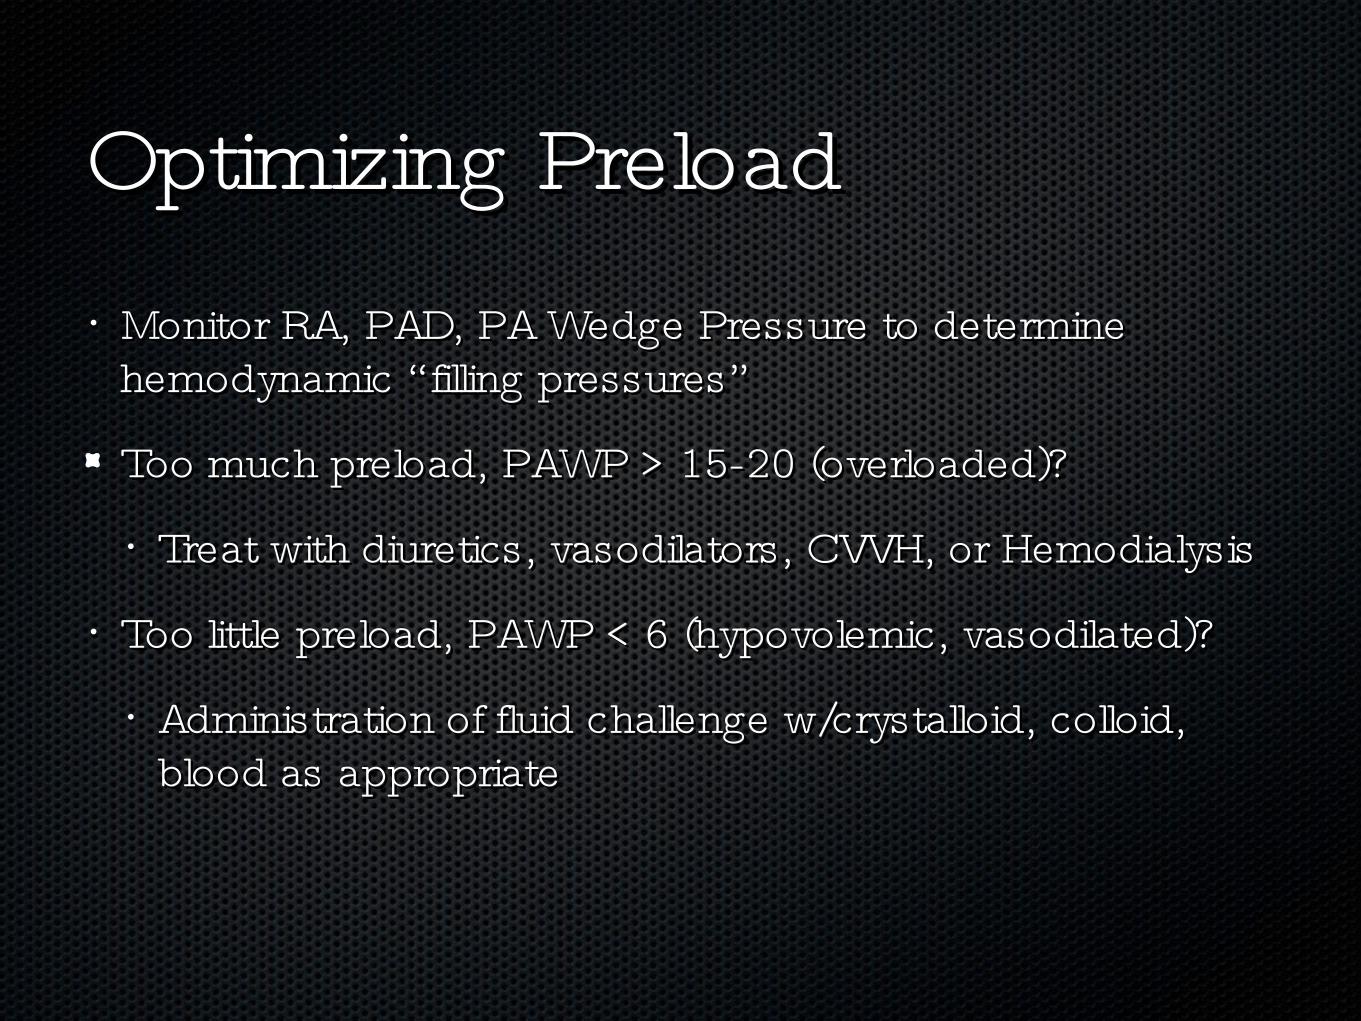
Optimizing PreloadOptimizing Preload• Monitor RA, PAD, PA Wedge Pressure to determine Monitor RA, PAD, PA Wedge Pressure to determine
hemodynamic “ filling pressures”hemodynamic “ filling pressures”
Too much preload, PAWP > 15-20 (overloaded)? Too much preload, PAWP > 15-20 (overloaded)?
• Treat with diuretics, vasodilators, CVVH, or HemodialysisTreat with diuretics, vasodilators, CVVH, or Hemodialysis
• Too little preload, PAWP < 6 (hypovolemic, vasodilated)?Too little preload, PAWP < 6 (hypovolemic, vasodilated)?
• Administration of fluid challenge w/crystalloid, colloid, Administration of fluid challenge w/crystalloid, colloid, blood as appropriateblood as appropriate
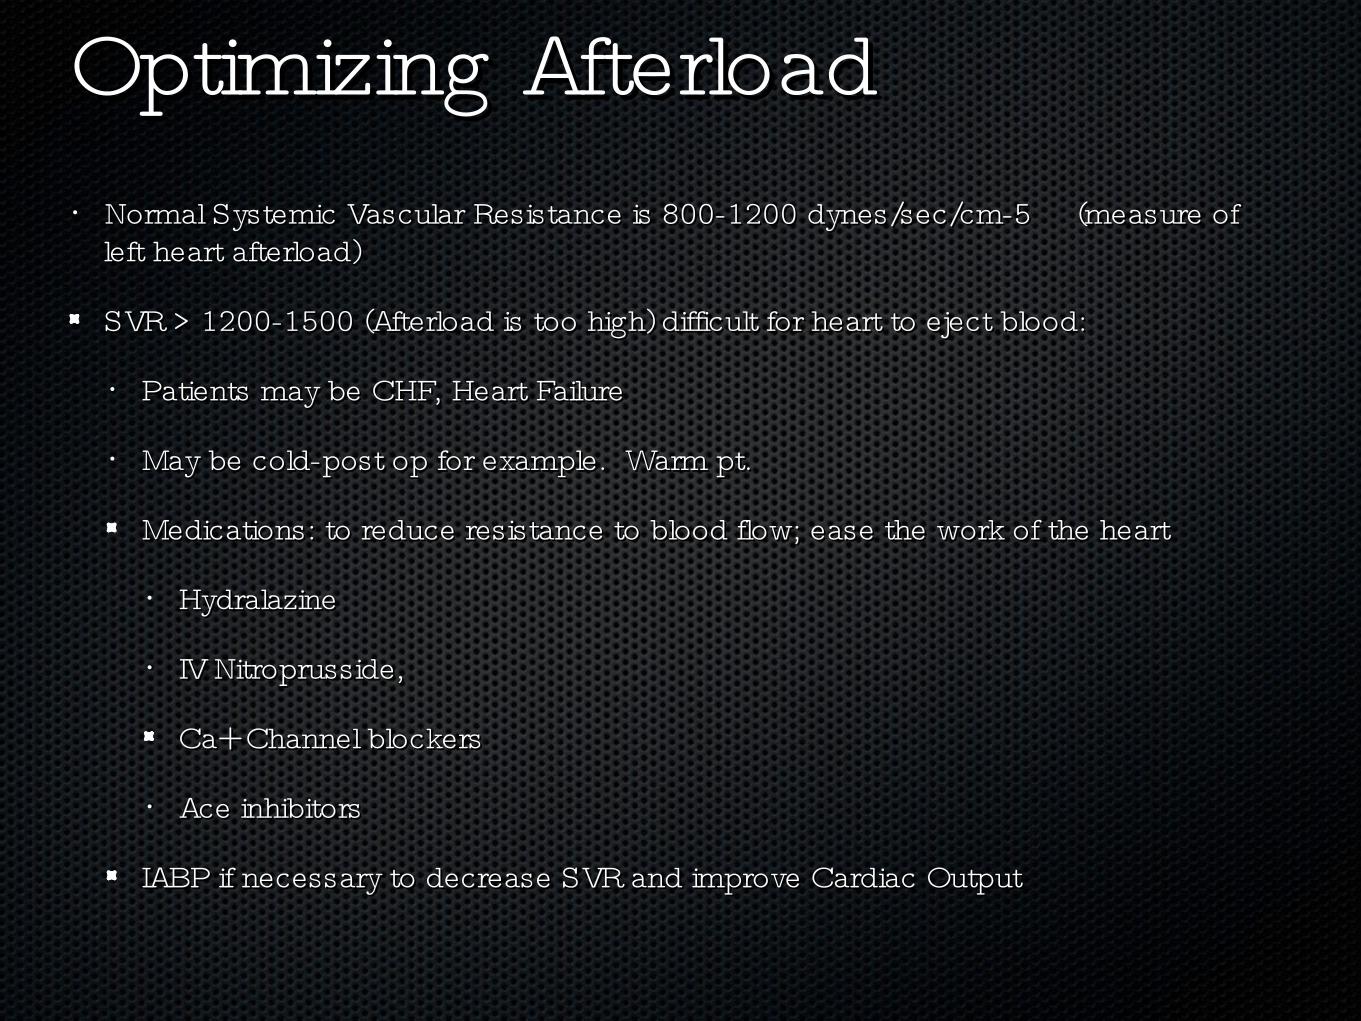
Optimizing AfterloadOptimizing Afterload• Normal Systemic Vascular Resistance is 800-1200 dynes/sec/cm-5 (measure of Normal Systemic Vascular Resistance is 800-1200 dynes/sec/cm-5 (measure of
left heart afterload)left heart afterload)
SVR > 1200-1500 (Afterload is too high) difficult for heart to eject blood:SVR > 1200-1500 (Afterload is too high) difficult for heart to eject blood:
• Patients may be CHF, Heart FailurePatients may be CHF, Heart Failure
• May be cold-post op for example. Warm pt.May be cold-post op for example. Warm pt.
Medications: to reduce resistance to blood flow; ease the work of the heartMedications: to reduce resistance to blood flow; ease the work of the heart
• HydralazineHydralazine
• IV Nitroprusside, IV Nitroprusside,
Ca+ Channel blockersCa+ Channel blockers
• Ace inhibitorsAce inhibitors
IABP if necessary to decrease SVR and improve Cardiac OutputIABP if necessary to decrease SVR and improve Cardiac Output

Afterload ConceptsAfterload Concepts• Normal Pulmonary Vascular Resistance 50-250 dynes/sec/Normal Pulmonary Vascular Resistance 50-250 dynes/sec/
cm-5 (measure of right heart afterload)cm-5 (measure of right heart afterload)
PVR > 250 makes it difficult for RV to eject blood through PVR > 250 makes it difficult for RV to eject blood through the pulmonary circuit; left heart unable to get adequate the pulmonary circuit; left heart unable to get adequate oxygenated blood oxygenated blood
• Pulmonary hypertensionPulmonary hypertension
• Right Heart FailureRight Heart Failure
ARDSARDS
• COPDCOPD
Treatment with Nitric Oxide, Prostaglandins, DobutamineTreatment with Nitric Oxide, Prostaglandins, Dobutamine
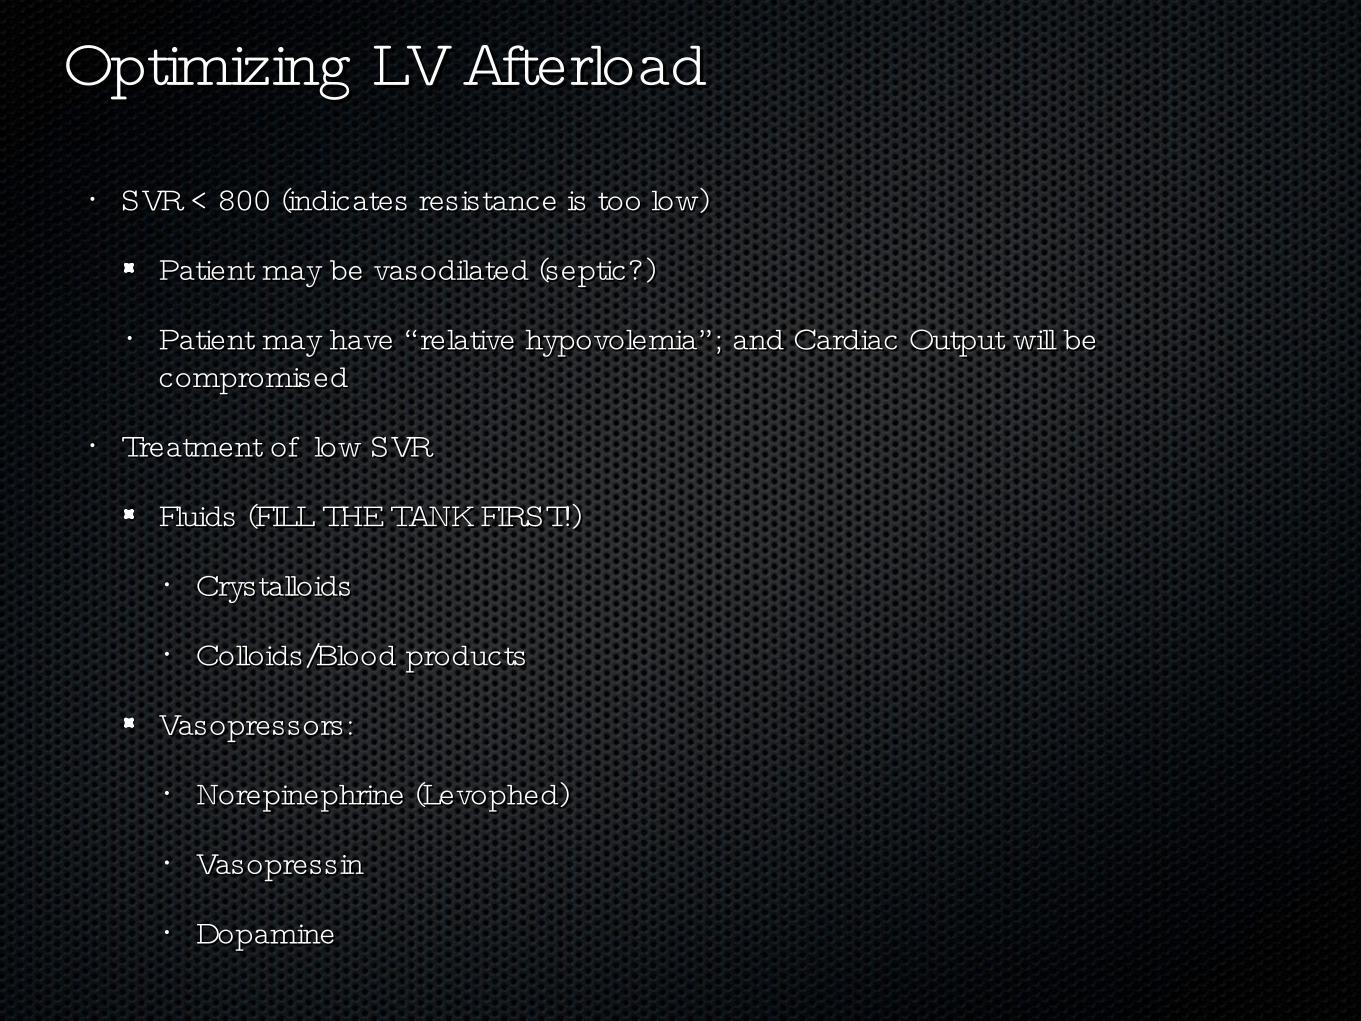
Optimizing LV AfterloadOptimizing LV Afterload
• SVR < 800 (indicates resistance is too low)SVR < 800 (indicates resistance is too low)
Patient may be vasodilated (septic?)Patient may be vasodilated (septic?)
• Patient may have “ relative hypovolemia” ; and Cardiac Output will be Patient may have “ relative hypovolemia” ; and Cardiac Output will be compromisedcompromised
• Treatment of low SVR Treatment of low SVR
Fluids (FILL THE TANK FIRST!)Fluids (FILL THE TANK FIRST!)
• CrystalloidsCrystalloids
• Colloids/Blood productsColloids/Blood products
Vasopressors:Vasopressors:
• Norepinephrine (Levophed)Norepinephrine (Levophed)
• VasopressinVasopressin
• DopamineDopamine

Q & A......Q & A......
Whew....Glad thats over !!!!Whew....Glad thats over !!!!