Hemodynamic Study Magnetic Resonance Imaging and Invasive ...
22
Page 1/22 Reverse Remodeling of Tricuspid Valve Morphology and Function in Chronic Thromboembolic Pulmonary Hypertension Patients Following Pulmonary Thromboendarterectomy – A Cardiac Magnetic Resonance Imaging and Invasive Hemodynamic Study Christian Alcaraz Frederiksen ( [email protected] ) Aarhus University Hospital Department of Cardiology: Arhus Universitetshospital Hjertesygdomme https://orcid.org/0000-0001-6583-2885 Farhad Waziri Aarhus University Hospital Steffen Ringgaard Aarhus University Hospital Søren Mellemkjær Aarhus University Hospital Tor Skibsted Clemmensen Aarhus University Hospital Vibeke Elisabeth Hjortdal Rigshospitalet Sten Lyager Nielsen Aarhus University Steen Hvitfeldt Poulsen Aarhus University Hospital Research article Keywords: Cardiac magnetic resonance imaging, Tricuspid valve, Chronic thromboembolic pulmonary hypertension Posted Date: August 4th, 2021 DOI: https://doi.org/10.21203/rs.3.rs-331545/v2
Transcript of Hemodynamic Study Magnetic Resonance Imaging and Invasive ...

Page 1/22
Reverse Remodeling of Tricuspid Valve Morphologyand Function in Chronic ThromboembolicPulmonary Hypertension Patients FollowingPulmonary Thromboendarterectomy – A CardiacMagnetic Resonance Imaging and InvasiveHemodynamic StudyChristian Alcaraz Frederiksen ( [email protected] )
Aarhus University Hospital Department of Cardiology: Arhus Universitetshospital Hjertesygdommehttps://orcid.org/0000-0001-6583-2885
Farhad Waziri Aarhus University Hospital
Steffen Ringgaard Aarhus University Hospital
Søren Mellemkjær Aarhus University Hospital
Tor Skibsted Clemmensen Aarhus University Hospital
Vibeke Elisabeth Hjortdal Rigshospitalet
Sten Lyager Nielsen Aarhus University
Steen Hvitfeldt Poulsen Aarhus University Hospital
Research article
Keywords: Cardiac magnetic resonance imaging, Tricuspid valve, Chronic thromboembolic pulmonaryhypertension
Posted Date: August 4th, 2021
DOI: https://doi.org/10.21203/rs.3.rs-331545/v2

Page 2/22
License: This work is licensed under a Creative Commons Attribution 4.0 International License. Read Full License

Page 3/22
AbstractBackground
To investigate changes in tricuspid annulus (TA) and tricuspid valve (TV) morphology among chronicthromboembolic pulmonary hypertension (CTEPH) patients before and 12 months after pulmonarythromboendarterectomy (PEA) and compare these �ndings to normal control subjects.
Methods
20 CTEPH patients and 20 controls were enrolled in the study. The patients were examined withechocardiography, right heart catherization and cardiac magnetic resonance imaging prior to PEA and 12months after.
Results
Right atrium (RA) volume was signi�cantly reduced from baseline to 12 months after PEA (30 ±9 versus23 ±5ml/m2, p<0.005). TA base area in systole remained unchanged (p=0.11) and was comparable tocontrols. The lea�et area, tenting volume and tenting height in systole were signi�cantly increased atbaseline but decreased signi�cantly with comparable values to controls after 12 months (p<0.005). Therewas correlation between the changes of right ventricular-pulmonary artery coupling and changes of TVtenting height (r = -0.54, p=0.02), TV tenting volume (r = -0.73, p<0.001) and TV lea�et area (-0.57, p =0.01) from baseline to 12 months after PEA.
Tricuspid regurgitation jet area/RA area was signi�cantly (p<0.01) reduced from baseline (30 ±13%) to 12months after PEA (9 ±10%).
Conclusions
In CTEPH patients selected for PEA, TV tenting height, volume and valve area are signi�cantly increasedwhereas annulus size and shape are less affected. The alterations in TV morphology are fully reversedafter PEA and correlates to improvements of right ventricular-pulmonary arterial coupling.
BackgroundFunctional tricuspid regurgitation (TR) is one of the most frequent manifestations of heart valve disease.It develops as a consequence of geometrical distortion in the anatomical structures situated in relation tothe tricuspid valve (TV) causing lea�et tethering and tricuspid annular (TA) dilatation [1]. Functional TR isoften secondary to left sided valve disease or chronic atrial �brillation [2, 3]. Pulmonal arterialhypertension (PH) is another important cause of functional TR that might lead to excessive right ventricle(RV) remodeling and dysfunction. The subsequent annular and atrial dilatation with development of rightsided heart failure carries a poor prognosis [4, 5]. Reduction of PH is associated with TR severityregression in contrast to progression of PH that is associated with an increase of TR severity which is

Page 4/22
associated with poor survival [6]. In patients with worsening PH progressive TR development is shown torelate to RV enlargement and increased RV sphericity leading to TA dilatation and increased TV tethering[6]. Patients with chronic thromboembolic pulmonary hypertension (CTEPH) suffer from varying degreesof functional TR in combination with right sided heart failure. Following successful pulmonarythromboendarterectomy (PEA) an immediate dramatic reduction in pulmonary artery (PA) pressures isoften seen [7, 8]. Early post-operative examination by two-dimensional (2D) echocardiography and rightheart catherization have demonstrated that reduction in PA systolic pressures after PEA is associatedwith a signi�cant 70% reduction in the number of patients with severe TR. This reduction occurs despiteof persistent tricuspid annular dilation [8]. However, the long-term effects on TR severity and detailedchanges in TV morphology in relation to changes of pulmonary pressures, RV-PA coupling, and RV/TAremodeling have not been studied in detail. The assessment of RV and TV function including evaluationof TR severity is routinely performed by 2D echocardiographic examination which has some limitationsdue to the inherent geometrical anatomic characteristics of the right side of the heart [9]. Transthoracicthree-dimensional (3D) echocardiography offers accurate data on RV volumes, function and valvemorphology. However, precise 3D echocardiographic imaging of the TV can be technically challengingand is di�cult to obtain in all patients. Cardiac Magnetic Resonance Imaging (CMR) is considered as thegold standard for accurate assessment of RV and RA dimension, volumes and function. In addition, theanalysis of TV morphology and function by assessment of lea�et tethering, coaptation and TA area orcircumference can be obtained by CMR.
In the present study, we aimed to investigate the changes of TA and TV morphology assessed by CMRwith relation to changes in pulmonary arterial pressures by right heart catherization (RHC) in CTEPHpatients before and 12 months after PEA and compare these �ndings to normal control subjects.
Methods
PatientsBetween December 2014 and January 2017, we enrolled 20 CTEPH patients and 20 controls in the studyat Aarhus University Hospital, Denmark. In total, 47 consecutive patients were evaluated for CTEPHduring the study period. After clinical and diagnostic evaluation 20 patients were identi�ed to ful�ll thecriteria for participation in in the study [10, 11]. The reasons for exclusion were as follows: �ve patientsdeclined to participate, �ve patients did not meet the diagnostic criteria of CTEPH (three idiopathicpulmonary arterial hypertension, one idiopathic pulmonary �brosis and one with constrictive pericarditis);�ve patients had only borderline PH and received medical treatment, four patients were deemedinoperable or excluded due to co-existing comorbidities and eight were excluded for various otherreasons.
The CTEPH diagnosis was de�ned in accordance with the World Health Organization classi�cation as PHwith a mean PA pressure (mPAP) ≥ 25 mmHg, a pulmonary capillary wedge pressure ≤ 15 mmHg, andspeci�c angiographic signs at least 3 months after effective anticoagulation [12]. The CTEPH patients

Page 5/22
were examined with RHC, transthoracic echocardiography (TTE) and CMR on the same day, prior to PEAand 12 months after PEA. The controls were enrolled from all parts of Denmark through an onlinerecruitment website (forsoegsperson.dk), to ensure that the controls represented the general population.The control group participated on a volunteer basis and prior to inclusion they underwent screening toexclude cardiovascular disease with medical history, ECG, TTE and blood pressure measurement. Theywere required to be asymptomatic and received no medication. All examinations including CMR wasperformed on the same day.
The PEA procedure was performed on cardiopulmonary bypass in deep hypothermia and periods ofcirculatory arrest. None of the patients underwent concomitant coronary artery bypass grafting or valveinterventions.
Cardiac magnetic resonanceCMR was performed using a Philips Achieva dStream 1.5 T whole body MR scanner (Philips MedicalSystems, Best, Netherlands). Cine scanning (time-resolved imaging) was used to assess right atrium (RA)and ventricle and left atrium and ventricle volumes and geometry. An integrated 4-electrodeelectrocardiogram (ECG) was used to synchronize data acquisition. A survey scan was followed by anECG-triggered temporally resolved cine scan using a balanced steady-state free precession sequenceduring breath-hold. The following imaging parameters were used: repetition time 2.9ms, echo time1.46ms, �ip angle 90°, 160×136 acquisition matrix, 30 phases within one cardiac cycle, slice thickness8mm and �eld of view 319 × 319 mm.
A stack of 3 long-axis slices was acquired for 4-chamber view, and for short-axis view 10–12 slices wereacquired covering the entire right and left ventricle. For tricuspid valve analysis a special focused stackspeci�cally designed for this study consisting of 6–8 long-axis slices and 10–12 slices in short-axis wereacquired covering the entire tricuspid valve and right ventricle. Pulmonary �ow measurements wereobtained using a free-breathing, ECG-triggered phase contrast sequence. The image parameters for thephase contrast sequence were: slice thickness 7mm, 301×301mm �eld of view, 128×96 acquisitionmatrix, 35 cardiac frames, velocity encoding 150cm/s and scan duration 1:43min. Image analysis of theheart chambers and pulmonary �ow were performed using Segment v.2.2 R6274 (Medviso AB, Lund,Sweden). Tricuspid valve analyses were performed in an inhouse software originally developed fordetailed mitral valve analyses as described previously [13] (Siswin, Aarhus, Denmark).
Anatomical details of the TV and TA were measured by manually tracing multiple slices through thestack. This allowed for the construction of a 3-dimensional model of the valve and the annulus. The basearea was de�ned by projecting annular points to the same �tted plane. Annular height was de�ned as themaximal distance away from this plane between annular points. A schematic overview of the measuredparameters is illustrated in Fig. 1.
RA area and volume were assessed from 4-chamber view by manual detection of endocardial border. RAlength and width were assessed from 4-chamber view by measuring the inner atrial border distance in

Page 6/22
longitudinal and transverse direction, respectively. The sphericity index of the RV is estimated in the 4-chamber view as the ratio of the short diameter (RVDd1) and RV length in end-diastole. LV volumes werecalculated from the short-axis cine images. From the stack of parallel short-axis images, end-diastolicvolume (EDV), end-systolic volume (ESV), and masses were assessed (LV masses in end-diastole and RVmasses in end-systole), and stroke volume (SV) and ejection fraction were calculated. RV and LVmyocardial masses were assessed from the stack of parallel short-axis images by manual detection ofendocardial and epicardial borders on each slice. Cardiac output (CO) was measured as pulmonary �ow.CO was indexed to body surface area as cardiac index (CI).
Transthoracic echocardiographyTransthoracic echocardiography was performed using a Vivid E95 ultrasound system (GE Healthcare,Horten, Norway) equipped with an M5S transducer.
Color Doppler imaging was used to assess severity of the TR, and the transvalvular gradient wasmeasured using continuous-wave Doppler. Quanti�cation of TR severity was done in accordance withguidelines using the proximal isovelocity surface area method and estimation of TR jet area/RA area [9].
The echocardiographic data were blinded to invasive measurements and clinical status and examined bya single investigator. Data were analyzed o�ine using dedicated software (EchoPAC version 213, GEHealthcare, Horten, Norway).
Right heart catheterizationStandard RHC was performed using a standard 7.5F triple-lumen Swan-Ganz catheter (EdwardsLifesciences, Irvine, CA, USA). The following parameters were measured: mean RA pressure (mRAP),systolic, diastolic and mPAP, mean pulmonary capillary wedge pressure (PCWP), CO, CI and systemicblood pressure. PCWP was measured at end expiration. CO was measured according to the Fick principle.RV contractility was also quanti�ed by maximum/end-systolic elastance (Ees) and RV afterload witharterial elastance (Ea). Ees was calculated as (RV maximum pressure − mPAP) divided by SV [14, 15]. Eawas estimated by the ratio of mPAP to SV [15]. Since healthy controls were not examined with RHC, RV-pulmonary arterial (PA) coupling was assessed using only the volume method (Ees/Ea = RV-SV/RV-endsystolic volume) [15, 16]. For comparison between the CTEPH patient group and healthy control group weused the RV volume method.
Statistical analysisData are presented as mean ± standard deviation, unless otherwise speci�ed. Histograms and Q-Q-plotswere used to check for normality. Between-group differences were assessed by t-test for normallydistributed data and Mann–Whitney U-test for non-normally distributed data. Baseline versus 12 monthsdifferences were assessed by the paired sample t-test and Wilcoxon signed-rank test for non-normallydistributed data. Pearson's correlation coe�cient was calculated for normally distributed data andSpearman correlation coe�cient for non-normally distributed data. Categorical variables were comparedusing the chi-square test. To test for inter-observer and intra-observer variability, Bland-Altman plots and

Page 7/22
interclass correlation coe�cient were used. Analyses were performed using Stata (STATA/IC 14.2,StataCorp LP, College Station, TX, USA).
ResultsBaseline characteristics of 20 CTEPH patients and 20 control subjects are shown in Table 1. No patientshad ischemic heart disease, one patient had diabetes mellitus, one patient suffered from essentialthrombocytosis and one had a Leiden mutation.

Page 8/22
Table 1Patient characteristics
Baseline (n = 20) Controls (n = 20) P-value
Age (years) 61 ± 14 54 ± 9 0.07
Female, n (%) 13 (65) 10 (50) 0.34
BMI (kg/m2) 28 ± 6 24 ± 4 < 0.05
NYHA I/II/III/IV, n (%) 0/3/16/1(0/15/80/5)
Arterial hypertension, n (%) 9 (45)
Atrial �brillation, n (%) 3 (15)
COPD, n (%) 7 (35)
Diabetes mellitus, n (%) 1 (5)
Ischemic heart disease, n (%) 0
Stroke, n (%) 1 (5)
Biochemistry
NT-ProBNP (ng/l)
890 [430; 2692]
Hemoglobin (mmol/l) 8.9 ± 1.4
Creatinine (µmol/l) 85 ± 19
eGFR (ml/min) 68 ± 14
Medicine
Warfarin, n (%) 20 (100)
Aspirin, n (%) 2 (10)
ACE/ATII inhibitor, n (%) 9 (45)
Loop-diuretic, n (%) 5 (25)
Thiazide, n (%) 4 (20)
Spironolactone, n (%) 2 (10)
Sildena�l, n (%) 1 (5)
Riociguat, n (%) 1 (5)
Data are presented as an absolute number and (percent) or mean ± standard deviation or median and[interquartile range]. BMI: Body Mass Index, COPD: Chronic obstructive pulmonary disease, NYHA:New York Heart Association

Page 9/22
At baseline, CTEPH patients were highly symptomatic with the majority in New York Heart Association(NYHA) class III, Nt-pro-BNP was mildly elevated and renal function preserved. NYHA class improved from2.9 ± 0.4 to 1.3 ± 0.6 at 12 months after PEA (p < 0.0001). A signi�cant reduction in Nt-ProBNP was alsoobserved: preoperatively 890 [430; 2692] ng/l to 239 [141; 375] ng/l at 12 months (p < 0.005). Mild TRwas noted in 60 % and moderate-severe TR was noted in 40 % of the patients at baseline with an averageeffective regurgitant ori�ce (ERO) of 0.30 ±0.30 cm2 and a TR jet area/RA area of 30 ±13 % for allpatients. After 12 months only two patients had moderate-severe TR with an ERO of 0.38 cm2 and 0.47cm2 whereas 18 patients only had trace or mild TR. The TR jet area/RA area was reduced to 9 ±10%, (vsbaseline p < 0.01) whereas the ERO, due to very mild regurgitation, was not satisfactory obtainable in 15patients.
Reverse remodeling of right atrium, ventricle and tricuspidvalve during follow-up by CMRTable 2 demonstrates the variables of RA, RV and TV at baseline, at 12 months after PEA and in 20control subjects. At baseline, RA volume was signi�cantly increased but normalized after 12 months ascompared to controls. Considerable RV remodeling was demonstrated as RV mass index, RV volumes,dimensions and sphericity index decreased signi�cantly and was comparable with control subjects after12 months. RV ejection fraction was impaired signi�cantly at baseline but despite improvement remainedmildly depressed as compared to controls. Cardiac output and index by CMR also improved signi�cantlybeing comparable to controls 12 months after PEA. The RV-PA coupling also improved signi�cantly butremained impaired as compared to controls.

Page 10/22
Table 2Cardiac magnetic resonance imaging
Baseline
(n = 19)
12 months
(n = 19)
P-value Controls
(n = 20)
Right atrium
Volume (mL/m2) 30 ± 9* 23 ± 5 < 0.005 23 ± 6
Length (mm) 57 ± 8 56 ± 10 0.54 53 ± 7
Width (mm) 57 ± 12* 46 ± 8 < 0.005 48 ± 9
Right ventricle
RVMi (g/m2) 22 ± 7* 13 ± 7 < 0.0001 12 ± 3
End-diastolic volume (mL) 233 ± 74* 164 ± 50 < 0.0001 172 ± 41
End-systolic volume (mL) 168 ± 75* 94 ± 40 < 0.0005 80 ± 23
RVDd1 (mm) 54 ± 8* 42 ± 8 < 0.0001 43 ± 5
RVDd2 (mm) 48 ± 8* 38 ± 6 < 0.0001 37 ± 4
RV length (mm) 86 ± 10 78 ± 10 < 0.0001 82 ± 8
RV sphericity index 2.5 ± 0.2* 2.8 ± 0.5 < 0.01 2.8 ± 0.4
Stroke volume (mL) 65 ± 22* 71 ± 21* 0.15 92 ± 19
TV regurgitant volume (mL) 11 ± 17 4 ± 8 0.20 4 ± 7
Ejection fraction (%) 30 ± 13* 44 ± 10* < 0.001 54 ± 20
Tricuspid valve
Base area sys (cm2) 12.6 ± 3.5 11.0 ± 3.2 0.11 12.4 ± 2.6
Base area dia (cm2) 14.5 ± 4.2 11.7 ± 3.9* 0.06 13.5 ± 2.8
Circumference sys (cm) 15.0 ± 2.6 13.9 ±2.8 0.18 15.0 ± 2.1
Circumference dia (cm) 16.7 ± 1.9 15.9 ± 3.0 0.47 16.7 ± 1.9
Data are presented as mean ± standard deviation.
AP: anterior-posterior, dia: diastolic SL: septal-lateral, sys: systolic Ea: Arterial elastance, Ees: End-systolic elastance,, RV: Right ventricular, PA: Pulmonary artery, RVD1: Basal RV linear dimension atend-diastole, RVD2: Mid-cavity RV linear dimension at end-diastole, RVMi: Right ventricular massindex, SV: Stroke volume, ESV: End-systolic volume.
*p < 0.05 vs. controls

Page 11/22
Baseline
(n = 19)
12 months
(n = 19)
P-value Controls
(n = 20)
Annular height sys (cm) 1.3 ± 0.5* 1.1 ± 0.3 < 0.01 1.0 ± 0.3
Annular height dia (cm) 1.3 ± 0.4 1.7 ± 0.7 0.16 1.5 ± 0.4
SL distance sys (cm) 4.0 ± 0.6 3.8 ± 0.6 0.08 3.7 ± 0.5
SL distance dia (cm) 4.4 ± 0.6 4.2 ± 0.7 0.24 4.1 ± 0.5
AP distance sys (cm) 3.9 ± 0.5 3.8 ± 0.7 0.42 4.1 ± 0.5
AP distance dia (cm) 4.1 ± 0.6 3.7 ± 0.8* 0.08 4.2 ± 0.6
Lea�et area sys (cm2) 20.1 ± 5.8 16.2 ± 6.4 < 0.005 16.9 ± 3.7
Tenting volume sys (cm3) 4.4 ± 2.6* 1.6 ± 0.9 < 0.005 1.5 ± 0.8
Tenting height sys (mm3) 11.4 ± 3.9* 7.0 ± 2.2 < 0.0005 7.0 ± 1.9
Coaptation height (mm) 4.9 ± 1.1* 5.8 ± 1.7* 0.17 7.2 ± 1.5
Pulmonary artery
Cardiac output (L/min) 3.9 ± 0.9* 5.1 ± 1.4 < 0.005 4.9 ± 0.7
Cardiac index (L/min/m2) 2.3 ± 0.4* 2.8 ± 0.6 < 0.005 2.6 ± 0.4
Non-invasive derived RV-PA coupling
SV (mL) / ESV (mL) 0.49 ± 0.30* 0.84 ± 0.31* p < 0.0001 1.19 ± 0.20
Data are presented as mean ± standard deviation.
AP: anterior-posterior, dia: diastolic SL: septal-lateral, sys: systolic Ea: Arterial elastance, Ees: End-systolic elastance,, RV: Right ventricular, PA: Pulmonary artery, RVD1: Basal RV linear dimension atend-diastole, RVD2: Mid-cavity RV linear dimension at end-diastole, RVMi: Right ventricular massindex, SV: Stroke volume, ESV: End-systolic volume.
*p < 0.05 vs. controls
The TV size by base area and circumference did not change signi�cantly even though a tendencytowards lower base area was noted. The form of the TA expressed by the annulus septal-lateral (SL) andanterior-posterior (AP) dimensions in systole and diastole did not change signi�cantly during follow-up.However, the AP distance in diastole decreased to a lower distance as compared to controls after 12months. The SL/AP ratio in systole and diastole remained unchanged during follow-up (baseline vs 12months: diastole: 1.07 ±0.09 vs 1.20 ±0.36, p = 0.26 and systole: 1.06 ±0.19 vs 0.96 ±0.15, p = 0.094). TAheight in systole was increased at baseline but decreased signi�cantly during follow-up and wascomparable to controls. The difference between height of TA in systole and diastole changed
Page 12/22
signi�cantly. At baseline the difference was 0.2 ±5.1 mm compared to -5.8 ±7.0 mm at 12 months, p = 0.028. The systole-diastole difference was comparable to controls (-4.3 ±3.8 mm) at 12 months.
The lea�et area, volume and tenting height in systole were signi�cantly increased at baseline butdecreased signi�cantly with comparable values to controls after 12 months (Fig. 2). Coaptation heightincreased insigni�cantly and remained lower than controls at 12 months (Fig. 2).
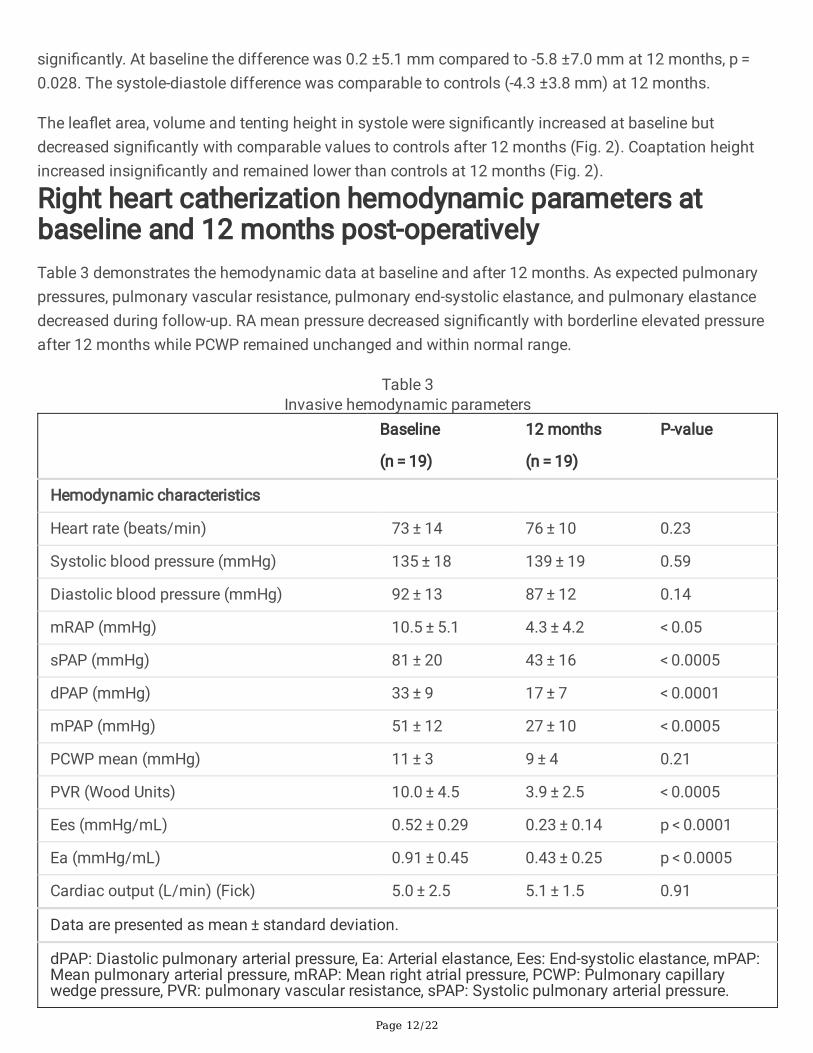
Right heart catherization hemodynamic parameters atbaseline and 12 months post-operativelyTable 3 demonstrates the hemodynamic data at baseline and after 12 months. As expected pulmonarypressures, pulmonary vascular resistance, pulmonary end-systolic elastance, and pulmonary elastancedecreased during follow-up. RA mean pressure decreased signi�cantly with borderline elevated pressureafter 12 months while PCWP remained unchanged and within normal range.
Table 3Invasive hemodynamic parameters
Baseline
(n = 19)
12 months
(n = 19)
P-value
Hemodynamic characteristics
Heart rate (beats/min) 73 ± 14 76 ± 10 0.23
Systolic blood pressure (mmHg) 135 ± 18 139 ± 19 0.59
Diastolic blood pressure (mmHg) 92 ± 13 87 ± 12 0.14
mRAP (mmHg) 10.5 ± 5.1 4.3 ± 4.2 < 0.05
sPAP (mmHg) 81 ± 20 43 ± 16 < 0.0005
dPAP (mmHg) 33 ± 9 17 ± 7 < 0.0001
mPAP (mmHg) 51 ± 12 27 ± 10 < 0.0005
PCWP mean (mmHg) 11 ± 3 9 ± 4 0.21
PVR (Wood Units) 10.0 ± 4.5 3.9 ± 2.5 < 0.0005
Ees (mmHg/mL) 0.52 ± 0.29 0.23 ± 0.14 p < 0.0001
Ea (mmHg/mL) 0.91 ± 0.45 0.43 ± 0.25 p < 0.0005
Cardiac output (L/min) (Fick) 5.0 ± 2.5 5.1 ± 1.5 0.91
Data are presented as mean ± standard deviation.
dPAP: Diastolic pulmonary arterial pressure, Ea: Arterial elastance, Ees: End-systolic elastance, mPAP:Mean pulmonary arterial pressure, mRAP: Mean right atrial pressure, PCWP: Pulmonary capillarywedge pressure, PVR: pulmonary vascular resistance, sPAP: Systolic pulmonary arterial pressure.

Page 13/22
Correlations between changes of hemodynamic parametersand tricuspid valve morphology parametersThe changes of selected hemodynamic parameters and changes to TV parameters from baseline to 12months after PEA are demonstrated in Table 4. The changes of TA expressed by base area in systole andSL correlated moderately but signi�cantly to changes in systolic PAP and pulmonary end systolicelastance. The alterations of RV-PA coupling correlated also signi�cantly to changes of base area insystole and SL. The changes of mean RA pressure correlated signi�cantly to changes in TAcircumference. A stronger signi�cant correlation was noted between changes in RV end systolic volumeand RA volume on one side and base area in systole on the other.

Page 14/22
Table 4Correlation analyzes
Hemodynamics CMR-TV r P-value
Δ SPAP Δ Base Area Systole -0.53 < 0.04
Δ SPAP Δ SL distance 0.55 < 0.03
Δ SPAP Δ Tenting height 0.10 0.70
Δ SPAP Δ Coaptation height -0.04 0.88
Δ RA Δ Base area systole -0.60 < 0.02
Δ RA Δ Circumference -0.60 < 0.02
Δ RA Δ Tenting height -0.10 0.70
Δ RA Δ Coaptation height -0.04 0.88
Δ CO Δ Coaptation height -0.58 < 0.02
Δ Ees Δ Base area systole -0.72 < 0.003
Δ Ees Δ SL distance -0.55 < 0.03
Δ Ees Δ Base area systole 0.26 0.29
Δ Ees ΔSL distance 0.24 0.33
ΔRV-PA coupling Δ Base area systole -0.50 0.04
ΔRV-PA coupling Δ SL distance -0.53 0.02
ΔRV-PA coupling Δ Lea�et area systole -0.57 0.01
ΔRV-PA coupling Δ Tenting volume systole -0.73 < 0.001
ΔRV-PA coupling Δ Tenting height systole -0.54 0.02
ΔRV-PA coupling Δ Coaptation height -0.45 0.07
ΔRV-ESV Base area systole 0.67 0.002
ΔRA-Vol Base area systole 0.77 < 0.001
CMR-TV are delta values from morphological changes to the TV between baseline and 12 monthspost-operatively. r is the correlation coe�cient. SPAP: Systolic pulmonary arterial pressure, CO:Cardiac output, SL: septal-lateral, Ees: End-systolic elastance, RA: Right atrium, RV: Right ventricular,PA: Pulmonary artery, ESV: End-systolic volume.
Changes of TV morphology denoted by tenting volume in systole, tenting height in systole and especiallytenting volume in systole correlated signi�cantly to changes of RV-PA coupling.
Discussion

Page 15/22
We present, to our knowledge, the �rst study of TA and TV morphology assessed by CMR combined withadditional invasive hemodynamic assessment in patients with severe PH due to chronic pulmonarythromboembolism during 12 months follow-up after PEA. We also provide CMR data on TA and TVmorphology in normal subjects.
The main �ndings were as follows: Firstly, signi�cant changes of TV morphology, noted as lea�et area,tenting volume and tenting height in systole, were signi�cantly reduced but TV parameters werecomparable to control subjects after 12 months following PEA; secondly the TA size by circumferenceand area were without signi�cant changes and were comparable to control subjects. However, the shapeof the TA did change signi�cantly as the annulus circularity index (SL/AP-ratio) decreased; thirdly, the TAheight in systole decreased signi�cantly and reached comparable values as compared to controlsubjects; fourthly, the changes to TV morphology expressed by lea�et area, tenting volume and tentingheight in systole was signi�cantly and negatively correlated to the changes in RV-PA coupling; �nally, asexpected signi�cant RV and RA remodeling and improvement of RV systolic function were noted afterPEA but the changes to RV and RA dimensions or volumes did not correlate to the changes of the TVmorphology observed.
Preoperatively 40 % of our patients demonstrated a moderate-severe functional TR in accordance withobservations in PH in which severe TR varies between 10–30 % of cases [2, 17]. As expected we alsonoted a signi�cant reduction of moderate-severe TR with the presence of only 10 % after 12 monthsfollowing PEA in accordance with a previous study [8]. Tenting height is reported to be increased in TRwith different etiology of PH as demonstrated by Topilsky et al. who reported a tenting height of 8.0 mmassessed by transthoracic 2D echocardiography [18]. The preoperative tenting height was signi�cantlyincreased to an average of 11.4 mm by CMR (average normal subjects 7.0 mm) which normalized with aheight of 7.0 mm after 12 months following PEA. In the present study, the tenting volume of the TV wasincreased nearly 3-fold preoperatively compared to controls (1.5 cm3) but normalized at follow-up.Increased tenting volume has been reported in patients with functional TR in two previous 3Dechocardiographic studies showing a tenting volume of 4.2 cm3 in 17 chronic PH patients withsigni�cant TR and of 3.2 cm3 among 53 patients with severe TR and PH of different etiology, respectively[19, 20]. Despite different imaging techniques the tenting volume seems consistently to increaseconsiderably in PH patients with functional TR independent of etiology. Preoperatively, we noted that thelea�et area was increased in systole to the same extent as demonstrated by A�lalo et al. in a study withpatients with severe functional TR and PH. In the present study, the lea�et area was signi�cantlydecreased and normalized during follow-up17. The coaptation height did increase but insigni�cantly andremained lower than controls at follow-up. The changes in TV morphological parameters weresigni�cantly correlated to the changes of RV-PA coupling but was not directly correlated to changes of theannulus, shape nor RV volume or even the sphericity index. The tricuspid lea�et closure depends mainlyon lea�et adaptation, tethering forces and annular morphology. Lea�et adaptation is abnormal beforePEA but the adaptation seems to reverse to near normal conditions at follow-up. A dramatic RVremodeling was shown after PEA as RV volume, and the sphericity index normalized during follow-up.
Page 16/22
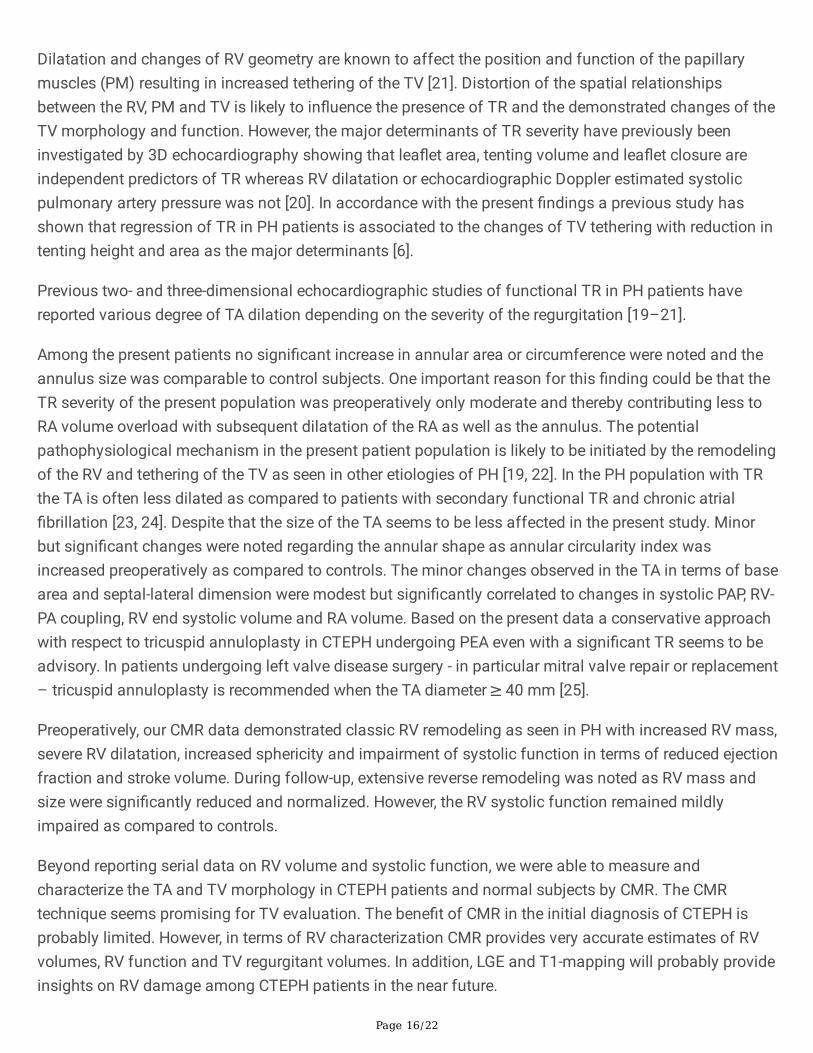
Dilatation and changes of RV geometry are known to affect the position and function of the papillarymuscles (PM) resulting in increased tethering of the TV [21]. Distortion of the spatial relationshipsbetween the RV, PM and TV is likely to in�uence the presence of TR and the demonstrated changes of theTV morphology and function. However, the major determinants of TR severity have previously beeninvestigated by 3D echocardiography showing that lea�et area, tenting volume and lea�et closure areindependent predictors of TR whereas RV dilatation or echocardiographic Doppler estimated systolicpulmonary artery pressure was not [20]. In accordance with the present �ndings a previous study hasshown that regression of TR in PH patients is associated to the changes of TV tethering with reduction intenting height and area as the major determinants [6].
Previous two- and three-dimensional echocardiographic studies of functional TR in PH patients havereported various degree of TA dilation depending on the severity of the regurgitation [19–21].
Among the present patients no signi�cant increase in annular area or circumference were noted and theannulus size was comparable to control subjects. One important reason for this �nding could be that theTR severity of the present population was preoperatively only moderate and thereby contributing less toRA volume overload with subsequent dilatation of the RA as well as the annulus. The potentialpathophysiological mechanism in the present patient population is likely to be initiated by the remodelingof the RV and tethering of the TV as seen in other etiologies of PH [19, 22]. In the PH population with TRthe TA is often less dilated as compared to patients with secondary functional TR and chronic atrial�brillation [23, 24]. Despite that the size of the TA seems to be less affected in the present study. Minorbut signi�cant changes were noted regarding the annular shape as annular circularity index wasincreased preoperatively as compared to controls. The minor changes observed in the TA in terms of basearea and septal-lateral dimension were modest but signi�cantly correlated to changes in systolic PAP, RV-PA coupling, RV end systolic volume and RA volume. Based on the present data a conservative approachwith respect to tricuspid annuloplasty in CTEPH undergoing PEA even with a signi�cant TR seems to beadvisory. In patients undergoing left valve disease surgery - in particular mitral valve repair or replacement– tricuspid annuloplasty is recommended when the TA diameter ≥ 40 mm [25].
Preoperatively, our CMR data demonstrated classic RV remodeling as seen in PH with increased RV mass,severe RV dilatation, increased sphericity and impairment of systolic function in terms of reduced ejectionfraction and stroke volume. During follow-up, extensive reverse remodeling was noted as RV mass andsize were signi�cantly reduced and normalized. However, the RV systolic function remained mildlyimpaired as compared to controls.
Beyond reporting serial data on RV volume and systolic function, we were able to measure andcharacterize the TA and TV morphology in CTEPH patients and normal subjects by CMR. The CMRtechnique seems promising for TV evaluation. The bene�t of CMR in the initial diagnosis of CTEPH isprobably limited. However, in terms of RV characterization CMR provides very accurate estimates of RVvolumes, RV function and TV regurgitant volumes. In addition, LGE and T1-mapping will probably provideinsights on RV damage among CTEPH patients in the near future.

Page 17/22
In terms of medical treatment for CTEPH there is no clear support for treatment with speci�c PH activedrugs before PEA. Furthermore, the only approved drug in CTEPH, riociguat, is only registered for use ininoperable cases or in persistent PH after PEA [26].
Some limitations have to be considered in the present study. First of all, the number of patients studied issmall but the examinations were performed prospectively and consecutively combining CMR techniqueswith invasively assessed hemodynamic parameters during a complete one year of follow-up. Despite thesmall number of patients studied as compared to other observational studies of TR and TV in PHpatients, we had the opportunity to study the valve morphology in a situation where the hemodynamicconditions were reversed and thereby being able to study the associations between RV remodeling,hemodynamic and morphological TV changes.
The number of PH patients with severe TR varies considerably in line with the present �ndings whichlimits the possibility to study to what extent the observed changes in TA and TV has on the patients withsevere TR.
ConclusionTV tenting height, volume and valve area are signi�cantly increased whereas annulus size and shape areless effected in CTEPH patients selected for PEA when assessed by CMR. The TV morphology alterationswere fully reversed and correlated to the demonstrated improvements of RV-PA coupling after PEA during12 months of follow-up. The present data calls for further studies to evaluate the surgical strategy inCTEPH patients scheduled for PEA, as it may be possible to refrain from annuloplasty in selected cases.
AbbreviationsTRtricuspid regurgitation, TV:tricuspid valve; TA:tricuspid annulus; PH:pulmonal arterial hypertension;RV:right ventricle; CTEPH:chronic thromboembolic pulmonary hypertension; PEA:pulmonarythromboendarterectomy; PA:pulmonary artery; CMR:cardiac magnetic resonance imaging; RHC:right heartcatherization; mPAP:mean PA pressure; TTE:transthoracic echocardiography; ECG:electrocardiogram;RA:right atrium; EDV:end-diastolic volume; ESV:end-systolic volume; SV:stroke volume; CO:cardiac output;CI cardiac index; NYHA:New York Heart Association; mRAP:mean RA pressure; PCWP:pulmonary capillarywedge pressure; Ees:end-systolic elastance; Ea:arterial elastance; SL:septal-lateral; AP:anterior-posterior.
DeclarationsEthics approval and consent to participate
Patients and controls were ≥18 years of age and included after having provided written informed consentaccording to the principles of the Helsinki Declaration. The study was approved by The Central DenmarkRegion Committees on Health Research Ethics (journal number 1-10-72-240-14).

Page 18/22
Consent for publication
Not applicable.
Availability of data and materials
The imaging protocols as well as the datasets used and/or analysed during the current study areavailable from the corresponding author on reasonable request.
Competing interests
The authors declare that they have no competing interests.
Funding
This study was funded by the Danish Heart Foundation, Aarhus University, Arvid Nilssons Fond, Eva &Henry Frænkels Mindefond, and Snedkermester Sophus Jacobsen & Hustru Astrid Jacobsens Fond. Thefunding bodies had no role in study design, data collection, data analysis, data interpretation, andmanuscript writing.
Authors' contributions
Study design and concept development (FW, SR, SM, TSC, VEH, SLN, SHP); Data aquisition (FW, SM, TSC,SHP); Image analyses (FW, SR, SHP), Statistical analyses (FW), Manuscript draft (CAF, SHP),Interpretation of images and data (CAF, SHP). Critical review and approval of the �nal manuscript (CAF,FW, SR, SM, TSC, VEH, SLN, SHP).
Acknowledgements
Not applicable.
References1. Singh JP, Evans JC, Levy D, Larson MG, Freed LA, Fuller DL, et al. Prevalence and clinical
determinants of mitral, tricuspid, and aortic regurgitation (the Framingham Heart Study). Am JCardiol. 1999;83(6):897–902.
2. Mutlak D, Aronson D, Lessick J, Reisner SA, Dabbah S, Agmon Y. Functional tricuspid regurgitation inpatients with pulmonary hypertension: is pulmonary artery pressure the only determinant ofregurgitation severity? Chest. 2009;135(1):115–21.
3. Spinner EM, Shannon P, Buice D, Jimenez JH, Veledar E, Del Nido PJ, et al. In vitro characterization ofthe mechanisms responsible for functional tricuspid regurgitation. Circulation. 2011;124(8):920–9.
4. Hinderliter AL, Willis PWt, Long WA, Clarke WR, Ralph D, Caldwell EJ, et al. Frequency and severity oftricuspid regurgitation determined by Doppler echocardiography in primary pulmonary hypertension.
Page 19/22
Am J Cardiol. 2003;91(8):1033–7, A9.
5. Nath J, Foster E, Heidenreich PA. Impact of tricuspid regurgitation on long-term survival. J Am CollCardiol. 2004;43(3):405–9.
�. Medvedofsky D, Aronson D, Gomberg-Maitland M, Thomeas V, Rich S, Spencer K, et al. Tricuspidregurgitation progression and regression in pulmonary arterial hypertension: implications for rightventricular and tricuspid valve apparatus geometry and patients outcome. Eur Heart J CardiovascImaging. 2017;18(1):86–94.
7. Menzel T, Kramm T, Wagner S, Mohr-Kahaly S, Mayer E, Meyer J. Improvement of tricuspidregurgitation after pulmonary thromboendarterectomy. Ann Thorac Surg. 2002;73(3):756–61.
�. Sadeghi HM, Kimura BJ, Raisinghani A, Blanchard DG, Mahmud E, Fedullo PF, et al. Does loweringpulmonary arterial pressure eliminate severe functional tricuspid regurgitation? Insights frompulmonary thromboendarterectomy. J Am Coll Cardiol. 2004;44(1):126–32.
9. Lancellotti P, Tribouilloy C, Hagendorff A, Popescu BA, Edvardsen T, Pierard LA, et al.Recommendations for the echocardiographic assessment of native valvular regurgitation: anexecutive summary from the European Association of Cardiovascular Imaging. Eur Heart JCardiovasc Imaging. 2013;14(7):611–44.
10. Waziri F, Mellemkjaer S, Clemmensen TS, Hjortdal VE, Ilkjaer LB, Nielsen SL, et al. Long-term changesof resting and exercise right ventricular systolic performance in patients with chronicthromboembolic pulmonary hypertension following pulmonary thromboendarterectomy - A two-dimensional and three-dimensional echocardiographic study. Echocardiography. 2019;36(9):1656–65.
11. Waziri F, Ringgaard S, Mellemkjaer S, Bogh N, Kim WY, Clemmensen TS, et al. Long-term changes ofright ventricular myocardial deformation and remodeling studied by cardiac magnetic resonanceimaging in patients with chronic thromboembolic pulmonary hypertension following pulmonarythromboendarterectomy. Int J Cardiol. 2020;300:282–8.
12. Galie N, Humbert M, Vachiery JL, Gibbs S, Lang I, Torbicki A, et al. 2015 ESC/ERS Guidelines for thediagnosis and treatment of pulmonary hypertension: The Joint Task Force for the Diagnosis andTreatment of Pulmonary Hypertension of the European Society of Cardiology (ESC) and theEuropean Respiratory Society (ERS): Endorsed by: Association for European Paediatric andCongenital Cardiology (AEPC), International Society for Heart and Lung Transplantation (ISHLT). EurHeart J. 2016;37(1):67–119.
13. Jensen H, Jensen MO, Ringgaard S, Smerup MH, Sorensen TS, Kim WY, et al. Geometric determinantsof chronic functional ischemic mitral regurgitation: insights from three-dimensional cardiacmagnetic resonance imaging. J Heart Valve Dis. 2008;17(1):16–22. discussion 3.
14. Trip P, Kind T, van de Veerdonk MC, Marcus JT, de Man FS, Westerhof N, et al. Accurate assessmentof load-independent right ventricular systolic function in patients with pulmonary hypertension. JHeart Lung Transplant. 2013;32(1):50–5.

Page 20/22
15. Sanz J, Garcia-Alvarez A, Fernandez-Friera L, Nair A, Mirelis JG, Sawit ST, et al. Right ventriculo-arterial coupling in pulmonary hypertension: a magnetic resonance study. Heart. 2012;98(3):238–43.
1�. Rolf A, Rixe J, Kim WK, Borgel J, Mollmann H, Nef HM, et al. Right ventricular adaptation topulmonary pressure load in patients with chronic thromboembolic pulmonary hypertension beforeand after successful pulmonary endarterectomy–a cardiovascular magnetic resonance study. JCardiovasc Magn Reson. 2014;16:96.
17. Mutlak D, Lessick J, Reisner SA, Aronson D, Dabbah S, Agmon Y. Echocardiography-based spectrumof severe tricuspid regurgitation: the frequency of apparently idiopathic tricuspid regurgitation. J AmSoc Echocardiogr. 2007;20(4):405–8.
1�. Topilsky Y, Khanna A, Le Tourneau T, Park S, Michelena H, Suri R, et al. Clinical context andmechanism of functional tricuspid regurgitation in patients with and without pulmonaryhypertension. Circ Cardiovasc Imaging. 2012;5(3):314–23.
19. Sukmawan R, Watanabe N, Ogasawara Y, Yamaura Y, Yamamoto K, Wada N, et al. Geometricchanges of tricuspid valve tenting in tricuspid regurgitation secondary to pulmonary hypertensionquanti�ed by novel system with transthoracic real-time 3-dimensional echocardiography. J Am SocEchocardiogr. 2007;20(5):470–6.
20. A�lalo J, Grapsa J, Nihoyannopoulos P, Beaudoin J, Gibbs JS, Channick RN, et al. Lea�et area as adeterminant of tricuspid regurgitation severity in patients with pulmonary hypertension. CircCardiovasc Imaging. 2015;8(5).
21. Spinner EM, Lerakis S, Higginson J, Pernetz M, Howell S, Veledar E, et al. Correlates of tricuspidregurgitation as determined by 3D echocardiography: pulmonary arterial pressure, ventricle geometry,annular dilatation, and papillary muscle displacement. Circ Cardiovasc Imaging. 2012;5(1):43–50.
22. Park YH, Song JM, Lee EY, Kim YJ, Kang DH, Song JK. Geometric and hemodynamic determinants offunctional tricuspid regurgitation: a real-time three-dimensional echocardiography study. Int JCardiol. 2008;124(2):160–5.
23. Najib MQ, Vinales KL, Vittala SS, Challa S, Lee HR, Chaliki HP. Predictors for the development ofsevere tricuspid regurgitation with anatomically normal valve in patients with atrial �brillation.Echocardiography. 2012;29(2):140–6.
24. Utsunomiya H, Itabashi Y, Mihara H, Berdejo J, Kobayashi S, Siegel RJ, et al. Functional TricuspidRegurgitation Caused by Chronic Atrial Fibrillation: A Real-Time 3-Dimensional TransesophagealEchocardiography Study. Circ Cardiovasc Imaging. 2017;10(1).
25. Baumgartner H, Falk V, Bax JJ, De Bonis M, Hamm C, Holm PJ, et al. 2017 ESC/EACTS Guidelines forthe management of valvular heart disease. Eur Heart J. 2017;38(36):2739–91.
2�. Kim NH, Delcroix M, Jais X, Madani MM, Matsubara H, Mayer E, et al. Chronic thromboembolicpulmonary hypertension. Eur Respir J. 2019;53(1).
Figures

Page 21/22
Figure 1
CMR images used for detailed analyses of the tricuspid valve. Left panel. Modi�ed 4-chamber viewillustrating the de�nition of coaptation height, lea�et area, tenting height, tenting volume, base area. Rightpanel. Modi�ed short axis view illustrating the de�nition of circumference, AP distance, SL distance.

Page 22/22
Figure 2
Key parameters from assessment of the tricuspid valve before and after intervention compared tocontrols. Upper right panel. Lea�et area in systole. Lower right panel. Tenting height in systole. Upper leftpanel. Tenting volume in systole. Lower left panel. Coaptation height.