Hemodynamic of HF in ACHD -...
171
Hemodynamic of HF in ACHD Wail Alkashkari, MD, FACC,FSCAI,FASE,FSCCT,FASNC King Faisal Cardiac Centre King AbdulAziz Medical City National Guard, Jeddah December 13, 2014
Transcript of Hemodynamic of HF in ACHD -...
Hemodynamic of HF in
ACHD
Wail Alkashkari, MD,
FACC,FSCAI,FASE,FSCCT,FASNC
King Faisal Cardiac Centre
King AbdulAziz Medical City
National Guard, Jeddah
December 13, 2014
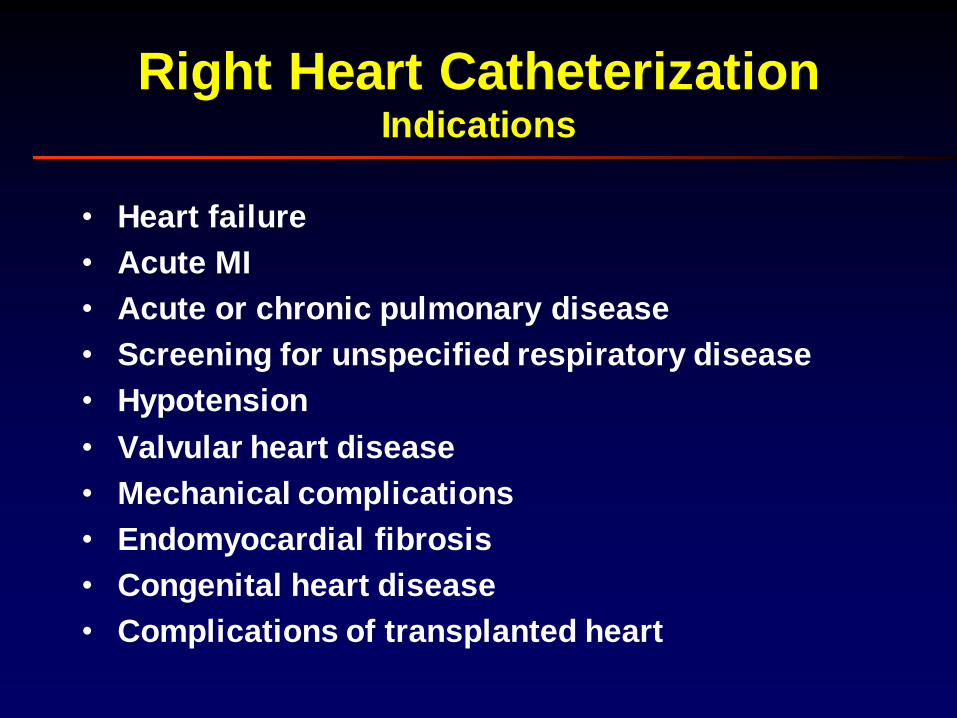
• Heart failure
• Acute MI
• Acute or chronic pulmonary disease
• Screening for unspecified respiratory disease
• Hypotension
• Valvular heart disease
• Mechanical complications
• Endomyocardial fibrosis
• Congenital heart disease
• Complications of transplanted heart
Right Heart CatheterizationIndications

Kern MJ. Right Heart Catheterization. CATHSAP II CD-ROM. Bethesda, American College of Cardiology,
2001.
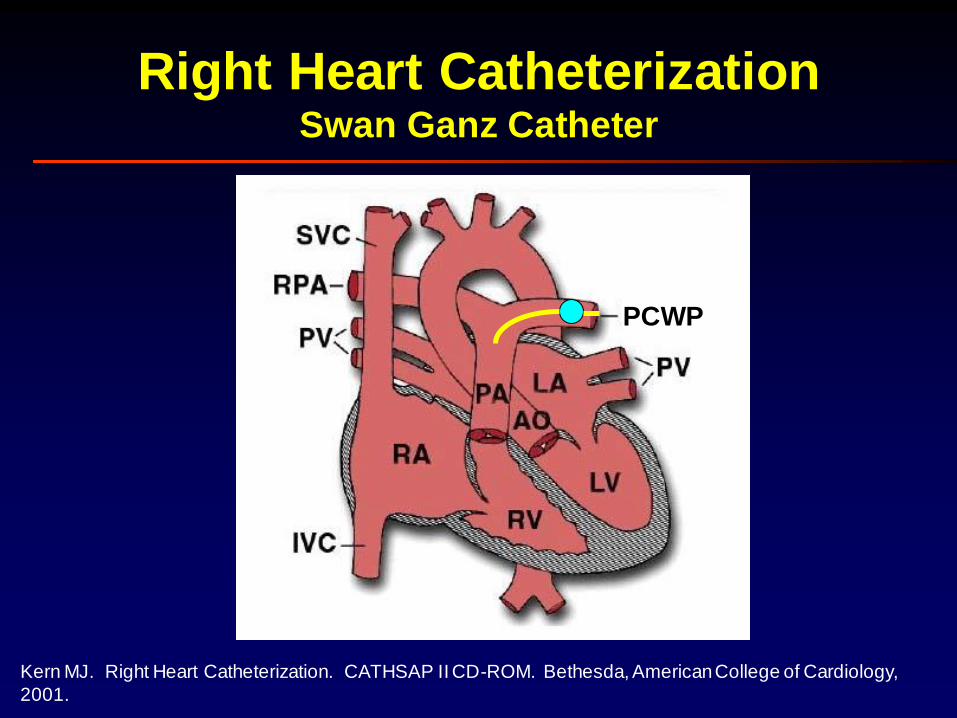
Right Heart CatheterizationSwan Ganz Catheter
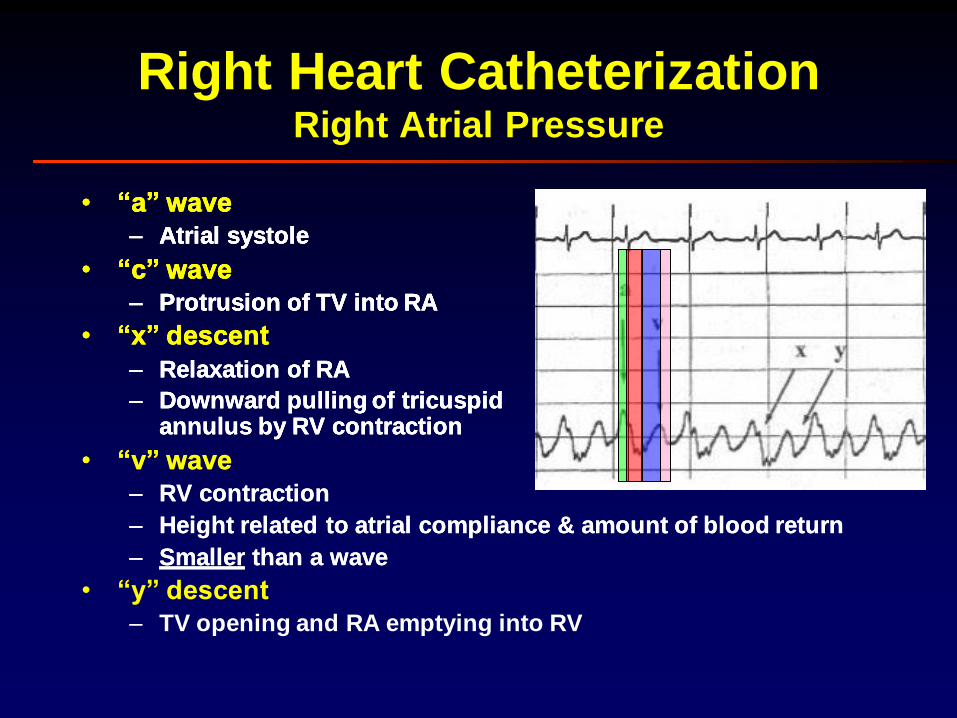
Right Heart CatheterizationRight Atrial Pressure
• “a” wave
– Atrial systole
• “c” wave
– Protrusion of TV into RA
• “a” wave
– Atrial systole
• “c” wave
– Protrusion of TV into RA
• “x” descent
– Relaxation of RA
– Downward pulling of tricuspidannulus by RV contraction
• “v” wave
– RV contraction
– Height related to atrial compliance & amount of blood return
– Smaller than a wave
• “a” wave
– Atrial systole
• “c” wave
– Protrusion of TV into RA
• “x” descent
– Relaxation of RA
– Downward pulling of tricuspidannulus by RV contraction
• “v” wave
– RV contraction
– Height related to atrial compliance & amount of blood return
– Smaller than a wave
• “y” descent
– TV opening and RA emptying into RV
• “a” wave
– Atrial systole
• “c” wave
– Protrusion of TV into RA
• “x” descent
– Relaxation of RA
– Downward pulling of tricuspidannulus by RV contraction
Kern MJ. Right Heart Catheterization. CATHSAP II CD-ROM. Bethesda, American College of Cardiology,
2001.
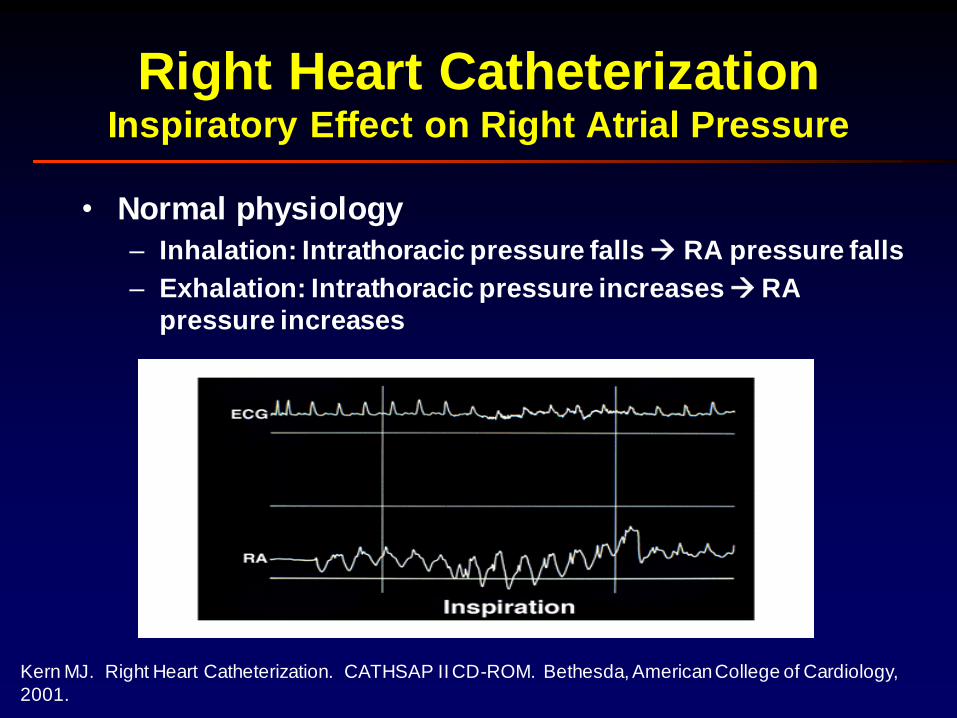
Right Heart CatheterizationInspiratory Effect on Right Atrial Pressure
• Normal physiology
– Inhalation: Intrathoracic pressure falls RA pressure falls
– Exhalation: Intrathoracic pressure increases RA
pressure increases
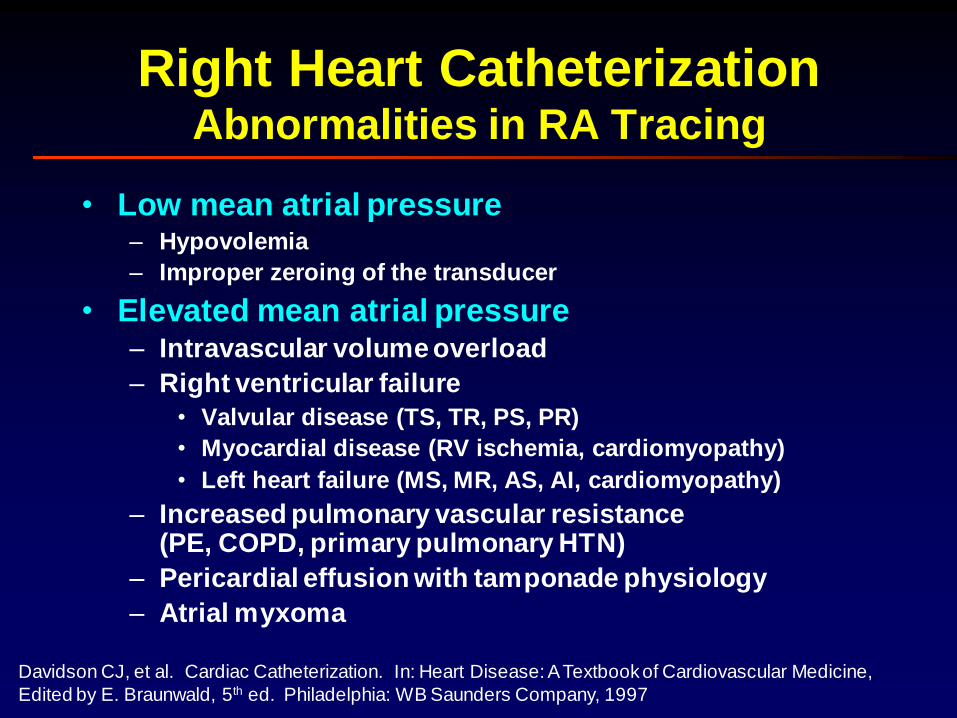
Right Heart Catheterization Abnormalities in RA Tracing
• Low mean atrial pressure– Hypovolemia
– Improper zeroing of the transducer
• Elevated mean atrial pressure– Intravascular volume overload
– Right ventricular failure
• Valvular disease (TS, TR, PS, PR)
• Myocardial disease (RV ischemia, cardiomyopathy)
• Left heart failure (MS, MR, AS, AI, cardiomyopathy)
– Increased pulmonary vascular resistance(PE, COPD, primary pulmonary HTN)
– Pericardial effusion with tamponade physiology
– Atrial myxoma
Davidson CJ, et al. Cardiac Catheterization. In: Heart Disease: A Textbook of Cardiovascular Medicine,
Edited by E. Braunwald, 5th ed. Philadelphia: WB Saunders Company, 1997
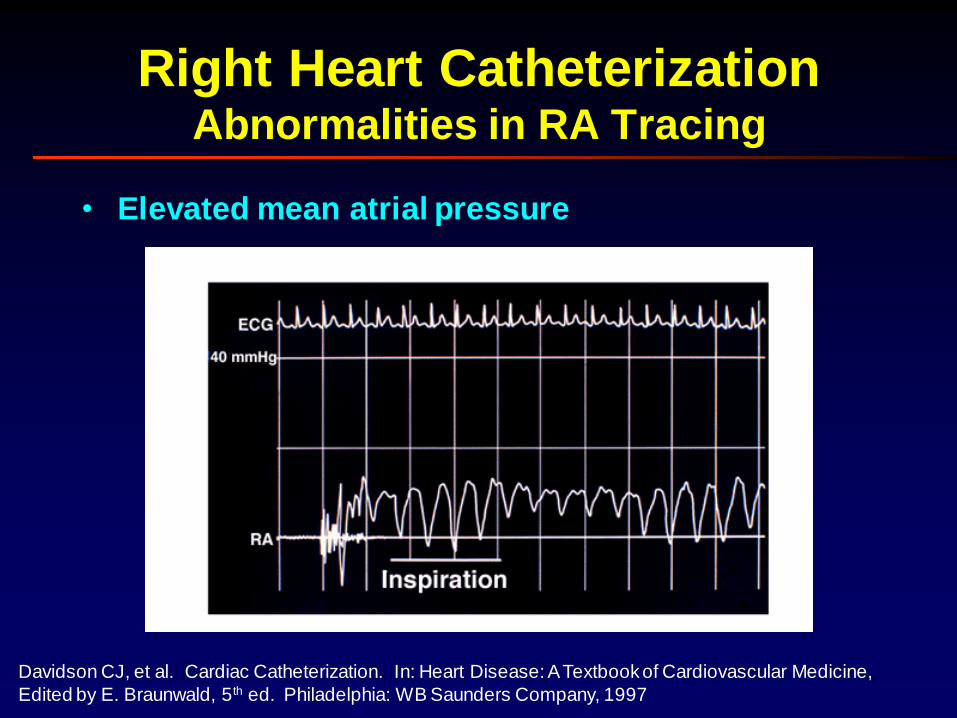
Right Heart Catheterization Abnormalities in RA Tracing
• Elevated mean atrial pressure
Davidson CJ, et al. Cardiac Catheterization. In: Heart Disease: A Textbook of Cardiovascular Medicine,
Edited by E. Braunwald, 5th ed. Philadelphia: WB Saunders Company, 1997
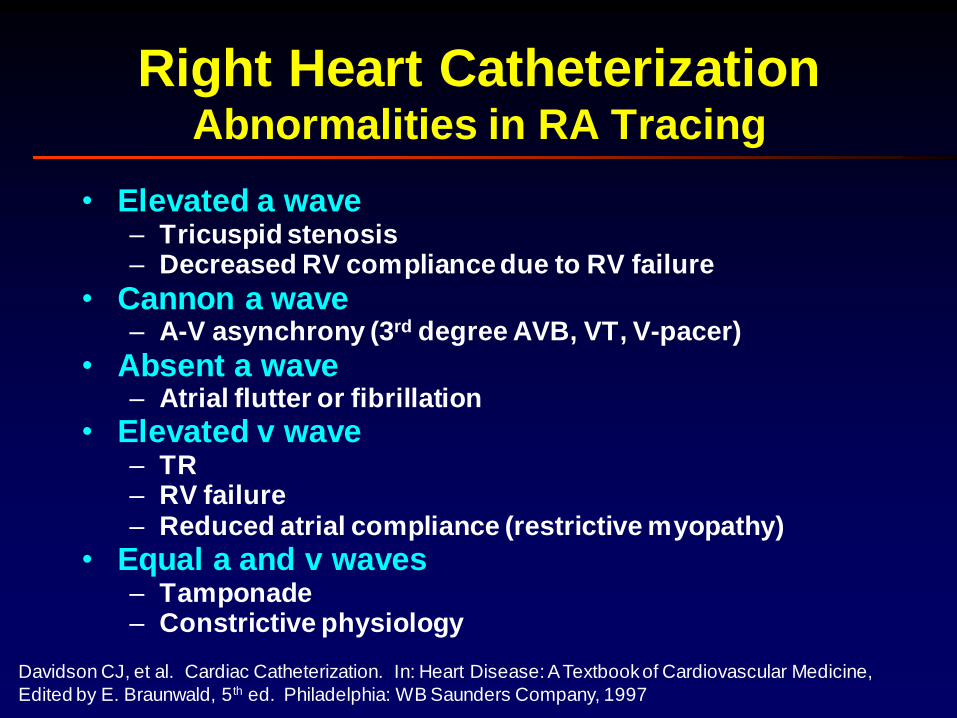
Right Heart CatheterizationAbnormalities in RA Tracing
• Elevated a wave– Tricuspid stenosis– Decreased RV compliance due to RV failure
• Cannon a wave– A-V asynchrony (3rd degree AVB, VT, V-pacer)
• Absent a wave– Atrial flutter or fibrillation
• Elevated v wave– TR– RV failure– Reduced atrial compliance (restrictive myopathy)
• Equal a and v waves– Tamponade– Constrictive physiology
Davidson CJ, et al. Cardiac Catheterization. In: Heart Disease: A Textbook of Cardiovascular Medicine,
Edited by E. Braunwald, 5th ed. Philadelphia: WB Saunders Company, 1997
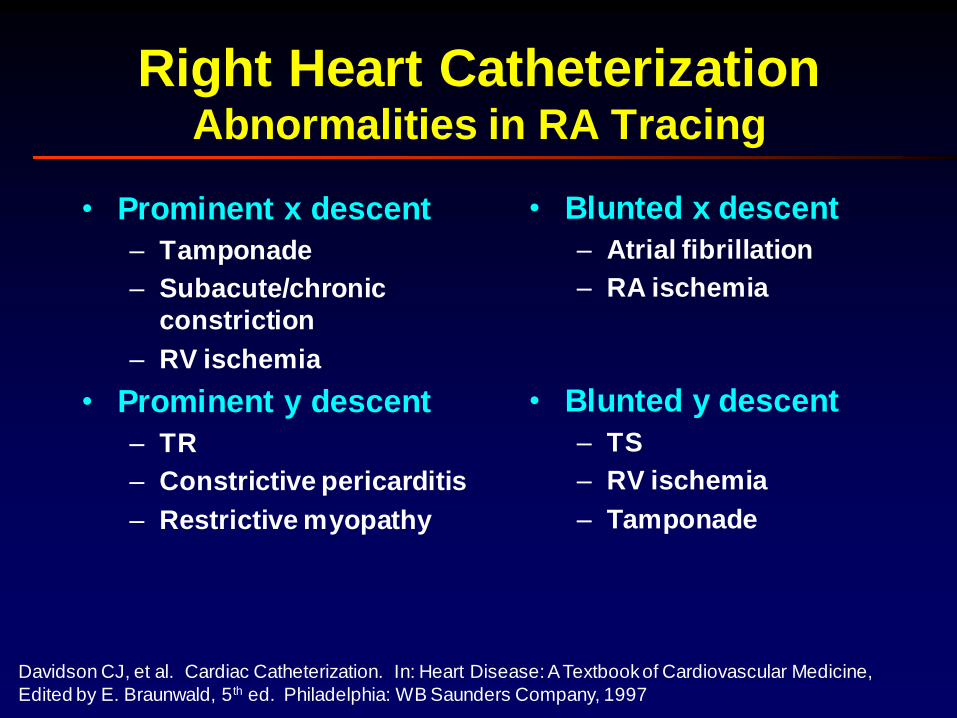
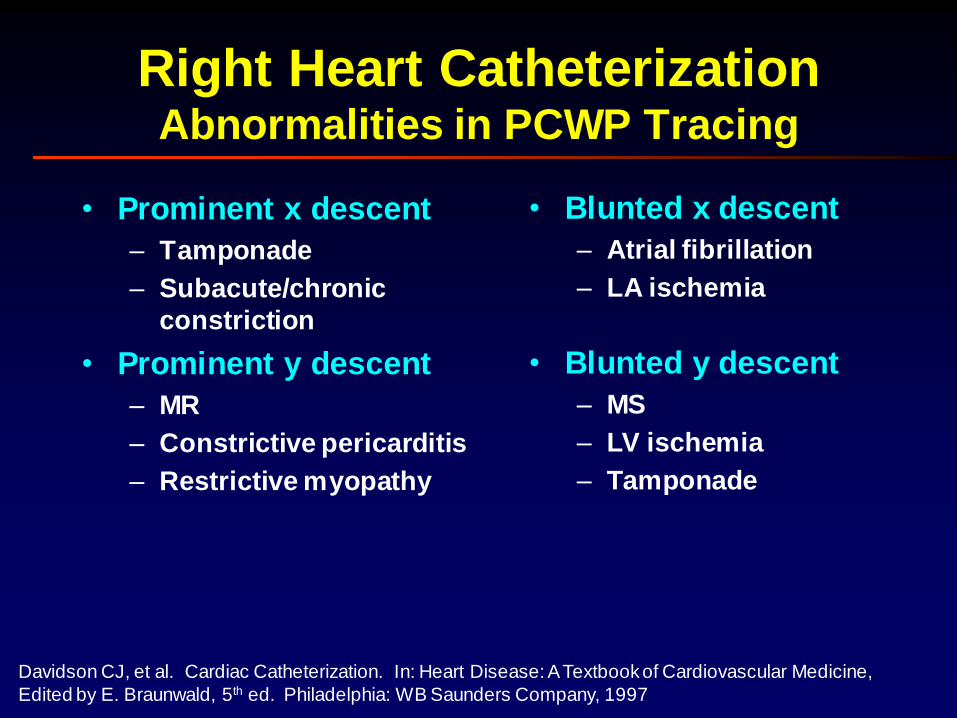
Right Heart Catheterization Abnormalities in RA Tracing
• Prominent x descent
– Tamponade
– Subacute/chronic
constriction
– RV ischemia
• Prominent y descent
– TR
– Constrictive pericarditis
– Restrictive myopathy
• Blunted x descent
– Atrial fibrillation
– RA ischemia
• Blunted y descent
– TS
– RV ischemia
– Tamponade
Davidson CJ, et al. Cardiac Catheterization. In: Heart Disease: A Textbook of Cardiovascular Medicine,
Edited by E. Braunwald, 5th ed. Philadelphia: WB Saunders Company, 1997

Kern MJ. Right Heart Catheterization. CATHSAP II CD-ROM. Bethesda, American College of Cardiology,
2001.
Right Heart CatheterizationSwan Ganz Catheter
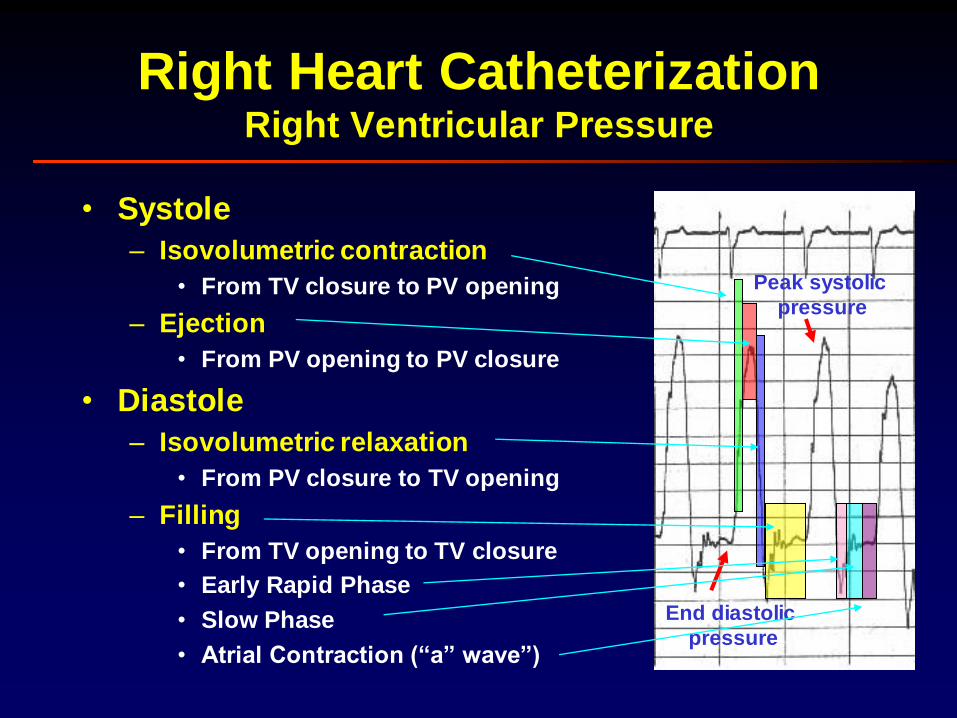
Right Heart CatheterizationRight Ventricular Pressure
• Systole
– Isovolumetric contraction
• From TV closure to PV opening
– Ejection
• From PV opening to PV closure
• Diastole
– Isovolumetric relaxation
• From PV closure to TV opening
– Filling
• From TV opening to TV closure
• Early Rapid Phase
• Slow Phase
• Atrial Contraction (“a” wave”)
End diastolic
pressure
Peak systolic
pressure
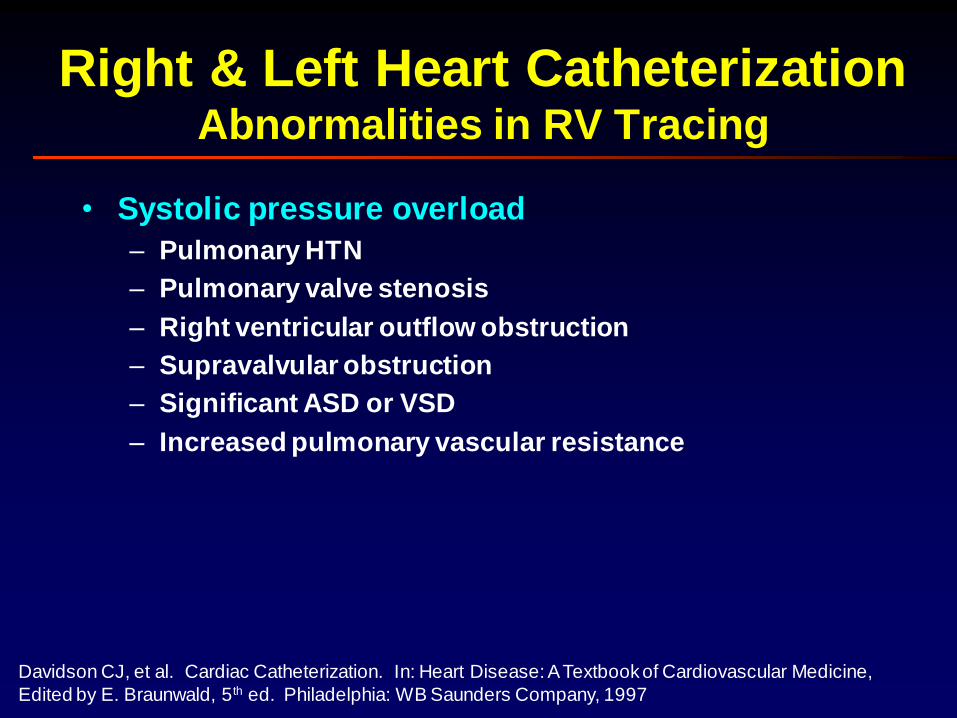
Right & Left Heart Catheterization Abnormalities in RV Tracing
• Systolic pressure overload
– Pulmonary HTN
– Pulmonary valve stenosis
– Right ventricular outflow obstruction
– Supravalvular obstruction
– Significant ASD or VSD
– Increased pulmonary vascular resistance
Davidson CJ, et al. Cardiac Catheterization. In: Heart Disease: A Textbook of Cardiovascular Medicine,
Edited by E. Braunwald, 5th ed. Philadelphia: WB Saunders Company, 1997
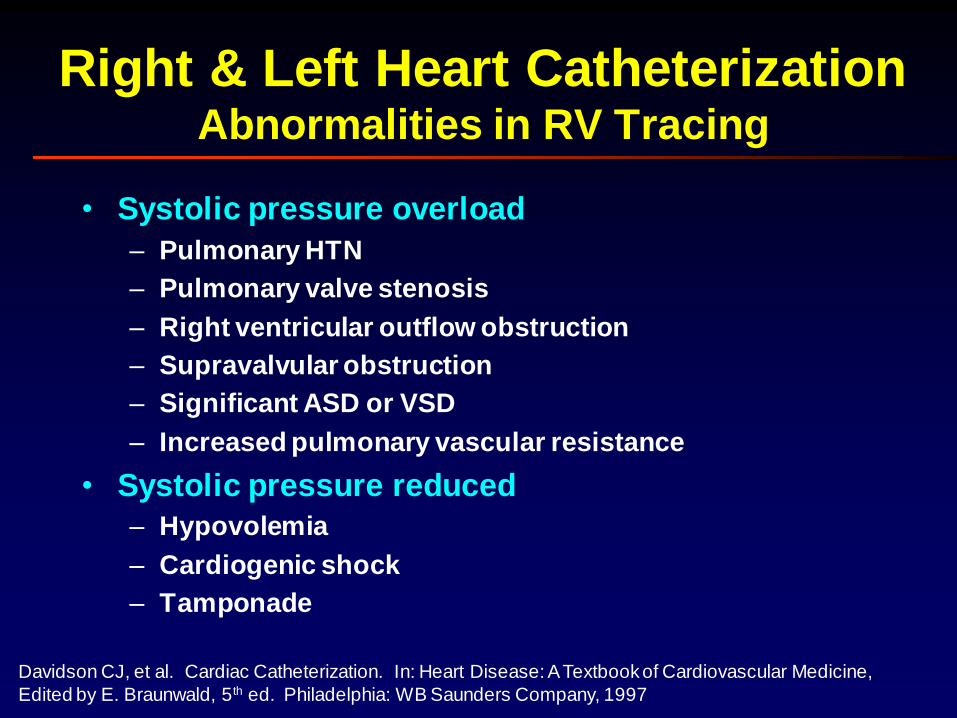
Right & Left Heart Catheterization Abnormalities in RV Tracing
• Systolic pressure overload
– Pulmonary HTN
– Pulmonary valve stenosis
– Right ventricular outflow obstruction
– Supravalvular obstruction
– Significant ASD or VSD
– Increased pulmonary vascular resistance
• Systolic pressure reduced
– Hypovolemia
– Cardiogenic shock
– Tamponade
Davidson CJ, et al. Cardiac Catheterization. In: Heart Disease: A Textbook of Cardiovascular Medicine,
Edited by E. Braunwald, 5th ed. Philadelphia: WB Saunders Company, 1997
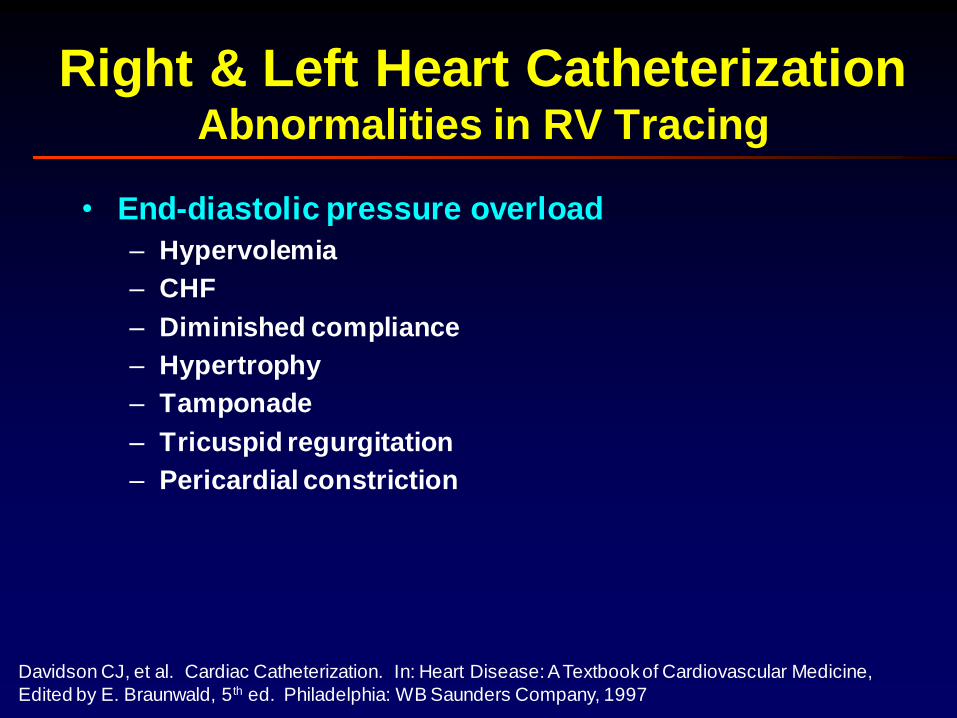
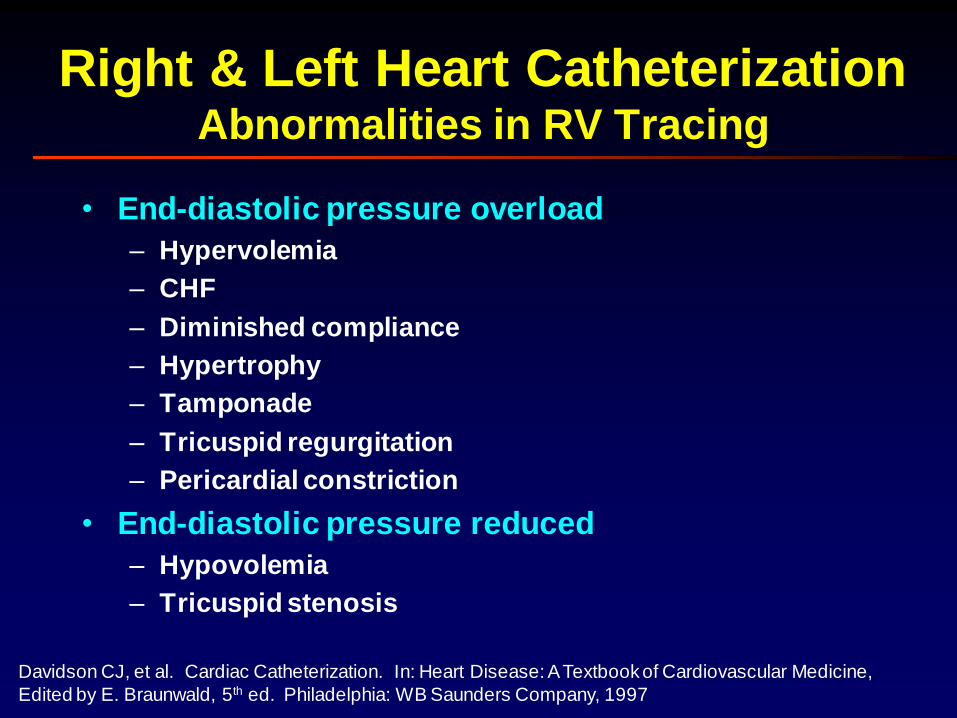
• End-diastolic pressure overload
– Hypervolemia
– CHF
– Diminished compliance
– Hypertrophy
– Tamponade
– Tricuspid regurgitation
– Pericardial constriction
Right & Left Heart Catheterization Abnormalities in RV Tracing
Davidson CJ, et al. Cardiac Catheterization. In: Heart Disease: A Textbook of Cardiovascular Medicine,
Edited by E. Braunwald, 5th ed. Philadelphia: WB Saunders Company, 1997
• End-diastolic pressure overload
– Hypervolemia
– CHF
– Diminished compliance
– Hypertrophy
– Tamponade
– Tricuspid regurgitation
– Pericardial constriction
• End-diastolic pressure reduced
– Hypovolemia
– Tricuspid stenosis
Right & Left Heart Catheterization Abnormalities in RV Tracing
Davidson CJ, et al. Cardiac Catheterization. In: Heart Disease: A Textbook of Cardiovascular Medicine,
Edited by E. Braunwald, 5th ed. Philadelphia: WB Saunders Company, 1997

Kern MJ. Right Heart Catheterization. CATHSAP II CD-ROM. Bethesda, American College of Cardiology,
2001.
Right Heart CatheterizationSwan Ganz Catheter
Baim DS and Grossman W. Cardiac Catheterization, Angiography, and Intervention. 5 th Edition. Baltimore:
Williams and Wilkins, 1996.
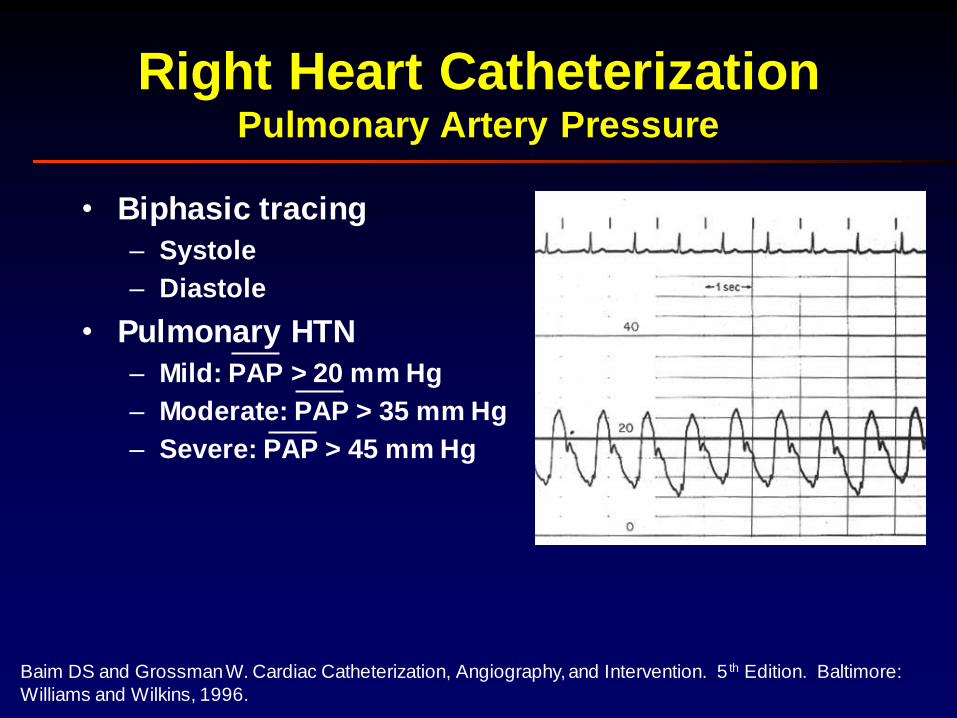
Right Heart CatheterizationPulmonary Artery Pressure
• Biphasic tracing
– Systole
– Diastole
• Pulmonary HTN
– Mild: PAP > 20 mm Hg
– Moderate: PAP > 35 mm Hg
– Severe: PAP > 45 mm Hg
Right Heart CatheterizationAbnormalities in PA Tracing
• Elevated systolic
pressure
– Primary pulmonary HTN
– MS
– MR
– CHF
– Restrictive myopathy
– Left-to-right shunt
– Pulmonary disease
Davidson CJ, et al. Cardiac Catheterization. In: Heart Disease: A Textbook of Cardiovascular Medicine,
Edited by E. Braunwald, 5th ed. Philadelphia: WB Saunders Company, 1997
Right Heart CatheterizationAbnormalities in PA Tracing
• Elevated systolic
pressure
– Primary pulmonary HTN
– MS
– MR
– CHF
– Restrictive myopathy
– Left-to-right shunt
– Pulmonary disease
• Reduced systolic
pressure
– Hypotension
– Pulmonary artery stenosis
– Pulmonic stenosis
– Supra or subvalvular
stenosis
– Ebstein’s anomaly
– Tricuspid stenosis
– Tricuspid atresia
Davidson CJ, et al. Cardiac Catheterization. In: Heart Disease: A Textbook of Cardiovascular Medicine,
Edited by E. Braunwald, 5th ed. Philadelphia: WB Saunders Company, 1997
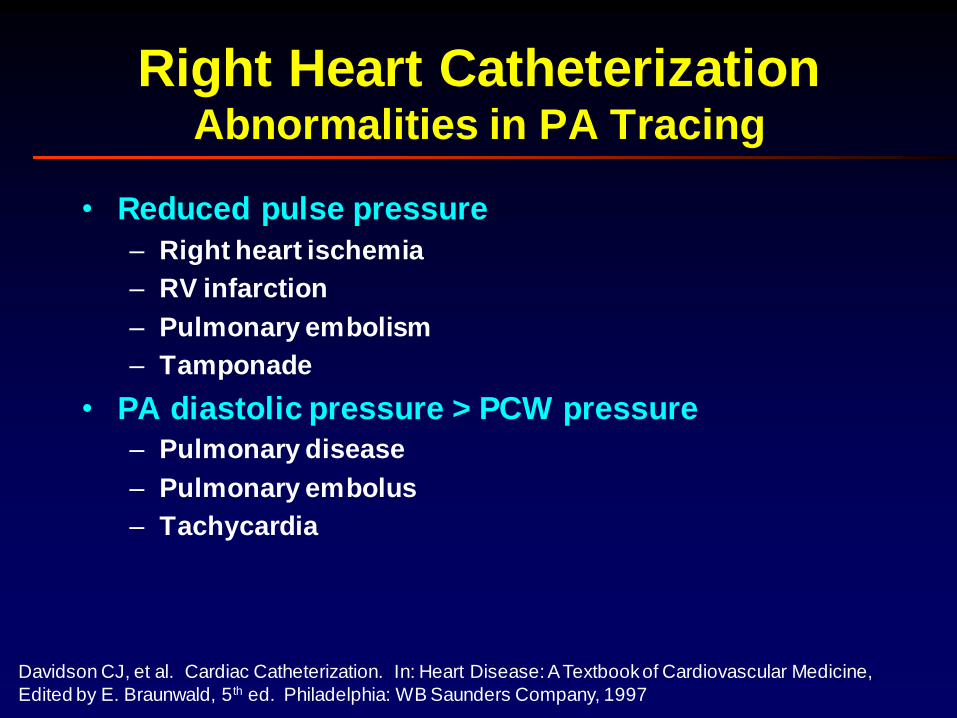
• Reduced pulse pressure
– Right heart ischemia
– RV infarction
– Pulmonary embolism
– Tamponade
• PA diastolic pressure > PCW pressure
– Pulmonary disease
– Pulmonary embolus
– Tachycardia
Right Heart CatheterizationAbnormalities in PA Tracing
Davidson CJ, et al. Cardiac Catheterization. In: Heart Disease: A Textbook of Cardiovascular Medicine,
Edited by E. Braunwald, 5th ed. Philadelphia: WB Saunders Company, 1997
Kern MJ. Right Heart Catheterization. CATHSAP II CD-ROM. Bethesda, American College of Cardiology,
2001.
Right Heart CatheterizationSwan Ganz Catheter
PCWP
Baim DS and Grossman W. Cardiac Catheterization, Angiography, and Intervention. 5 th Edition. Baltimore:
Williams and Wilkins, 1996.
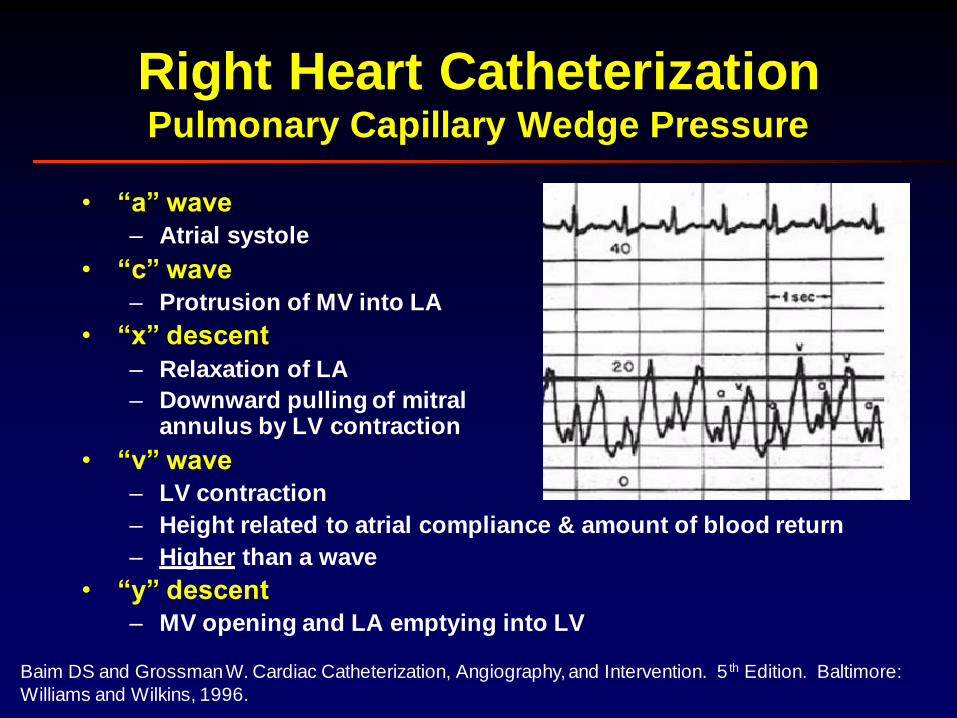
Right Heart CatheterizationPulmonary Capillary Wedge Pressure
• “a” wave
– Atrial systole
• “c” wave
– Protrusion of MV into LA
• “x” descent
– Relaxation of LA
– Downward pulling of mitralannulus by LV contraction
• “v” wave
– LV contraction
– Height related to atrial compliance & amount of blood return
– Higher than a wave
• “y” descent
– MV opening and LA emptying into LV
Kern MJ. Right Heart Catheterization. CATHSAP II CD-ROM. Bethesda, American College of Cardiology,
2001.
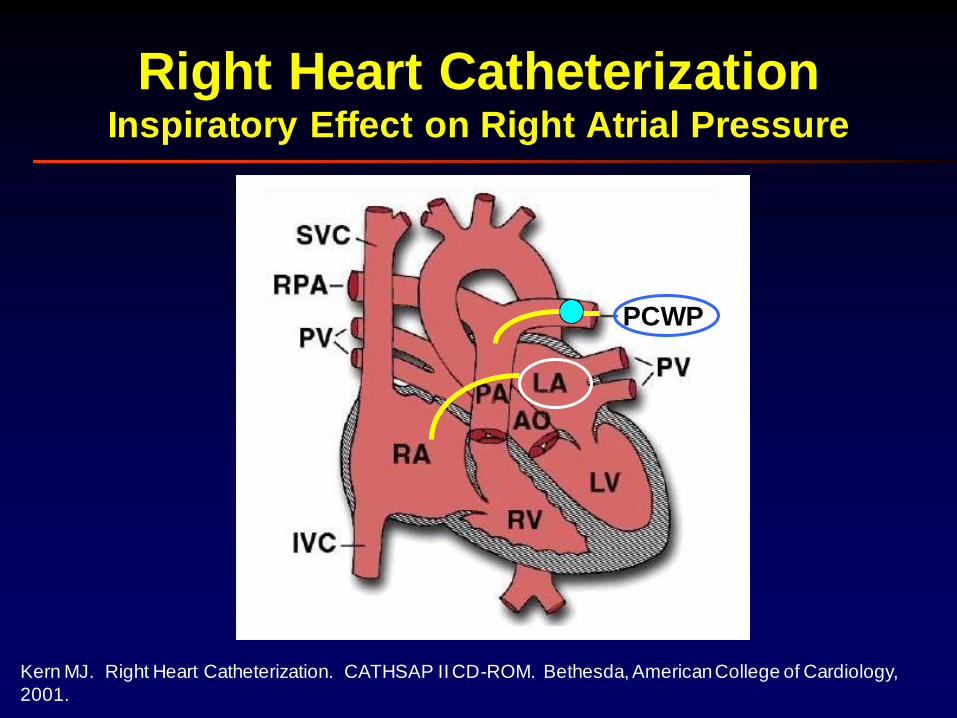
Right Heart CatheterizationInspiratory Effect on Right Atrial Pressure
PCWP
Baim DS and Grossman W. Cardiac Catheterization, Angiography, and Intervention. 5 th Edition. Baltimore:
Williams and Wilkins, 1996.
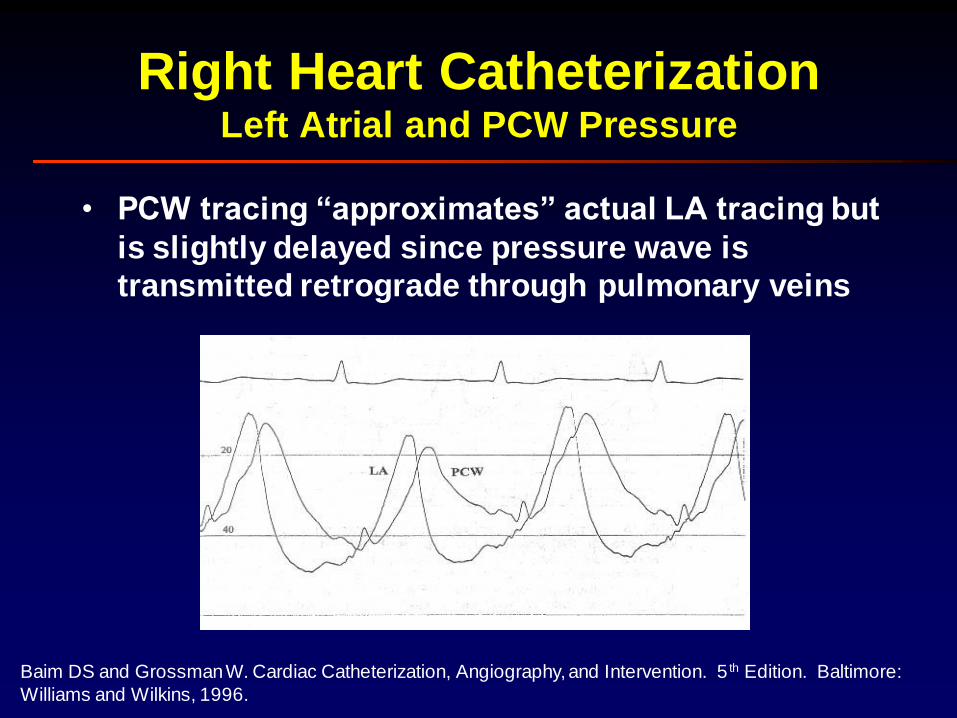
Right Heart CatheterizationLeft Atrial and PCW Pressure
• PCW tracing “approximates” actual LA tracing but
is slightly delayed since pressure wave is
transmitted retrograde through pulmonary veins
Kern MJ. Right Heart Catheterization. CATHSAP II CD-ROM. Bethesda, American College of Cardiology,
2001.
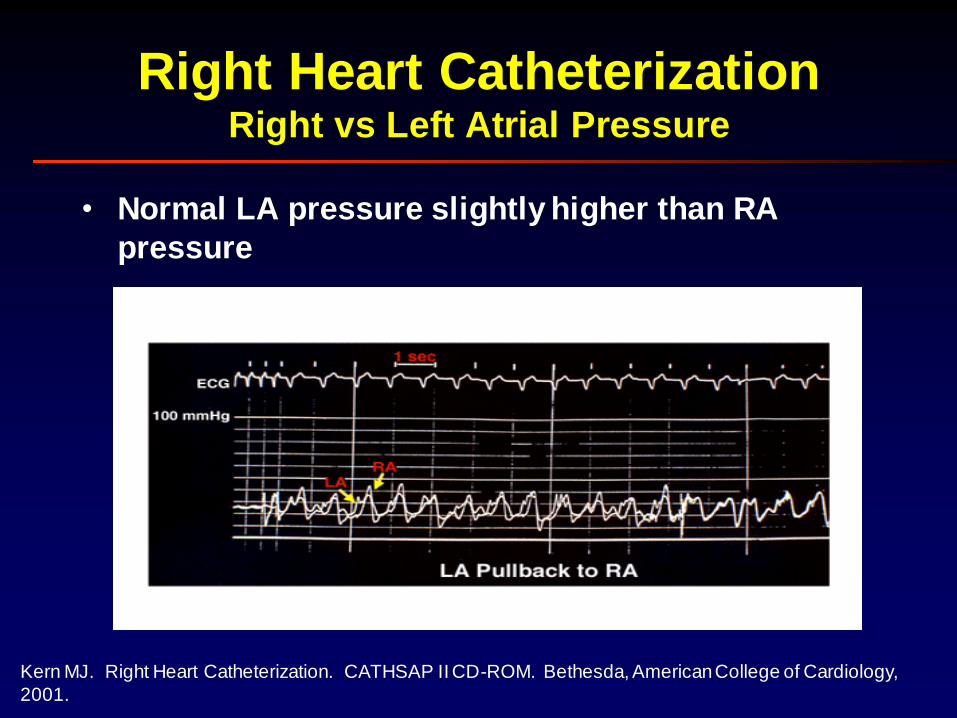
Right Heart CatheterizationRight vs Left Atrial Pressure
• Normal LA pressure slightly higher than RA
pressure
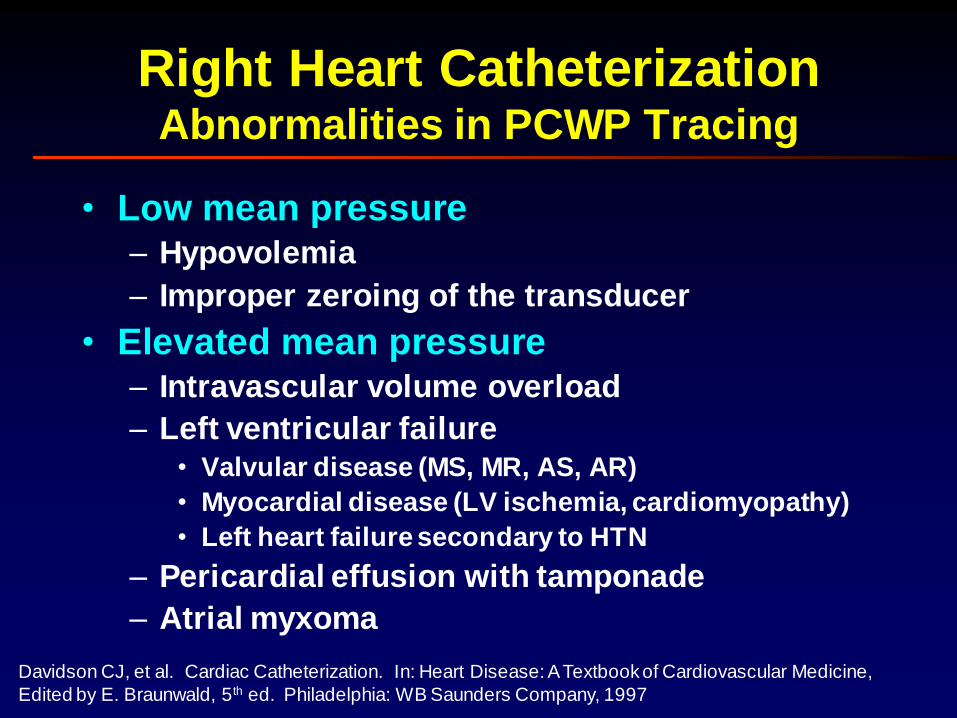
Right Heart CatheterizationAbnormalities in PCWP Tracing
• Low mean pressure– Hypovolemia
– Improper zeroing of the transducer
• Elevated mean pressure– Intravascular volume overload
– Left ventricular failure• Valvular disease (MS, MR, AS, AR)
• Myocardial disease (LV ischemia, cardiomyopathy)
• Left heart failure secondary to HTN
– Pericardial effusion with tamponade
– Atrial myxoma
Davidson CJ, et al. Cardiac Catheterization. In: Heart Disease: A Textbook of Cardiovascular Medicine,
Edited by E. Braunwald, 5th ed. Philadelphia: WB Saunders Company, 1997
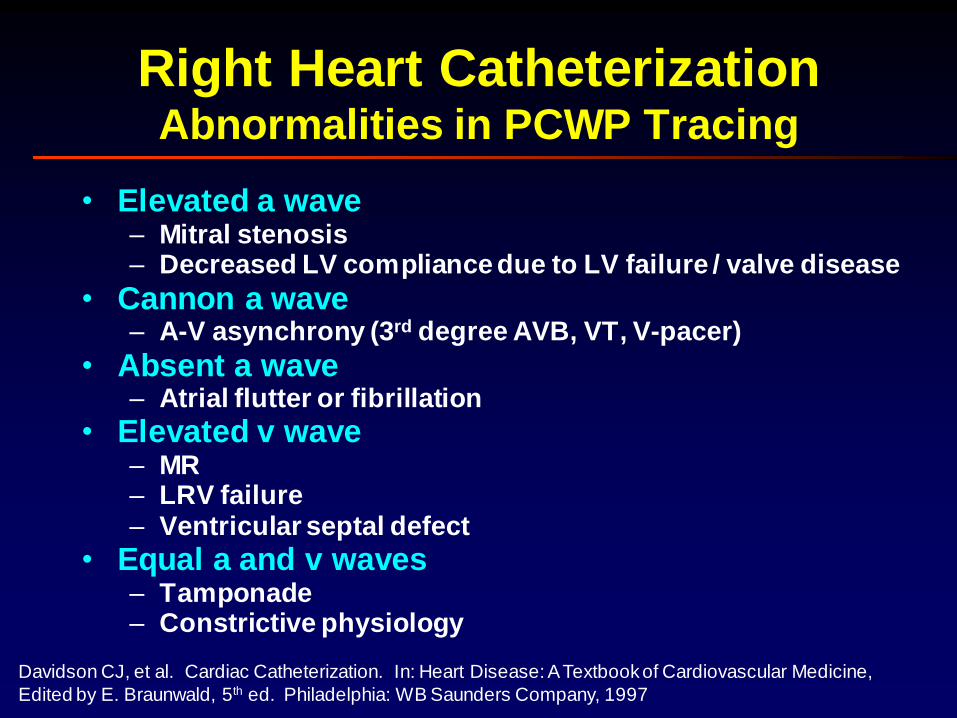
• Elevated a wave– Mitral stenosis– Decreased LV compliance due to LV failure / valve disease
• Cannon a wave– A-V asynchrony (3rd degree AVB, VT, V-pacer)
• Absent a wave– Atrial flutter or fibrillation
• Elevated v wave– MR– LRV failure– Ventricular septal defect
• Equal a and v waves– Tamponade– Constrictive physiology
Right Heart CatheterizationAbnormalities in PCWP Tracing
Davidson CJ, et al. Cardiac Catheterization. In: Heart Disease: A Textbook of Cardiovascular Medicine,
Edited by E. Braunwald, 5th ed. Philadelphia: WB Saunders Company, 1997
• Prominent x descent
– Tamponade
– Subacute/chronic
constriction
• Prominent y descent
– MR
– Constrictive pericarditis
– Restrictive myopathy
• Blunted x descent
– Atrial fibrillation
– LA ischemia
• Blunted y descent
– MS
– LV ischemia
– Tamponade
Right Heart CatheterizationAbnormalities in PCWP Tracing
Davidson CJ, et al. Cardiac Catheterization. In: Heart Disease: A Textbook of Cardiovascular Medicine,
Edited by E. Braunwald, 5th ed. Philadelphia: WB Saunders Company, 1997
Right Heart CatheterizationAbnormalities in PCWP Tracing
Davidson CJ, et al. Cardiac Catheterization. In: Heart Disease: A Textbook of Cardiovascular Medicine,
Edited by E. Braunwald, 5th ed. Philadelphia: WB Saunders Company, 1997
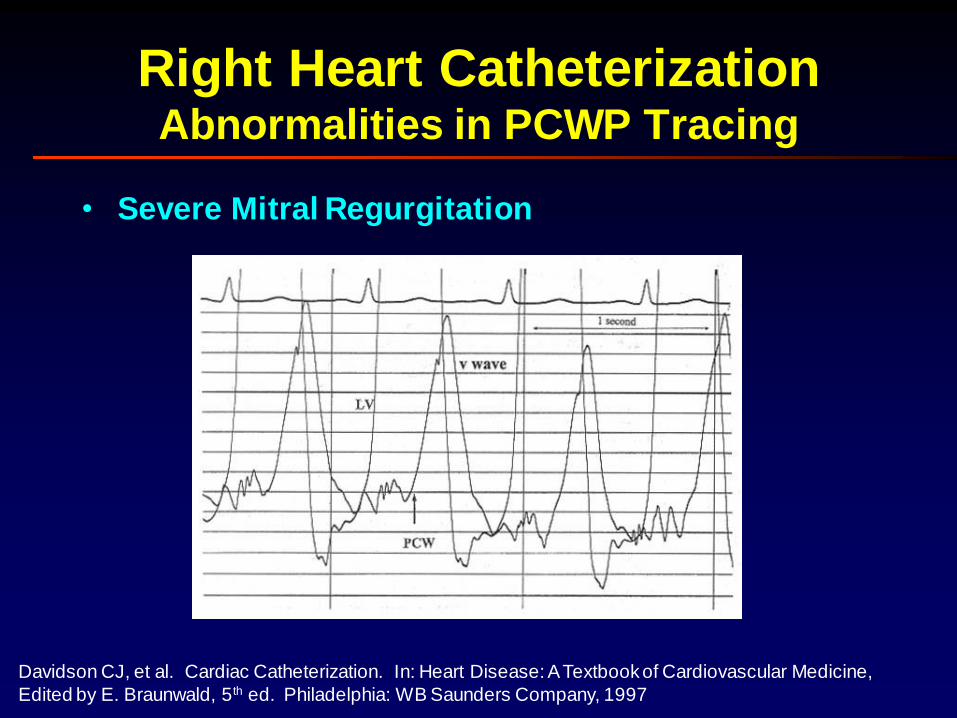
• Severe Mitral Regurgitation
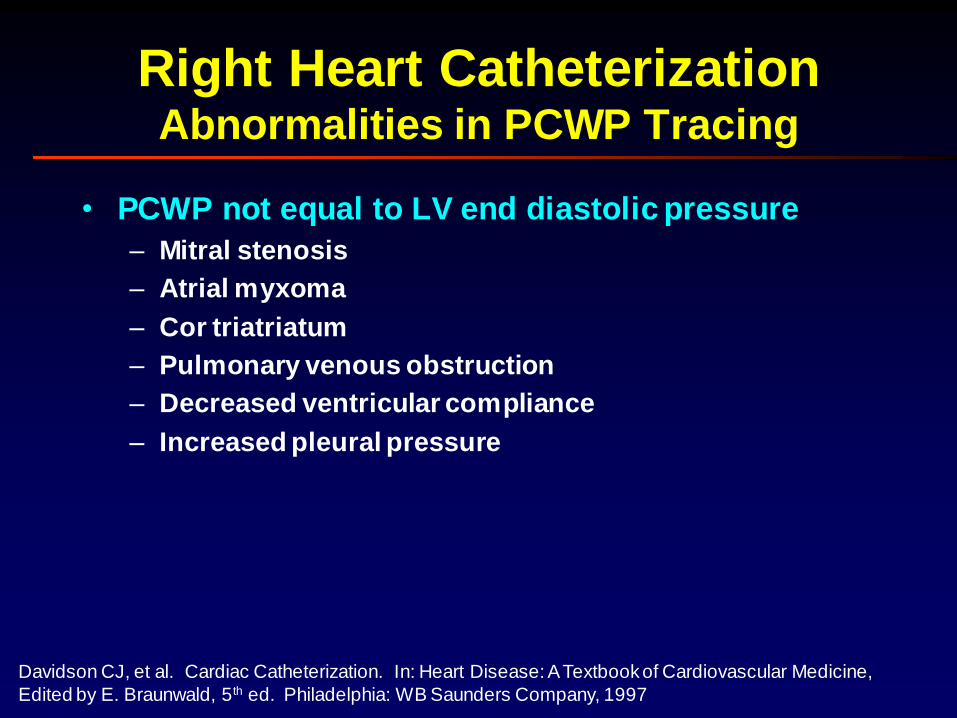
• PCWP not equal to LV end diastolic pressure
– Mitral stenosis
– Atrial myxoma
– Cor triatriatum
– Pulmonary venous obstruction
– Decreased ventricular compliance
– Increased pleural pressure
Right Heart CatheterizationAbnormalities in PCWP Tracing
Davidson CJ, et al. Cardiac Catheterization. In: Heart Disease: A Textbook of Cardiovascular Medicine,
Edited by E. Braunwald, 5th ed. Philadelphia: WB Saunders Company, 1997
Kern MJ. Right Heart Catheterization. CATHSAP II CD-ROM. Bethesda, American College of Cardiology,
2001.
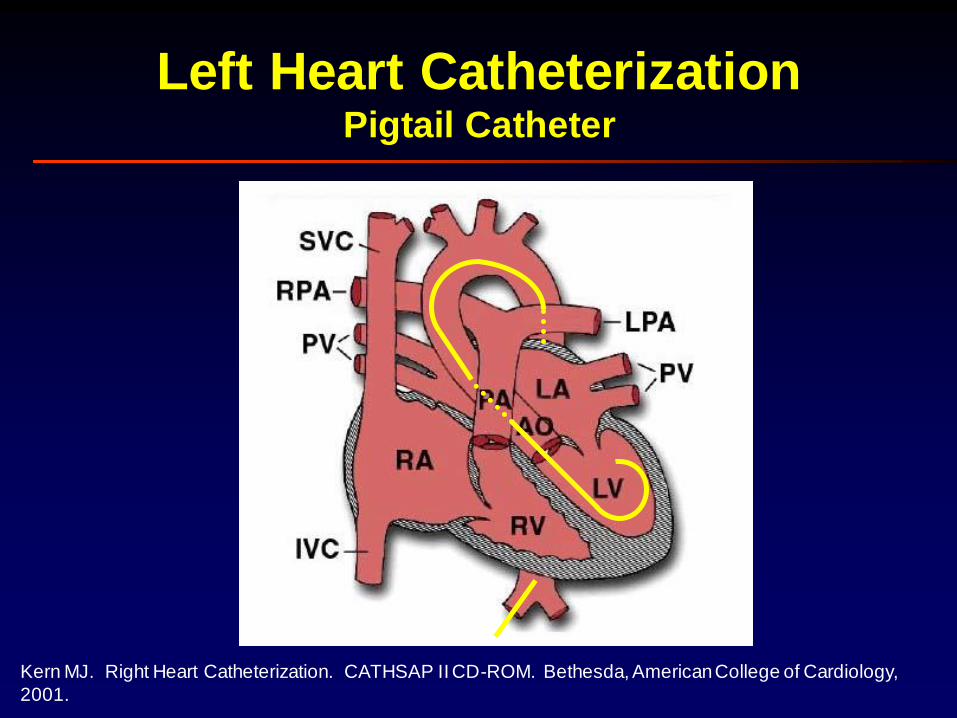
Left Heart CatheterizationPigtail Catheter
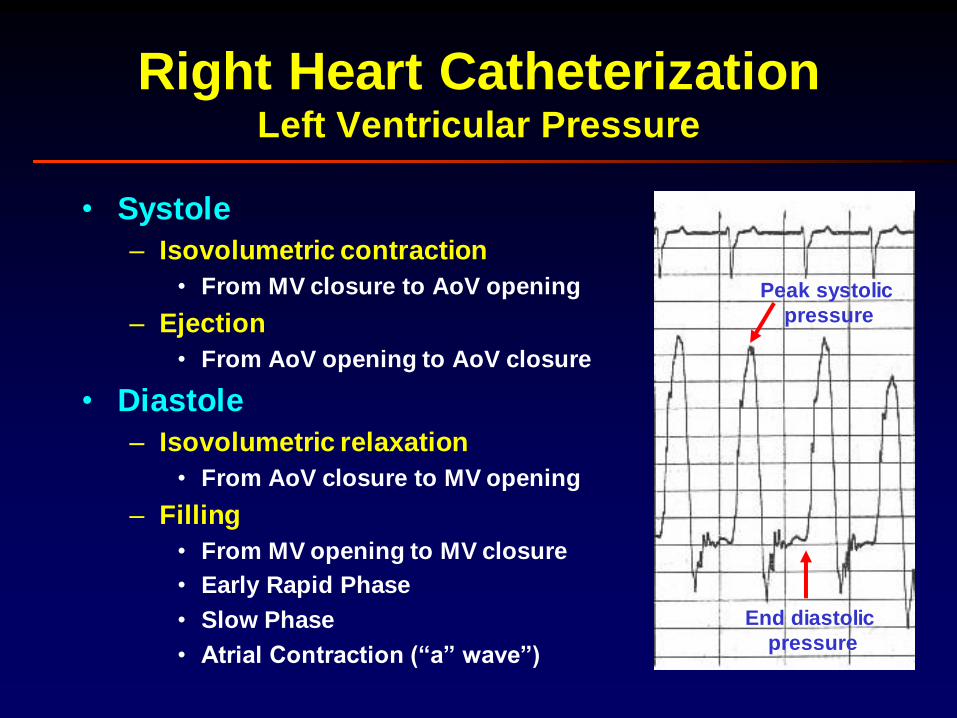
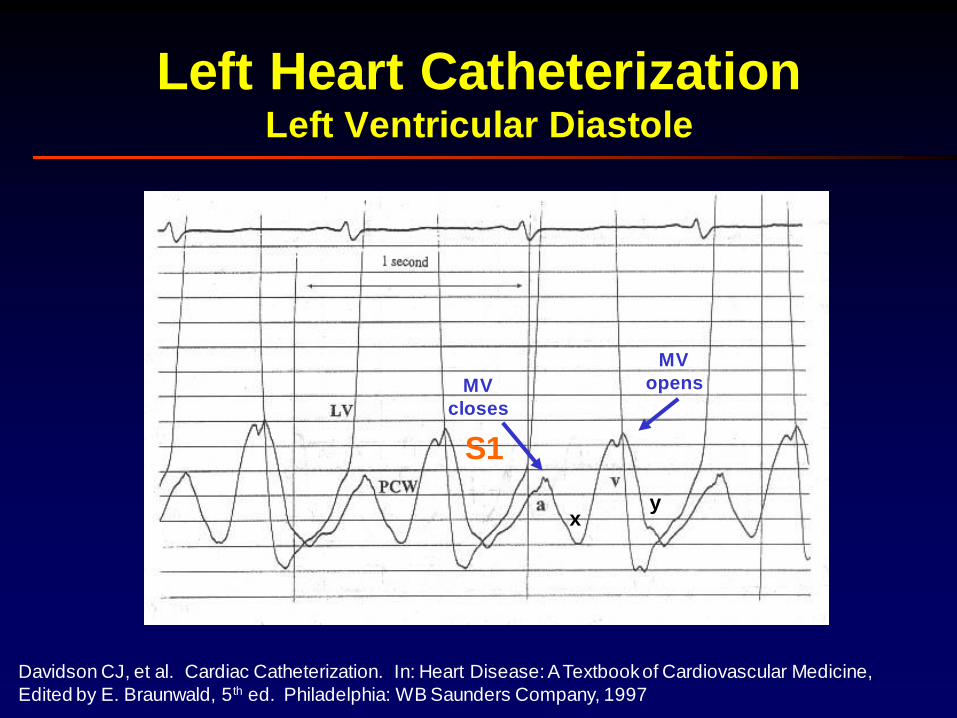
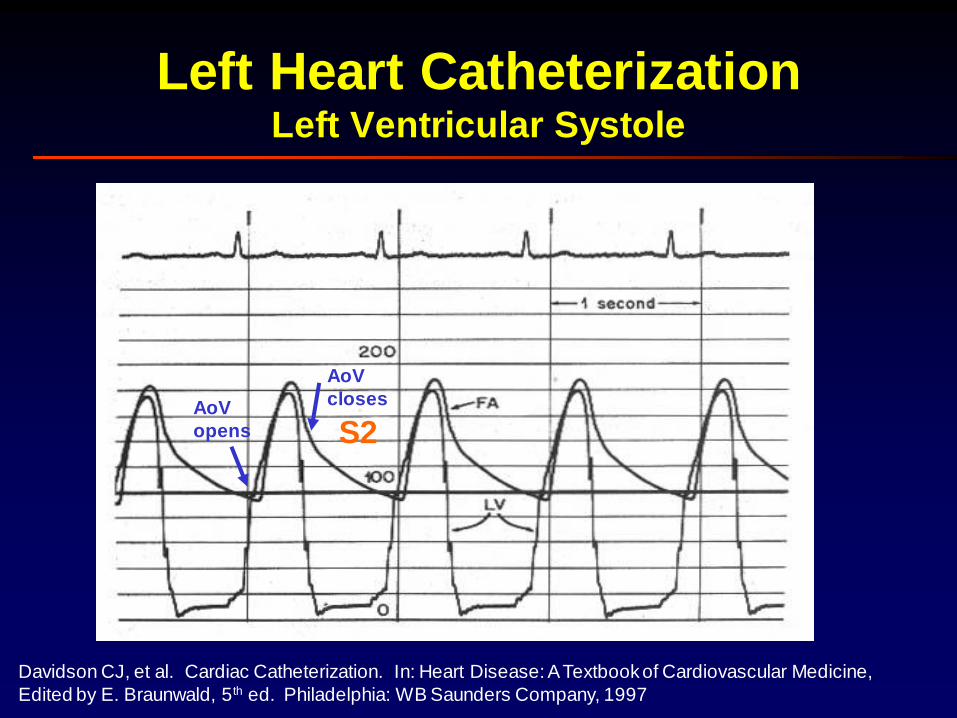
Right Heart CatheterizationLeft Ventricular Pressure
• Systole
– Isovolumetric contraction
• From MV closure to AoV opening
– Ejection
• From AoV opening to AoV closure
• Diastole
– Isovolumetric relaxation
• From AoV closure to MV opening
– Filling
• From MV opening to MV closure
• Early Rapid Phase
• Slow Phase
• Atrial Contraction (“a” wave”)
End diastolic
pressure
Peak systolic
pressure
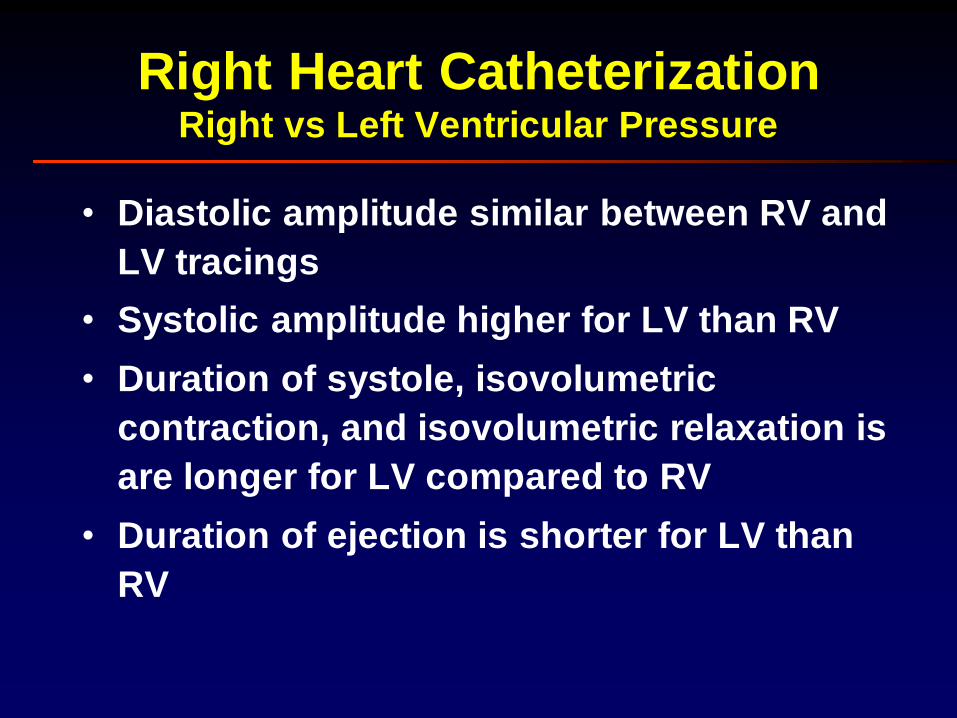
Right Heart CatheterizationRight vs Left Ventricular Pressure
• Diastolic amplitude similar between RV and
LV tracings
• Systolic amplitude higher for LV than RV
• Duration of systole, isovolumetric
contraction, and isovolumetric relaxation is
are longer for LV compared to RV
• Duration of ejection is shorter for LV than
RV
Right & Left Heart Catheterization Abnormalities in LV Tracing
• Systolic pressure overload
– Systemic HTN
– Aortic valve stenosis
– Left ventricular outflow obstruction
– Supravalvular obstruction
– Significant ASD or VSD
• Systolic pressure reduced
– Hypovolemia
– Cardiogenic shock
– Tamponade
Davidson CJ, et al. Cardiac Catheterization. In: Heart Disease: A Textbook of Cardiovascular Medicine,
Edited by E. Braunwald, 5th ed. Philadelphia: WB Saunders Company, 1997
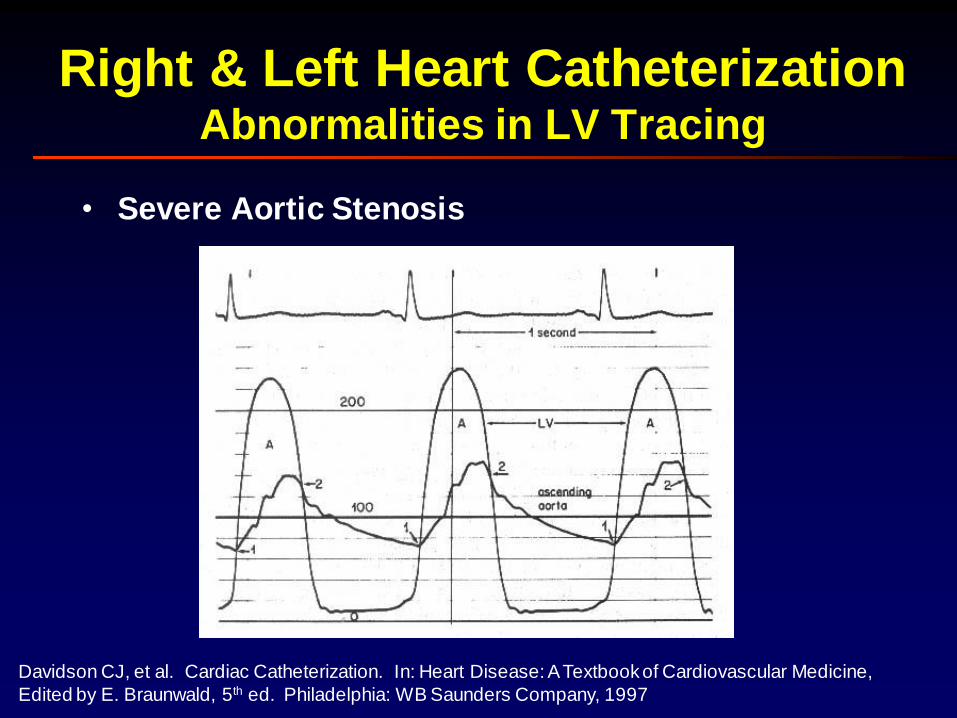
Right & Left Heart Catheterization Abnormalities in LV Tracing
• Severe Aortic Stenosis
Davidson CJ, et al. Cardiac Catheterization. In: Heart Disease: A Textbook of Cardiovascular Medicine,
Edited by E. Braunwald, 5th ed. Philadelphia: WB Saunders Company, 1997
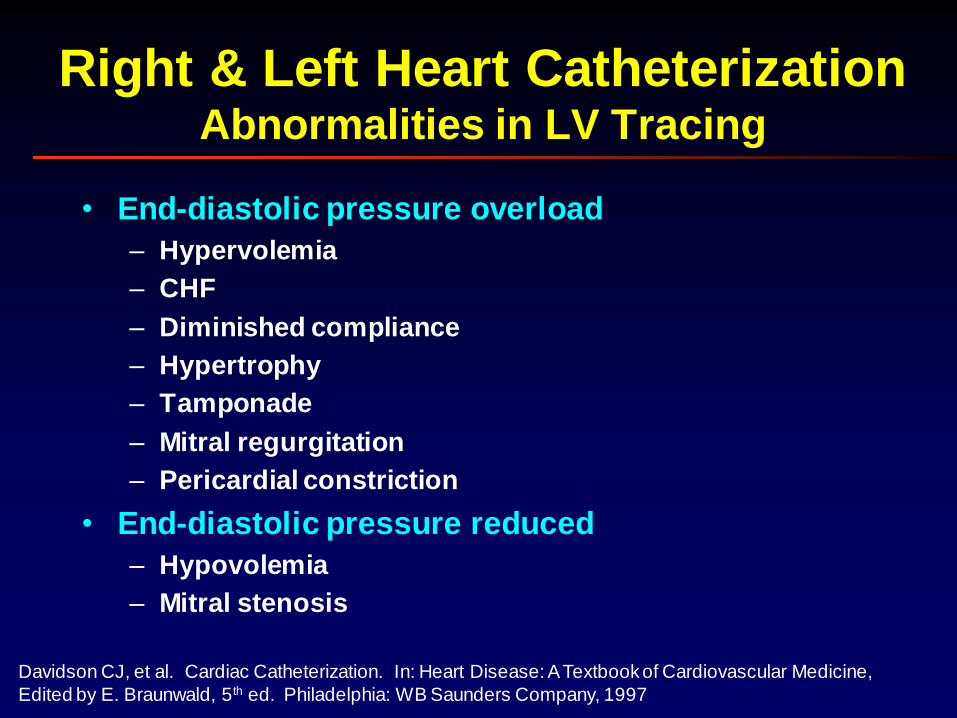
• End-diastolic pressure overload
– Hypervolemia
– CHF
– Diminished compliance
– Hypertrophy
– Tamponade
– Mitral regurgitation
– Pericardial constriction
• End-diastolic pressure reduced
– Hypovolemia
– Mitral stenosis
Right & Left Heart Catheterization Abnormalities in LV Tracing
Davidson CJ, et al. Cardiac Catheterization. In: Heart Disease: A Textbook of Cardiovascular Medicine,
Edited by E. Braunwald, 5th ed. Philadelphia: WB Saunders Company, 1997
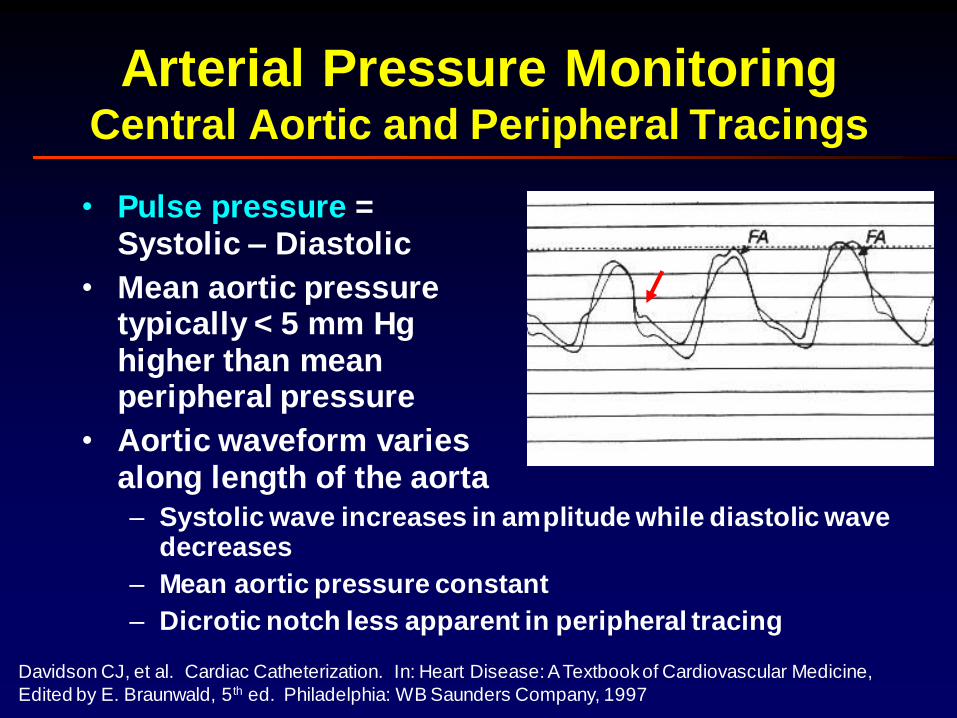
Arterial Pressure MonitoringCentral Aortic and Peripheral Tracings
• Pulse pressure = Systolic – Diastolic
• Mean aortic pressure typically < 5 mm Hg higher than mean peripheral pressure
• Aortic waveform variesalong length of the aorta
– Systolic wave increases in amplitude while diastolic wave decreases
– Mean aortic pressure constant
– Dicrotic notch less apparent in peripheral tracing
Davidson CJ, et al. Cardiac Catheterization. In: Heart Disease: A Textbook of Cardiovascular Medicine,
Edited by E. Braunwald, 5th ed. Philadelphia: WB Saunders Company, 1997
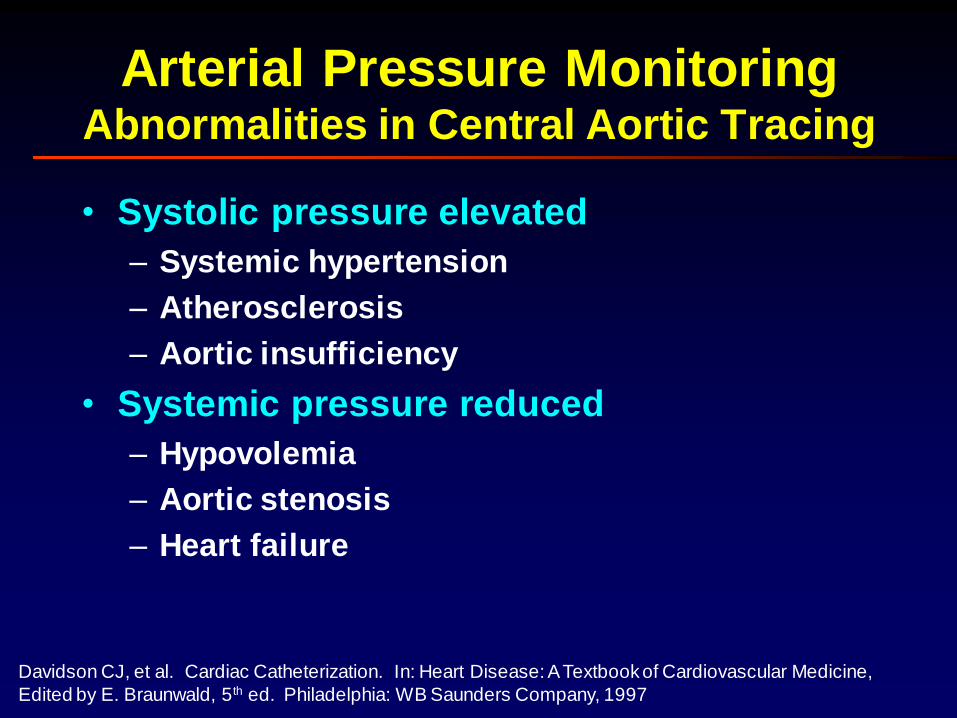
Arterial Pressure MonitoringAbnormalities in Central Aortic Tracing
• Systolic pressure elevated
– Systemic hypertension
– Atherosclerosis
– Aortic insufficiency
• Systemic pressure reduced
– Hypovolemia
– Aortic stenosis
– Heart failure
Davidson CJ, et al. Cardiac Catheterization. In: Heart Disease: A Textbook of Cardiovascular Medicine,
Edited by E. Braunwald, 5th ed. Philadelphia: WB Saunders Company, 1997
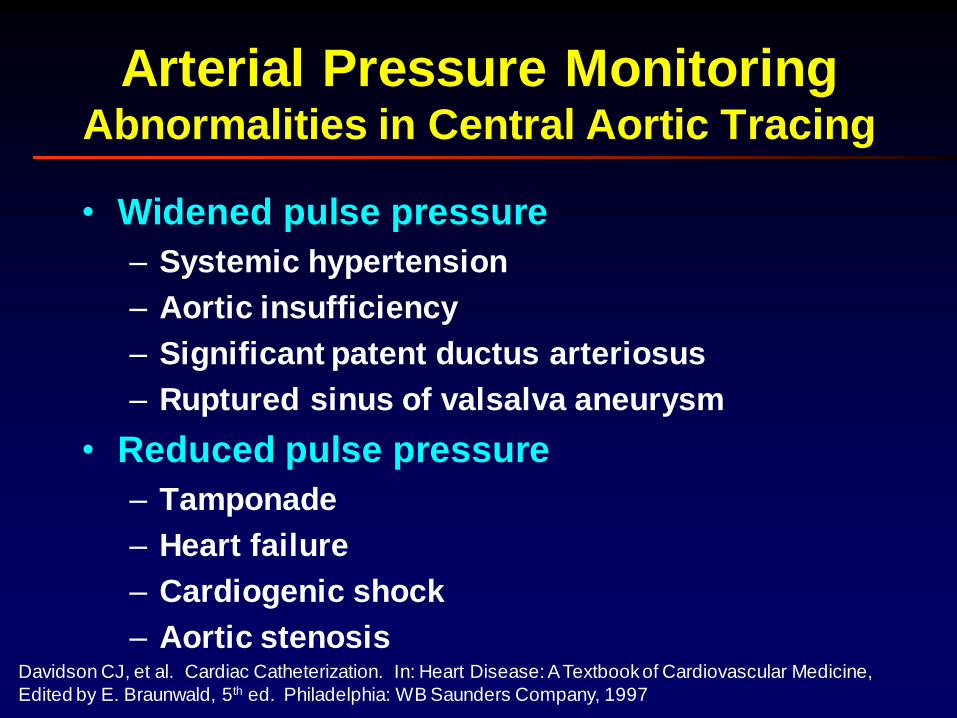
Arterial Pressure MonitoringAbnormalities in Central Aortic Tracing
• Widened pulse pressure
– Systemic hypertension
– Aortic insufficiency
– Significant patent ductus arteriosus
– Ruptured sinus of valsalva aneurysm
• Reduced pulse pressure
– Tamponade
– Heart failure
– Cardiogenic shock
– Aortic stenosisDavidson CJ, et al. Cardiac Catheterization. In: Heart Disease: A Textbook of Cardiovascular Medicine,
Edited by E. Braunwald, 5th ed. Philadelphia: WB Saunders Company, 1997
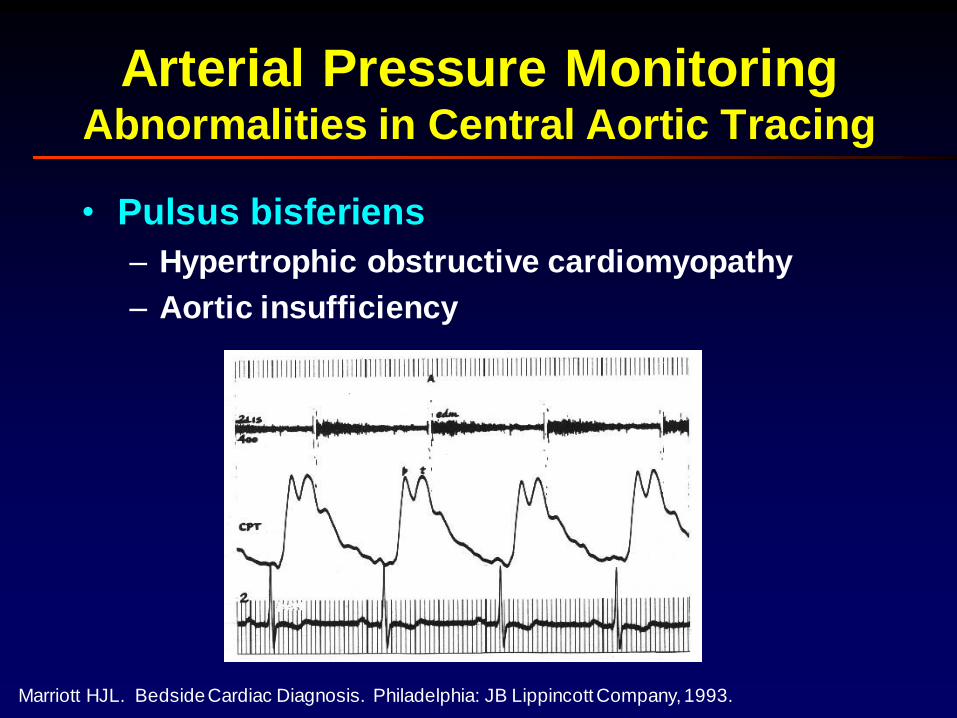
Arterial Pressure MonitoringAbnormalities in Central Aortic Tracing
• Pulsus bisferiens
– Hypertrophic obstructive cardiomyopathy
– Aortic insufficiency
Marriott HJL. Bedside Cardiac Diagnosis. Philadelphia: JB Lippincott Company, 1993.
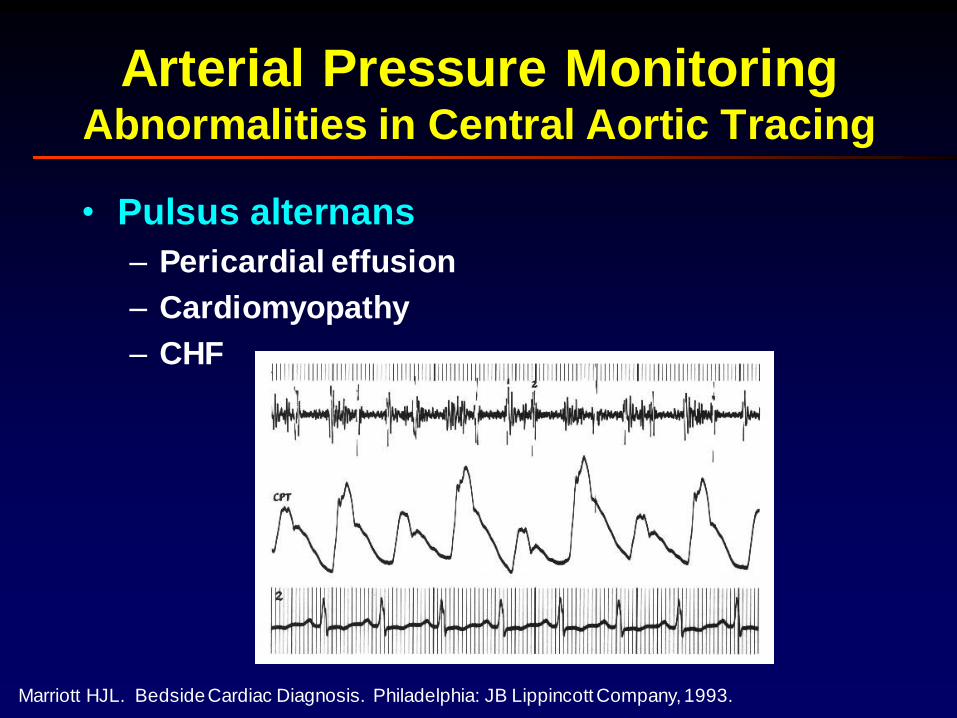
Arterial Pressure MonitoringAbnormalities in Central Aortic Tracing
• Pulsus alternans
– Pericardial effusion
– Cardiomyopathy
– CHF
Marriott HJL. Bedside Cardiac Diagnosis. Philadelphia: JB Lippincott Company, 1993.
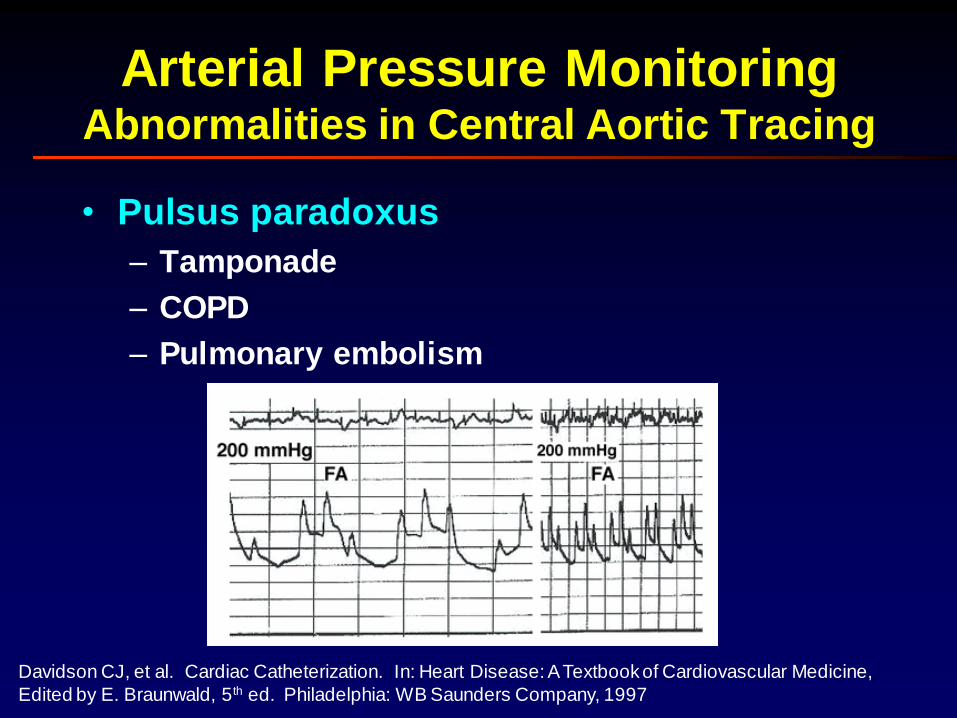
Arterial Pressure MonitoringAbnormalities in Central Aortic Tracing
• Pulsus paradoxus
– Tamponade
– COPD
– Pulmonary embolism
Davidson CJ, et al. Cardiac Catheterization. In: Heart Disease: A Textbook of Cardiovascular Medicine,
Edited by E. Braunwald, 5th ed. Philadelphia: WB Saunders Company, 1997
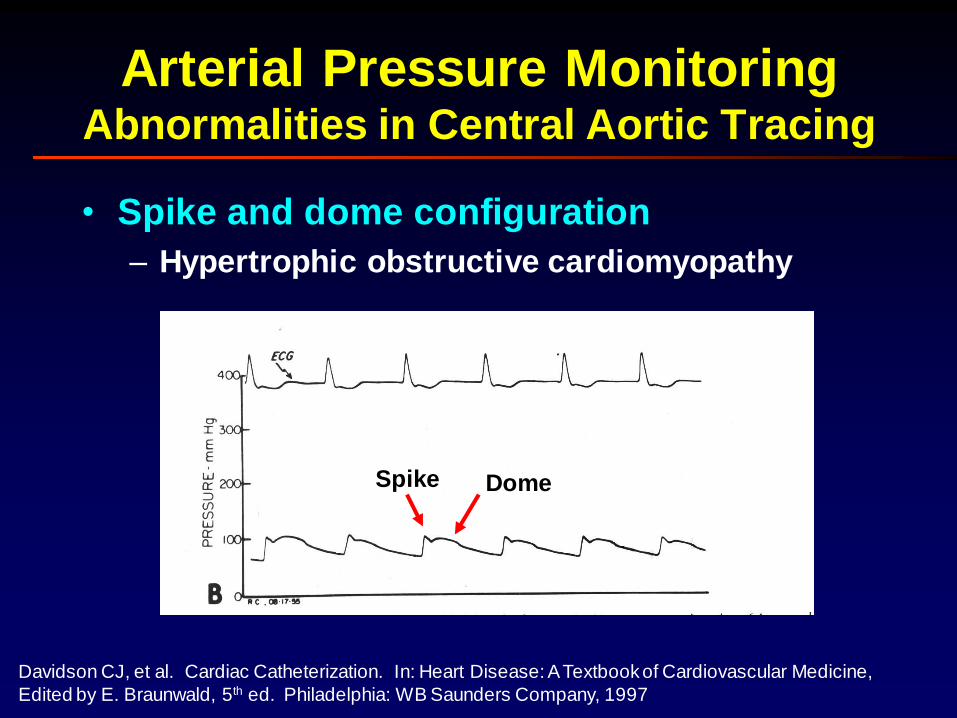
Arterial Pressure MonitoringAbnormalities in Central Aortic Tracing
• Spike and dome configuration
– Hypertrophic obstructive cardiomyopathy
Davidson CJ, et al. Cardiac Catheterization. In: Heart Disease: A Textbook of Cardiovascular Medicine,
Edited by E. Braunwald, 5th ed. Philadelphia: WB Saunders Company, 1997
Spike Dome
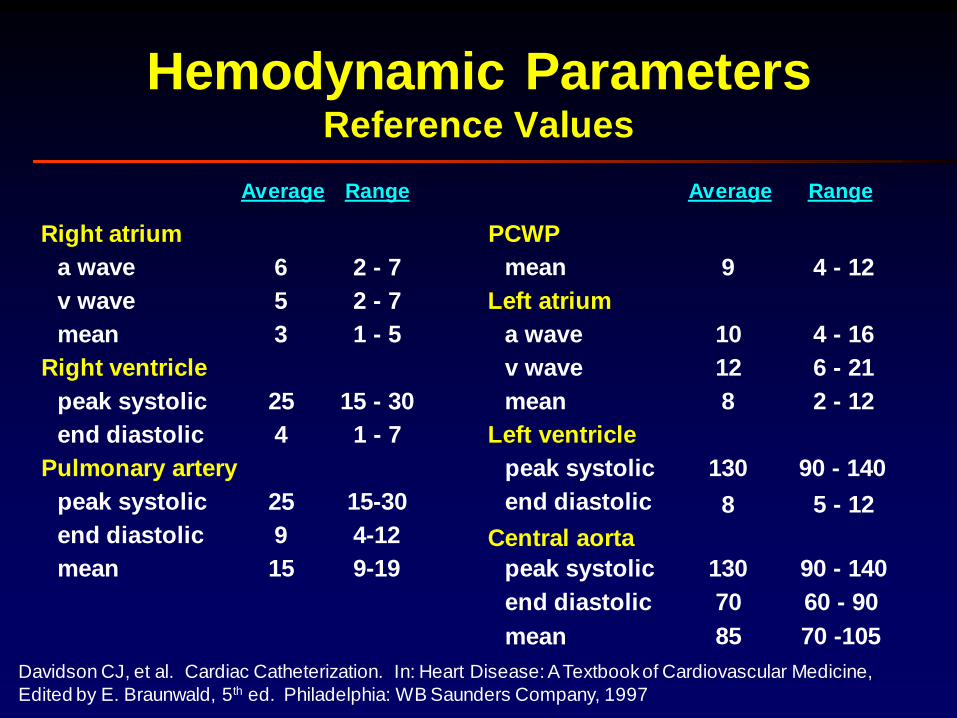
Hemodynamic ParametersReference Values
Davidson CJ, et al. Cardiac Catheterization. In: Heart Disease: A Textbook of Cardiovascular Medicine,
Edited by E. Braunwald, 5th ed. Philadelphia: WB Saunders Company, 1997
Average Range Average Range
a wave
v wave
mean
Right ventricle
peak systolic
end diastolic
Pulmonary artery
peak systolic
Right atrium
end diastolic
mean
6
5
25
9
15
25
4
3
2 - 7
2 - 7
15 - 30
4-12
9-19
15-30
1 - 7
1 - 5
mean
Left atrium
a wave
v wave
mean
Left ventricle
peak systolic
end diastolic
PCWP
Central aorta
peak systolic
9
12
8
130
8
10
4 - 12
6 - 21
2 - 12
90 - 140
5 - 12
4 - 16
130 90 - 140
70 60 - 90end diastolic
mean 85 70 -105
Davidson CJ, et al. Cardiac Catheterization. In: Heart Disease: A Textbook of Cardiovascular Medicine,
Edited by E. Braunwald, 5th ed. Philadelphia: WB Saunders Company, 1997
Left Heart CatheterizationLeft Ventricular Diastole
xy
MV
opensMV
closes
S1
Davidson CJ, et al. Cardiac Catheterization. In: Heart Disease: A Textbook of Cardiovascular Medicine,
Edited by E. Braunwald, 5th ed. Philadelphia: WB Saunders Company, 1997
Left Heart CatheterizationLeft Ventricular Systole
AoV
opens
AoV
closes
S2
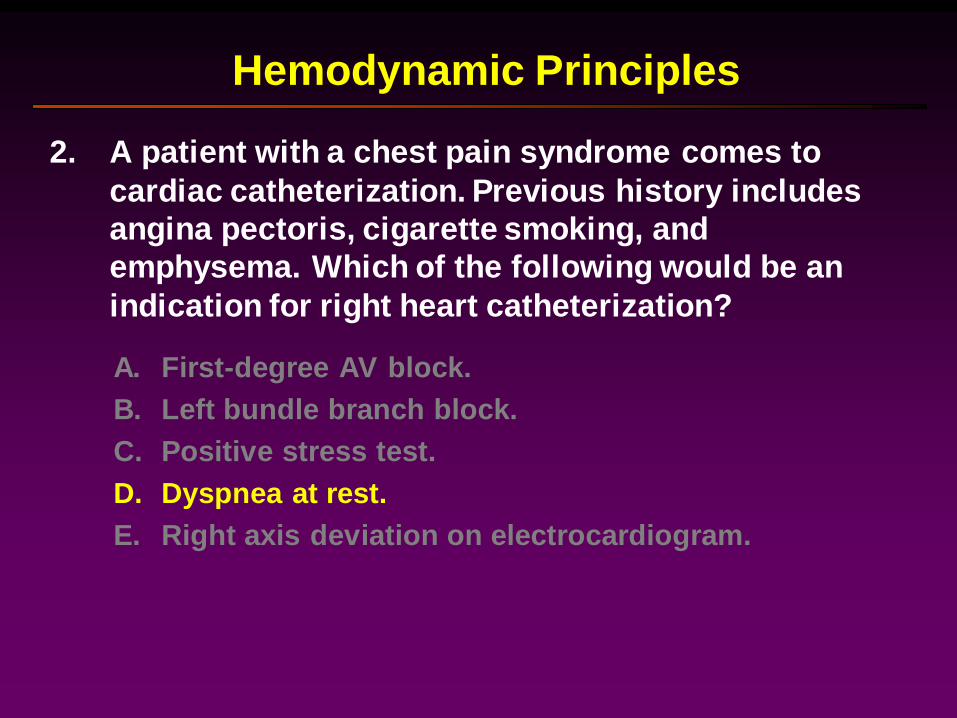
2. A patient with a chest pain syndrome comes to
cardiac catheterization. Previous history includes
angina pectoris, cigarette smoking, and
emphysema. Which of the following would be an
indication for right heart catheterization?
Hemodynamic Principles
A. First-degree AV block.
B. Left bundle branch block.
C. Positive stress test.
D. Dyspnea at rest.
E. Right axis deviation on electrocardiogram.
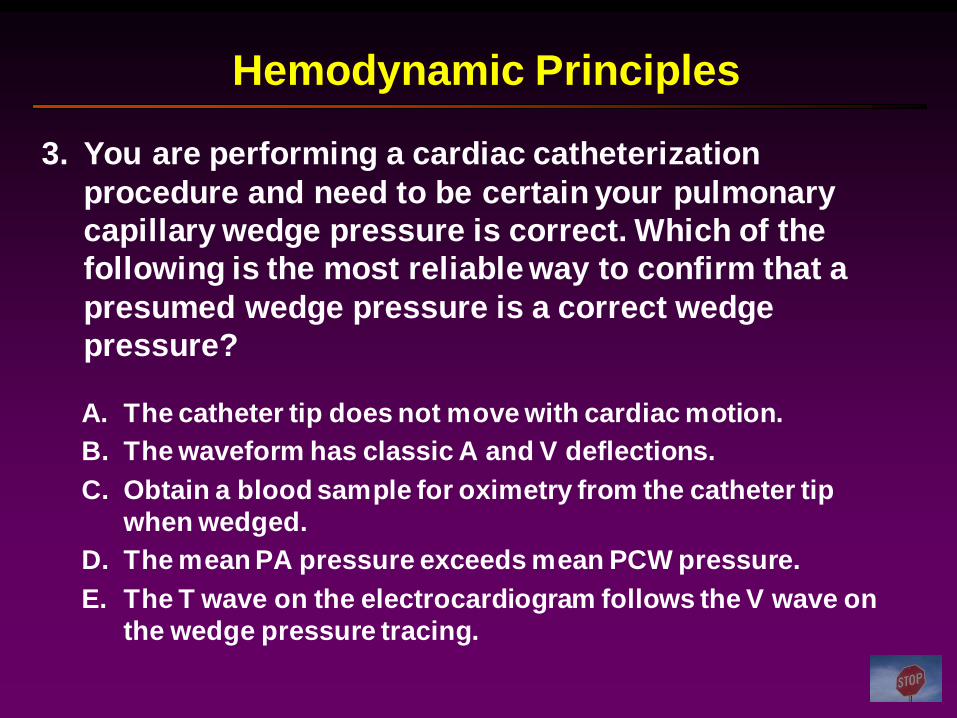
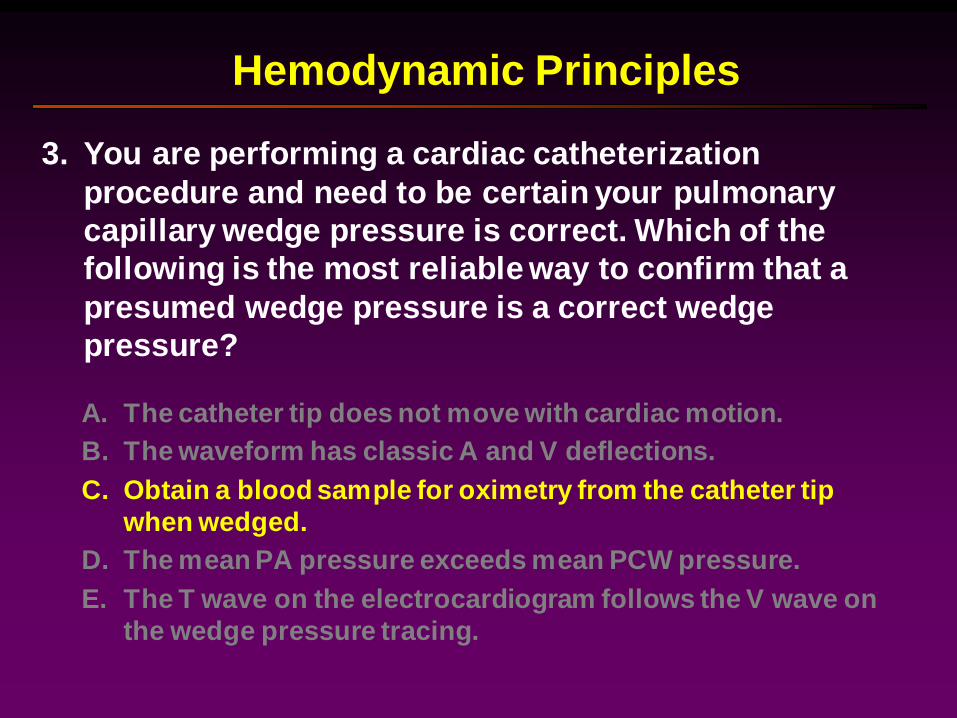
3. You are performing a cardiac catheterization
procedure and need to be certain your pulmonary
capillary wedge pressure is correct. Which of the
following is the most reliable way to confirm that a
presumed wedge pressure is a correct wedge
pressure?
A. The catheter tip does not move with cardiac motion.
B. The waveform has classic A and V deflections.
C. Obtain a blood sample for oximetry from the catheter tip
when wedged.
D. The mean PA pressure exceeds mean PCW pressure.
E. The T wave on the electrocardiogram follows the V wave on
the wedge pressure tracing.
Hemodynamic Principles
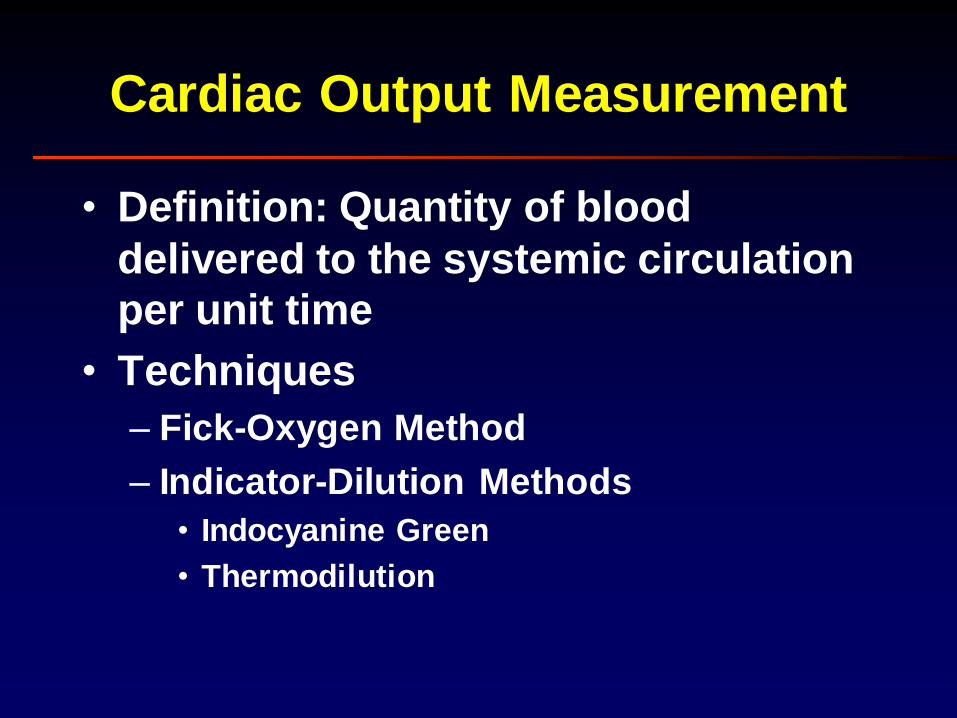
Cardiac Output Measurement
• Definition: Quantity of blood
delivered to the systemic circulation
per unit time
• Techniques
– Fick-Oxygen Method
– Indicator-Dilution Methods
• Indocyanine Green
• Thermodilution
Cardiac Output MeasurementFick Oxygen Method
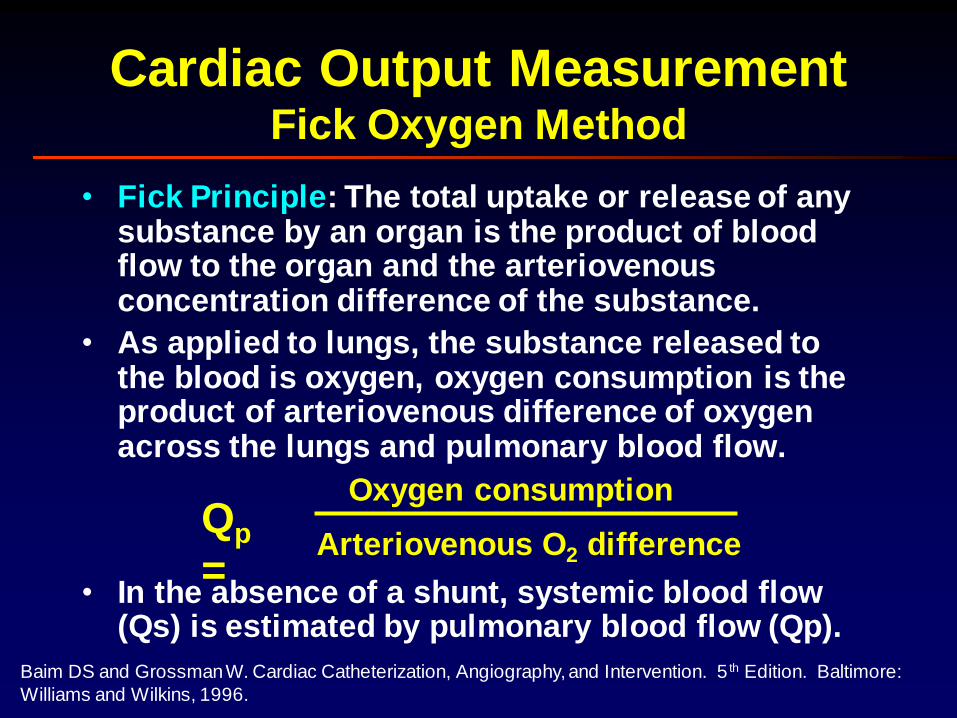
• Fick Principle: The total uptake or release of any substance by an organ is the product of blood flow to the organ and the arteriovenous concentration difference of the substance.
• As applied to lungs, the substance released to the blood is oxygen, oxygen consumption is the product of arteriovenous difference of oxygen across the lungs and pulmonary blood flow.
• In the absence of a shunt, systemic blood flow (Qs) is estimated by pulmonary blood flow (Qp).
Qp
=
Oxygen consumption
Arteriovenous O2 difference
Baim DS and Grossman W. Cardiac Catheterization, Angiography, and Intervention. 5 th Edition. Baltimore:
Williams and Wilkins, 1996.
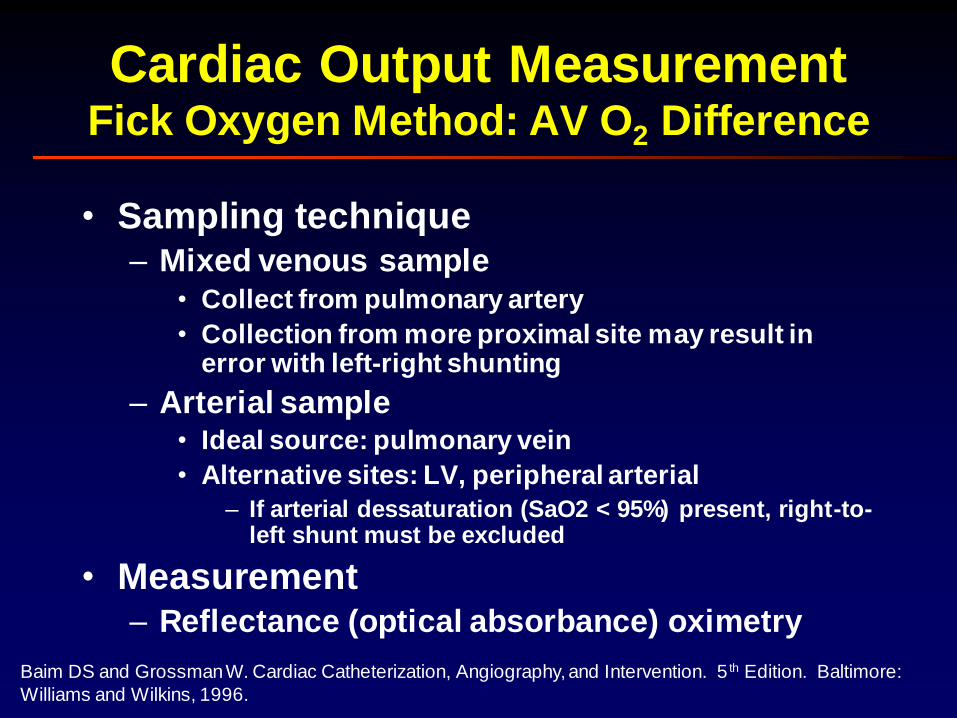
• Sampling technique– Mixed venous sample
• Collect from pulmonary artery
• Collection from more proximal site may result in error with left-right shunting
– Arterial sample• Ideal source: pulmonary vein
• Alternative sites: LV, peripheral arterial
– If arterial dessaturation (SaO2 < 95%) present, right-to-left shunt must be excluded
• Measurement– Reflectance (optical absorbance) oximetry
Cardiac Output MeasurementFick Oxygen Method: AV O2 Difference
Baim DS and Grossman W. Cardiac Catheterization, Angiography, and Intervention. 5 th Edition. Baltimore:
Williams and Wilkins, 1996.
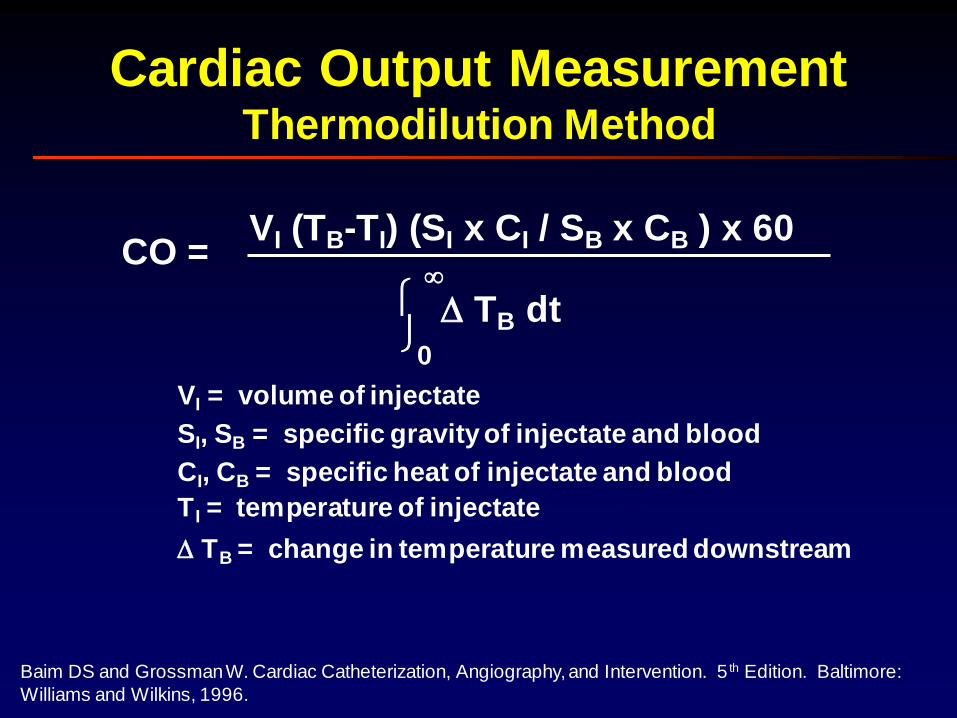
Cardiac Output MeasurementThermodilution Method
Baim DS and Grossman W. Cardiac Catheterization, Angiography, and Intervention. 5 th Edition. Baltimore:
Williams and Wilkins, 1996.
CO =
0
VI (TB-TI) (SI x CI / SB x CB ) x 60
TB dt
VI = volume of injectate
SI, SB = specific gravity of injectate and blood
TI = temperature of injectate
CI, CB = specific heat of injectate and blood
TB = change in temperature measured downstream
Baim DS and Grossman W. Cardiac Catheterization, Angiography, and Intervention. 5th Edition. Baltimore:
Williams and Wilkins, 1996.
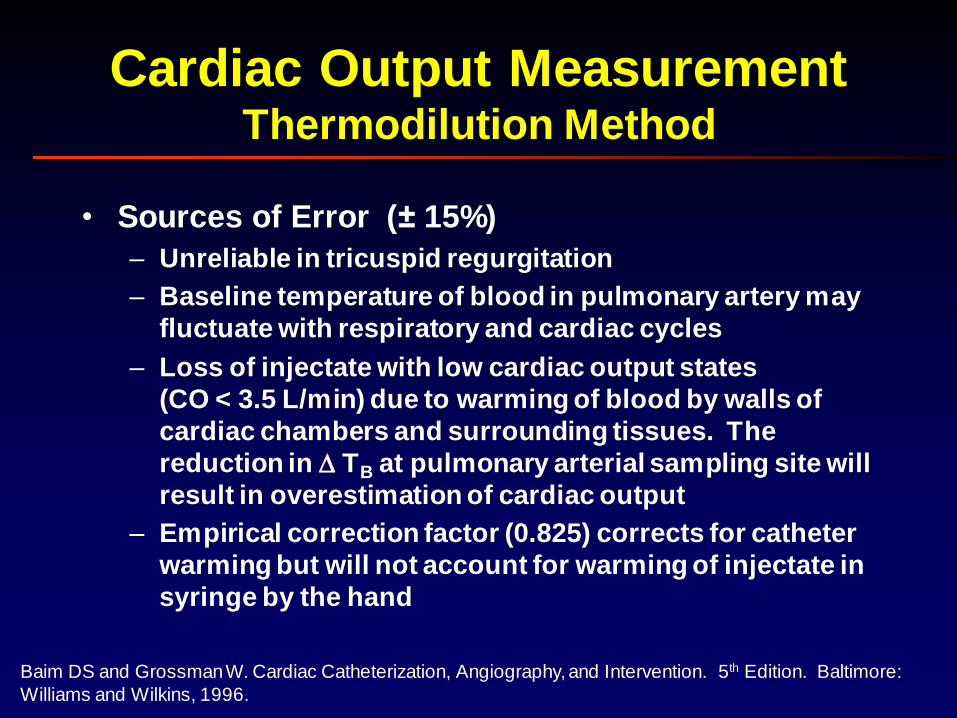
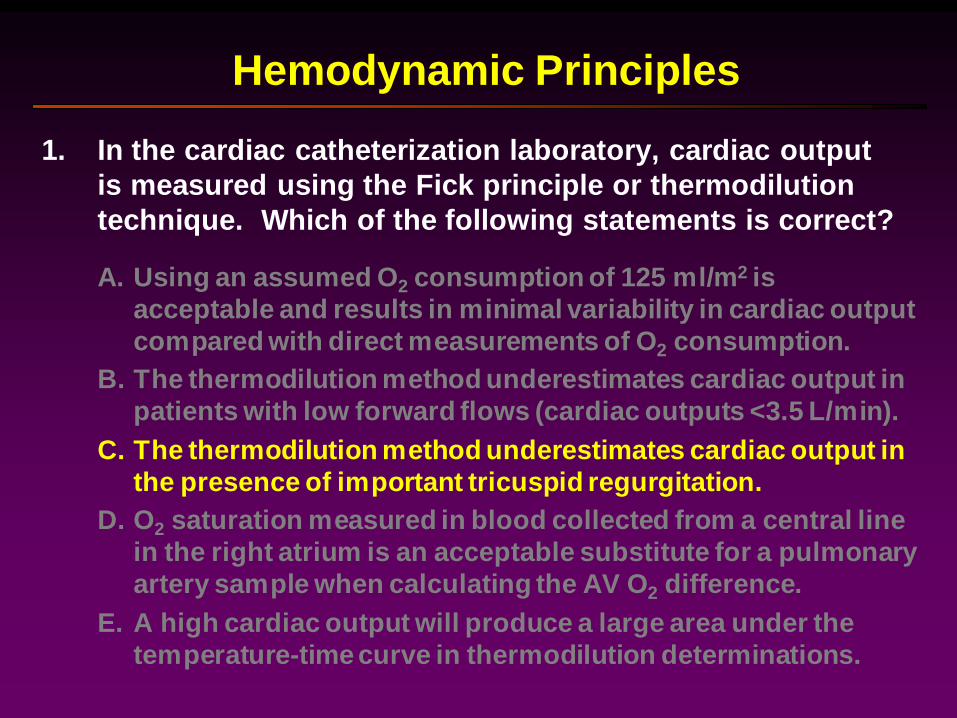
• Sources of Error (± 15%)
– Unreliable in tricuspid regurgitation
– Baseline temperature of blood in pulmonary artery may
fluctuate with respiratory and cardiac cycles
– Loss of injectate with low cardiac output states
(CO < 3.5 L/min) due to warming of blood by walls of
cardiac chambers and surrounding tissues. The
reduction in TB at pulmonary arterial sampling site will
result in overestimation of cardiac output
– Empirical correction factor (0.825) corrects for catheter
warming but will not account for warming of injectate in
syringe by the hand
Cardiac Output MeasurementThermodilution Method
Baim DS and Grossman W. Cardiac Catheterization, Angiography, and Intervention. 5 th Edition. Baltimore:
Williams and Wilkins, 1996.
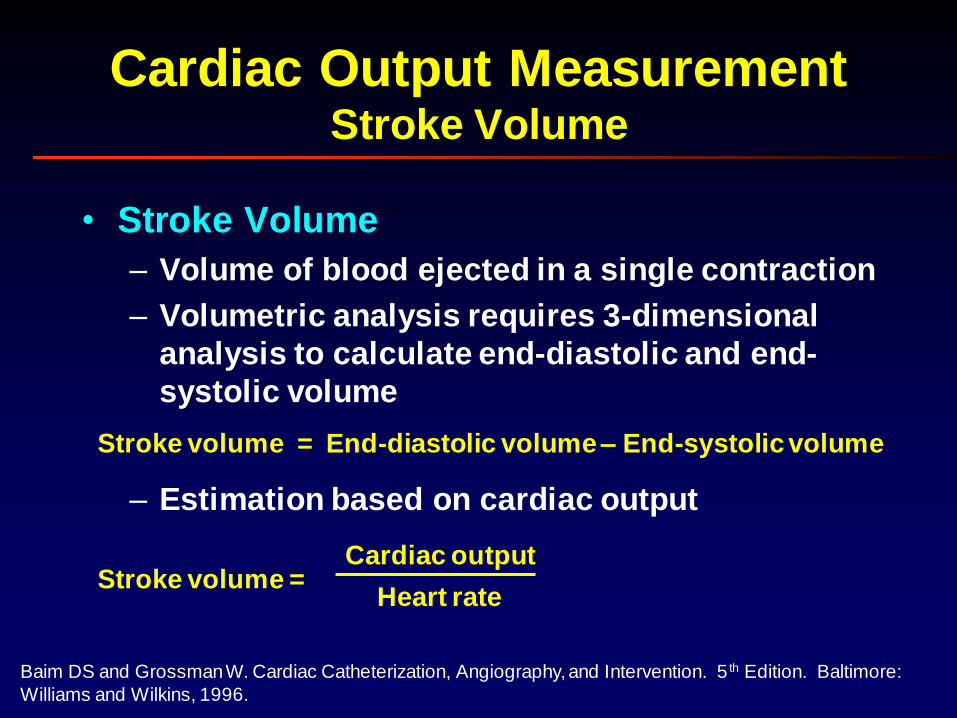
• Stroke Volume
– Volume of blood ejected in a single contraction
– Volumetric analysis requires 3-dimensional
analysis to calculate end-diastolic and end-
systolic volume
– Estimation based on cardiac output
Cardiac Output MeasurementStroke Volume
Stroke volume = End-diastolic volume – End-systolic volume
Stroke volume =Heart rate
Cardiac output
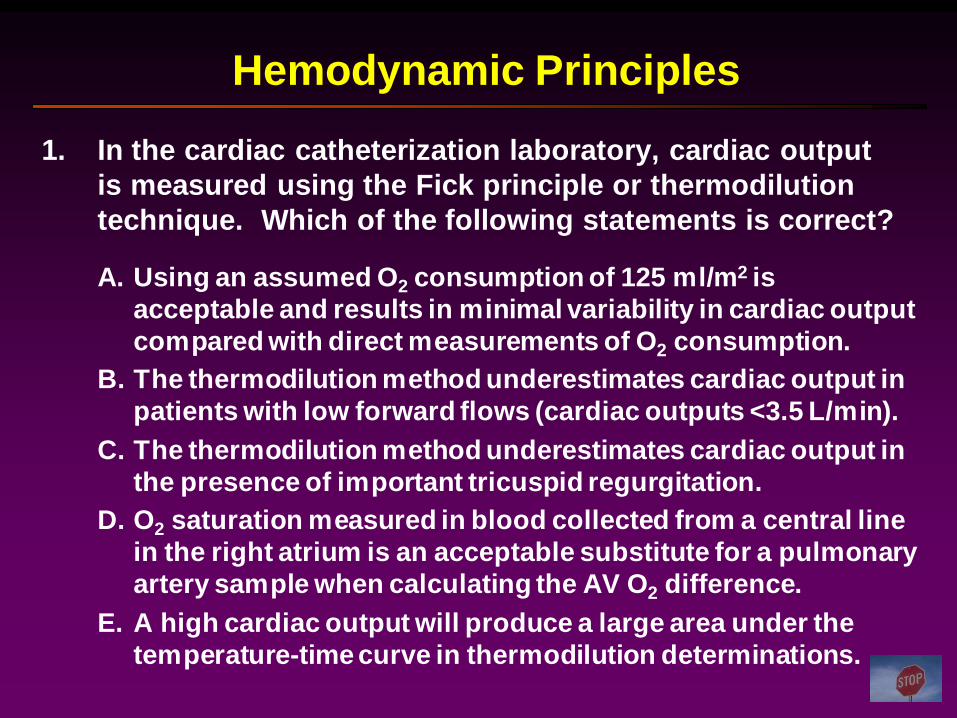
1. In the cardiac catheterization laboratory, cardiac output
is measured using the Fick principle or thermodilution
technique. Which of the following statements is correct?
Hemodynamic Principles
A. Using an assumed O2 consumption of 125 ml/m2 is
acceptable and results in minimal variability in cardiac output
compared with direct measurements of O2 consumption.
B. The thermodilution method underestimates cardiac output in
patients with low forward flows (cardiac outputs <3.5 L/min).
C. The thermodilution method underestimates cardiac output in
the presence of important tricuspid regurgitation.
D. O2 saturation measured in blood collected from a central line
in the right atrium is an acceptable substitute for a pulmonary
artery sample when calculating the AV O2 difference.
E. A high cardiac output will produce a large area under the
temperature-time curve in thermodilution determinations.
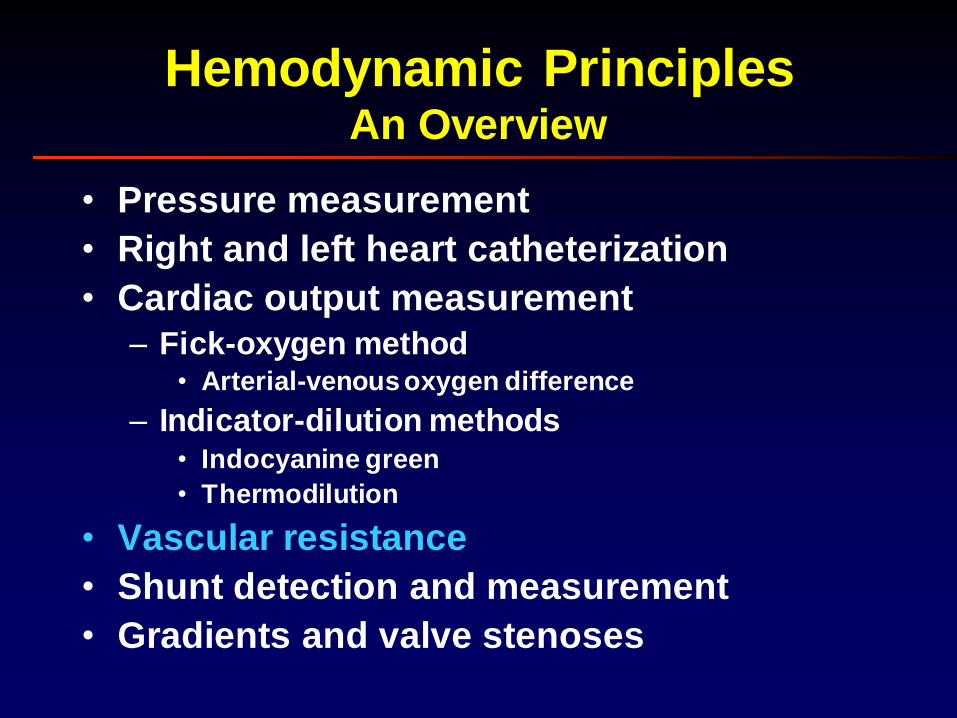
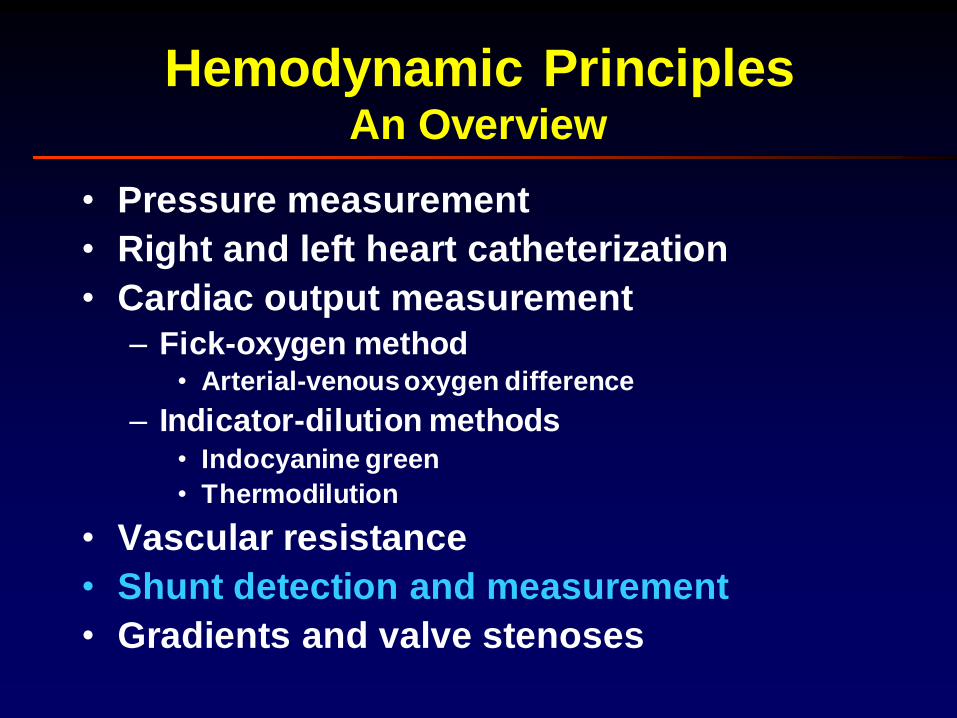
Hemodynamic PrinciplesAn Overview
• Pressure measurement
• Right and left heart catheterization
• Cardiac output measurement
– Fick-oxygen method• Arterial-venous oxygen difference
– Indicator-dilution methods• Indocyanine green
• Thermodilution
• Vascular resistance
• Shunt detection and measurement
• Gradients and valve stenoses
Baim DS and Grossman W. Cardiac Catheterization, Angiography, and Intervention. 5 th Edition. Baltimore:
Williams and Wilkins, 1996.
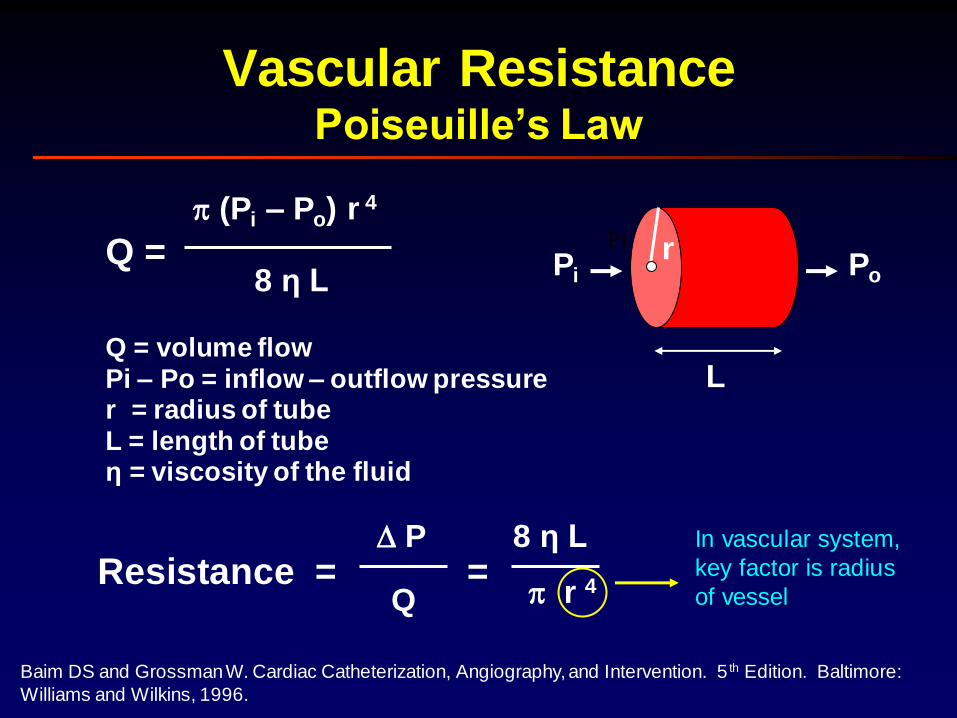
Vascular ResistancePoiseuille’s Law
Q =
(Pi – Po) r 4
8 η L
Pi rPoPi
LPi – Po = inflow – outflow pressurer = radius of tube
η = viscosity of the fluidL = length of tube
Q = volume flow
Resistance =8 η L P
Q =
r 4
In vascular system,
key factor is radius
of vessel
Baim DS and Grossman W. Cardiac Catheterization, Angiography, and Intervention. 5th Edition. Baltimore:
Williams and Wilkins, 1996.
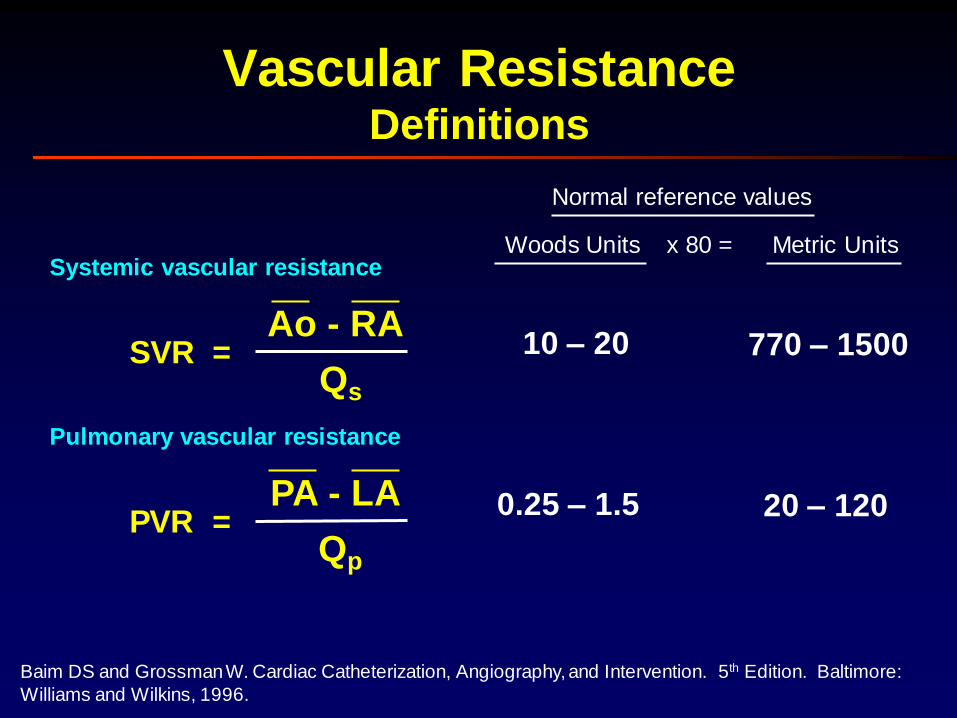
SVR =
Vascular ResistanceDefinitions
Ao - RA
Qs
PVR =PA - LA
Qp
Normal reference values
Woods Units x 80 = Metric Units
10 – 20 770 – 1500
0.25 – 1.5 20 – 120
Systemic vascular resistance
Pulmonary vascular resistance
Baim DS and Grossman W. Cardiac Catheterization, Angiography, and Intervention. 5th Edition. Baltimore:
Williams and Wilkins, 1996.
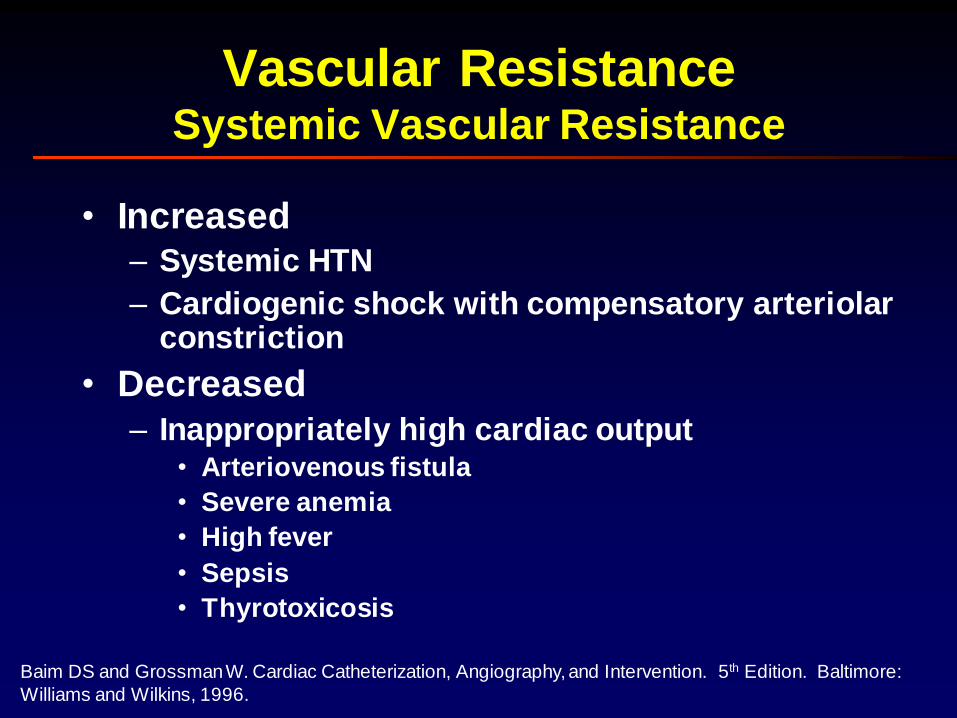
Vascular ResistanceSystemic Vascular Resistance
• Increased– Systemic HTN
– Cardiogenic shock with compensatory arteriolar constriction
• Decreased
– Inappropriately high cardiac output• Arteriovenous fistula
• Severe anemia
• High fever
• Sepsis
• Thyrotoxicosis
Baim DS and Grossman W. Cardiac Catheterization, Angiography, and Intervention. 5 th Edition. Baltimore:
Williams and Wilkins, 1996.
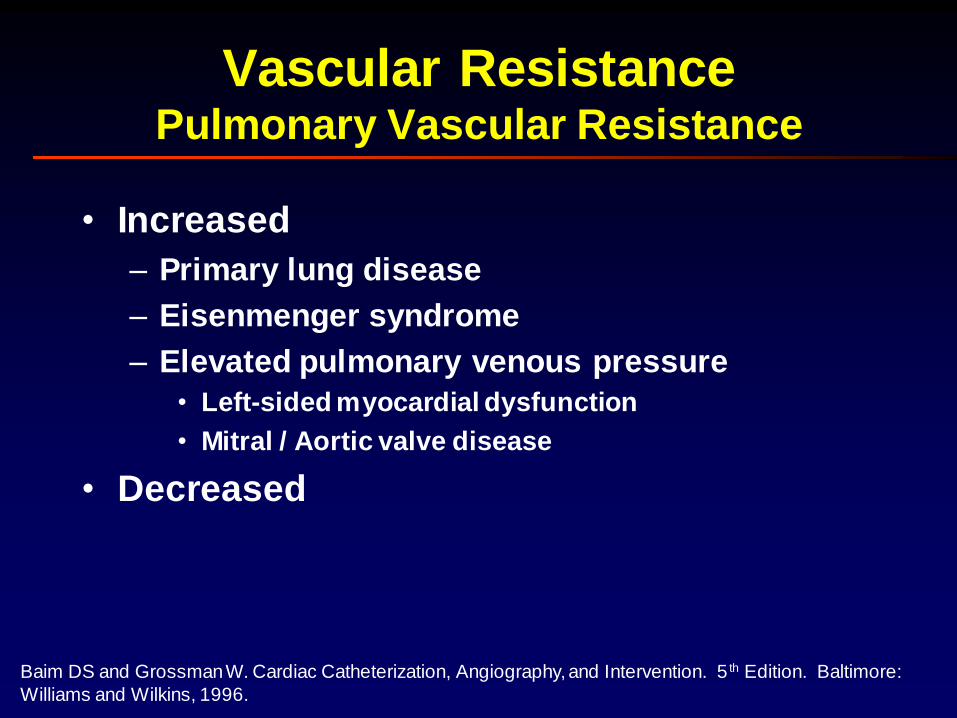
Vascular ResistancePulmonary Vascular Resistance
• Increased
– Primary lung disease
– Eisenmenger syndrome
– Elevated pulmonary venous pressure
• Left-sided myocardial dysfunction
• Mitral / Aortic valve disease
• Decreased
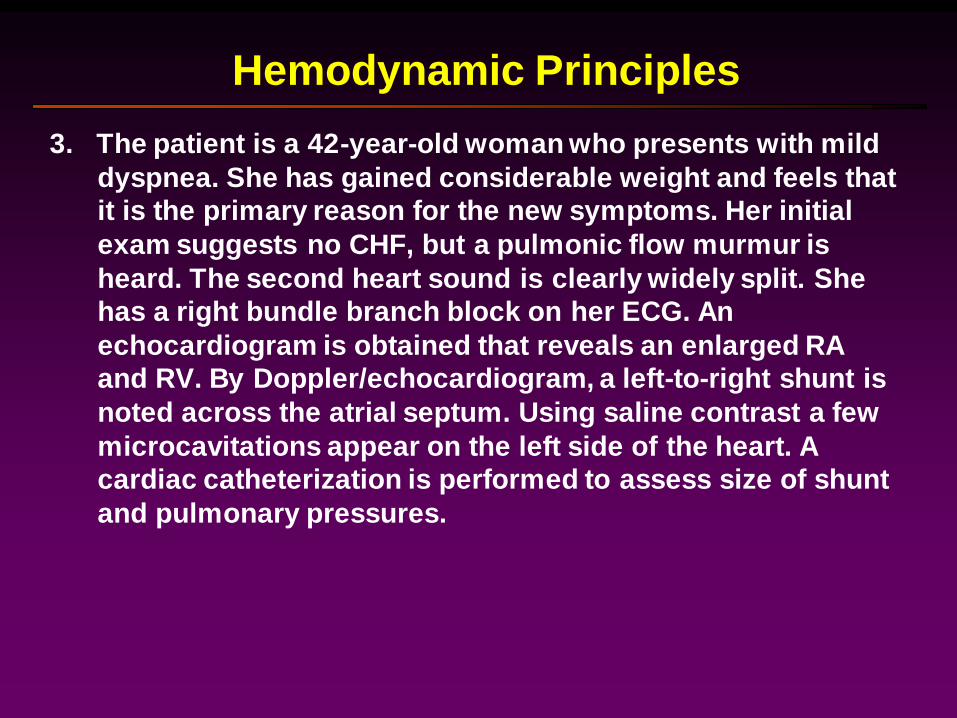
3. The patient is a 42-year-old woman who presents with mild
dyspnea. She has gained considerable weight and feels that
it is the primary reason for the new symptoms. Her initial
exam suggests no CHF, but a pulmonic flow murmur is
heard. The second heart sound is clearly widely split. She
has a right bundle branch block on her ECG. An
echocardiogram is obtained that reveals an enlarged RA
and RV. By Doppler/echocardiogram, a left-to-right shunt is
noted across the atrial septum. Using saline contrast a few
microcavitations appear on the left side of the heart. A
cardiac catheterization is performed to assess size of shunt
and pulmonary pressures.
Hemodynamic Principles
3. The cardiac catheterization revealed:
Pressures (mmHg): RA: mean 7, RV: 45/6, PA: 45/25, mean 33, PCW: mean
10, LV: 120/5, Aortic: 120/80, mean 95.
Saturations (%): SVC: 60, IVC: 65, (Mixed Venous 62), RA: 80, RV: 75, PA:
75, PV: 95, Aortic: 95.
Hemoglobin: 13 mg/dl, Oxygen consumption: 250 ml/min.
LA angiogram: Consistent with secundum atrial septal defect.
Using these data, the pulmonary blood flow was determined to be 7.1
liters/min and the systemic blood flow was found to be 4.3 liters/min.
Select the correct answer based on the findings at cardiac catheterization.
Hemodynamic Principles
A. The QP/QS suggests that no therapy is required at this time.
B. The PVR/SVR ratio suggests the elevated PA pressure is due to
Eisenmenger’s syndrome, and it is too late to consider ASD closure.
C. The PVR/SVR ratio is low enough that she would be a candidate for ASD
closure at this time.
D. There are inadequate data to decide the patient’s operability.
E. Endocarditis prophylaxis is highly recommended to prevent endocarditis
given these hemodynamics.
Hemodynamic PrinciplesAn Overview
• Pressure measurement
• Right and left heart catheterization
• Cardiac output measurement
– Fick-oxygen method• Arterial-venous oxygen difference
– Indicator-dilution methods• Indocyanine green
• Thermodilution
• Vascular resistance
• Shunt detection and measurement
• Gradients and valve stenoses
Baim DS and Grossman W. Cardiac Catheterization, Angiography, and Intervention. 5 th Edition. Baltimore:
Williams and Wilkins, 1996.
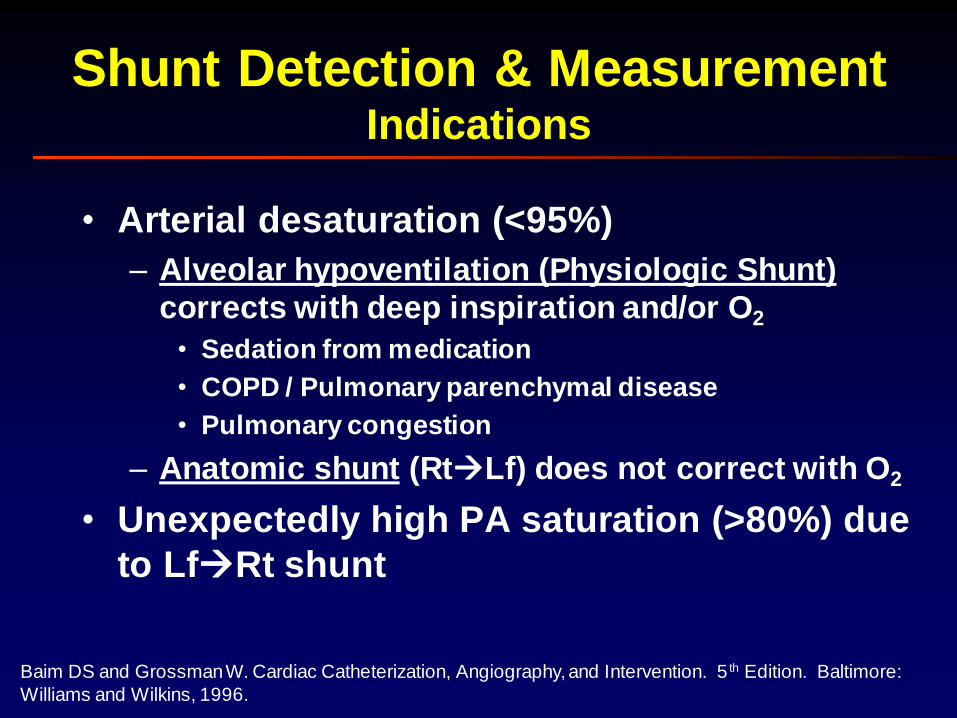
• Arterial desaturation (<95%)
– Alveolar hypoventilation (Physiologic Shunt)
corrects with deep inspiration and/or O2
• Sedation from medication
• COPD / Pulmonary parenchymal disease
• Pulmonary congestion
– Anatomic shunt (RtLf) does not correct with O2
• Unexpectedly high PA saturation (>80%) due
to LfRt shunt
Shunt Detection & MeasurementIndications
Baim DS and Grossman W. Cardiac Catheterization, Angiography, and Intervention. 5th Edition. Baltimore:
Williams and Wilkins, 1996.
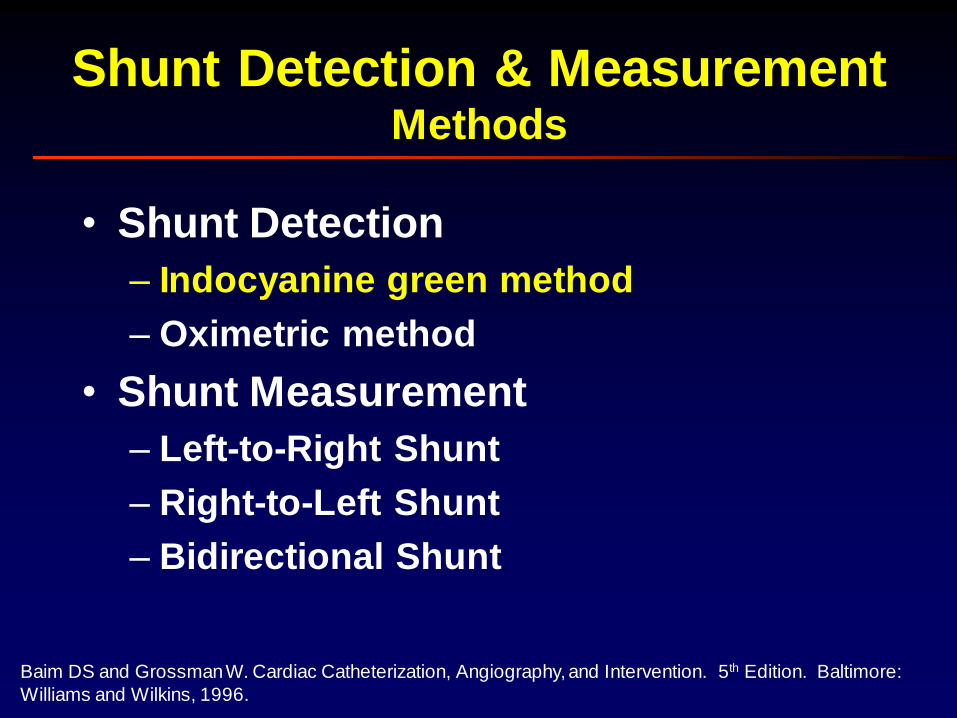
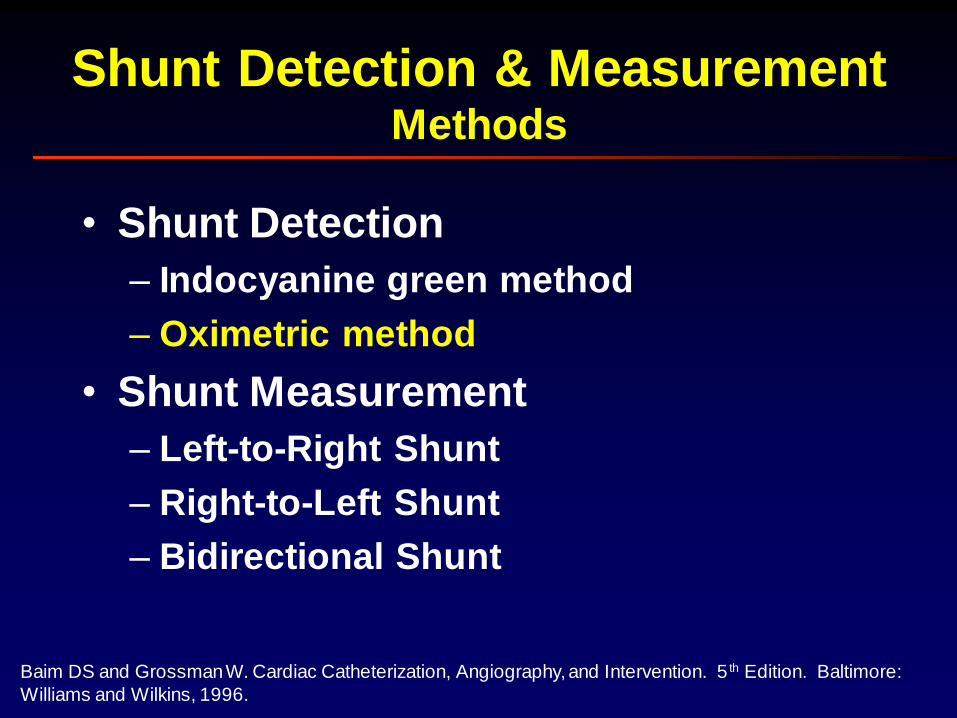
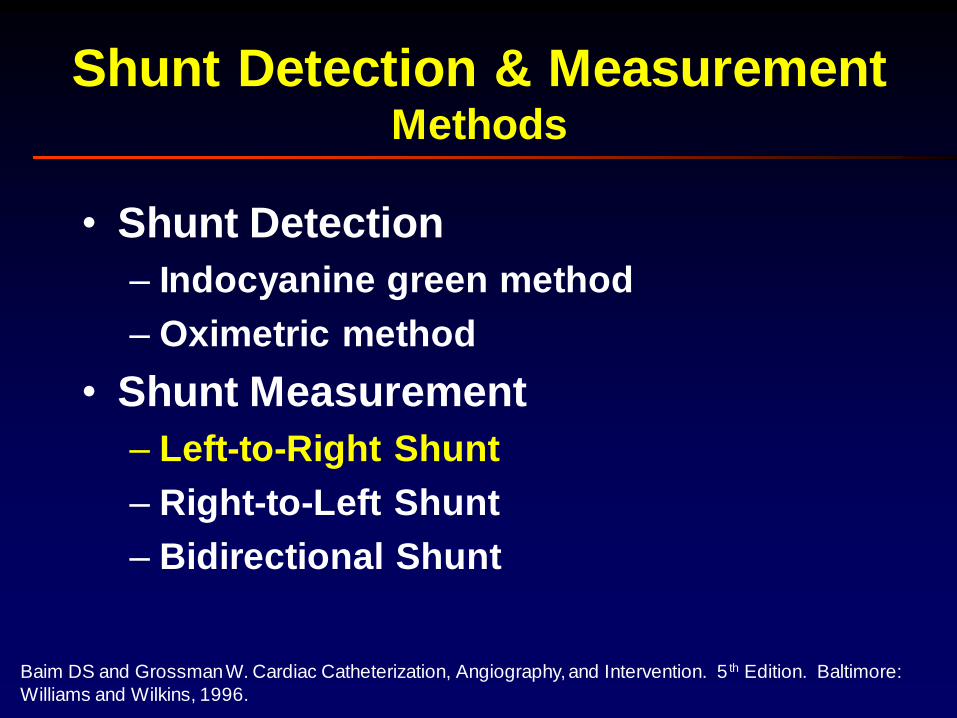
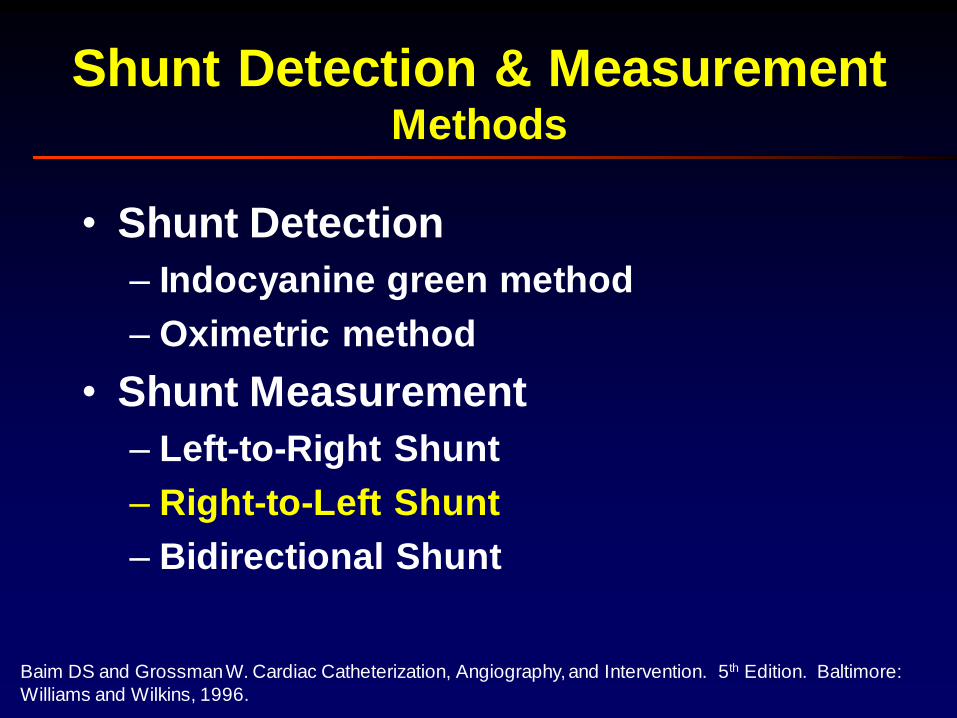
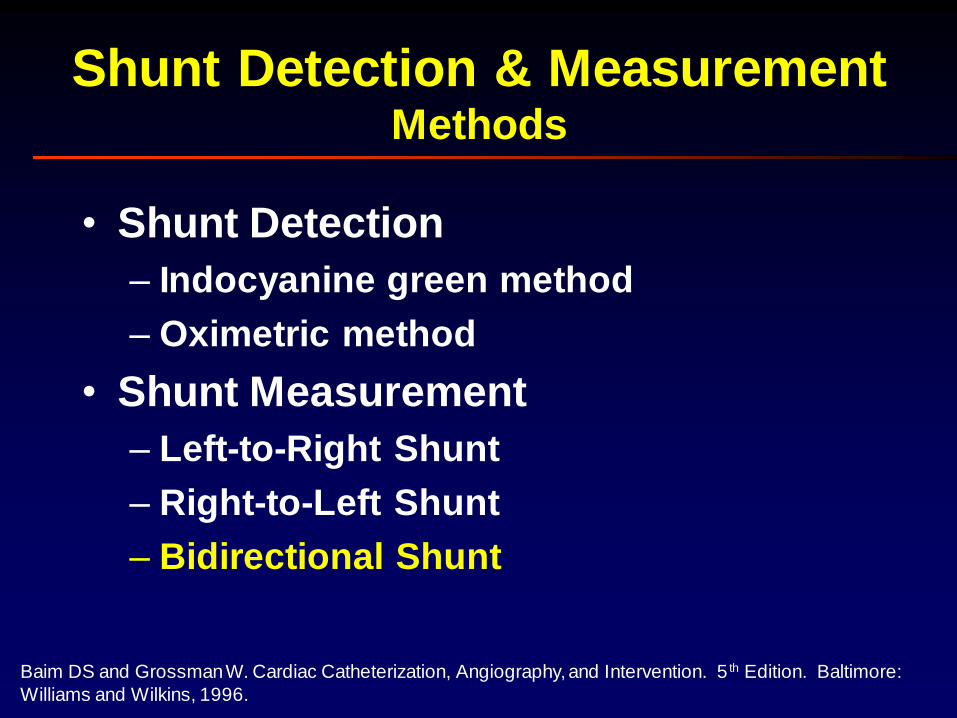
• Shunt Detection
– Indocyanine green method
– Oximetric method
• Shunt Measurement
– Left-to-Right Shunt
– Right-to-Left Shunt
– Bidirectional Shunt
Shunt Detection & MeasurementMethods
Baim DS and Grossman W. Cardiac Catheterization, Angiography, and Intervention. 5 th Edition. Baltimore:
Williams and Wilkins, 1996.
• Shunt Detection
– Indocyanine green method
– Oximetric method
• Shunt Measurement
– Left-to-Right Shunt
– Right-to-Left Shunt
– Bidirectional Shunt
Shunt Detection & MeasurementMethods
Shunt Detection & MeasurementOximetric Methods
Baim DS and Grossman W. Cardiac Catheterization, Angiography, and Intervention. 5 th Edition. Baltimore:
Williams and Wilkins, 1996.
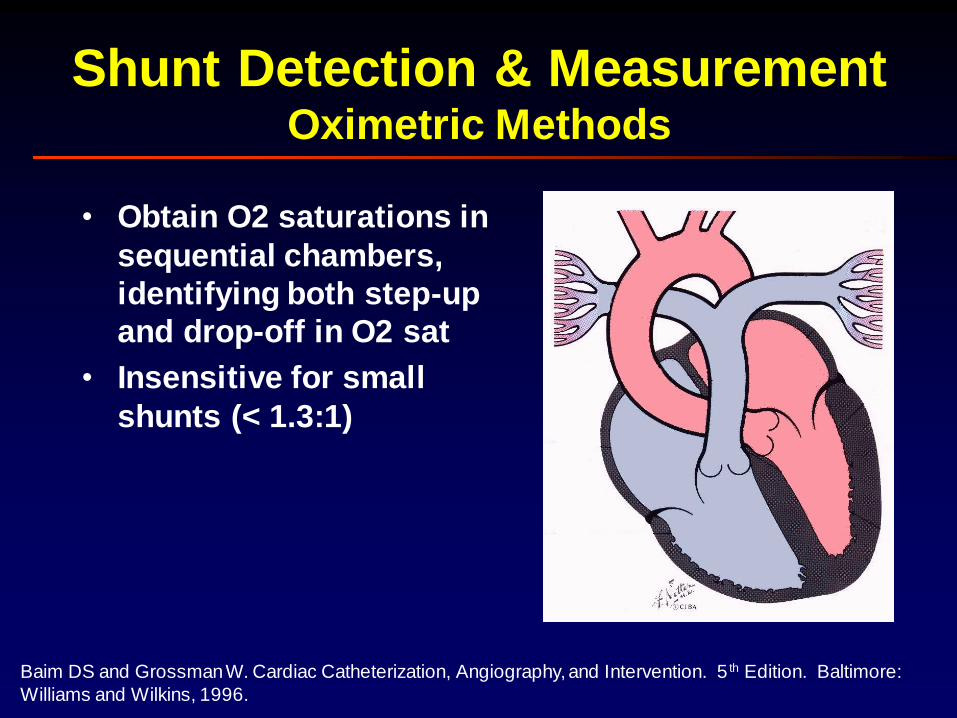
• Obtain O2 saturations in
sequential chambers,
identifying both step-up
and drop-off in O2 sat
• Insensitive for small
shunts (< 1.3:1)
Shunt Detection & MeasurementOximetry Run
Baim DS and Grossman W. Cardiac Catheterization, Angiography, and Intervention. 5 th Edition. Baltimore:
Williams and Wilkins, 1996.
x
x
x
x
x
x
x
x
x
xx
x
x
x
x
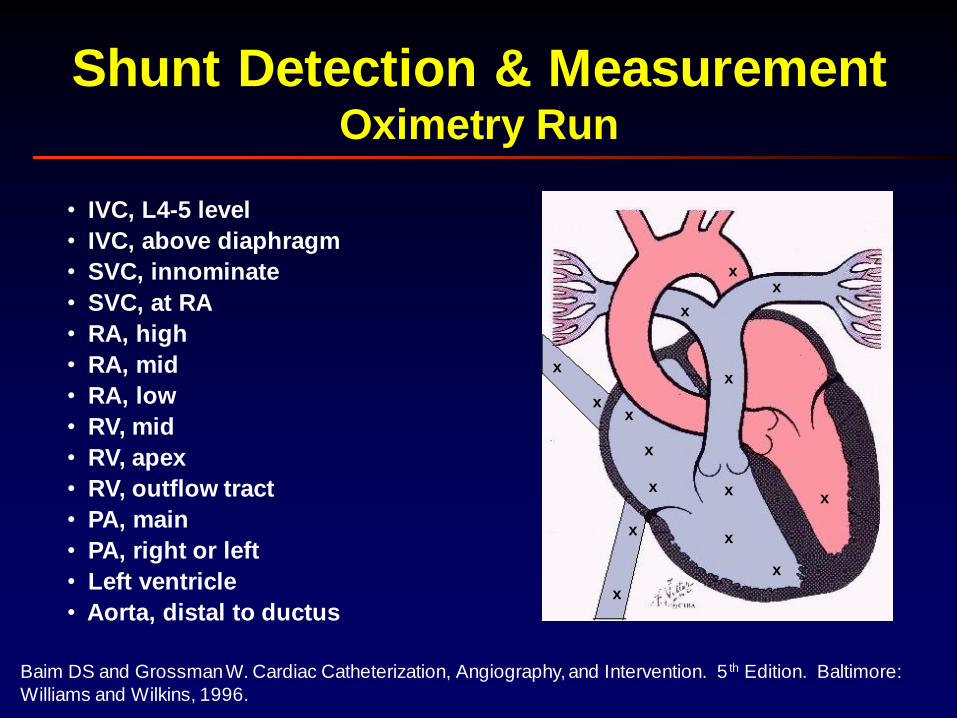
• IVC, L4-5 level
• IVC, above diaphragm
• SVC, innominate
• SVC, at RA
• RA, high
• RA, mid
• RA, low
• RV, mid
• RV, apex
• RV, outflow tract
• PA, main
• PA, right or left
• Left ventricle
• Aorta, distal to ductus
Shunt Detection & MeasurementOximetric Methods
Baim DS and Grossman W. Cardiac Catheterization, Angiography, and Intervention. 5 th Edition. Baltimore:
Williams and Wilkins, 1996.
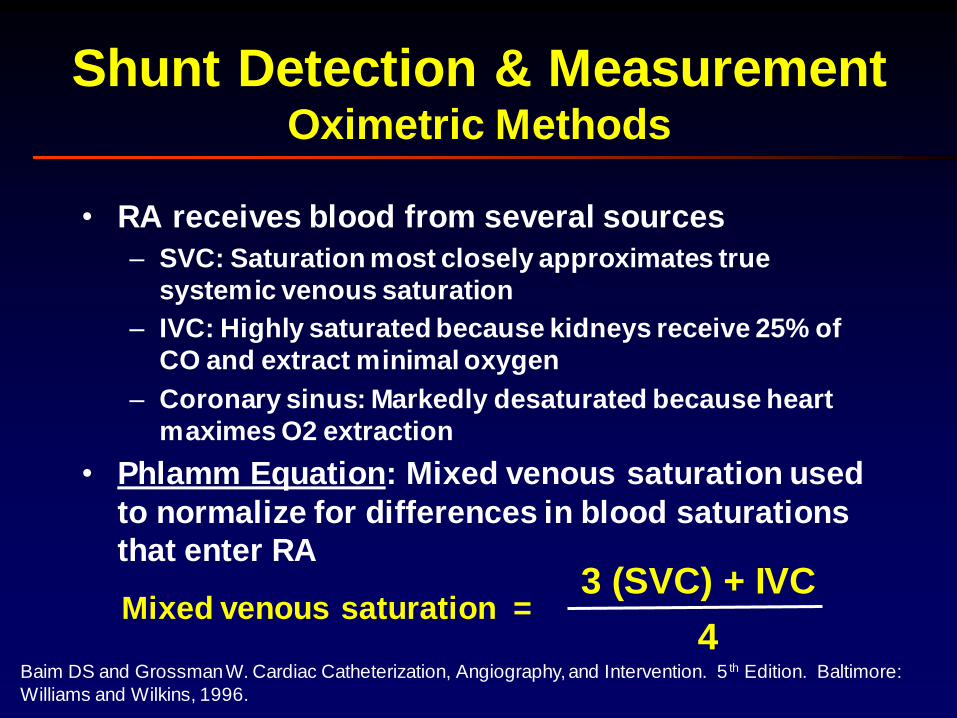
• RA receives blood from several sources
– SVC: Saturation most closely approximates true
systemic venous saturation
– IVC: Highly saturated because kidneys receive 25% of
CO and extract minimal oxygen
– Coronary sinus: Markedly desaturated because heart
maximes O2 extraction
• Phlamm Equation: Mixed venous saturation used
to normalize for differences in blood saturations
that enter RA
Mixed venous saturation =3 (SVC) + IVC
4
Baim DS and Grossman W. Cardiac Catheterization, Angiography, and Intervention. 5 th Edition. Baltimore:
Williams and Wilkins, 1996.
• Shunt Detection
– Indocyanine green method
– Oximetric method
• Shunt Measurement
– Left-to-Right Shunt
– Right-to-Left Shunt
– Bidirectional Shunt
Shunt Detection & MeasurementMethods
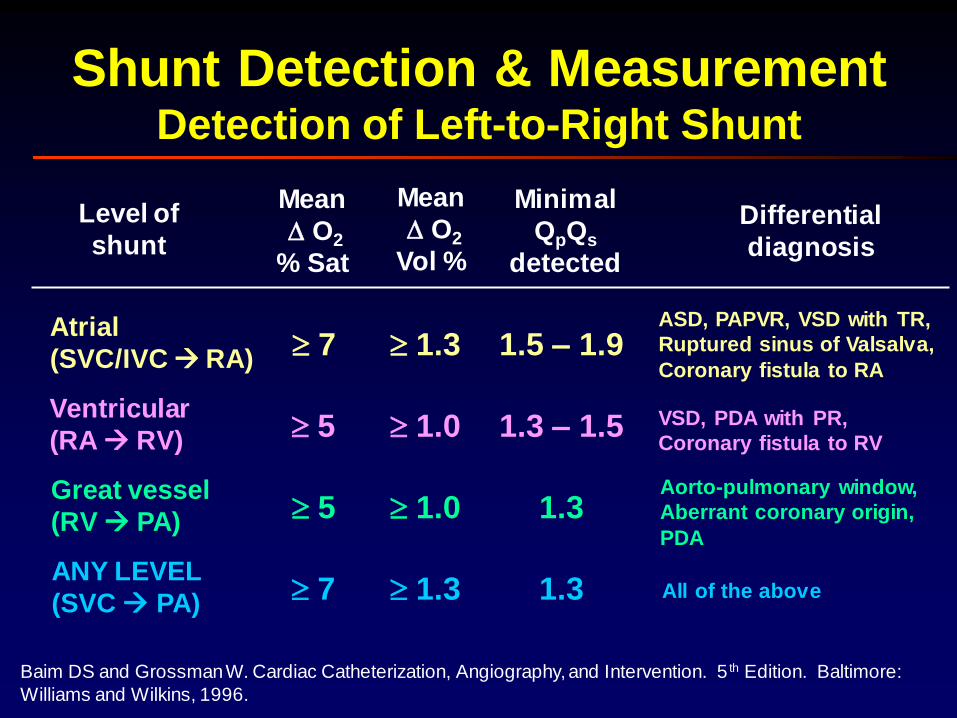
Shunt Detection & MeasurementDetection of Left-to-Right Shunt
Baim DS and Grossman W. Cardiac Catheterization, Angiography, and Intervention. 5 th Edition. Baltimore:
Williams and Wilkins, 1996.
Atrial
(SVC/IVC RA)
Ventricular
(RA RV)
Great vessel
(RV PA)
ANY LEVEL
(SVC PA)
Mean
O2
% Sat
Mean
O2
Vol %
Minimal
QpQs
detected
7
5
5
7
1.3
1.0
1.0
1.3
1.5 – 1.9
1.3 – 1.5
1.3
1.3
Differential
diagnosis
ASD, PAPVR, VSD with TR,
Ruptured sinus of Valsalva,
Coronary fistula to RA
VSD, PDA with PR,
Coronary fistula to RV
Aorto-pulmonary window,
Aberrant coronary origin,
PDA
All of the above
Level of
shunt
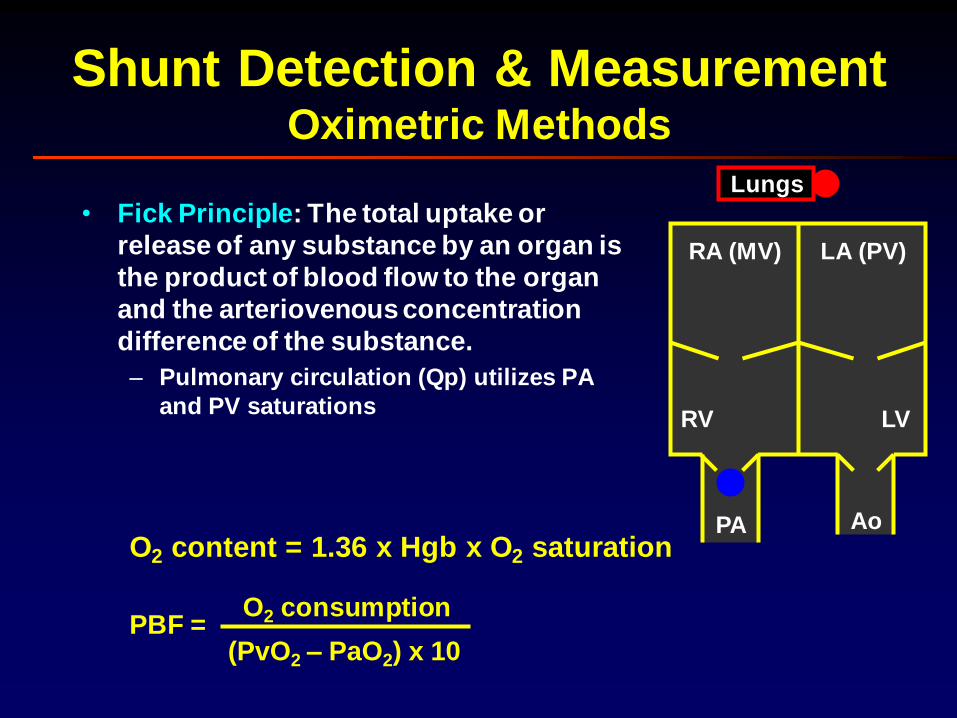
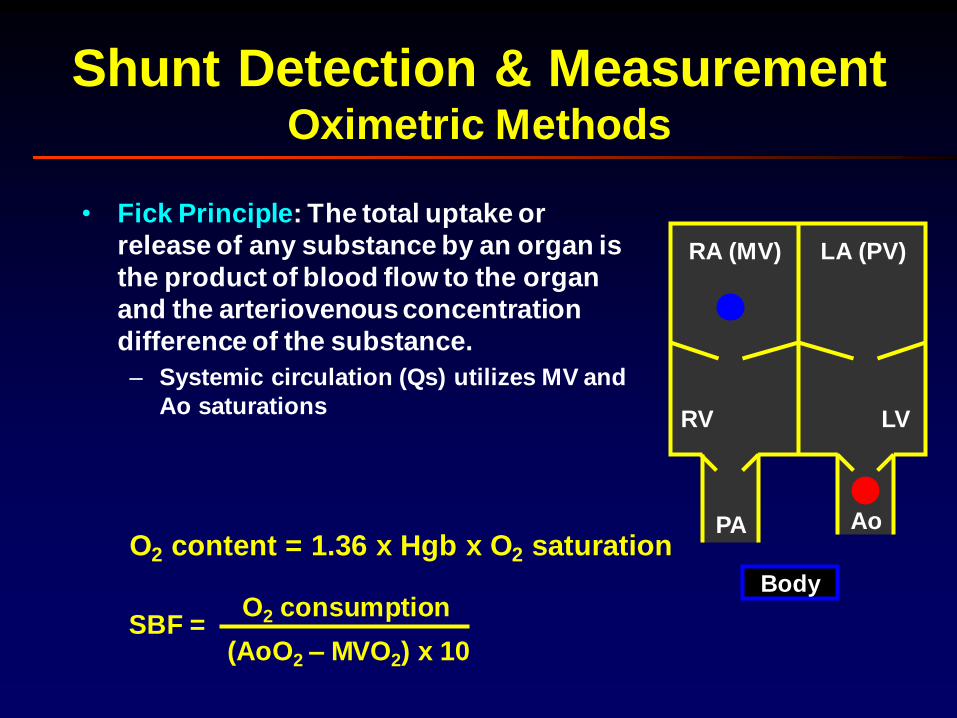
Shunt Detection & MeasurementOximetric Methods
• Fick Principle: The total uptake or
release of any substance by an organ is
the product of blood flow to the organ
and the arteriovenous concentration
difference of the substance.
– Pulmonary circulation (Qp) utilizes PA
and PV saturations
PBF =O2 consumption
(PvO2 – PaO2) x 10
O2 content = 1.36 x Hgb x O2 saturation
RA (MV)
RV
LA (PV)
LV
PA Ao
Lungs
Shunt Detection & MeasurementOximetric Methods
• Fick Principle: The total uptake or
release of any substance by an organ is
the product of blood flow to the organ
and the arteriovenous concentration
difference of the substance.
– Systemic circulation (Qs) utilizes MV and
Ao saturations
O2 content = 1.36 x Hgb x O2 saturation
SBF =O2 consumption
(AoO2 – MVO2) x 10
RA (MV)
RV
LA (PV)
LV
Body
PA Ao
Shunt Detection & MeasurementOximetric Methods
• Fick Principle: The total uptake or
release of any substance by an organ is
the product of blood flow to the organ
and the arteriovenous concentration
difference of the substance.
– Pulmonary circulation (Qp) utilizes PA
and PV saturations
– Systemic circulation (Qs) utilizes MV and
Ao saturations
PBF =O2 consumption
(PvO2 – PaO2) x 10
O2 content = 1.36 x Hgb x O2 saturation
RA (MV)
RV
LA (PV)
LV
PA Ao
SBF =O2 consumption
(AoO2 – MVO2) x 10
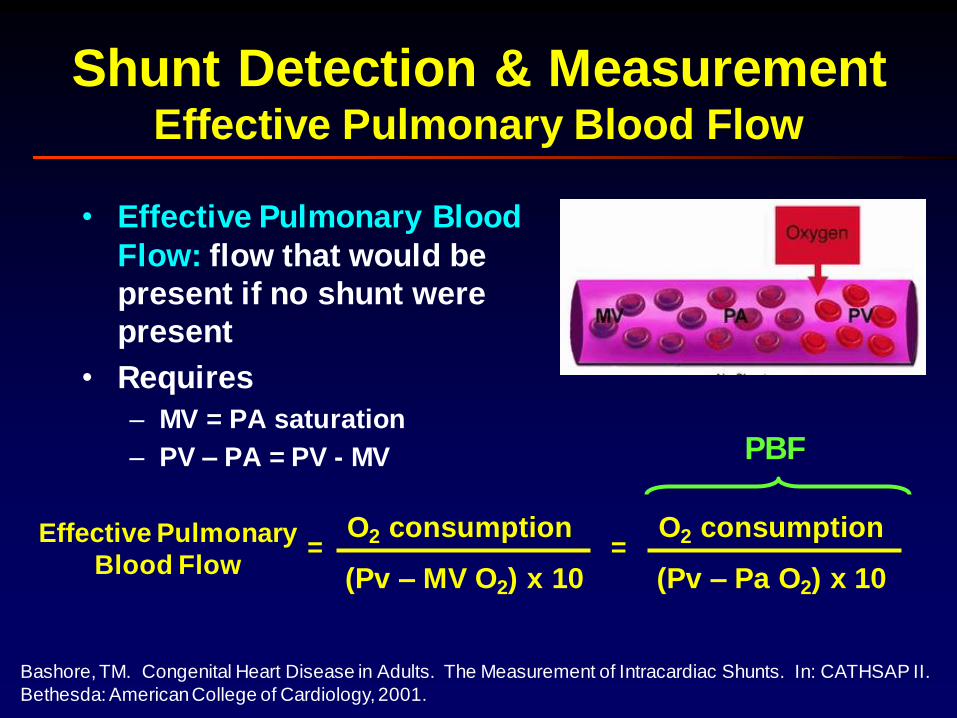
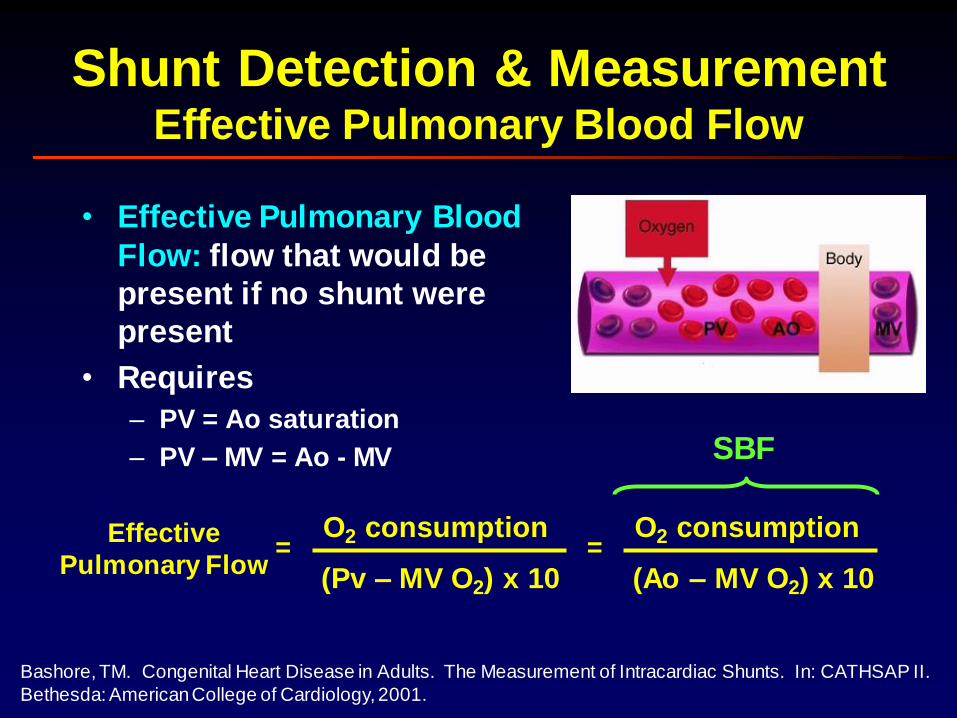
Shunt Detection & MeasurementEffective Pulmonary Blood Flow
• Effective Pulmonary Blood
Flow: flow that would be
present if no shunt were
present
• Requires
– MV = PA saturation
– PV – PA = PV - MV
Effective Pulmonary
Blood Flow
O2 consumption
(Pv – MV O2) x 10=
O2 consumption
(Pv – Pa O2) x 10=
PBF
Bashore, TM. Congenital Heart Disease in Adults. The Measurement of Intracardiac Shunts. In: CATHSAP II.
Bethesda: American College of Cardiology, 2001.
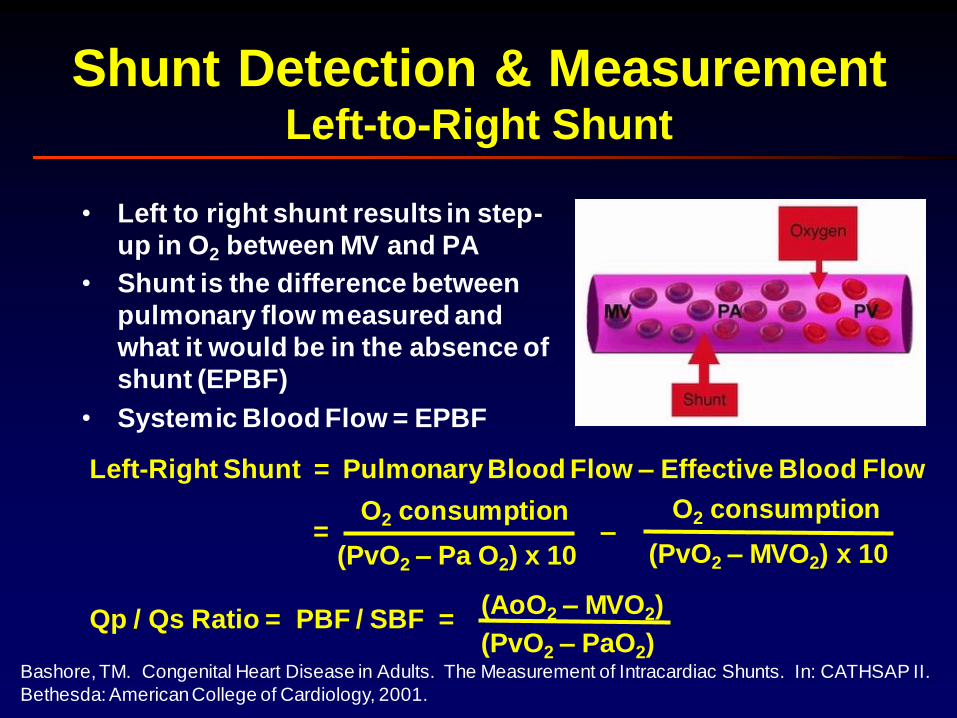
Shunt Detection & MeasurementLeft-to-Right Shunt
• Left to right shunt results in step-
up in O2 between MV and PA
• Shunt is the difference between
pulmonary flow measured and
what it would be in the absence of
shunt (EPBF)
• Systemic Blood Flow = EPBF
Left-Right Shunt = Pulmonary Blood Flow – Effective Blood Flow
O2 consumption
(PvO2 – Pa O2) x 10=
O2 consumption
(PvO2 – MVO2) x 10–
Qp / Qs Ratio = PBF / SBF =(PvO2 – PaO2)
(AoO2 – MVO2)
Bashore, TM. Congenital Heart Disease in Adults. The Measurement of Intracardiac Shunts. In: CATHSAP II.
Bethesda: American College of Cardiology, 2001.
Shunt Detection & MeasurementLeft-to-Right Shunt
Baim DS and Grossman W. Cardiac Catheterization, Angiography, and Intervention. 5 th Edition. Baltimore:
Williams and Wilkins, 1996.
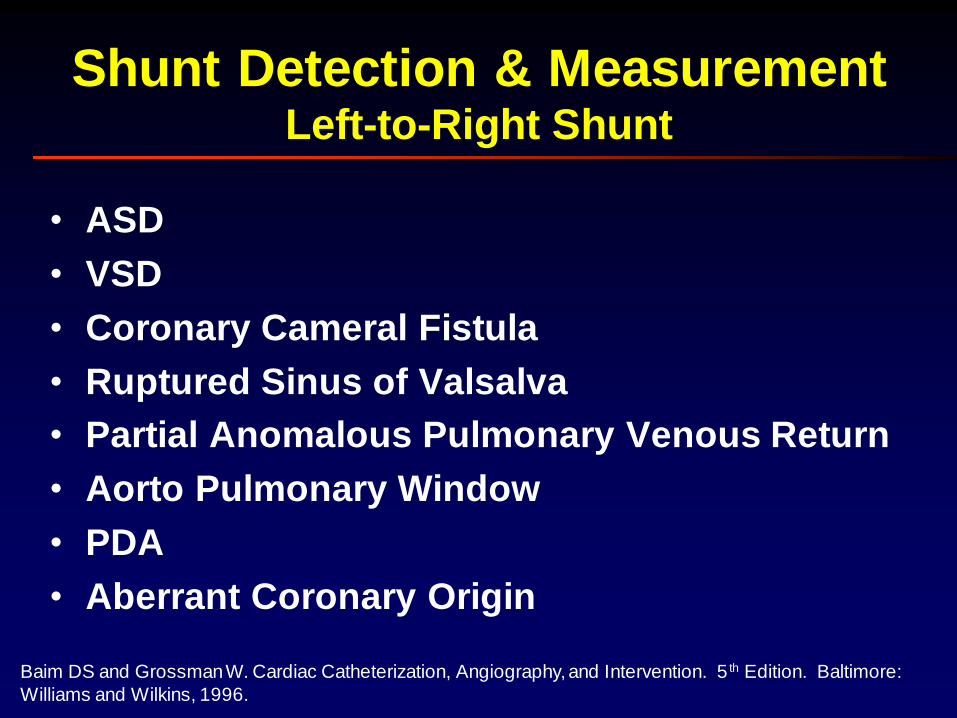
• ASD
• VSD
• Coronary Cameral Fistula
• Ruptured Sinus of Valsalva
• Partial Anomalous Pulmonary Venous Return
• Aorto Pulmonary Window
• PDA
• Aberrant Coronary Origin
Baim DS and Grossman W. Cardiac Catheterization, Angiography, and Intervention. 5th Edition. Baltimore:
Williams and Wilkins, 1996.
• Shunt Detection
– Indocyanine green method
– Oximetric method
• Shunt Measurement
– Left-to-Right Shunt
– Right-to-Left Shunt
– Bidirectional Shunt
Shunt Detection & MeasurementMethods
Shunt Detection & MeasurementEffective Pulmonary Blood Flow
• Effective Pulmonary Blood
Flow: flow that would be
present if no shunt were
present
• Requires
– PV = Ao saturation
– PV – MV = Ao - MV
Effective
Pulmonary Flow
O2 consumption
(Pv – MV O2) x 10=
O2 consumption
(Ao – MV O2) x 10=
SBF
Bashore, TM. Congenital Heart Disease in Adults. The Measurement of Intracardiac Shunts. In: CATHSAP II.
Bethesda: American College of Cardiology, 2001.
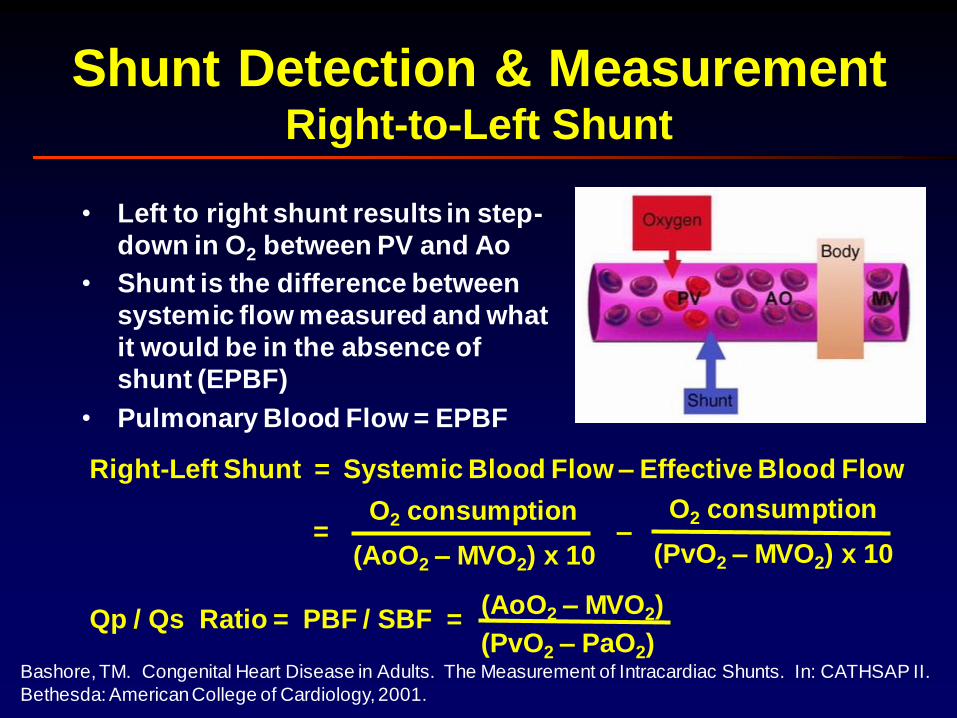
Shunt Detection & MeasurementRight-to-Left Shunt
• Left to right shunt results in step-
down in O2 between PV and Ao
• Shunt is the difference between
systemic flow measured and what
it would be in the absence of
shunt (EPBF)
• Pulmonary Blood Flow = EPBF
Right-Left Shunt = Systemic Blood Flow – Effective Blood Flow
O2 consumption
(AoO2 – MVO2) x 10=
O2 consumption
(PvO2 – MVO2) x 10–
Qp / Qs Ratio = PBF / SBF =(PvO2 – PaO2)
(AoO2 – MVO2)
Bashore, TM. Congenital Heart Disease in Adults. The Measurement of Intracardiac Shunts. In: CATHSAP II.
Bethesda: American College of Cardiology, 2001.
Shunt Detection & MeasurementRight-to-Left Shunt
Baim DS and Grossman W. Cardiac Catheterization, Angiography, and Intervention. 5th Edition. Baltimore:
Williams and Wilkins, 1996.
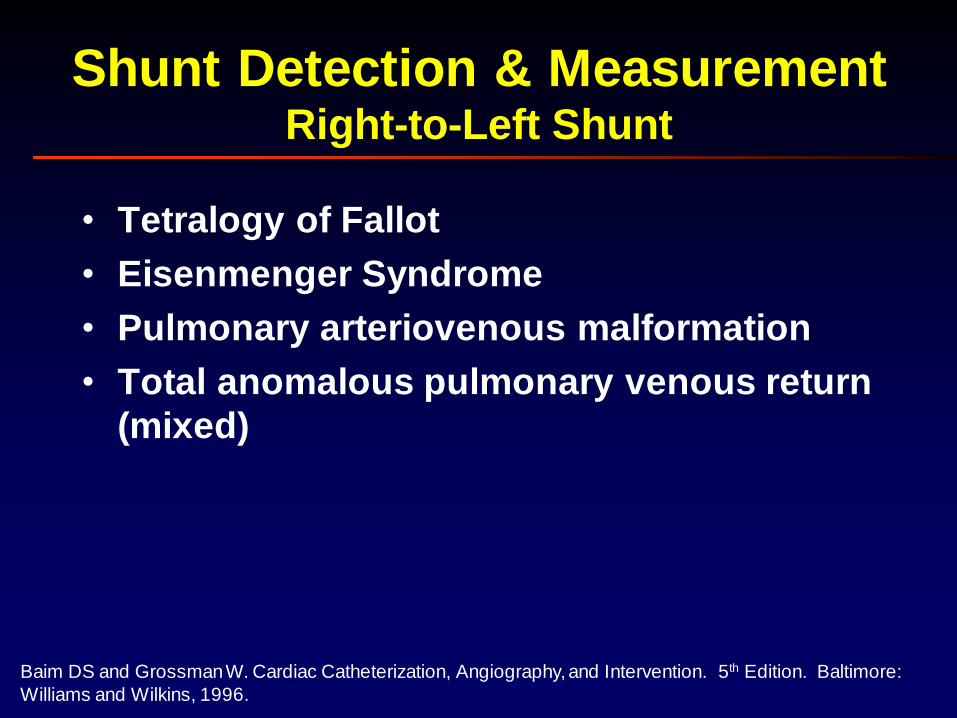
• Tetralogy of Fallot
• Eisenmenger Syndrome
• Pulmonary arteriovenous malformation
• Total anomalous pulmonary venous return
(mixed)
Baim DS and Grossman W. Cardiac Catheterization, Angiography, and Intervention. 5 th Edition. Baltimore:
Williams and Wilkins, 1996.
• Shunt Detection
– Indocyanine green method
– Oximetric method
• Shunt Measurement
– Left-to-Right Shunt
– Right-to-Left Shunt
– Bidirectional Shunt
Shunt Detection & MeasurementMethods
Baim DS and Grossman W. Cardiac Catheterization, Angiography, and Intervention. 5 th Edition. Baltimore:
Williams and Wilkins, 1996.
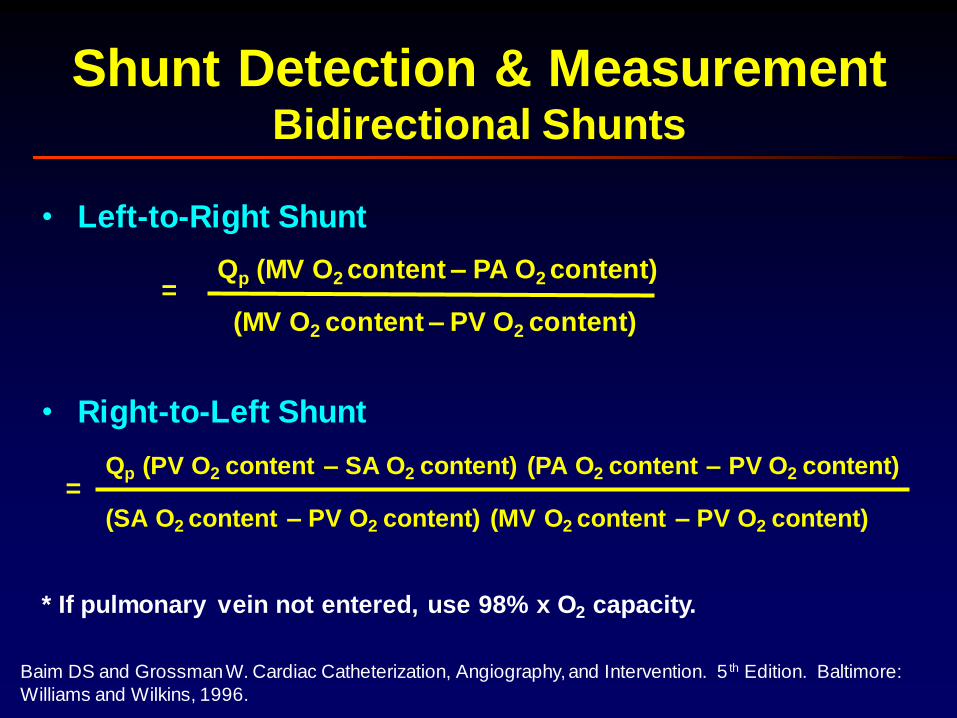
Shunt Detection & MeasurementBidirectional Shunts
• Left-to-Right Shunt
Qp (MV O2 content – PA O2 content)=
(MV O2 content – PV O2 content)
• Right-to-Left Shunt
Qp (PV O2 content – SA O2 content) (PA O2 content – PV O2 content)=
(SA O2 content – PV O2 content) (MV O2 content – PV O2 content)
* If pulmonary vein not entered, use 98% x O2 capacity.
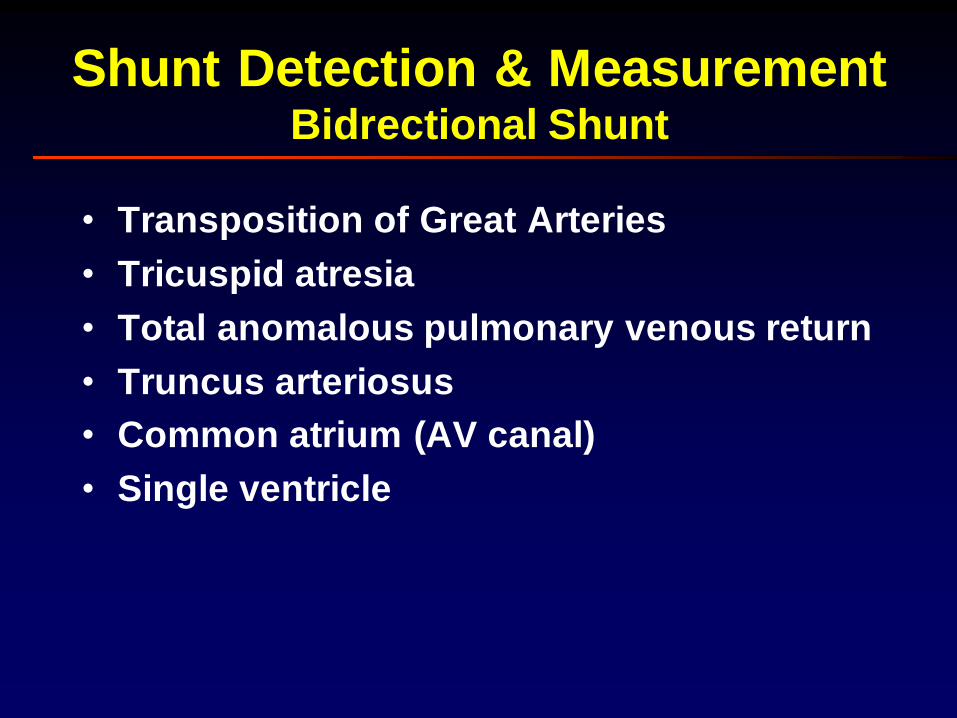
Shunt Detection & MeasurementBidrectional Shunt
• Transposition of Great Arteries
• Tricuspid atresia
• Total anomalous pulmonary venous return
• Truncus arteriosus
• Common atrium (AV canal)
• Single ventricle
Baim DS and Grossman W. Cardiac Catheterization, Angiography, and Intervention. 5 th Edition. Baltimore:
Williams and Wilkins, 1996.
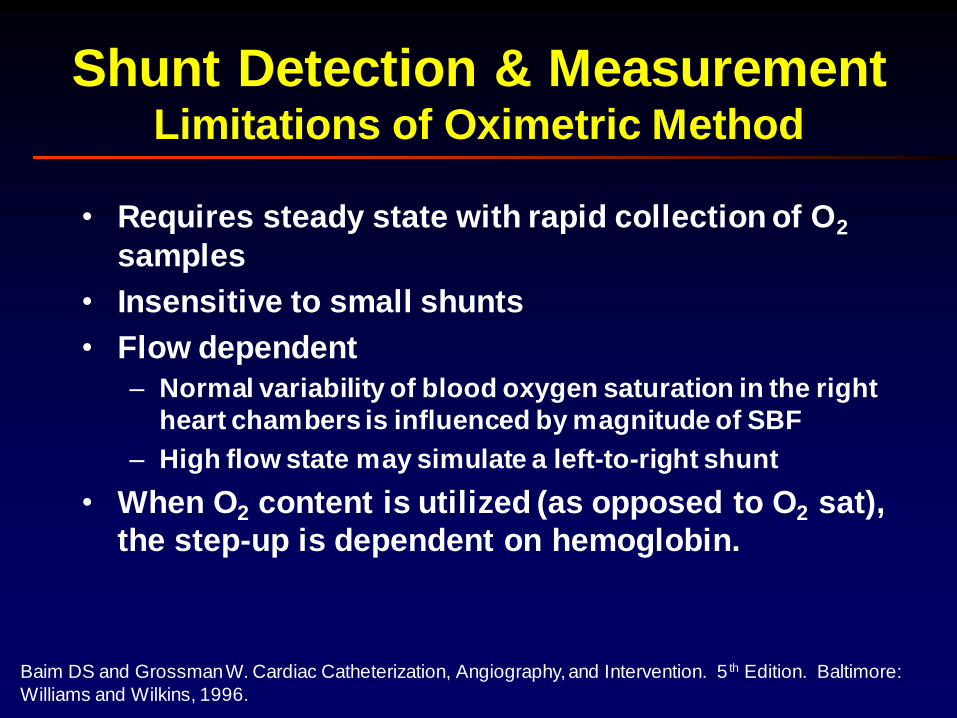
Shunt Detection & MeasurementLimitations of Oximetric Method
• Requires steady state with rapid collection of O2
samples
• Insensitive to small shunts
• Flow dependent
– Normal variability of blood oxygen saturation in the right
heart chambers is influenced by magnitude of SBF
– High flow state may simulate a left-to-right shunt
• When O2 content is utilized (as opposed to O2 sat),
the step-up is dependent on hemoglobin.
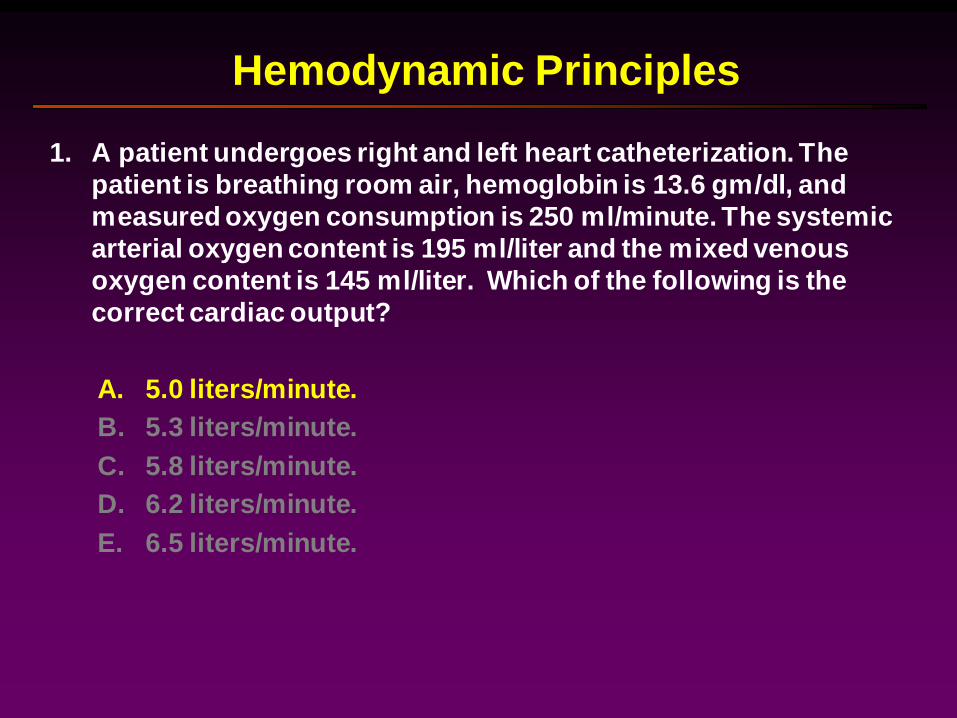
1. A patient undergoes right and left heart catheterization. The
patient is breathing room air, hemoglobin is 13.6 gm/dl, and
measured oxygen consumption is 250 ml/minute. The systemic
arterial oxygen content is 195 ml/liter and the mixed venous
oxygen content is 145 ml/liter. Which of the following is the
correct cardiac output?
Hemodynamic Principles
A. 5.0 liters/minute.
B. 5.3 liters/minute.
C. 5.8 liters/minute.
D. 6.2 liters/minute.
E. 6.5 liters/minute.
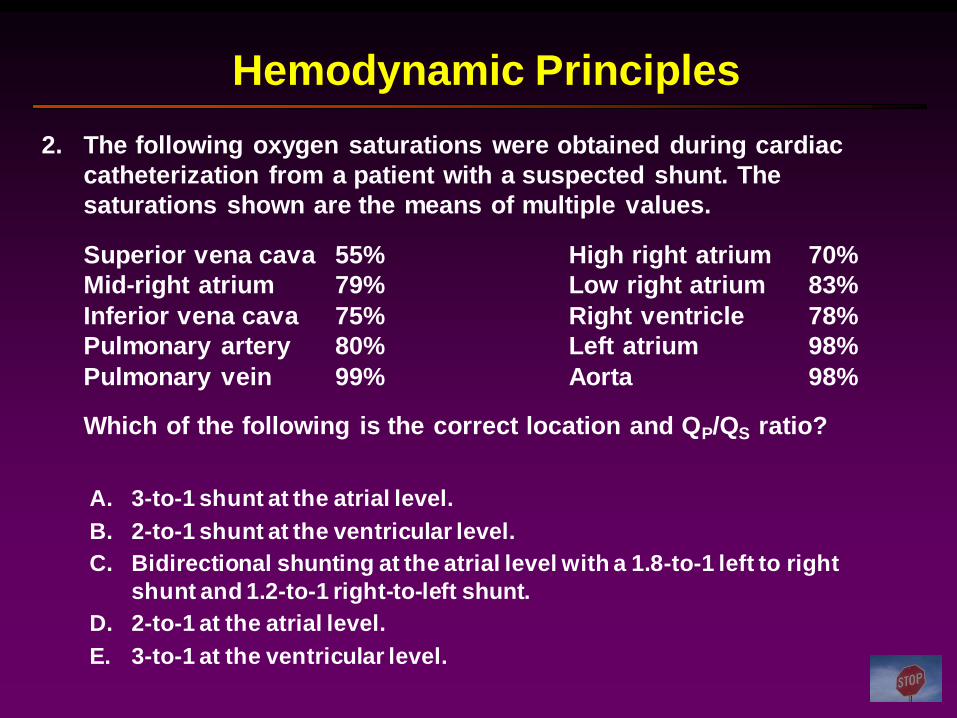
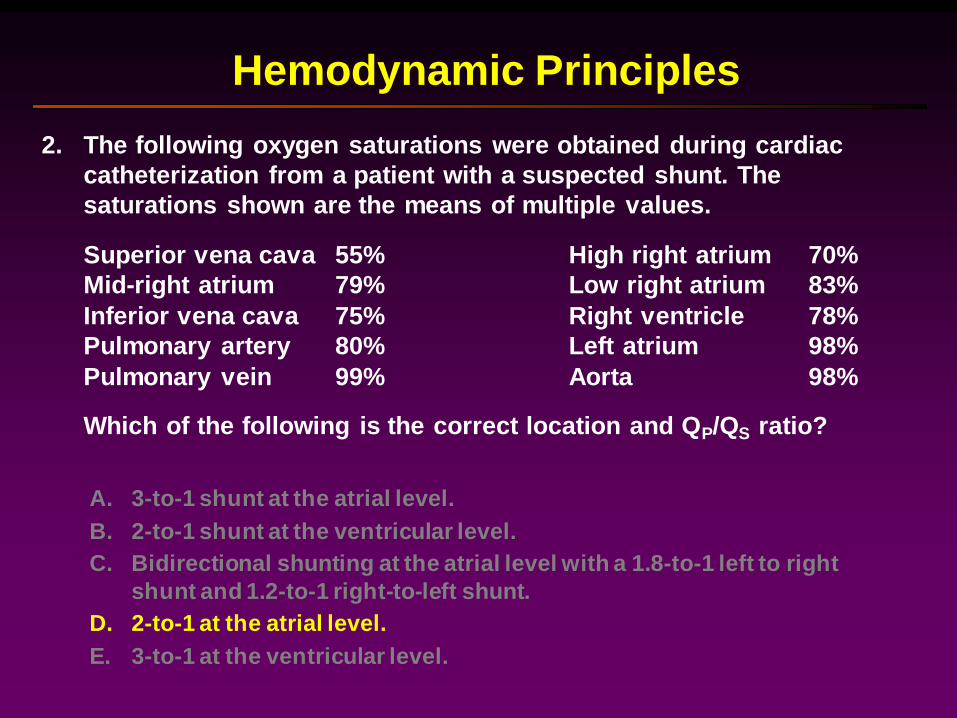
2. The following oxygen saturations were obtained during cardiac
catheterization from a patient with a suspected shunt. The
saturations shown are the means of multiple values.
Superior vena cava 55% High right atrium 70%
Mid-right atrium 79% Low right atrium 83%
Inferior vena cava 75% Right ventricle 78%
Pulmonary artery 80% Left atrium 98%
Pulmonary vein 99% Aorta 98%
Which of the following is the correct location and QP/QS ratio?
Hemodynamic Principles
A. 3-to-1 shunt at the atrial level.
B. 2-to-1 shunt at the ventricular level.
C. Bidirectional shunting at the atrial level with a 1.8-to-1 left to right
shunt and 1.2-to-1 right-to-left shunt.
D. 2-to-1 at the atrial level.
E. 3-to-1 at the ventricular level.
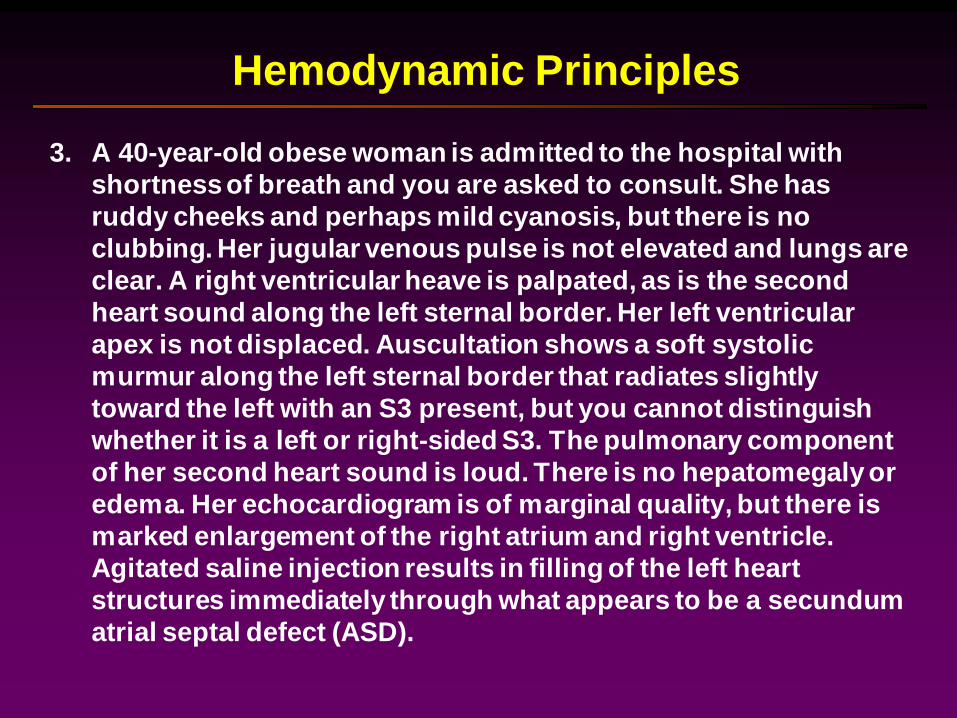
3. A 40-year-old obese woman is admitted to the hospital with
shortness of breath and you are asked to consult. She has
ruddy cheeks and perhaps mild cyanosis, but there is no
clubbing. Her jugular venous pulse is not elevated and lungs are
clear. A right ventricular heave is palpated, as is the second
heart sound along the left sternal border. Her left ventricular
apex is not displaced. Auscultation shows a soft systolic
murmur along the left sternal border that radiates slightly
toward the left with an S3 present, but you cannot distinguish
whether it is a left or right-sided S3. The pulmonary component
of her second heart sound is loud. There is no hepatomegaly or
edema. Her echocardiogram is of marginal quality, but there is
marked enlargement of the right atrium and right ventricle.
Agitated saline injection results in filling of the left heart
structures immediately through what appears to be a secundum
atrial septal defect (ASD).
Hemodynamic Principles
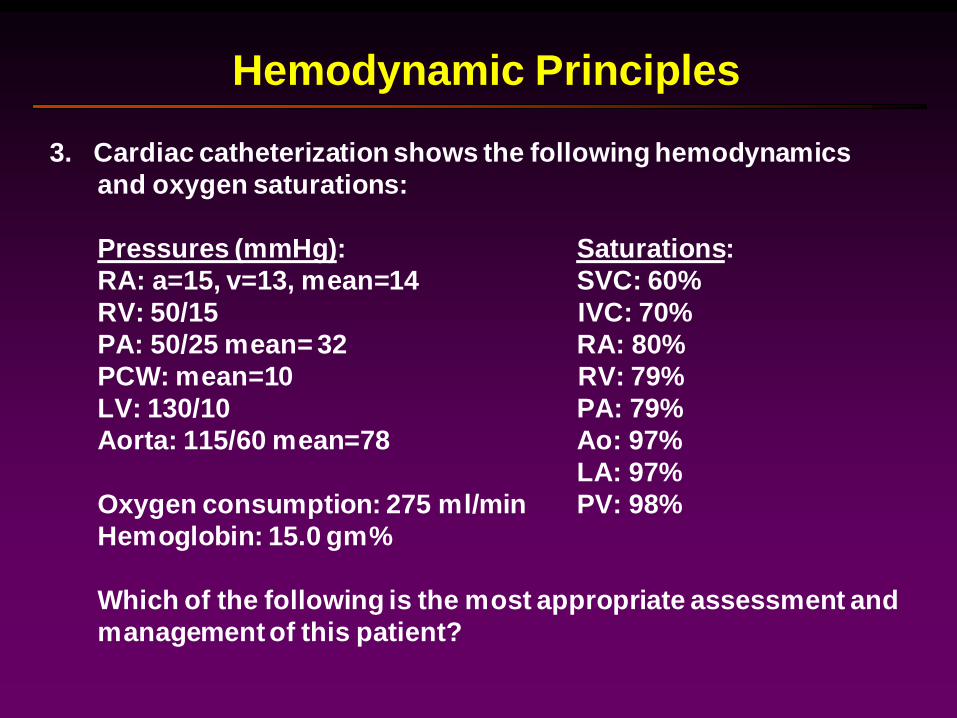
3. Cardiac catheterization shows the following hemodynamics
and oxygen saturations:
Pressures (mmHg): Saturations:
RA: a=15, v=13, mean=14 SVC: 60%
RV: 50/15 IVC: 70%
PA: 50/25 mean= 32 RA: 80%
PCW: mean=10 RV: 79%
LV: 130/10 PA: 79%
Aorta: 115/60 mean=78 Ao: 97%
LA: 97%
Oxygen consumption: 275 ml/min PV: 98%
Hemoglobin: 15.0 gm%
Which of the following is the most appropriate assessment and
management of this patient?
Hemodynamic Principles
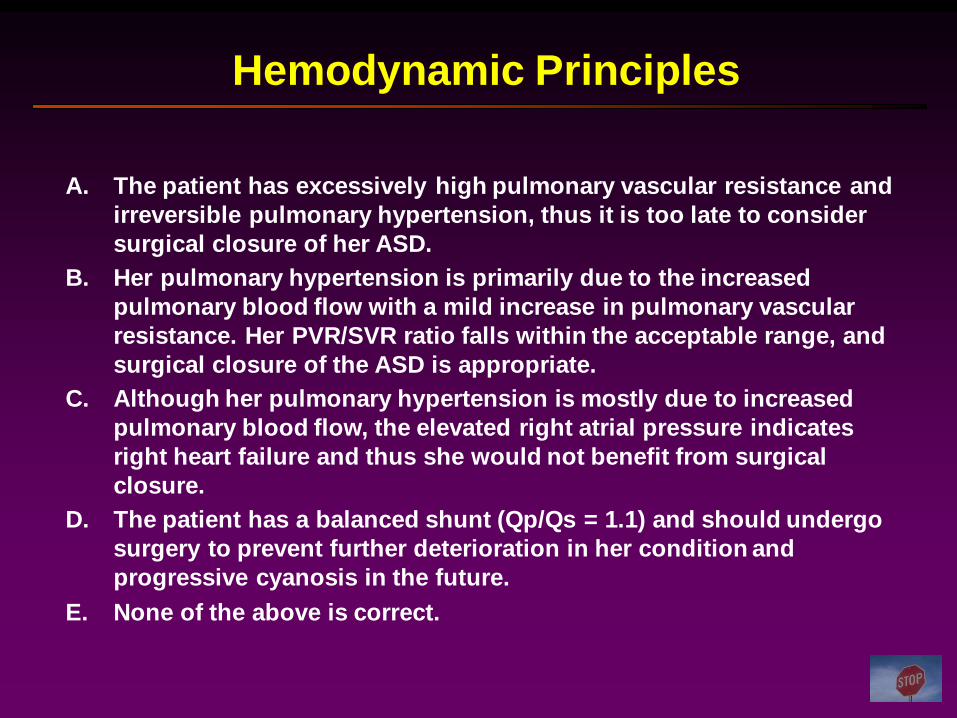
Hemodynamic Principles
A. The patient has excessively high pulmonary vascular resistance and
irreversible pulmonary hypertension, thus it is too late to consider
surgical closure of her ASD.
B. Her pulmonary hypertension is primarily due to the increased
pulmonary blood flow with a mild increase in pulmonary vascular
resistance. Her PVR/SVR ratio falls within the acceptable range, and
surgical closure of the ASD is appropriate.
C. Although her pulmonary hypertension is mostly due to increased
pulmonary blood flow, the elevated right atrial pressure indicates
right heart failure and thus she would not benefit from surgical
closure.
D. The patient has a balanced shunt (Qp/Qs = 1.1) and should undergo
surgery to prevent further deterioration in her condition and
progressive cyanosis in the future.
E. None of the above is correct.
Calculate PVR / SVR
> 0.5 Risk of surgery increased
> 0.7 No benefit from surgery
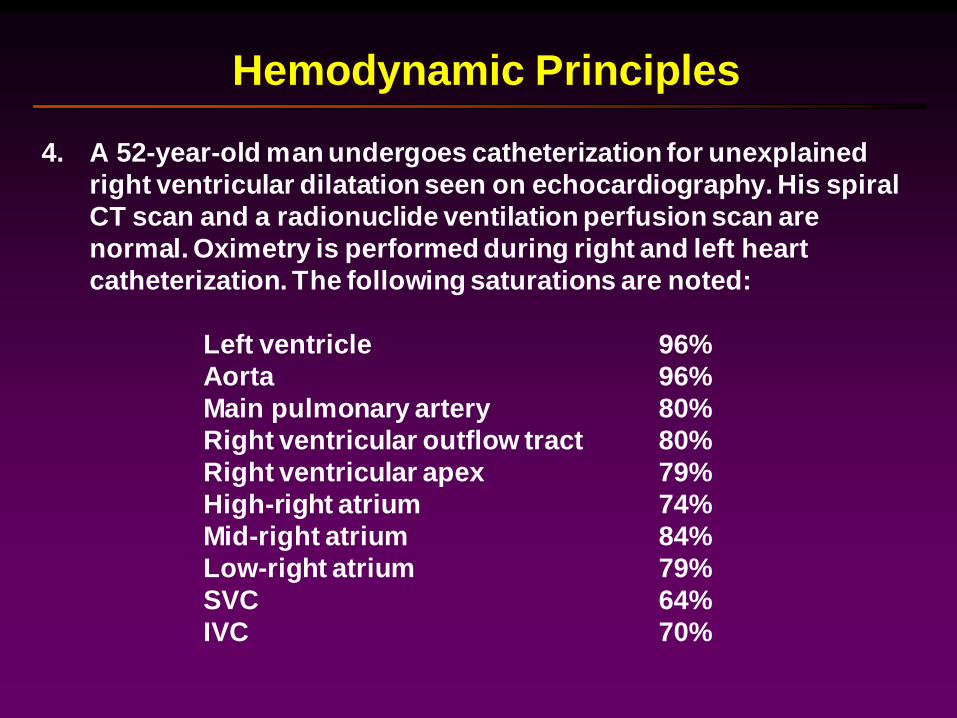
4. A 52-year-old man undergoes catheterization for unexplained
right ventricular dilatation seen on echocardiography. His spiral
CT scan and a radionuclide ventilation perfusion scan are
normal. Oximetry is performed during right and left heart
catheterization. The following saturations are noted:
Left ventricle 96%
Aorta 96%
Main pulmonary artery 80%
Right ventricular outflow tract 80%
Right ventricular apex 79%
High-right atrium 74%
Mid-right atrium 84%
Low-right atrium 79%
SVC 64%
IVC 70%
Hemodynamic Principles
Hemodynamic Principles
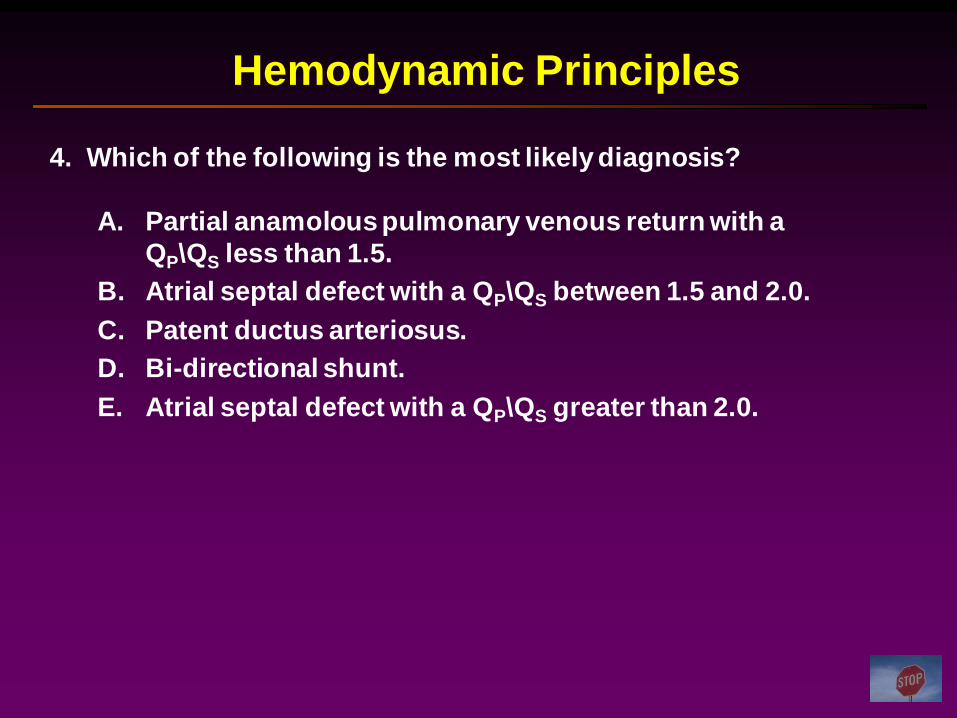
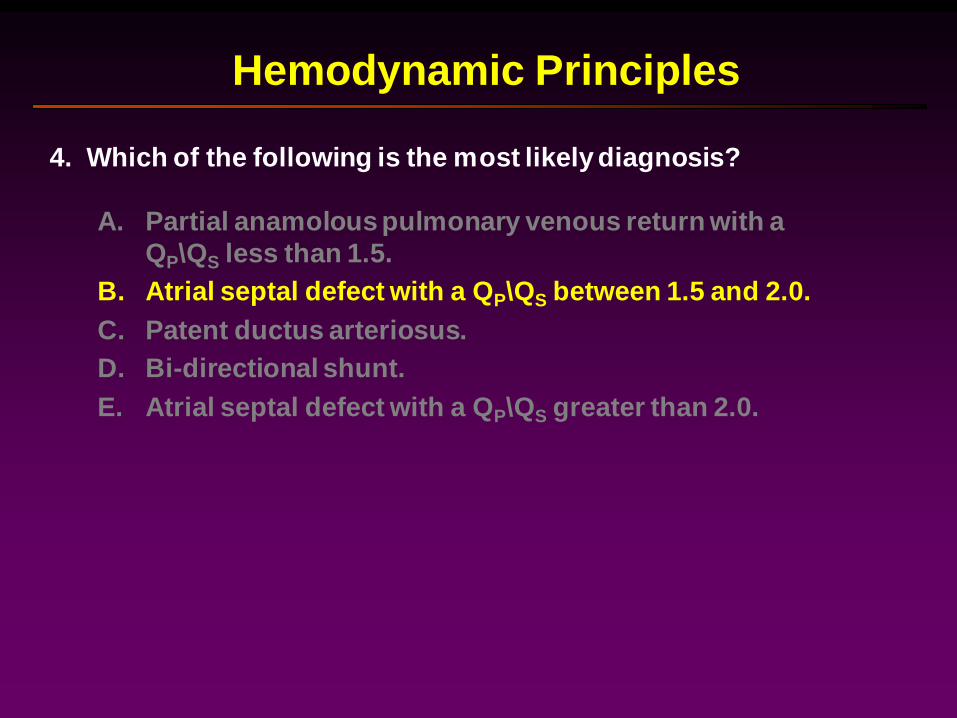
A. Partial anamolous pulmonary venous return with a
QP\QS less than 1.5.
B. Atrial septal defect with a QP\QS between 1.5 and 2.0.
C. Patent ductus arteriosus.
D. Bi-directional shunt.
E. Atrial septal defect with a QP\QS greater than 2.0.
4. Which of the following is the most likely diagnosis?
Hemodynamic Principles
A. Partial anamolous pulmonary venous return with a
QP\QS less than 1.5.
B. Atrial septal defect with a QP\QS between 1.5 and 2.0.
C. Patent ductus arteriosus.
D. Bi-directional shunt.
E. Atrial septal defect with a QP\QS greater than 2.0.
4. Which of the following is the most likely diagnosis?
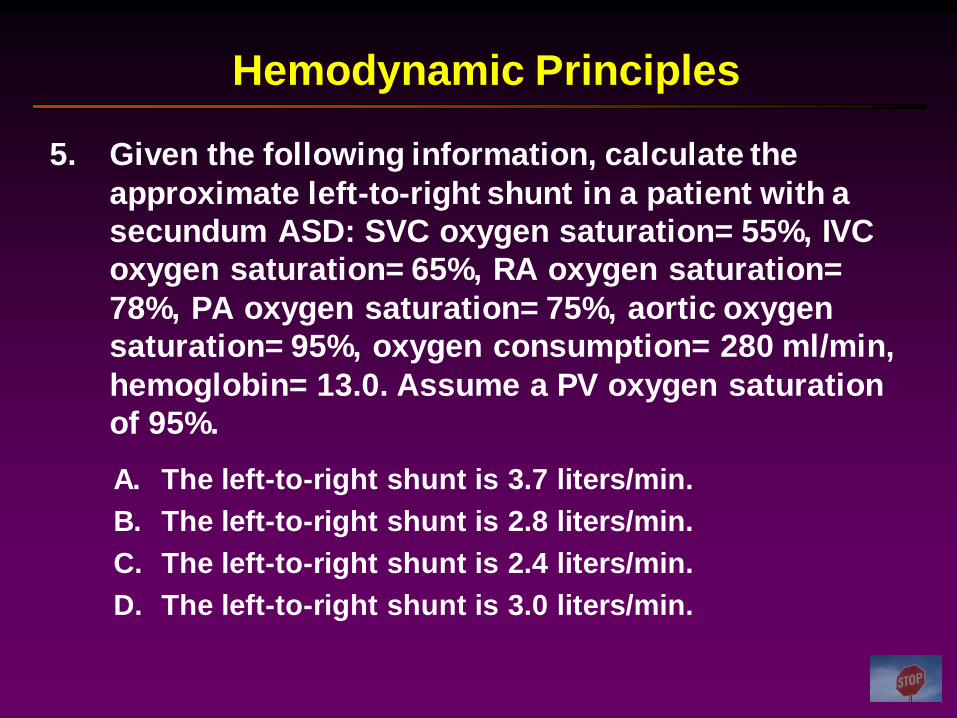
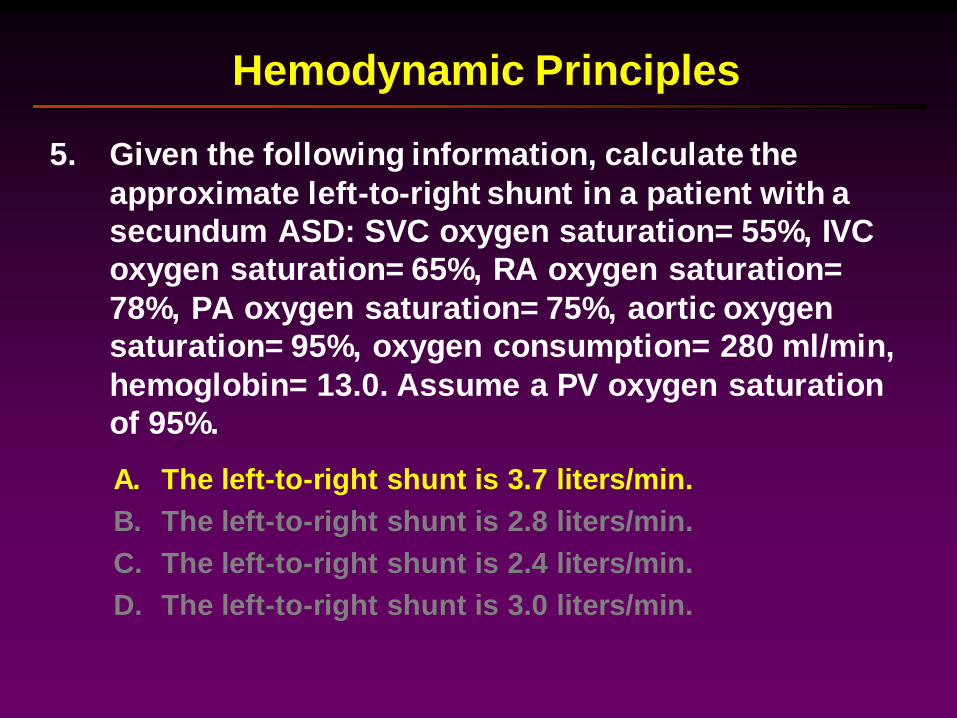
5. Given the following information, calculate the
approximate left-to-right shunt in a patient with a
secundum ASD: SVC oxygen saturation= 55%, IVC
oxygen saturation= 65%, RA oxygen saturation=
78%, PA oxygen saturation= 75%, aortic oxygen
saturation= 95%, oxygen consumption= 280 ml/min,
hemoglobin= 13.0. Assume a PV oxygen saturation
of 95%.
Hemodynamic Principles
A. The left-to-right shunt is 3.7 liters/min.
B. The left-to-right shunt is 2.8 liters/min.
C. The left-to-right shunt is 2.4 liters/min.
D. The left-to-right shunt is 3.0 liters/min.
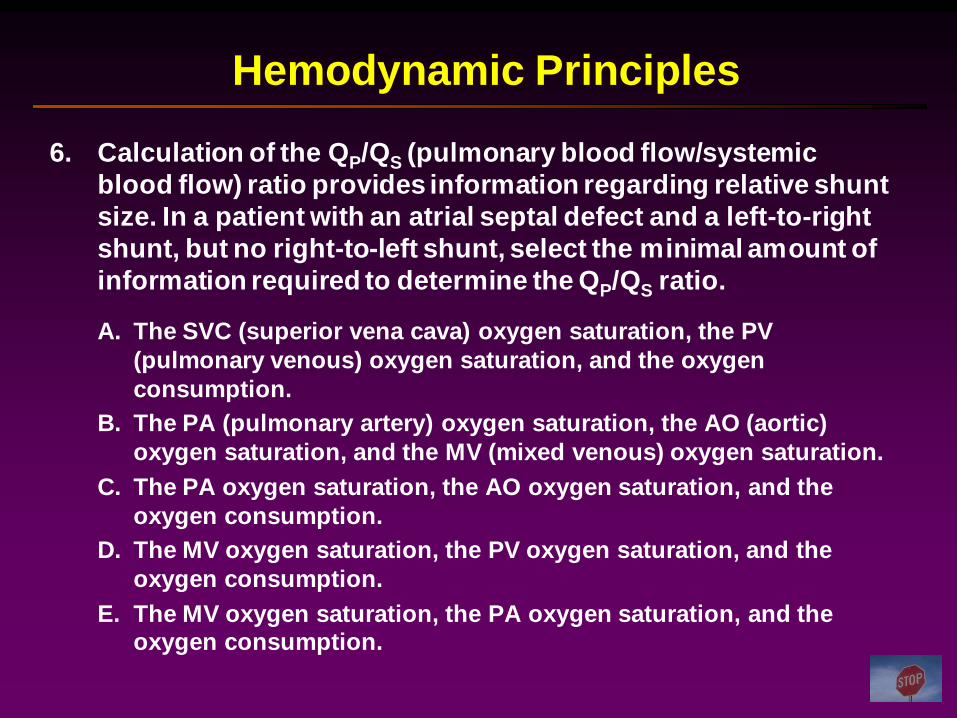
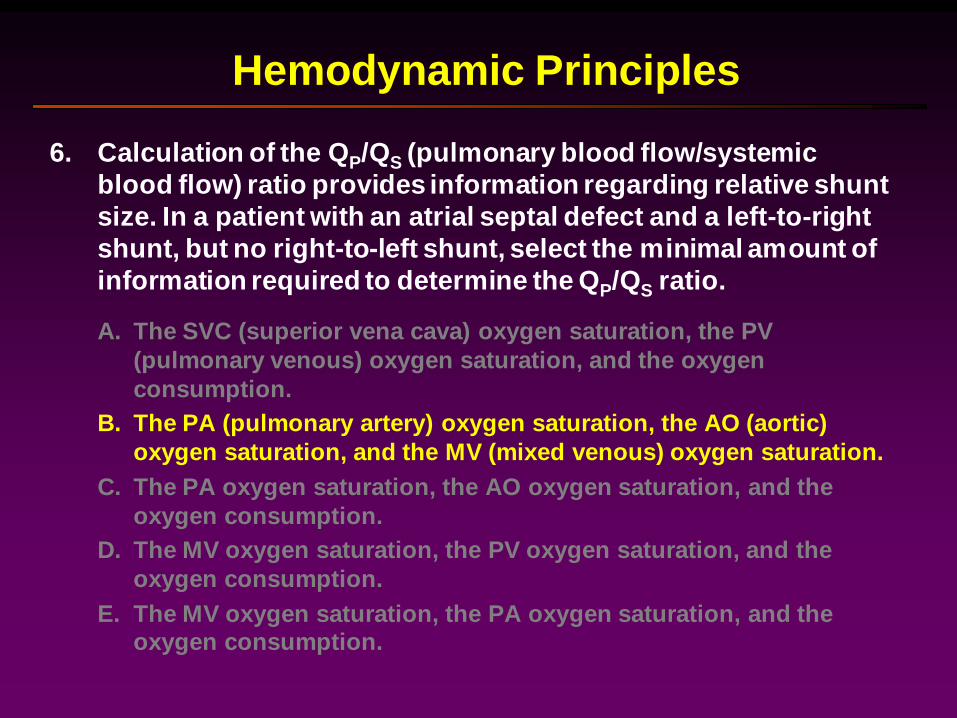
6. Calculation of the QP/QS (pulmonary blood flow/systemic
blood flow) ratio provides information regarding relative shunt
size. In a patient with an atrial septal defect and a left-to-right
shunt, but no right-to-left shunt, select the minimal amount of
information required to determine the QP/QS ratio.
Hemodynamic Principles
A. The SVC (superior vena cava) oxygen saturation, the PV
(pulmonary venous) oxygen saturation, and the oxygen
consumption.
B. The PA (pulmonary artery) oxygen saturation, the AO (aortic)
oxygen saturation, and the MV (mixed venous) oxygen saturation.
C. The PA oxygen saturation, the AO oxygen saturation, and the
oxygen consumption.
D. The MV oxygen saturation, the PV oxygen saturation, and the
oxygen consumption.
E. The MV oxygen saturation, the PA oxygen saturation, and the oxygen consumption.
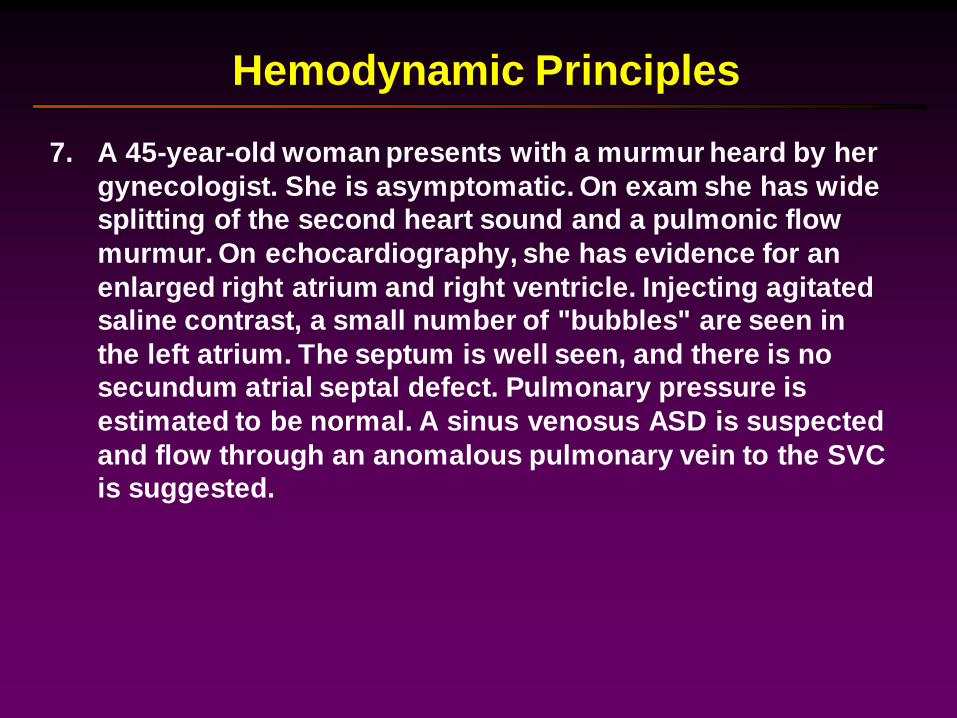
7. A 45-year-old woman presents with a murmur heard by her
gynecologist. She is asymptomatic. On exam she has wide
splitting of the second heart sound and a pulmonic flow
murmur. On echocardiography, she has evidence for an
enlarged right atrium and right ventricle. Injecting agitated
saline contrast, a small number of "bubbles" are seen in
the left atrium. The septum is well seen, and there is no
secundum atrial septal defect. Pulmonary pressure is
estimated to be normal. A sinus venosus ASD is suspected
and flow through an anomalous pulmonary vein to the SVC
is suggested.
Hemodynamic Principles
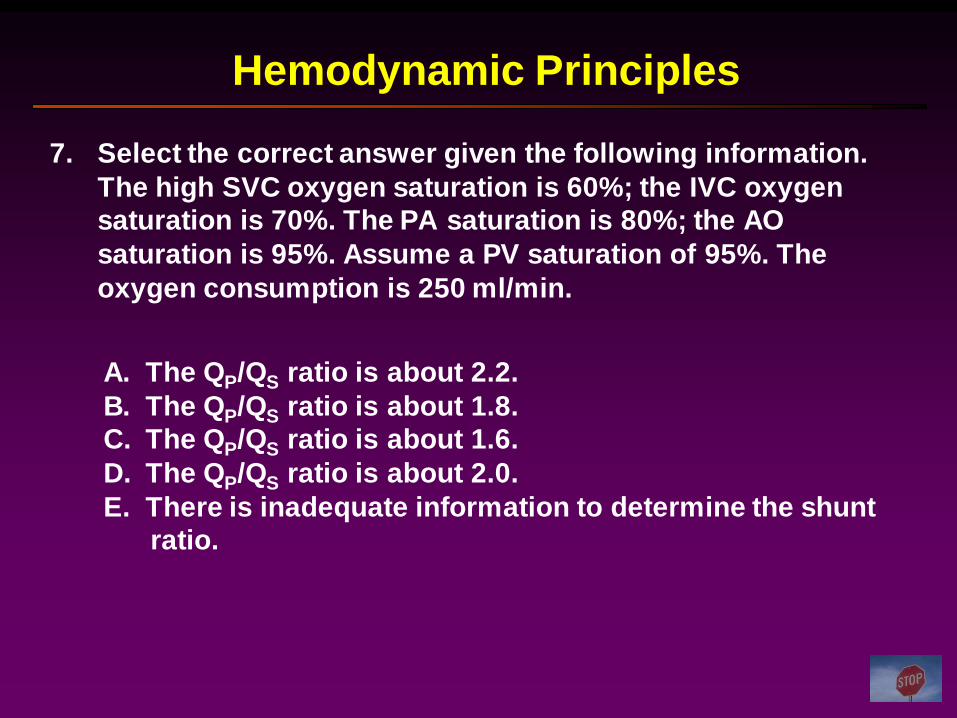
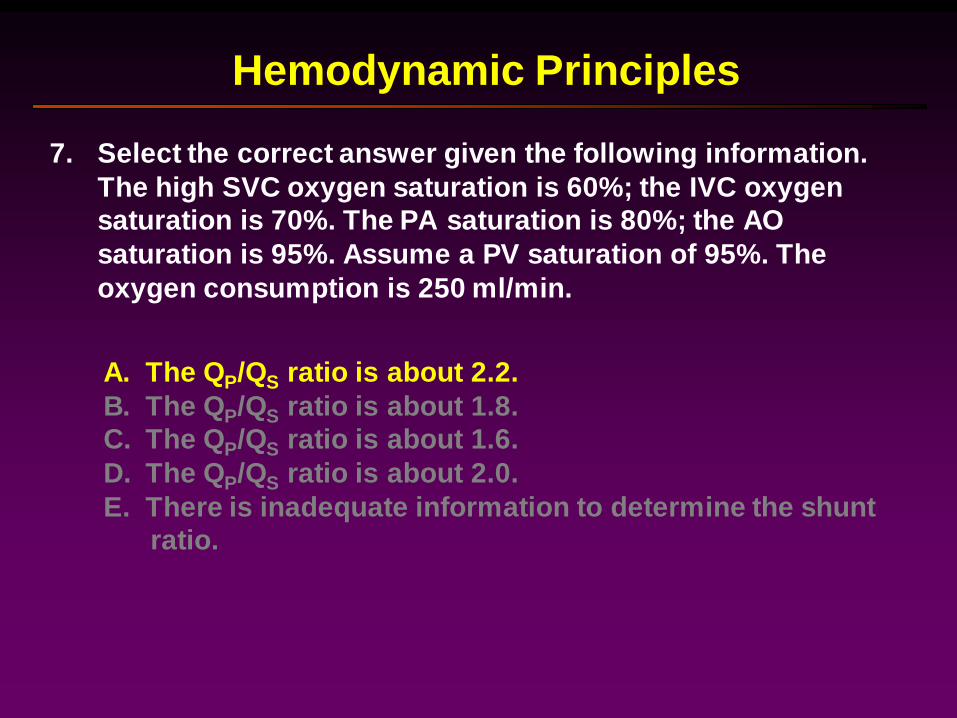
7. Select the correct answer given the following information.
The high SVC oxygen saturation is 60%; the IVC oxygen
saturation is 70%. The PA saturation is 80%; the AO
saturation is 95%. Assume a PV saturation of 95%. The
oxygen consumption is 250 ml/min.
Hemodynamic Principles
A. The QP/QS ratio is about 2.2.
B. The QP/QS ratio is about 1.8.
C. The QP/QS ratio is about 1.6.
D. The QP/QS ratio is about 2.0.
E. There is inadequate information to determine the shunt
ratio.
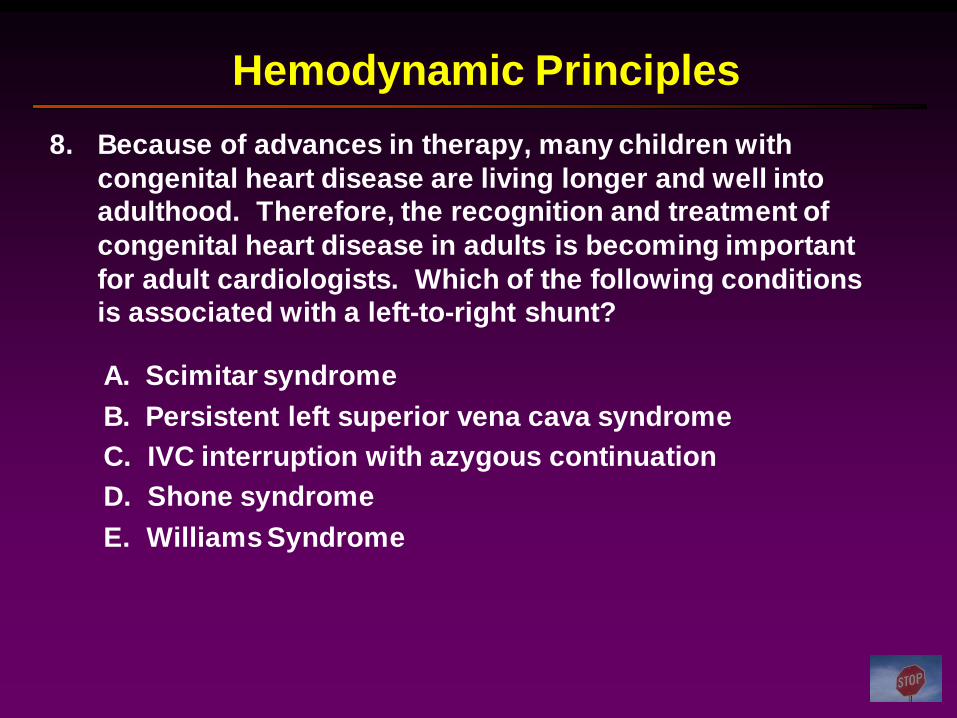
8. Because of advances in therapy, many children with
congenital heart disease are living longer and well into
adulthood. Therefore, the recognition and treatment of
congenital heart disease in adults is becoming important
for adult cardiologists. Which of the following conditions
is associated with a left-to-right shunt?
Hemodynamic Principles
A. Scimitar syndrome
B. Persistent left superior vena cava syndrome
C. IVC interruption with azygous continuation
D. Shone syndrome
E. Williams Syndrome
Hemodynamic PrinciplesAn Overview
• Pressure measurement
• Right and left heart catheterization
• Cardiac output measurement
– Fick-oxygen method• Arterial-venous oxygen difference
– Indicator-dilution methods• Indocyanine green
• Thermodilution
• Vascular resistance
• Shunt detection and measurement
• Gradients and valve stenoses
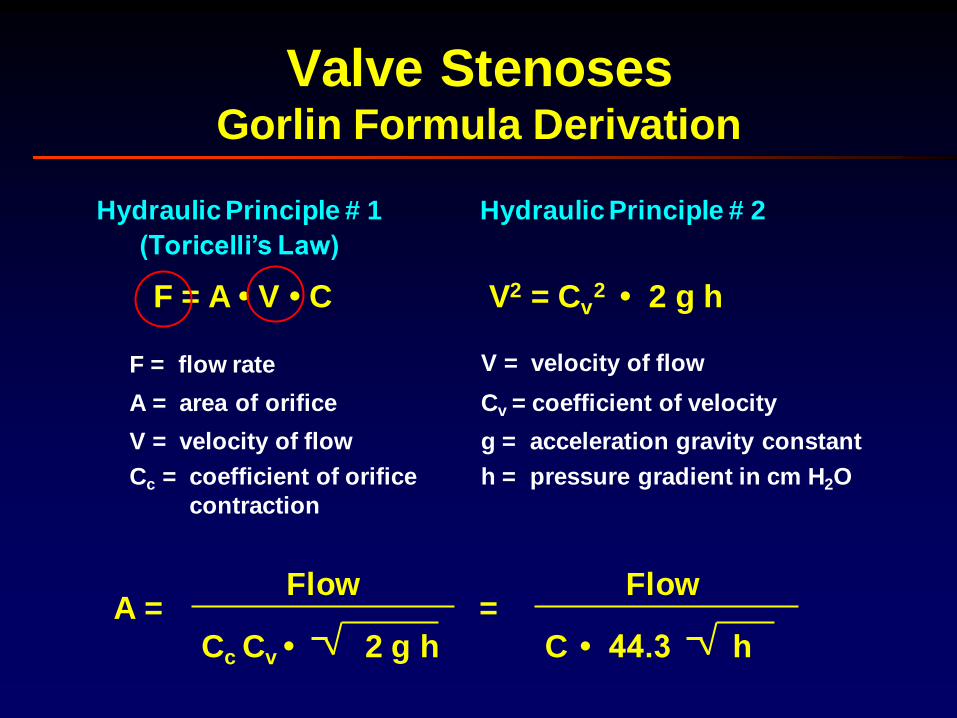
Valve StenosesGorlin Formula Derivation
Hydraulic Principle # 1
(Toricelli’s Law)
F = A • V • C
F = flow rate
A = area of orifice
Cc = coefficient of orifice
contraction
V = velocity of flow
Hydraulic Principle # 2
V2 = Cv2 • 2 g h
V = velocity of flow
Cv = coefficient of velocity
h = pressure gradient in cm H2O
g = acceleration gravity constant
Flow
Cc Cv • 2 g h
A = = Flow
C • 44.3 h
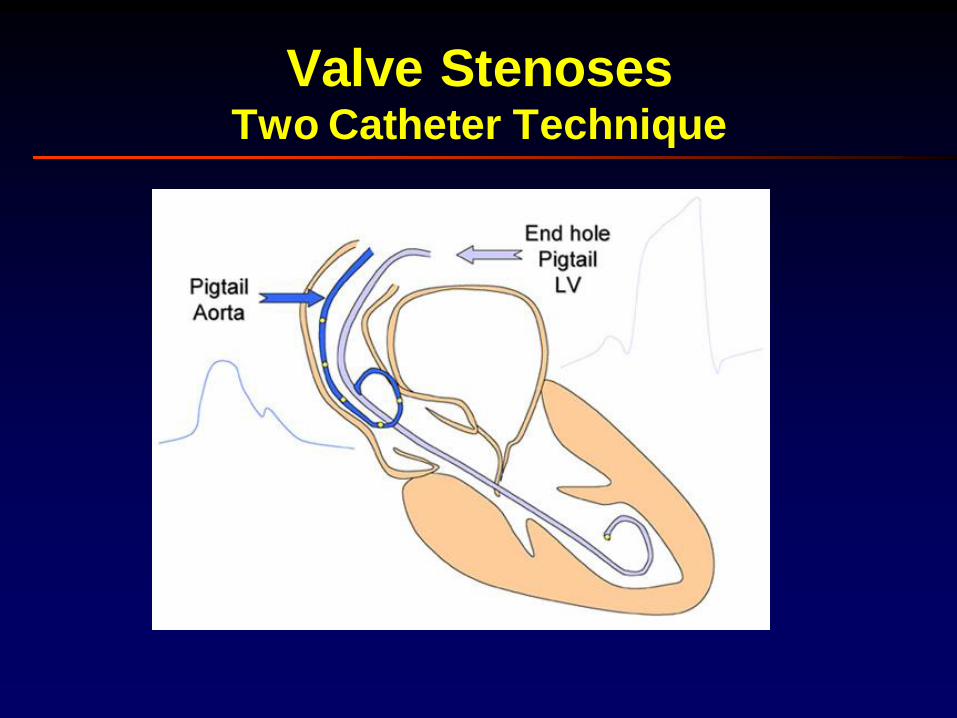
Valve StenosesTwo Catheter Technique
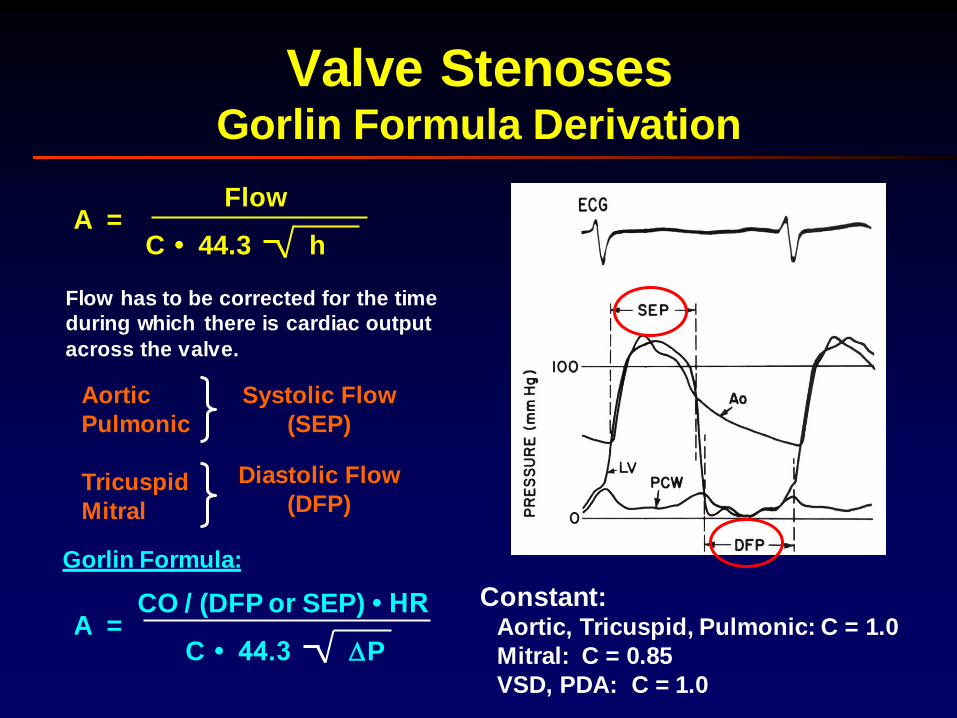
Valve StenosesGorlin Formula Derivation
A =Flow
C • 44.3 h
Flow has to be corrected for the time
during which there is cardiac output
across the valve.
Aortic
Pulmonic
Tricuspid
Mitral
Systolic Flow
(SEP)
Diastolic Flow
(DFP)
A =CO / (DFP or SEP) • HR
C • 44.3 P
Gorlin Formula:
Aortic, Tricuspid, Pulmonic: C = 1.0
Mitral: C = 0.85
VSD, PDA: C = 1.0
Constant:
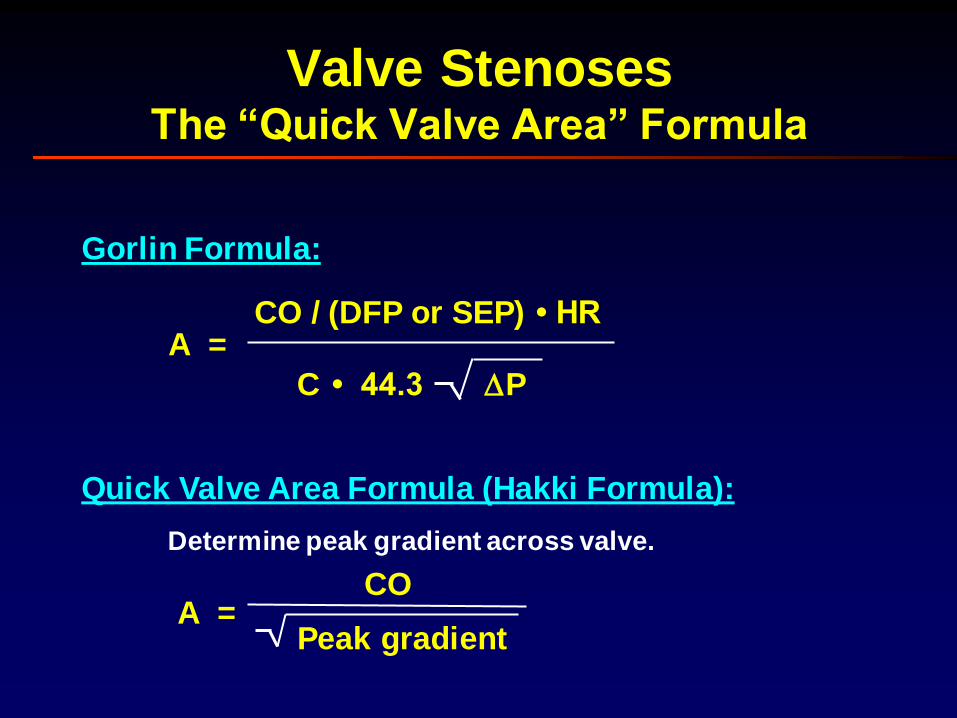
Valve StenosesThe “Quick Valve Area” Formula
A =CO / (DFP or SEP) • HR
C • 44.3 P
Gorlin Formula:
Quick Valve Area Formula (Hakki Formula):
Determine peak gradient across valve.
A =CO
Peak gradient
Aortic Valve StenosisCalculating Valve Area
SEP
Step 1: Planimeter area and calculate SEP
Gradient
DeflectionLength
of SEPArea of gradient
(mm2) (mm) (mm)
#1
#2
#3
#4
#5
Average deflection = mm
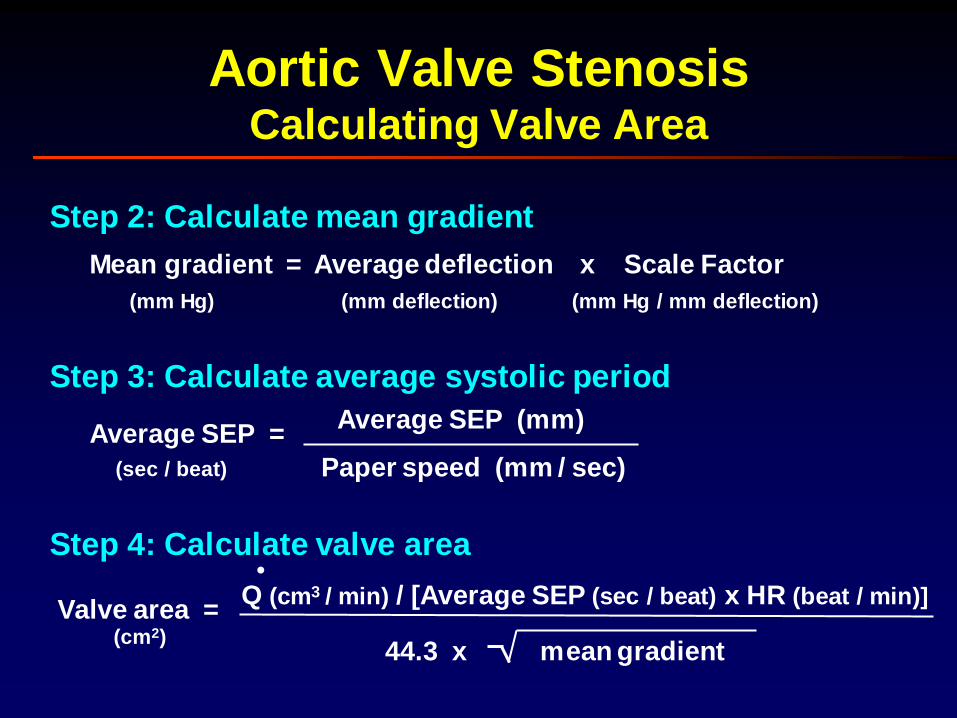
Step 2: Calculate mean gradient
Mean gradient = Average deflection x Scale Factor
(mm deflection) (mm Hg / mm deflection)(mm Hg)
Step 3: Calculate average systolic period
Average SEP =
(sec / beat)
Average SEP (mm)
Paper speed (mm / sec)
Step 4: Calculate valve area
Valve area =(cm2)
Q (cm3 / min) / [Average SEP (sec / beat) x HR (beat / min)]
44.3 x mean gradient
.
Aortic Valve StenosisCalculating Valve Area
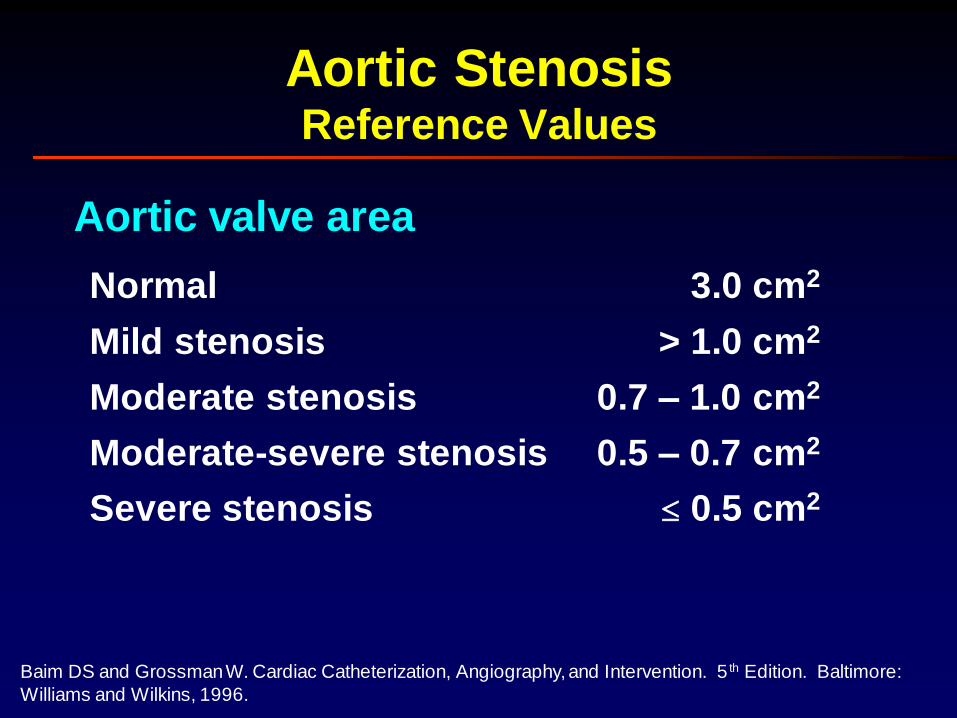
Aortic StenosisReference Values
Aortic valve area
Normal
Mild stenosis
Moderate stenosis
3.0 cm2
0.7 – 1.0 cm2
> 1.0 cm2
Moderate-severe stenosis 0.5 – 0.7 cm2
Severe stenosis 0.5 cm2
Baim DS and Grossman W. Cardiac Catheterization, Angiography, and Intervention. 5 th Edition. Baltimore:
Williams and Wilkins, 1996.
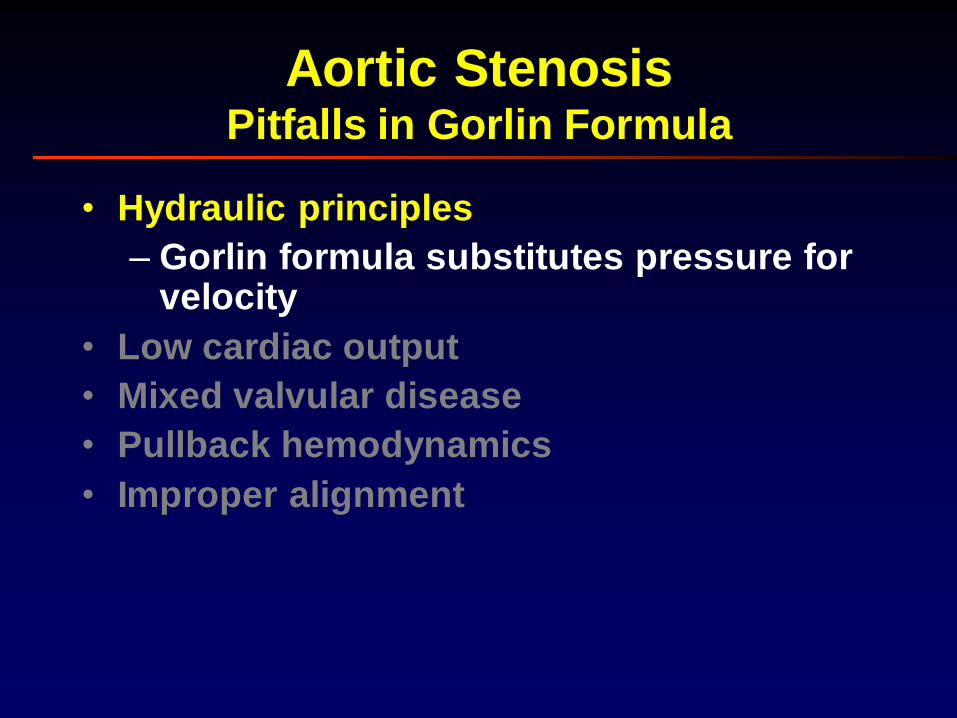
• Hydraulic principles
– Gorlin formula substitutes pressure for velocity
• Low cardiac output
• Mixed valvular disease
• Pullback hemodynamics
• Improper alignment
Aortic StenosisPitfalls in Gorlin Formula
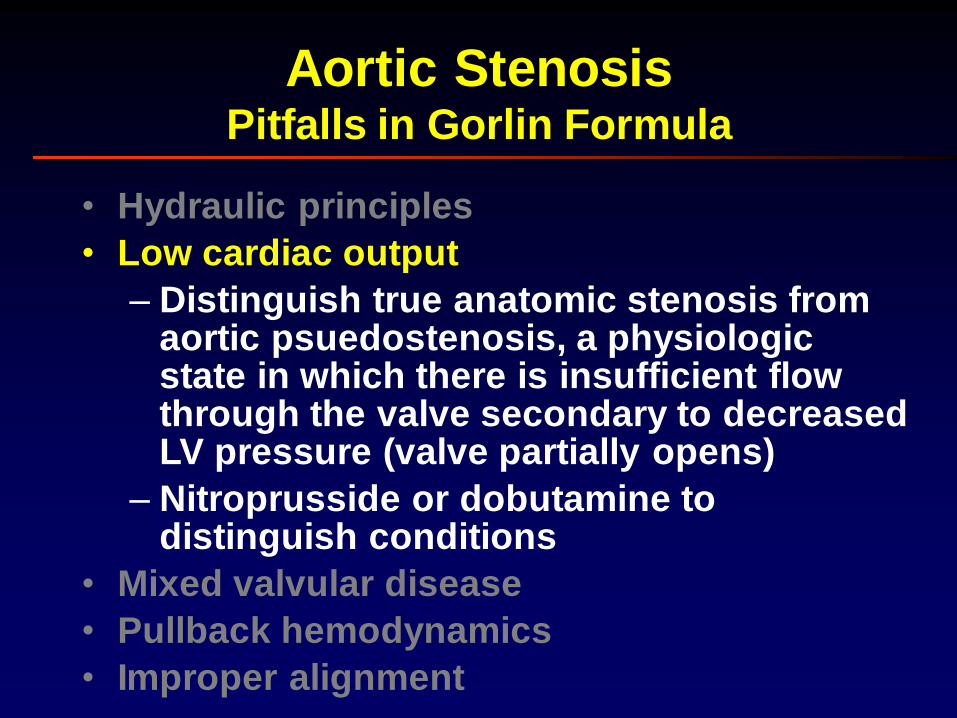
• Hydraulic principles
• Low cardiac output
– Distinguish true anatomic stenosis from aortic psuedostenosis, a physiologic state in which there is insufficient flow through the valve secondary to decreased LV pressure (valve partially opens)
– Nitroprusside or dobutamine to distinguish conditions
• Mixed valvular disease
• Pullback hemodynamics
• Improper alignment
Aortic StenosisPitfalls in Gorlin Formula
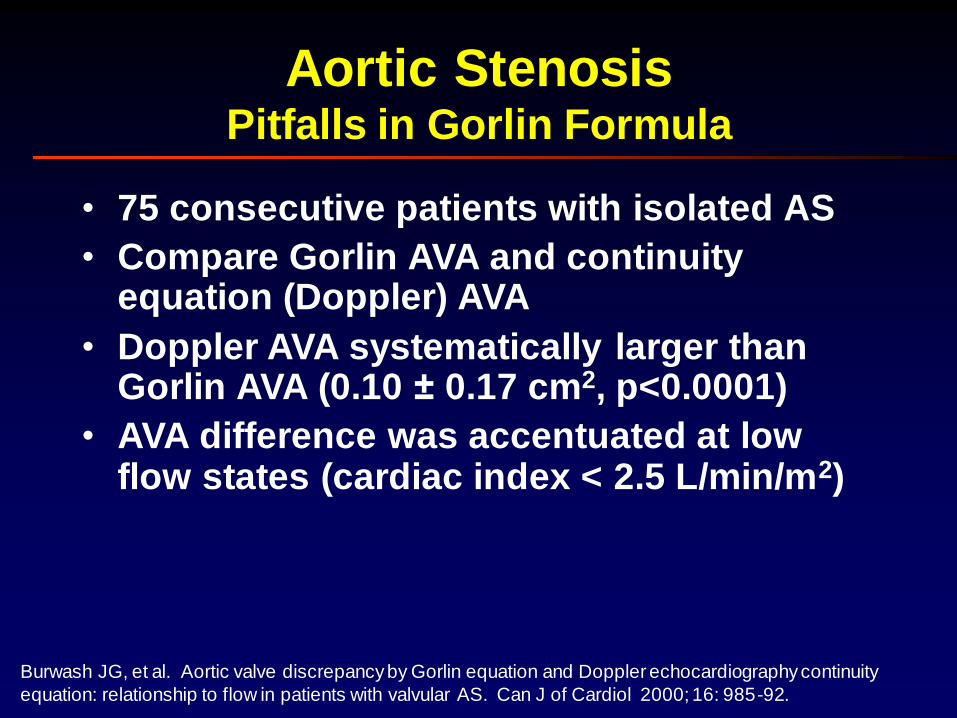
• 75 consecutive patients with isolated AS
• Compare Gorlin AVA and continuity equation (Doppler) AVA
• Doppler AVA systematically larger than Gorlin AVA (0.10 ± 0.17 cm2, p<0.0001)
• AVA difference was accentuated at low flow states (cardiac index < 2.5 L/min/m2)
Aortic StenosisPitfalls in Gorlin Formula
Burwash JG, et al. Aortic valve discrepancy by Gorlin equation and Doppler echocardiography continuity
equation: relationship to flow in patients with valvular AS. Can J of Cardiol 2000; 16: 985-92.
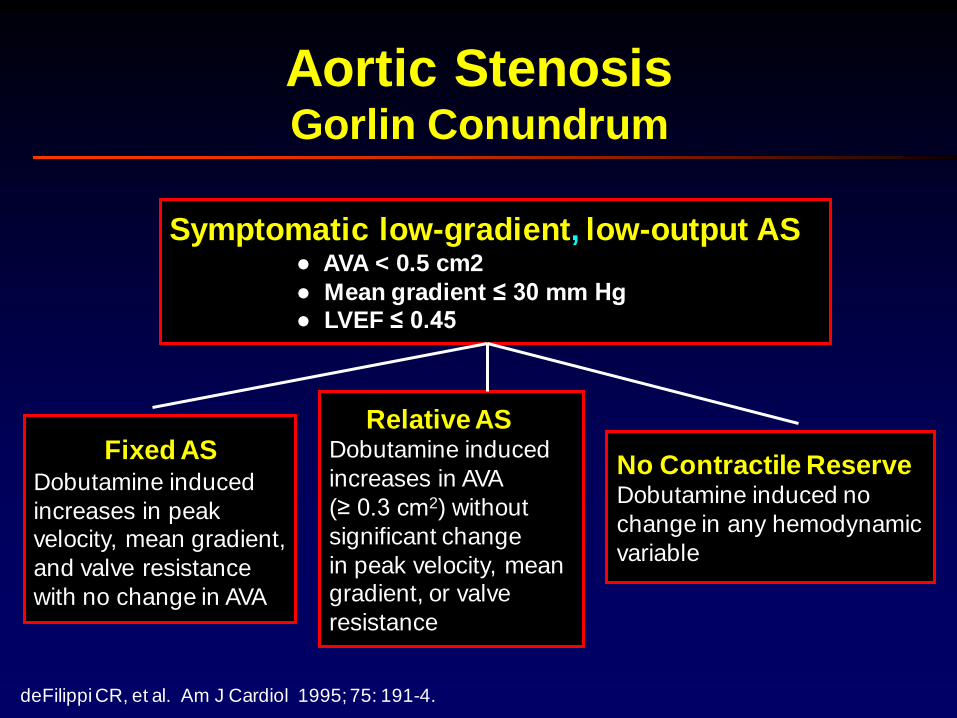
Aortic StenosisGorlin Conundrum
Symptomatic low-gradient, low-output AS● AVA < 0.5 cm2
● Mean gradient ≤ 30 mm Hg● LVEF ≤ 0.45
deFilippi CR, et al. Am J Cardiol 1995; 75: 191-4.
Fixed ASDobutamine induced
increases in peak velocity, mean gradient,
and valve resistance
with no change in AVA
Relative ASDobutamine induced
increases in AVA
(≥ 0.3 cm2) without
significant change
in peak velocity, meangradient, or valve
resistance
No Contractile ReserveDobutamine induced no
change in any hemodynamic
variable
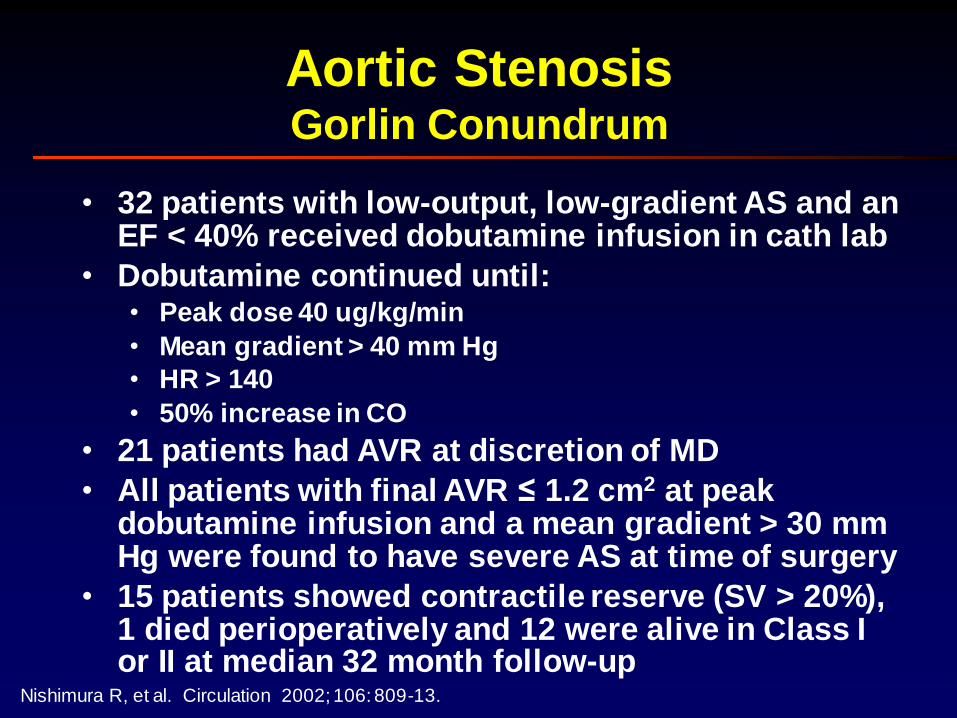
• 32 patients with low-output, low-gradient AS and an EF < 40% received dobutamine infusion in cath lab
• Dobutamine continued until:• Peak dose 40 ug/kg/min
• Mean gradient > 40 mm Hg
• HR > 140
• 50% increase in CO
• 21 patients had AVR at discretion of MD
• All patients with final AVR ≤ 1.2 cm2 at peak dobutamine infusion and a mean gradient > 30 mm Hg were found to have severe AS at time of surgery
• 15 patients showed contractile reserve (SV > 20%), 1 died perioperatively and 12 were alive in Class I or II at median 32 month follow-up
Aortic StenosisGorlin Conundrum
Nishimura R, et al. Circulation 2002; 106: 809-13.
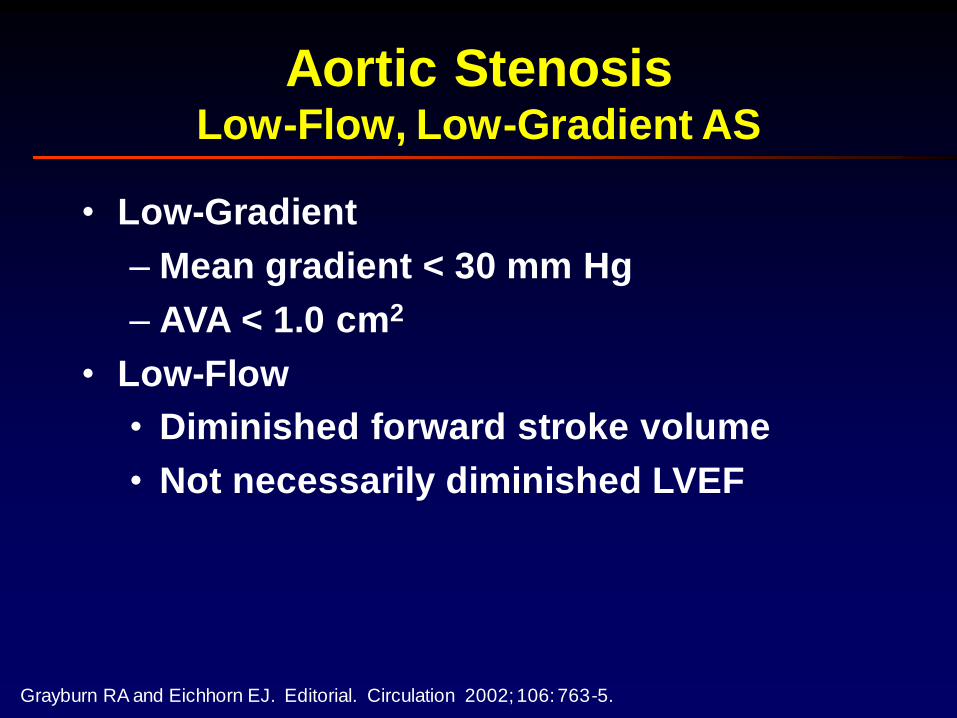
• Low-Gradient
– Mean gradient < 30 mm Hg
– AVA < 1.0 cm2
• Low-Flow
• Diminished forward stroke volume
• Not necessarily diminished LVEF
Aortic StenosisLow-Flow, Low-Gradient AS
Grayburn RA and Eichhorn EJ. Editorial. Circulation 2002; 106: 763-5.
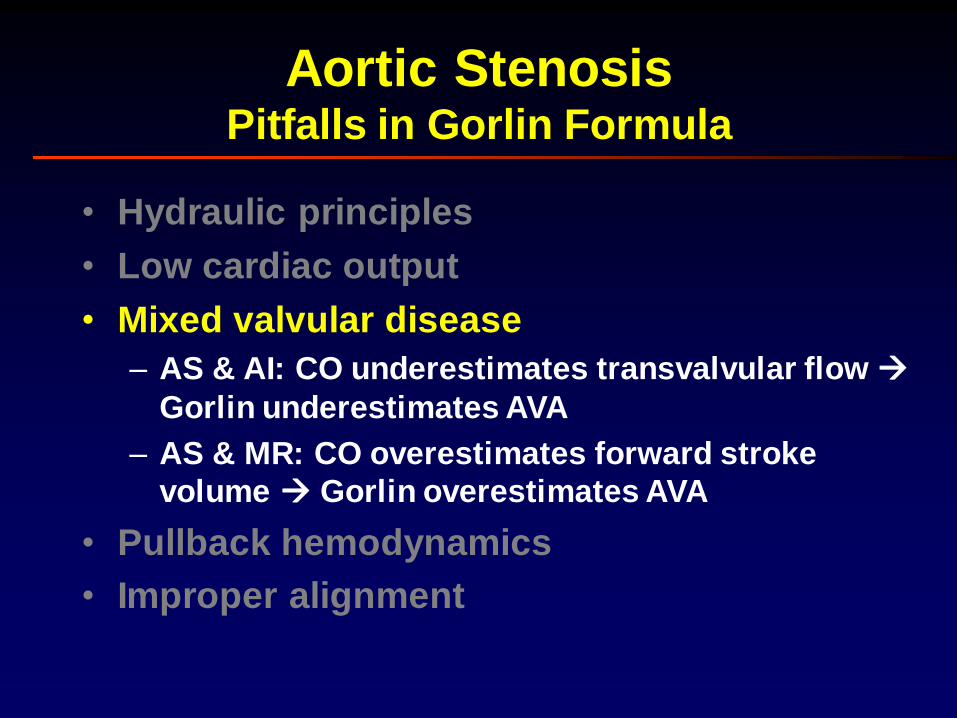
• Hydraulic principles
• Low cardiac output
• Mixed valvular disease
– AS & AI: CO underestimates transvalvular flow
Gorlin underestimates AVA
– AS & MR: CO overestimates forward stroke
volume Gorlin overestimates AVA
• Pullback hemodynamics
• Improper alignment
Aortic StenosisPitfalls in Gorlin Formula
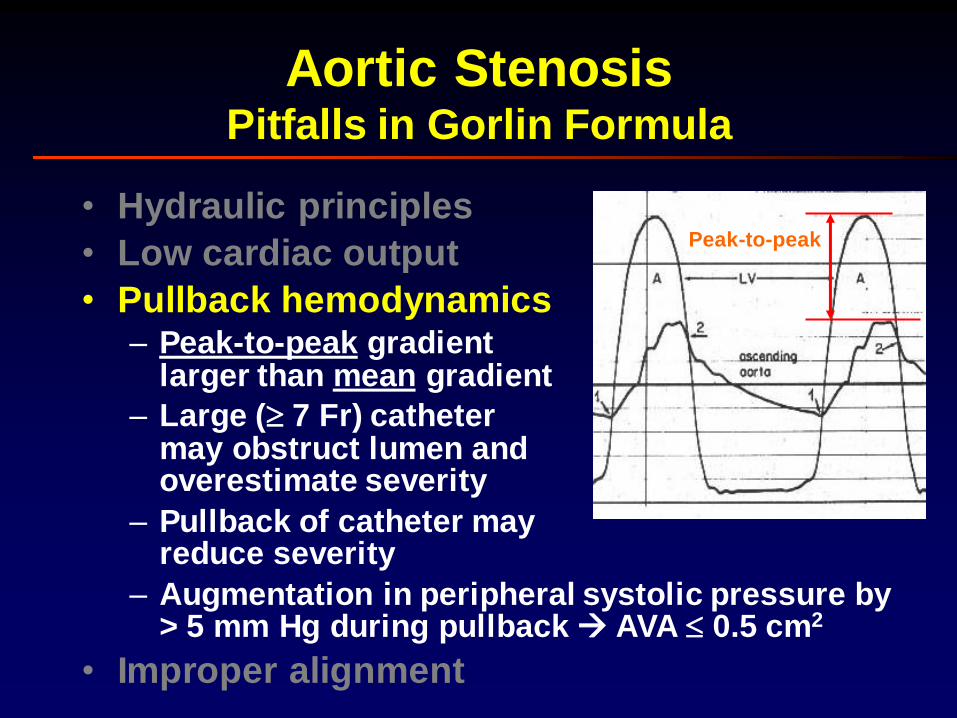
• Hydraulic principles
• Low cardiac output
• Pullback hemodynamics– Peak-to-peak gradient
larger than mean gradient
– Large ( 7 Fr) cathetermay obstruct lumen andoverestimate severity
– Pullback of catheter mayreduce severity
– Augmentation in peripheral systolic pressure by > 5 mm Hg during pullback AVA 0.5 cm2
• Improper alignment
Aortic StenosisPitfalls in Gorlin Formula
Peak-to-peak
Aortic StenosisTest Question
• Right heart catheterization
– RA (a, v, mean): 7, 6, 5
– RV: 25 / 5
– PA: 25 / 11, mean 15; Sat = 76%
– PCW (a, v, mean): 12, 11, 10
• Left heart catheterization
– LV: 176 / 16; Sat = 96%
– Ao: 100 / 66, mean 84; Sat = 96%
• O2 consumption: 225 mL/min
• BSA = 1.87 m2
• Hgb = 14.7 g/dL
• Pulse = 70 bpm
• LVEF = 69% • Paper speed = 25 mm/sec
• Paper scale = 20 mm Hg / 10 mm Hg
8.75
mm
12.68 mm
21.43 mm
238 mm2
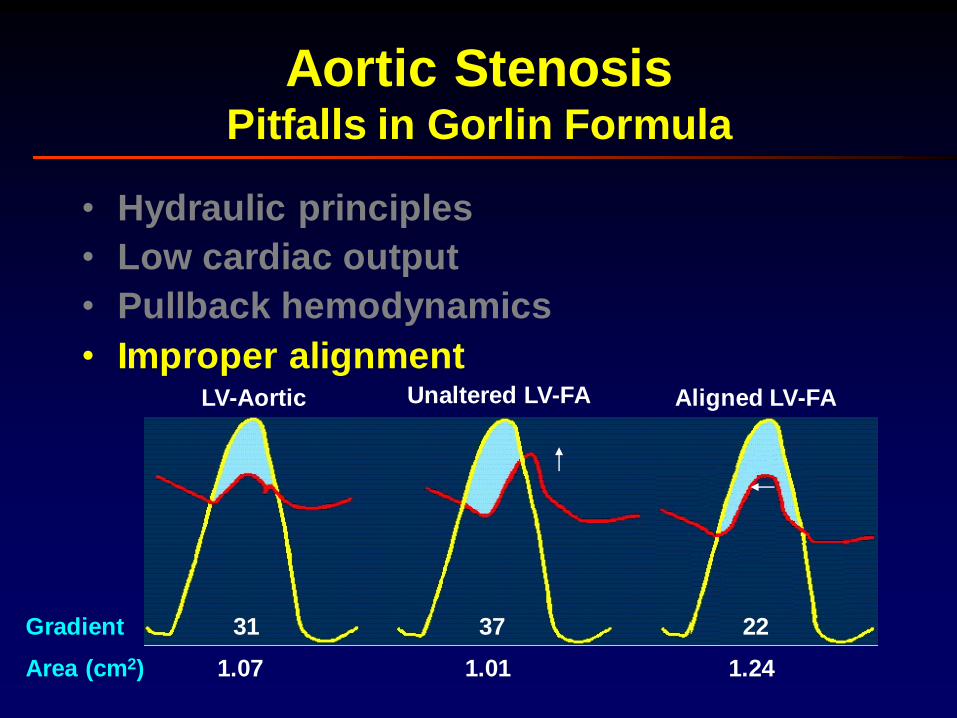
LV-Aortic Unaltered LV-FA Aligned LV-FA
Gradient
Area (cm2)
31 37 22
1.07 1.01 1.24
• Hydraulic principles
• Low cardiac output
• Pullback hemodynamics
• Improper alignment
Aortic StenosisPitfalls in Gorlin Formula
0.0
1.0
2.0
3.0
4.0
5.0
6.0
7.0
8.0
9.0
10.0
0 50 100 150 200 250 300
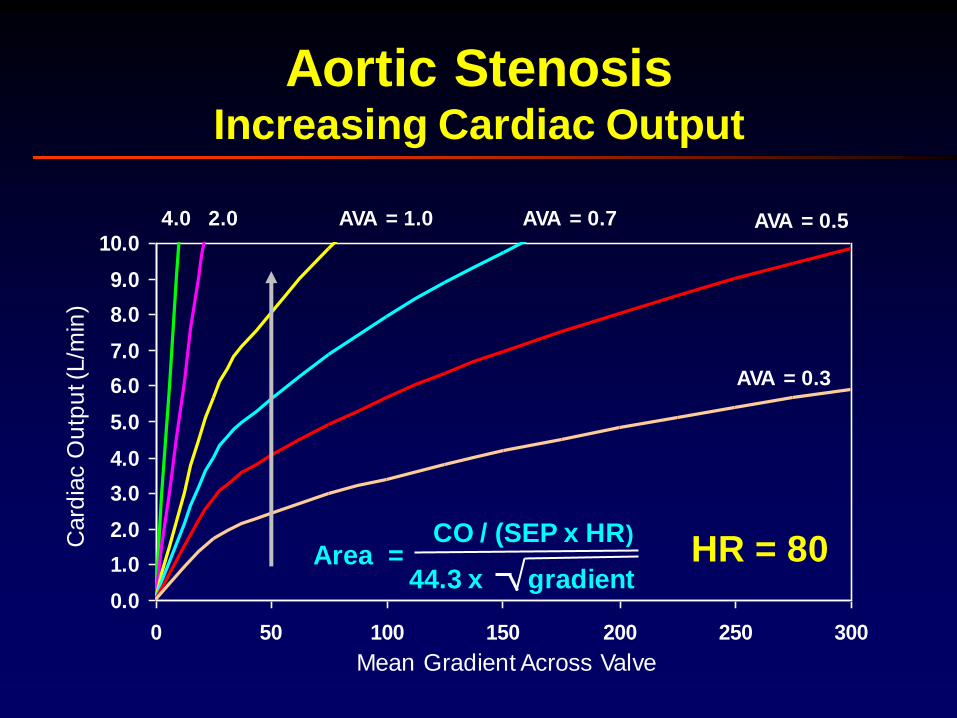
Aortic StenosisIncreasing Cardiac Output
Mean Gradient Across Valve
Card
iac O
utp
ut (
L/m
in)
AVA = 0.5
AVA = 0.3
AVA = 0.7AVA = 1.02.04.0
HR = 80Area =CO / (SEP x HR)
44.3 x gradient
0.0
1.0
2.0
3.0
4.0
5.0
6.0
7.0
8.0
9.0
10.0
0 50 100 150 200 250 300
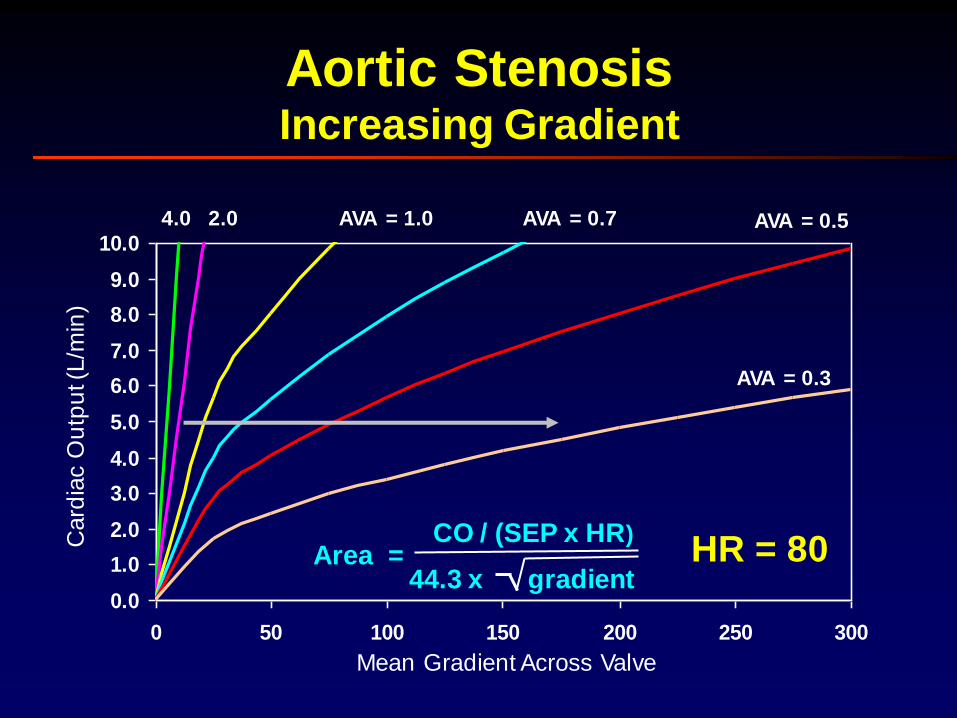
Aortic StenosisIncreasing Gradient
Mean Gradient Across Valve
Card
iac O
utp
ut (
L/m
in)
AVA = 0.5
AVA = 0.3
AVA = 0.7AVA = 1.02.04.0
HR = 80Area =CO / (SEP x HR)
44.3 x gradient
0.0
1.0
2.0
3.0
4.0
5.0
6.0
7.0
8.0
9.0
10.0
0 50 100 150 200 250 300
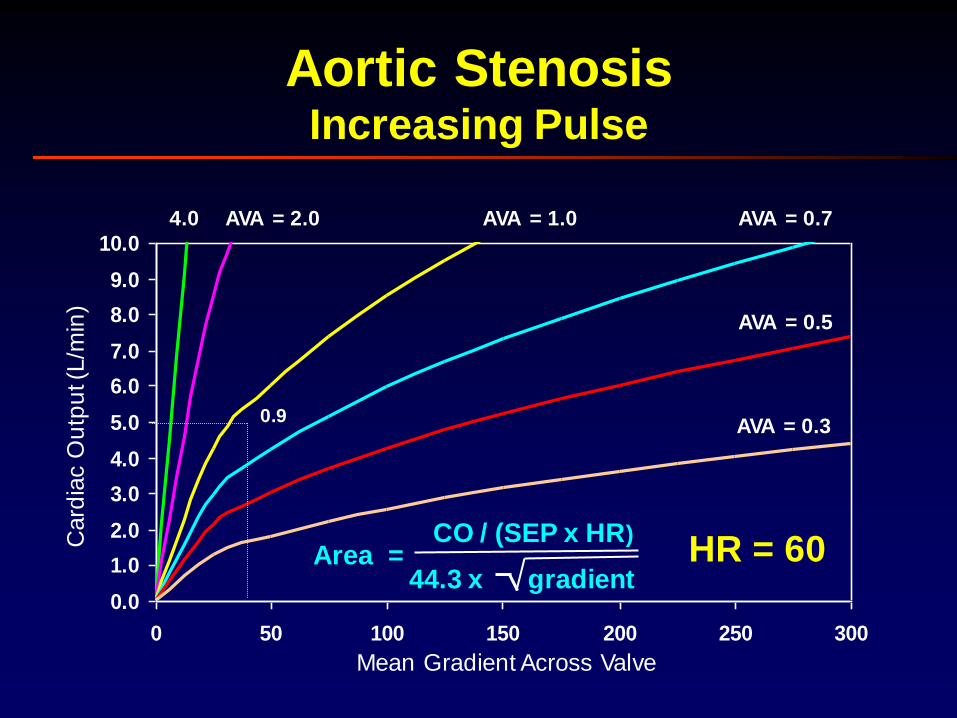
Aortic StenosisIncreasing Pulse
Mean Gradient Across Valve
Card
iac O
utp
ut (
L/m
in)
AVA = 0.5
AVA = 0.3
AVA = 0.7AVA = 1.0AVA = 2.04.0
HR = 60
0.9
Area =CO / (SEP x HR)
44.3 x gradient
0.0
1.0
2.0
3.0
4.0
5.0
6.0
7.0
8.0
9.0
10.0
0 50 100 150 200 250 300
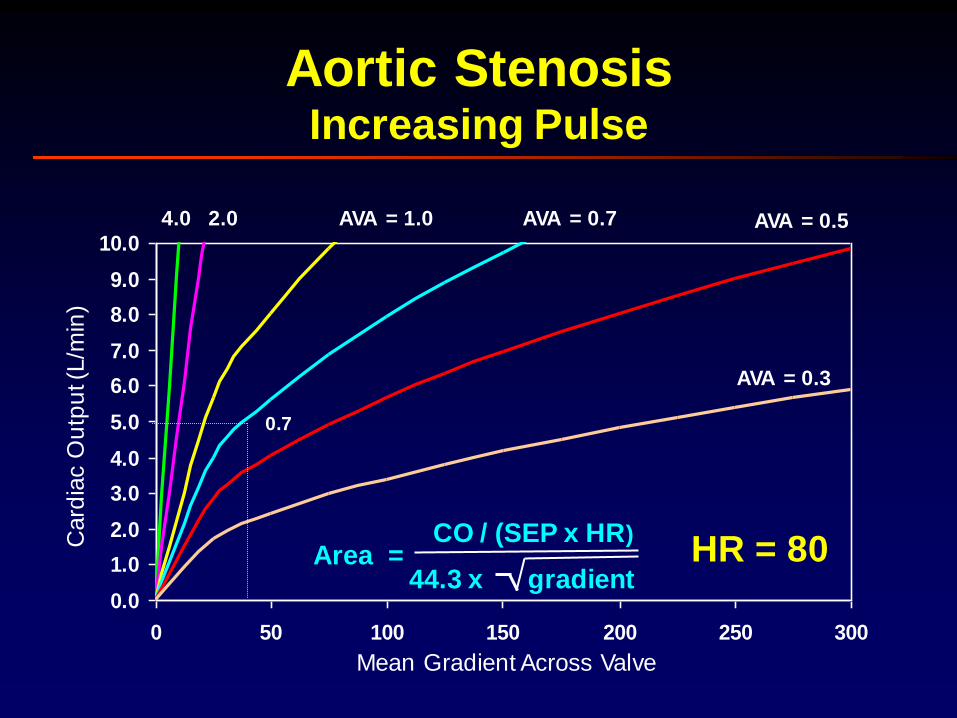
Aortic StenosisIncreasing Pulse
Mean Gradient Across Valve
Card
iac O
utp
ut (
L/m
in)
AVA = 0.5
AVA = 0.3
AVA = 0.7AVA = 1.02.04.0
HR = 80
0.7
Area =CO / (SEP x HR)
44.3 x gradient
0.0
1.0
2.0
3.0
4.0
5.0
6.0
7.0
8.0
9.0
10.0
0 50 100 150 200 250 300
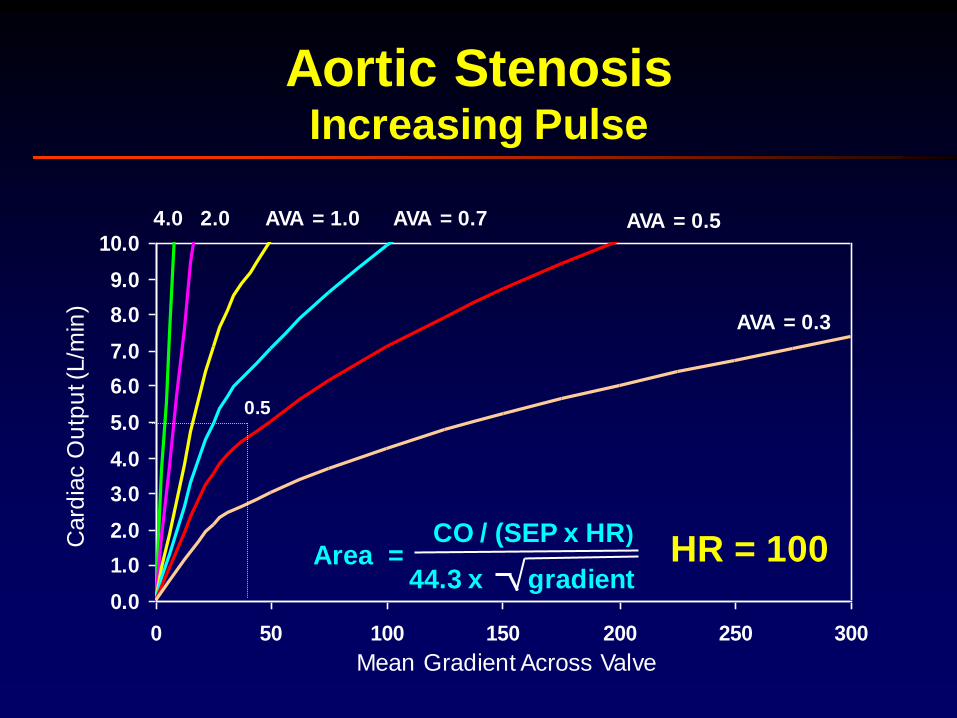
Aortic StenosisIncreasing Pulse
Mean Gradient Across Valve
Card
iac O
utp
ut (
L/m
in)
AVA = 0.5
AVA = 0.3
AVA = 0.7AVA = 1.02.04.0
HR = 100
0.5
Area =CO / (SEP x HR)
44.3 x gradient
0.0
1.0
2.0
3.0
4.0
5.0
6.0
7.0
8.0
9.0
10.0
0 50 100 150 200 250 300
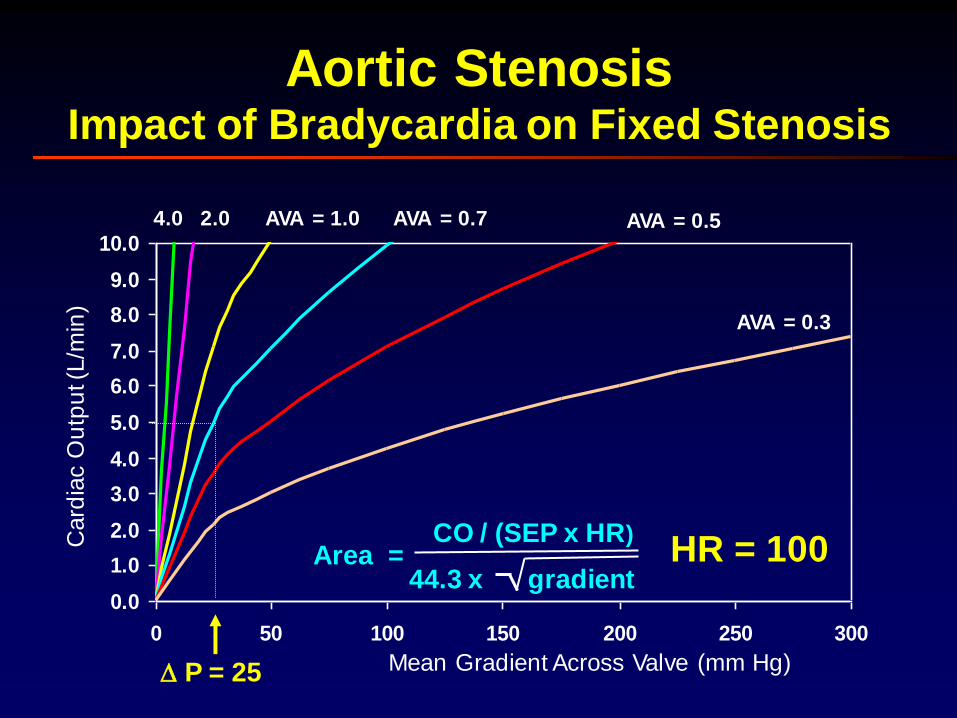
Aortic StenosisImpact of Bradycardia on Fixed Stenosis
Card
iac O
utp
ut (
L/m
in)
AVA = 0.5
AVA = 0.3
AVA = 0.7AVA = 1.02.04.0
HR = 100
P = 25 Mean Gradient Across Valve (mm Hg)
Area =CO / (SEP x HR)
44.3 x gradient
0.0
1.0
2.0
3.0
4.0
5.0
6.0
7.0
8.0
9.0
10.0
0 50 100 150 200 250 300
Card
iac O
utp
ut (
L/m
in)
AVA = 0.5
AVA = 0.3
AVA = 0.7AVA = 1.02.04.0
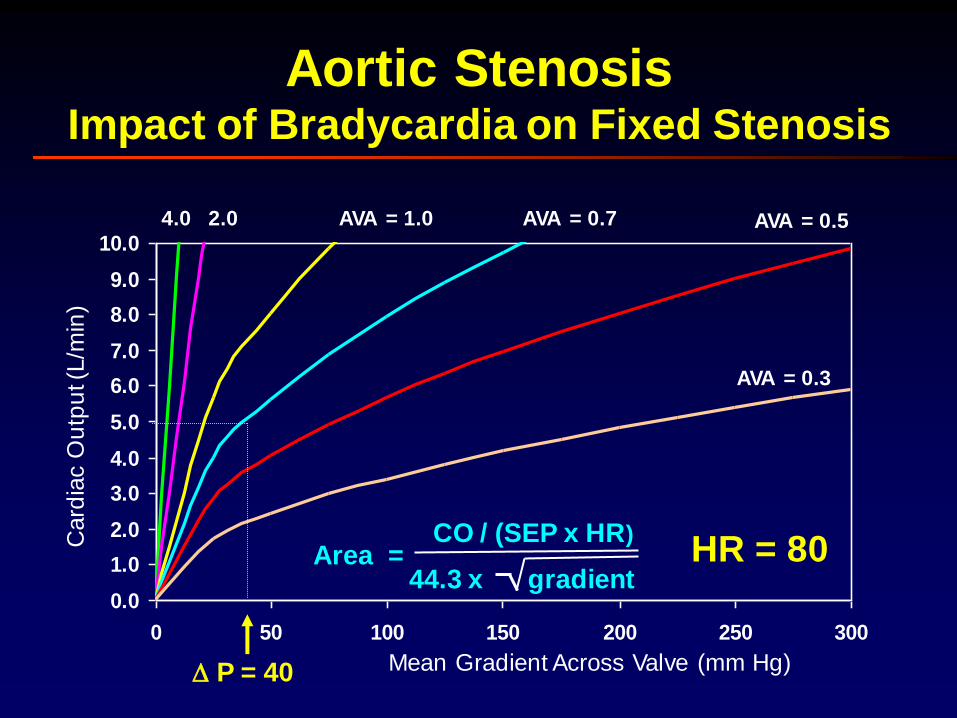
HR = 80
P = 40 Mean Gradient Across Valve (mm Hg)
Area =CO / (SEP x HR)
44.3 x gradient
Aortic StenosisImpact of Bradycardia on Fixed Stenosis
0.0
1.0
2.0
3.0
4.0
5.0
6.0
7.0
8.0
9.0
10.0
0 50 100 150 200 250 300
Mean Gradient Across Valve (mm Hg)
Card
iac O
utp
ut (
L/m
in)
AVA = 0.5
AVA = 0.3
AVA = 0.7AVA = 1.0AVA = 2.04.0
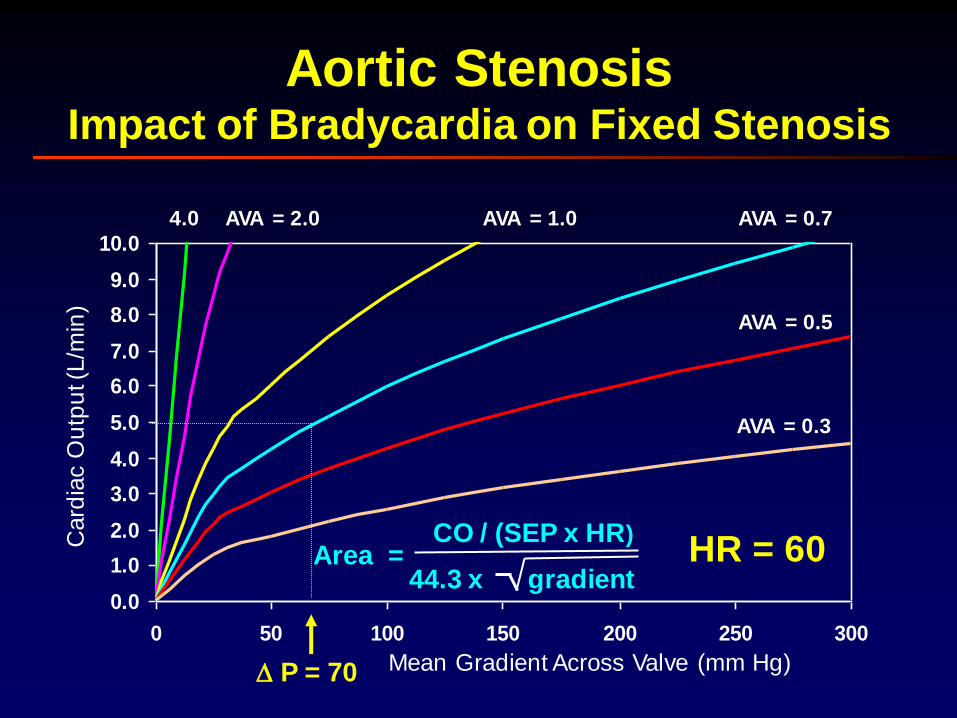
HR = 60
P = 70
Area =CO / (SEP x HR)
44.3 x gradient
Aortic StenosisImpact of Bradycardia on Fixed Stenosis
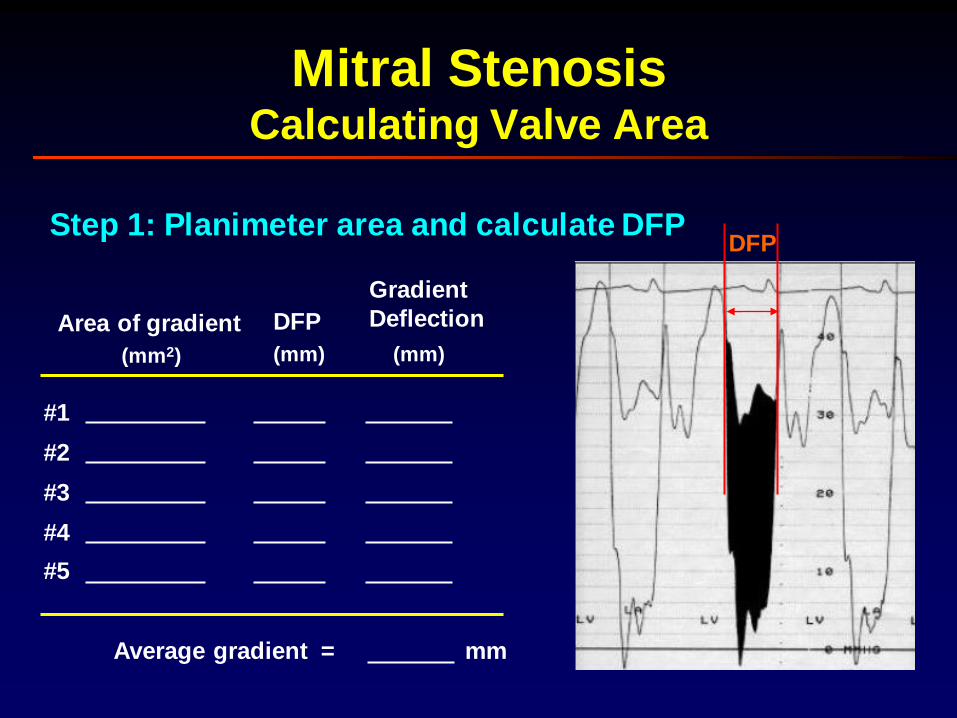
Mitral StenosisCalculating Valve Area
DFPStep 1: Planimeter area and calculate DFP
Gradient
DeflectionDFPArea of gradient
(mm2) (mm) (mm)
#1
#2
#3
#4
#5
Average gradient = mm
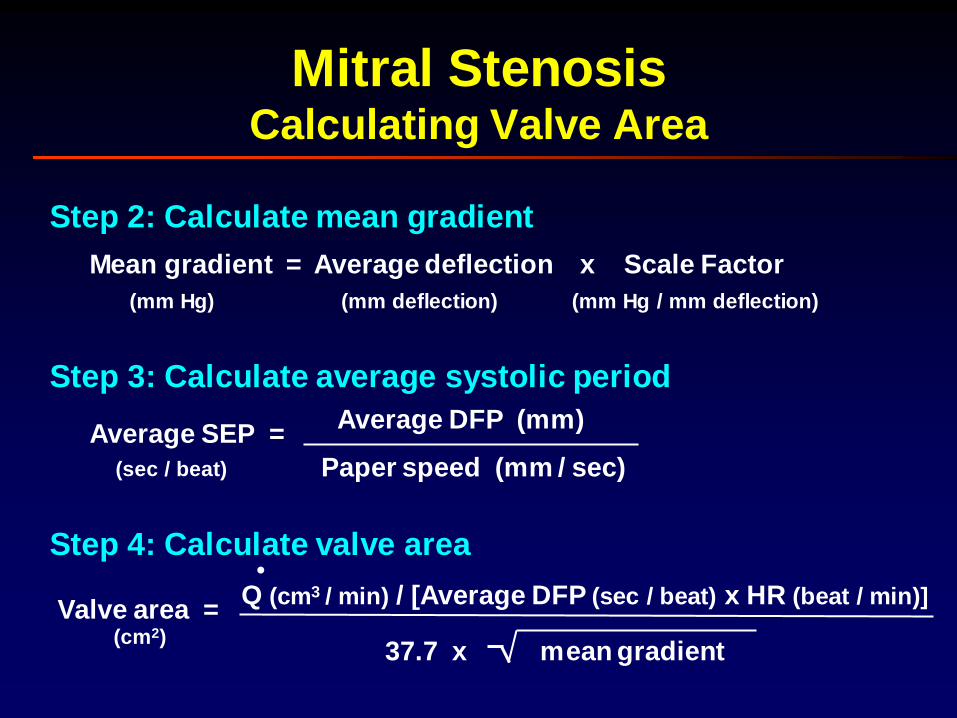
Step 2: Calculate mean gradient
Mean gradient = Average deflection x Scale Factor
(mm deflection) (mm Hg / mm deflection)(mm Hg)
Step 3: Calculate average systolic period
Average SEP =
(sec / beat)
Average DFP (mm)
Paper speed (mm / sec)
Step 4: Calculate valve area
Valve area =(cm2)
Q (cm3 / min) / [Average DFP (sec / beat) x HR (beat / min)]
37.7 x mean gradient
.
Mitral StenosisCalculating Valve Area
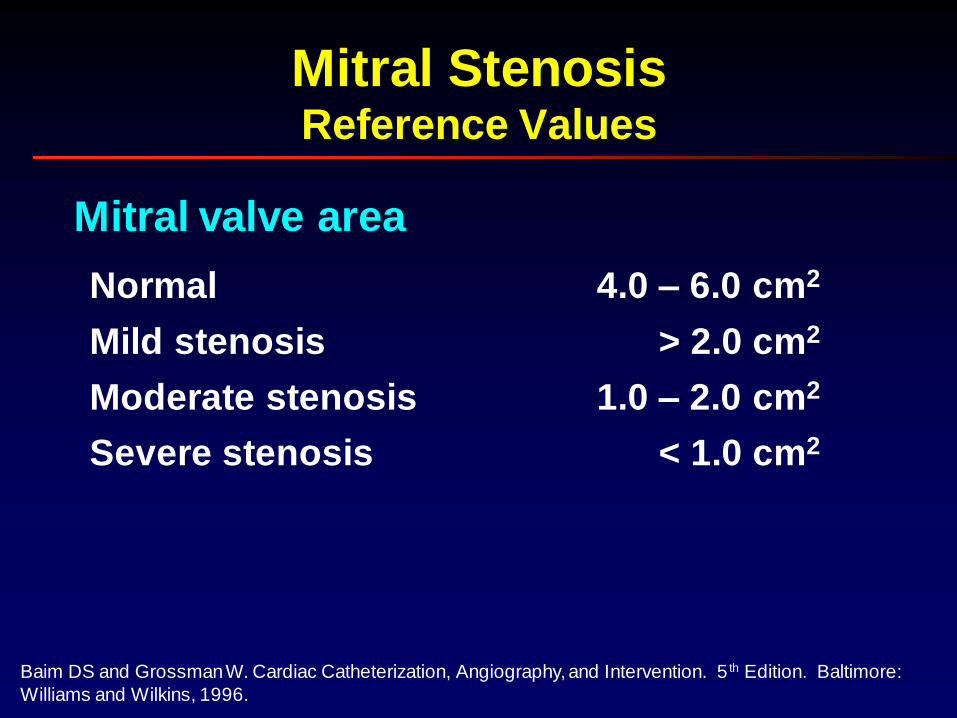
Mitral StenosisReference Values
Mitral valve area
Normal
Mild stenosis
Moderate stenosis
4.0 – 6.0 cm2
1.0 – 2.0 cm2
> 2.0 cm2
Severe stenosis < 1.0 cm2
Baim DS and Grossman W. Cardiac Catheterization, Angiography, and Intervention. 5 th Edition. Baltimore:
Williams and Wilkins, 1996.
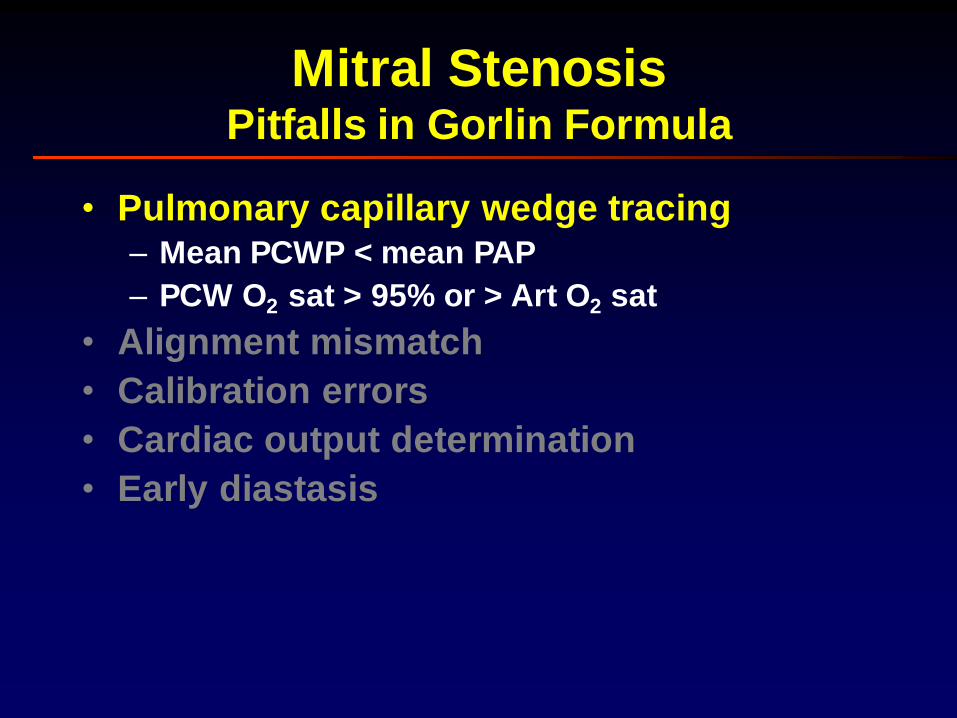
• Pulmonary capillary wedge tracing– Mean PCWP < mean PAP
– PCW O2 sat > 95% or > Art O2 sat
• Alignment mismatch
• Calibration errors
• Cardiac output determination
• Early diastasis
Mitral StenosisPitfalls in Gorlin Formula
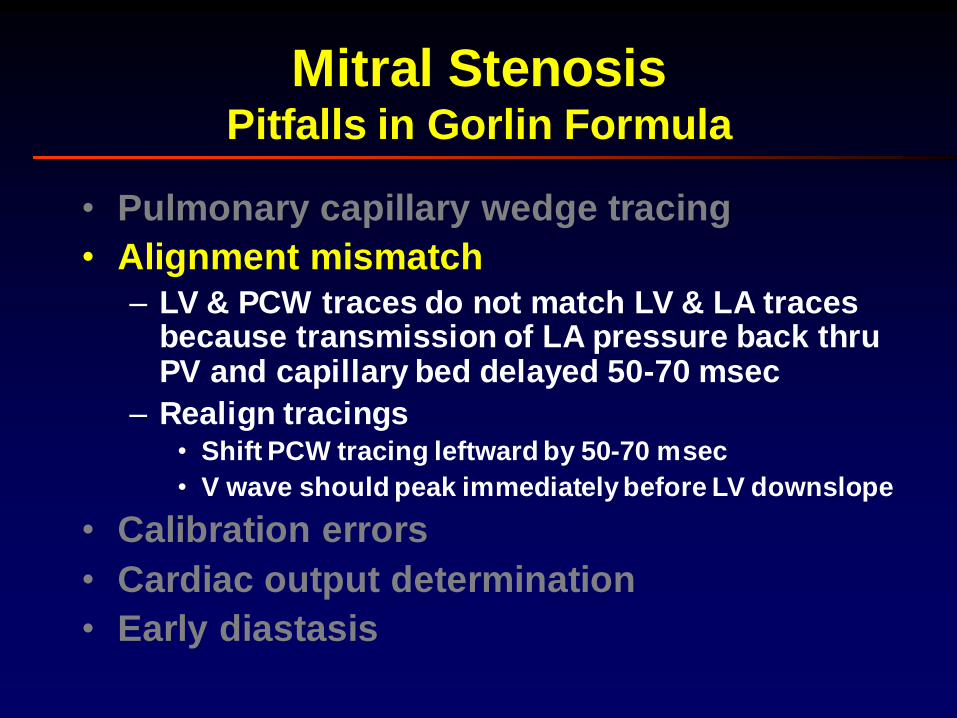
• Pulmonary capillary wedge tracing
• Alignment mismatch
– LV & PCW traces do not match LV & LA traces because transmission of LA pressure back thru PV and capillary bed delayed 50-70 msec
– Realign tracings• Shift PCW tracing leftward by 50-70 msec
• V wave should peak immediately before LV downslope
• Calibration errors
• Cardiac output determination
• Early diastasis
Mitral StenosisPitfalls in Gorlin Formula
• Pulmonary capillary wedge tracing
• Alignment mismatch
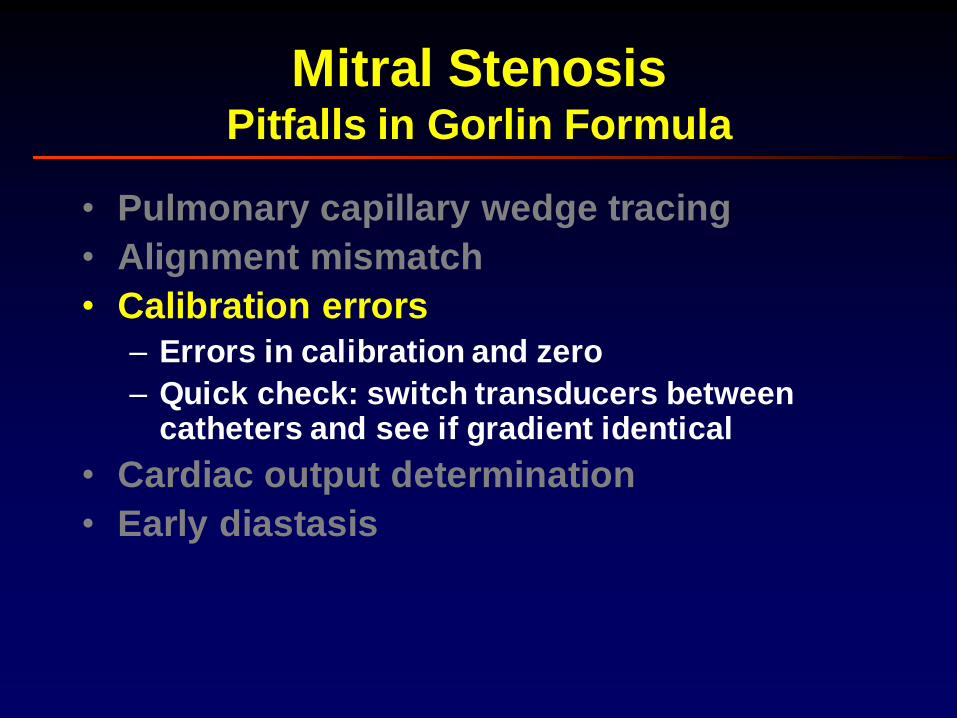
• Calibration errors
– Errors in calibration and zero
– Quick check: switch transducers between catheters and see if gradient identical
• Cardiac output determination
• Early diastasis
Mitral StenosisPitfalls in Gorlin Formula
• Pulmonary capillary wedge tracing
• Alignment mismatch
• Calibration errors
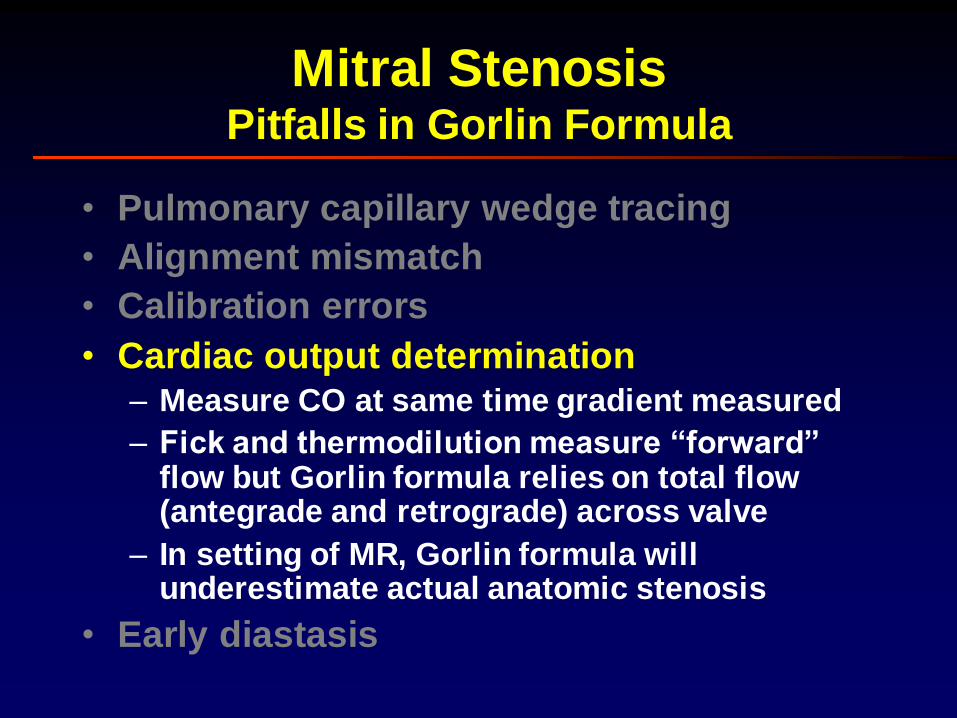
• Cardiac output determination– Measure CO at same time gradient measured
– Fick and thermodilution measure “forward” flow but Gorlin formula relies on total flow (antegrade and retrograde) across valve
– In setting of MR, Gorlin formula will underestimate actual anatomic stenosis
• Early diastasis
Mitral StenosisPitfalls in Gorlin Formula
• Pulmonary capillary wedge tracing
• Alignment mismatch
• Calibration errors
• Cardiac output determination
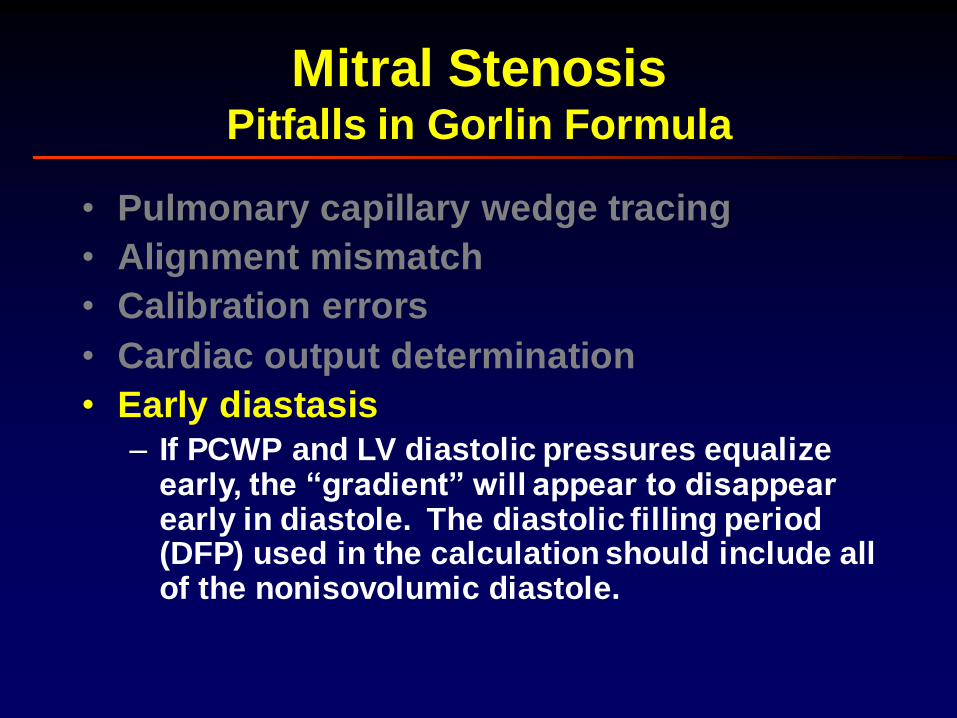
• Early diastasis– If PCWP and LV diastolic pressures equalize
early, the “gradient” will appear to disappear early in diastole. The diastolic filling period (DFP) used in the calculation should include all of the nonisovolumic diastole.
Mitral StenosisPitfalls in Gorlin Formula
0.0
1.0
2.0
3.0
4.0
5.0
6.0
7.0
8.0
9.0
10.0
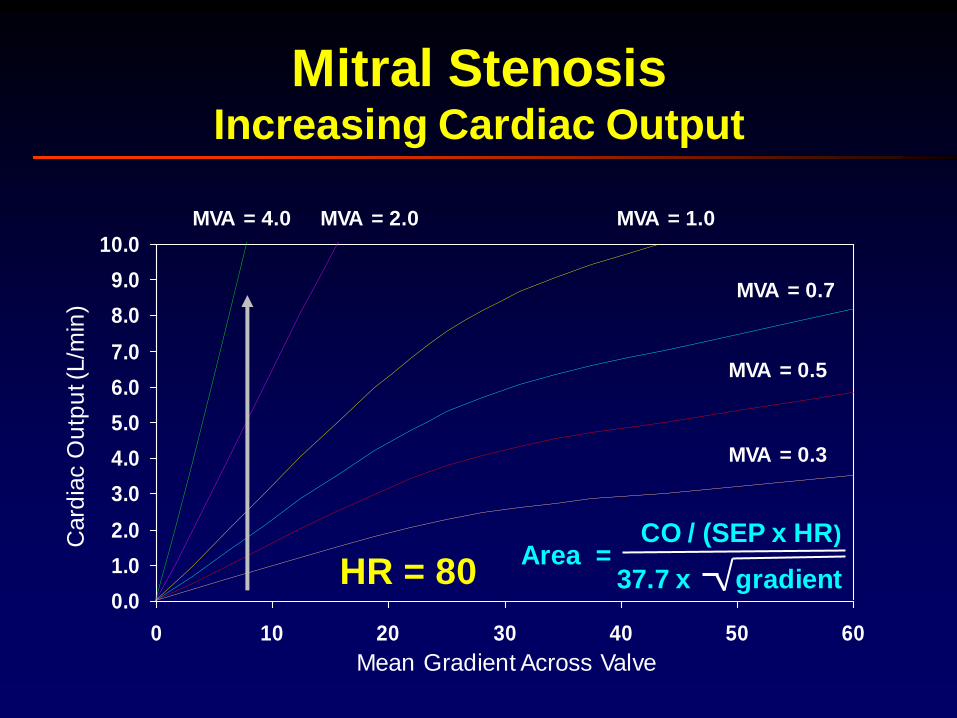
0 10 20 30 40 50 60
Mitral StenosisIncreasing Cardiac Output
Mean Gradient Across Valve
Card
iac O
utp
ut (
L/m
in)
MVA = 0.5
MVA = 0.3
MVA = 0.7
MVA = 1.0MVA = 2.0MVA = 4.0
Area =CO / (SEP x HR)
37.7 x gradientHR = 80
0.0
1.0
2.0
3.0
4.0
5.0
6.0
7.0
8.0
9.0
10.0
0 10 20 30 40 50 60
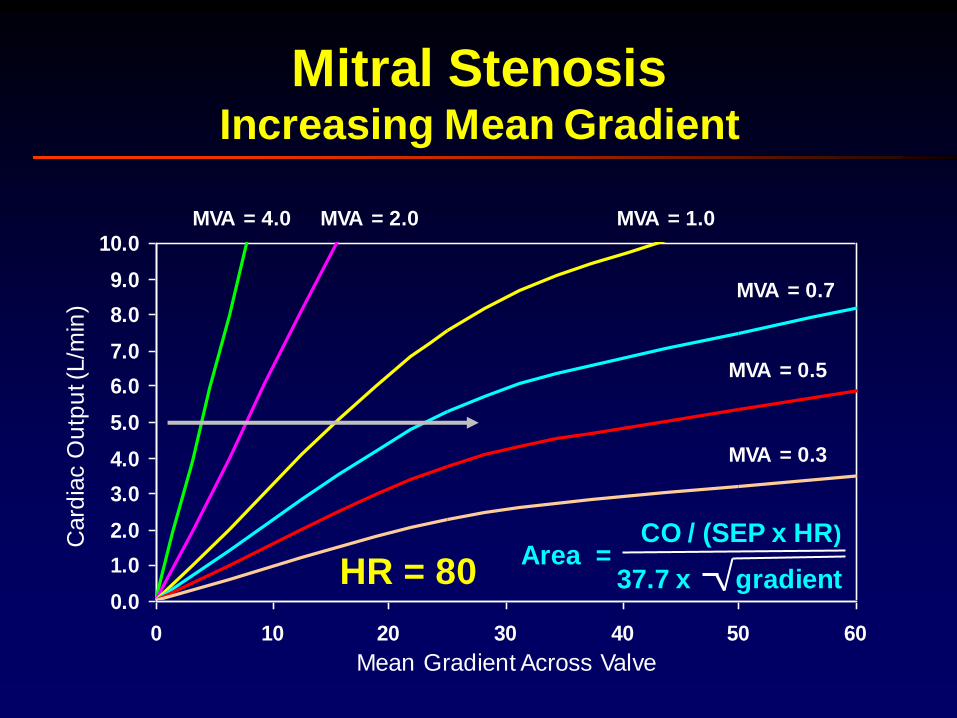
Mitral StenosisIncreasing Mean Gradient
Mean Gradient Across Valve
Card
iac O
utp
ut (
L/m
in)
HR = 80
MVA = 0.5
MVA = 0.3
MVA = 0.7
MVA = 1.0MVA = 2.0MVA = 4.0
Area =CO / (SEP x HR)
37.7 x gradient
0.0
1.0
2.0
3.0
4.0
5.0
6.0
7.0
8.0
9.0
10.0
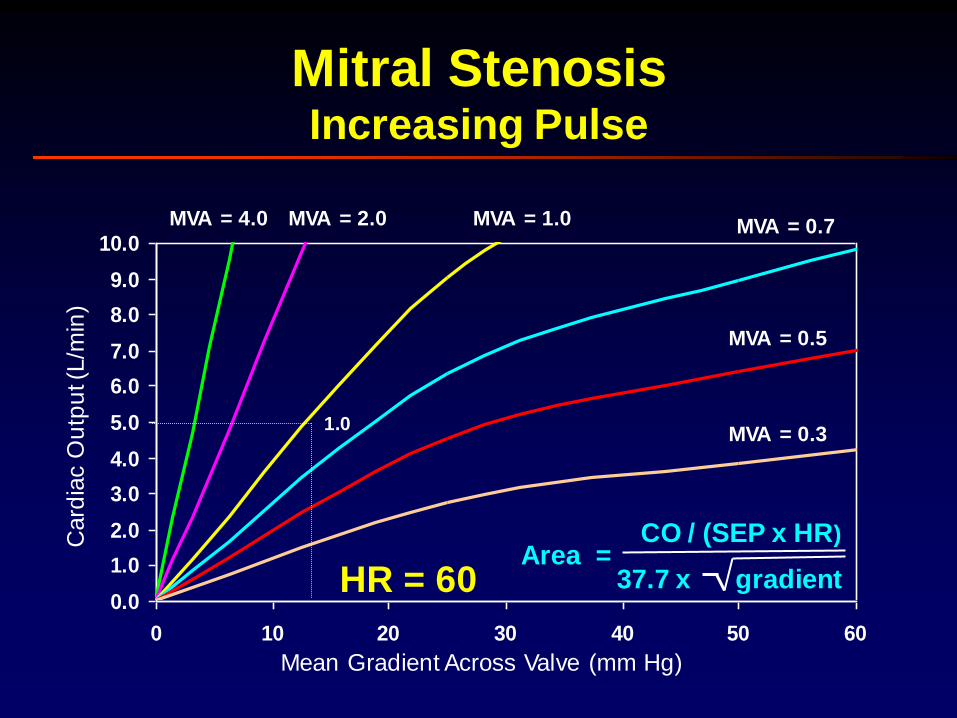
0 10 20 30 40 50 60
Mitral StenosisIncreasing Pulse
Card
iac O
utp
ut (
L/m
in)
MVA = 0.5
MVA = 0.3
MVA = 0.7MVA = 1.0MVA = 2.0MVA = 4.0
Mean Gradient Across Valve (mm Hg)
1.0
Area =CO / (SEP x HR)
37.7 x gradientHR = 60
0.0
1.0
2.0
3.0
4.0
5.0
6.0
7.0
8.0
9.0
10.0
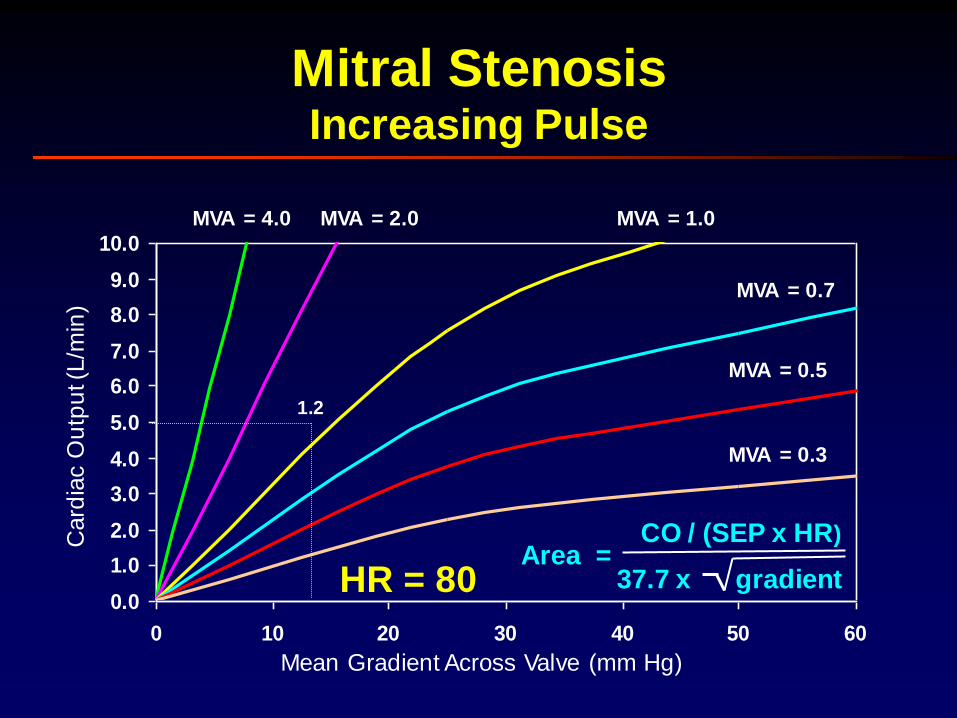
0 10 20 30 40 50 60
Mitral StenosisIncreasing Pulse
Card
iac O
utp
ut (
L/m
in)
MVA = 0.5
MVA = 0.3
MVA = 0.7
MVA = 1.0MVA = 2.0MVA = 4.0
1.2
Mean Gradient Across Valve (mm Hg)
Area =CO / (SEP x HR)
37.7 x gradientHR = 80
0.0
1.0
2.0
3.0
4.0
5.0
6.0
7.0
8.0
9.0
10.0
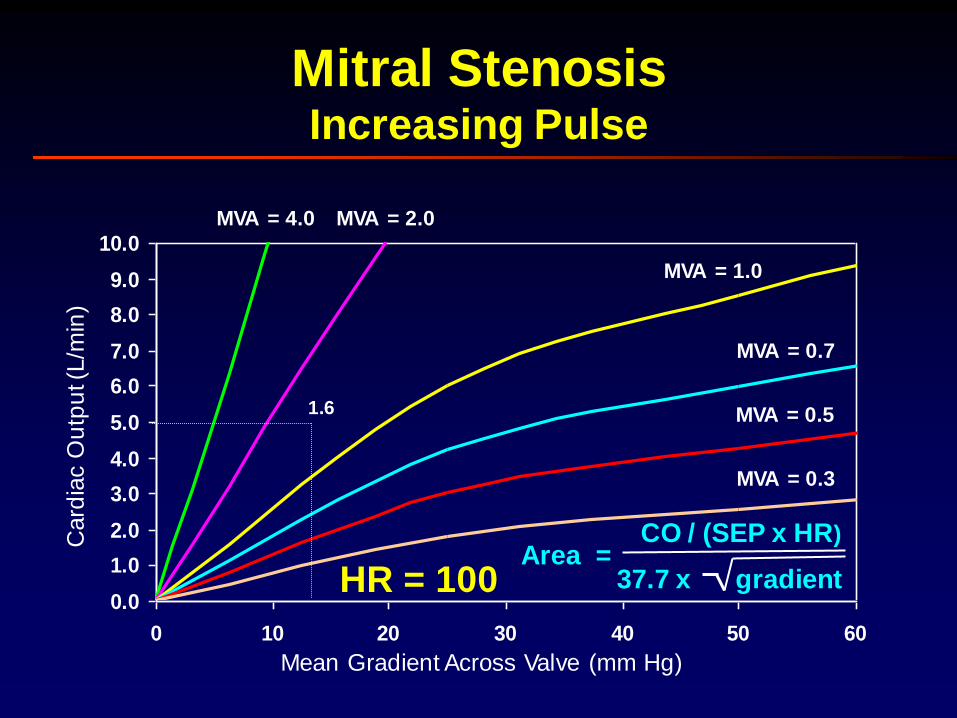
0 10 20 30 40 50 60
Mitral StenosisIncreasing Pulse
Card
iac O
utp
ut (
L/m
in)
MVA = 0.5
MVA = 0.3
MVA = 0.7
MVA = 1.0
MVA = 2.0MVA = 4.0
1.6
Mean Gradient Across Valve (mm Hg)
Area =CO / (SEP x HR)
37.7 x gradientHR = 100
0.0
1.0
2.0
3.0
4.0
5.0
6.0
7.0
8.0
9.0
10.0
0 10 20 30 40 50 60
Card
iac O
utp
ut (
L/m
in)
HR = 60
P = 12
MVA = 0.5
MVA = 0.3
MVA = 0.7MVA = 1.0MVA = 2.0MVA = 4.0
Mean Gradient Across Valve (mm Hg)
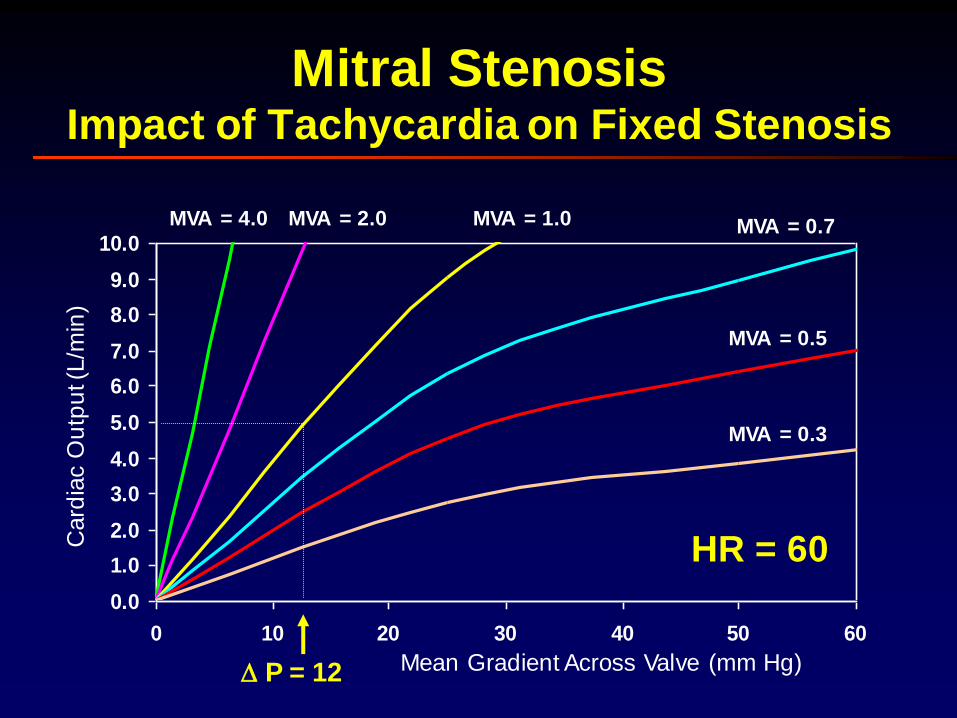
Mitral StenosisImpact of Tachycardia on Fixed Stenosis
0.0
1.0
2.0
3.0
4.0
5.0
6.0
7.0
8.0
9.0
10.0
0 10 20 30 40 50 60
Mean Gradient Across Valve (mm Hg)
Card
iac O
utp
ut (
L/m
in)
HR = 80
MVA = 0.5
MVA = 0.3
MVA = 0.7
MVA = 1.0MVA = 2.0MVA = 4.0
P = 16
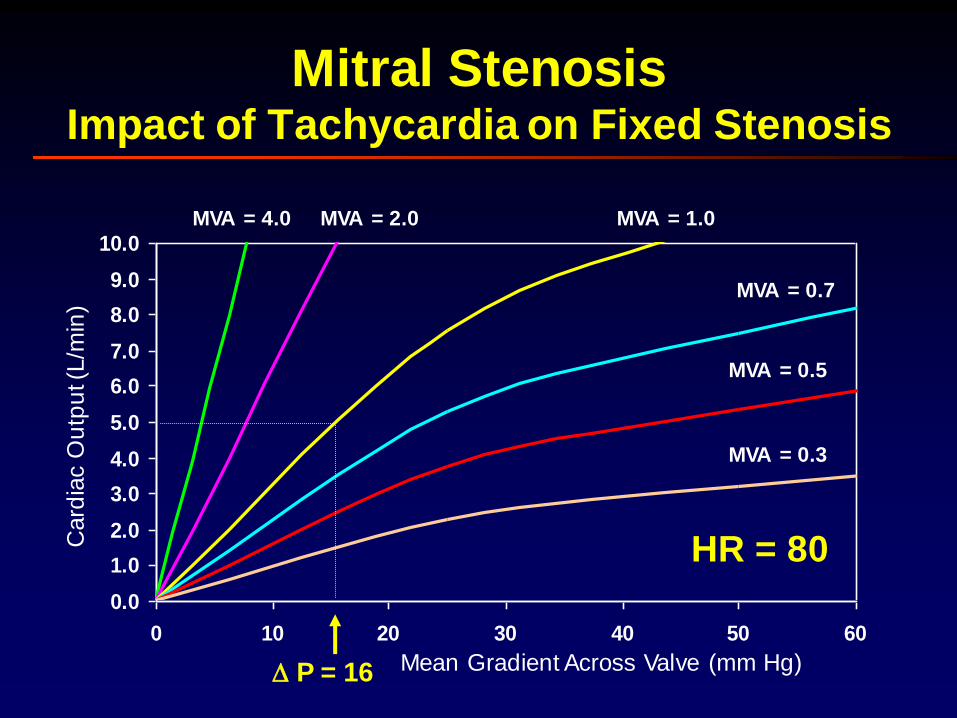
Mitral StenosisImpact of Tachycardia on Fixed Stenosis
0.0
1.0
2.0
3.0
4.0
5.0
6.0
7.0
8.0
9.0
10.0
0 10 20 30 40 50 60
Card
iac O
utp
ut (
L/m
in)
MVA = 0.5
MVA = 0.3
MVA = 0.7
MVA = 1.0
MVA = 2.0MVA = 4.0
HR = 100
Mean Gradient Across Valve (mm Hg) P = 20
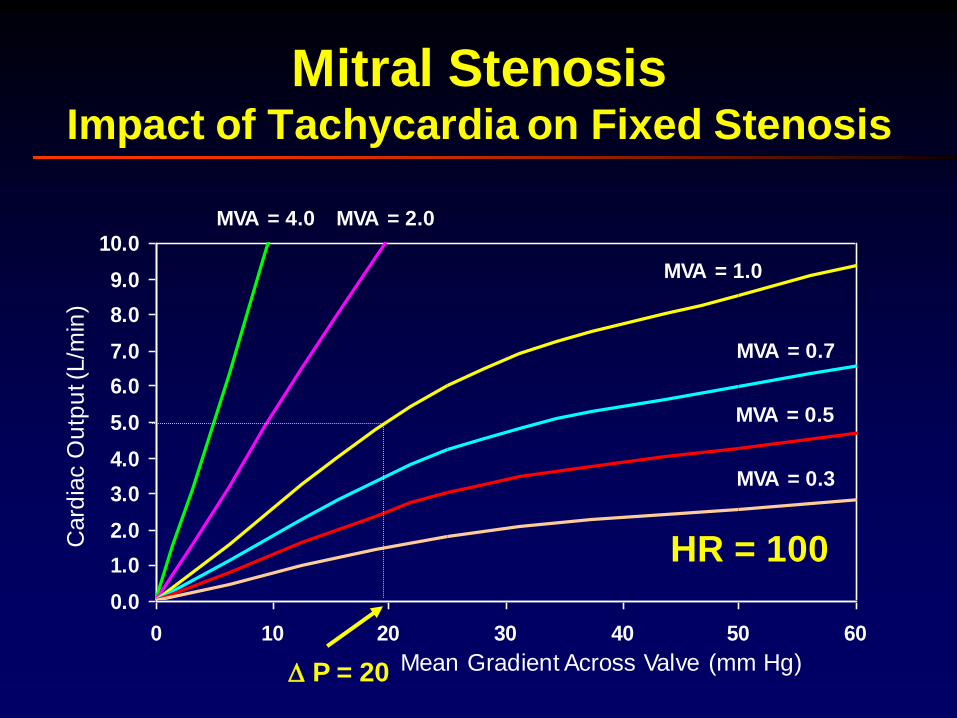
Mitral StenosisImpact of Tachycardia on Fixed Stenosis
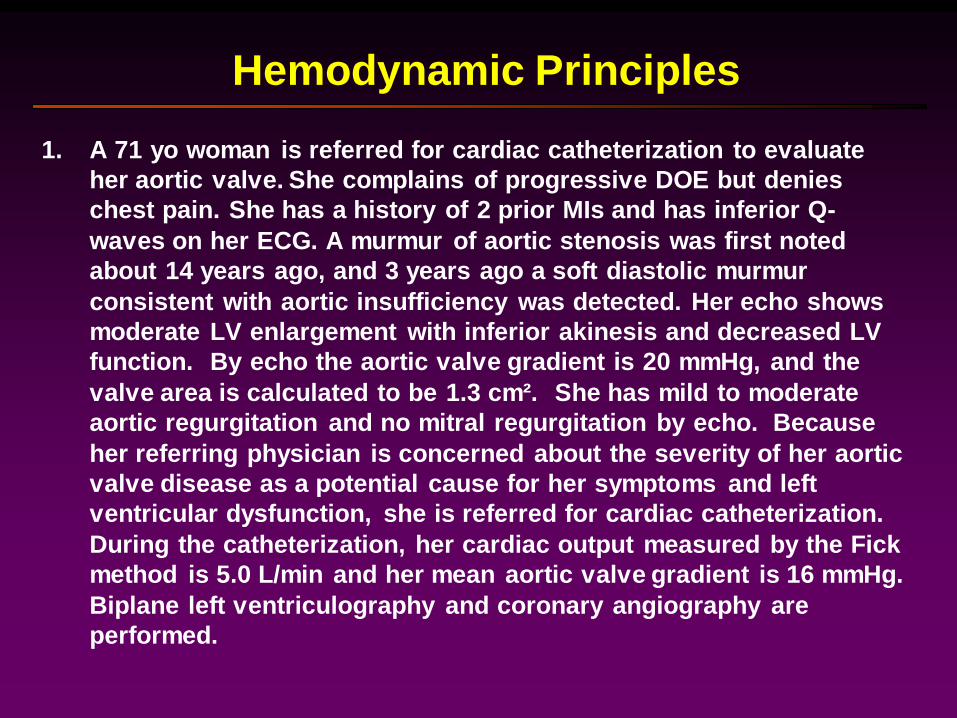
1. A 71 yo woman is referred for cardiac catheterization to evaluate
her aortic valve. She complains of progressive DOE but denies
chest pain. She has a history of 2 prior MIs and has inferior Q-
waves on her ECG. A murmur of aortic stenosis was first noted
about 14 years ago, and 3 years ago a soft diastolic murmur
consistent with aortic insufficiency was detected. Her echo shows
moderate LV enlargement with inferior akinesis and decreased LV
function. By echo the aortic valve gradient is 20 mmHg, and the
valve area is calculated to be 1.3 cm². She has mild to moderate
aortic regurgitation and no mitral regurgitation by echo. Because
her referring physician is concerned about the severity of her aortic
valve disease as a potential cause for her symptoms and left
ventricular dysfunction, she is referred for cardiac catheterization.
During the catheterization, her cardiac output measured by the Fick
method is 5.0 L/min and her mean aortic valve gradient is 16 mmHg.
Biplane left ventriculography and coronary angiography are
performed.
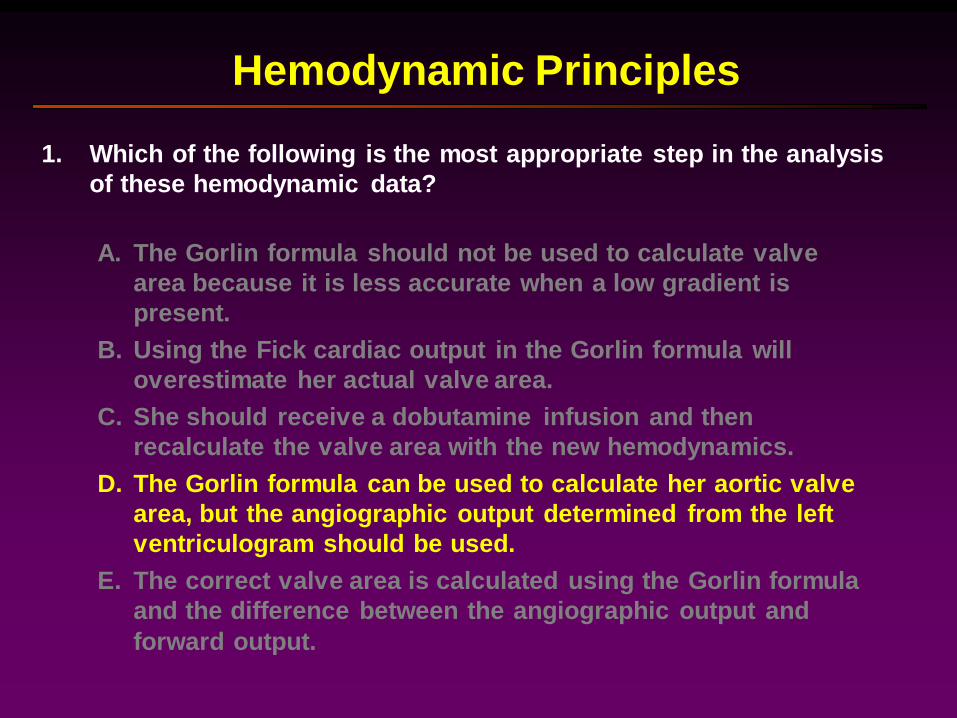
Hemodynamic Principles
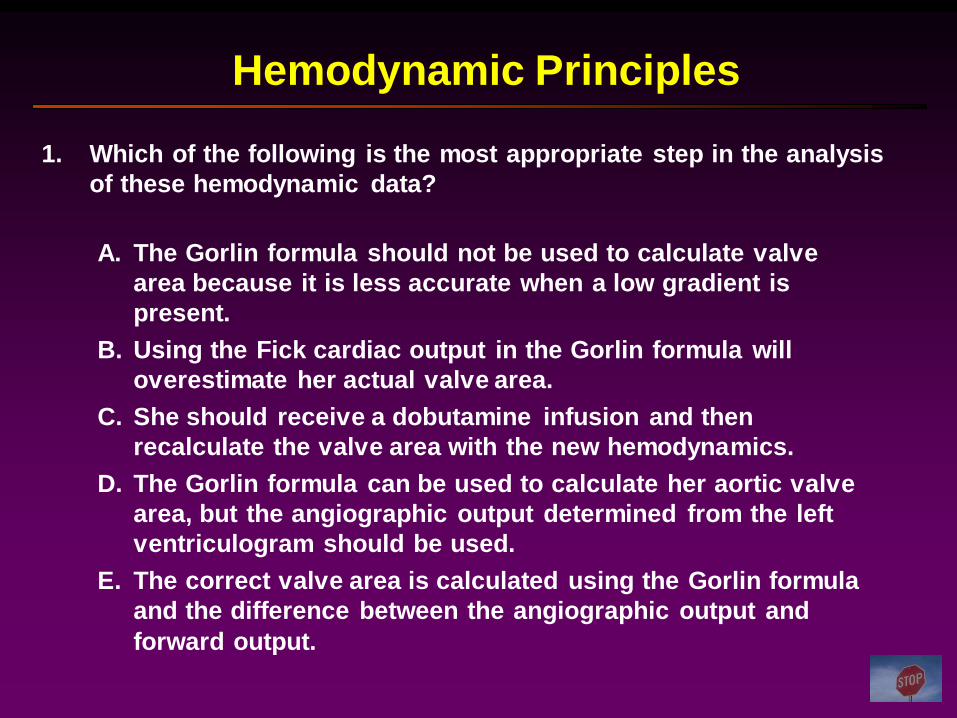
1. Which of the following is the most appropriate step in the analysis
of these hemodynamic data?
Hemodynamic Principles
A. The Gorlin formula should not be used to calculate valve
area because it is less accurate when a low gradient is
present.
B. Using the Fick cardiac output in the Gorlin formula will
overestimate her actual valve area.
C. She should receive a dobutamine infusion and then
recalculate the valve area with the new hemodynamics.
D. The Gorlin formula can be used to calculate her aortic valve
area, but the angiographic output determined from the left
ventriculogram should be used.
E. The correct valve area is calculated using the Gorlin formula
and the difference between the angiographic output and
forward output.
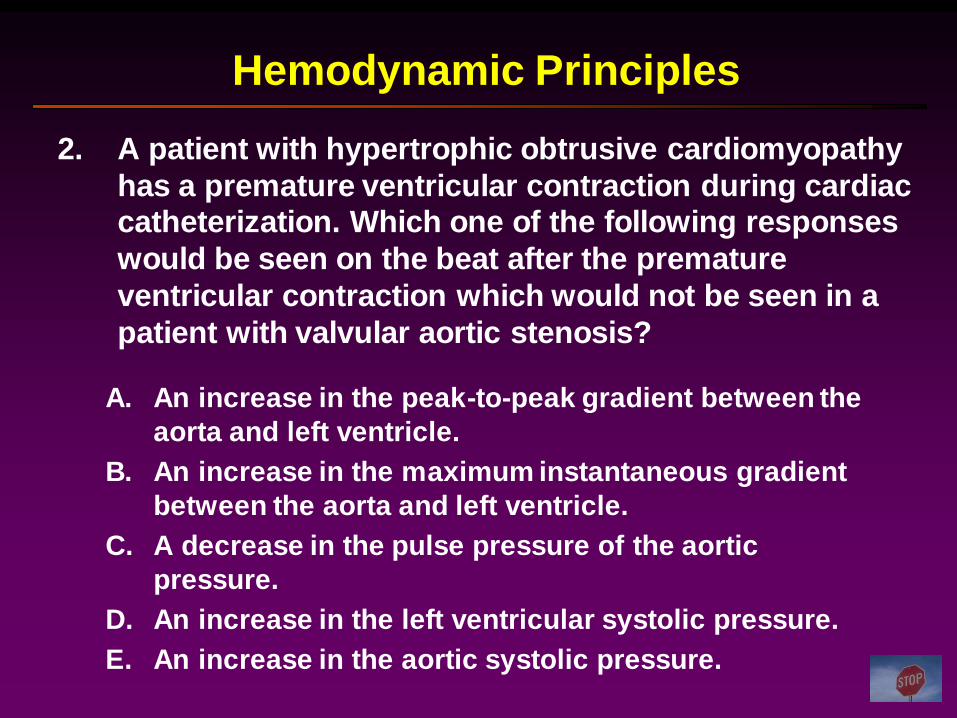
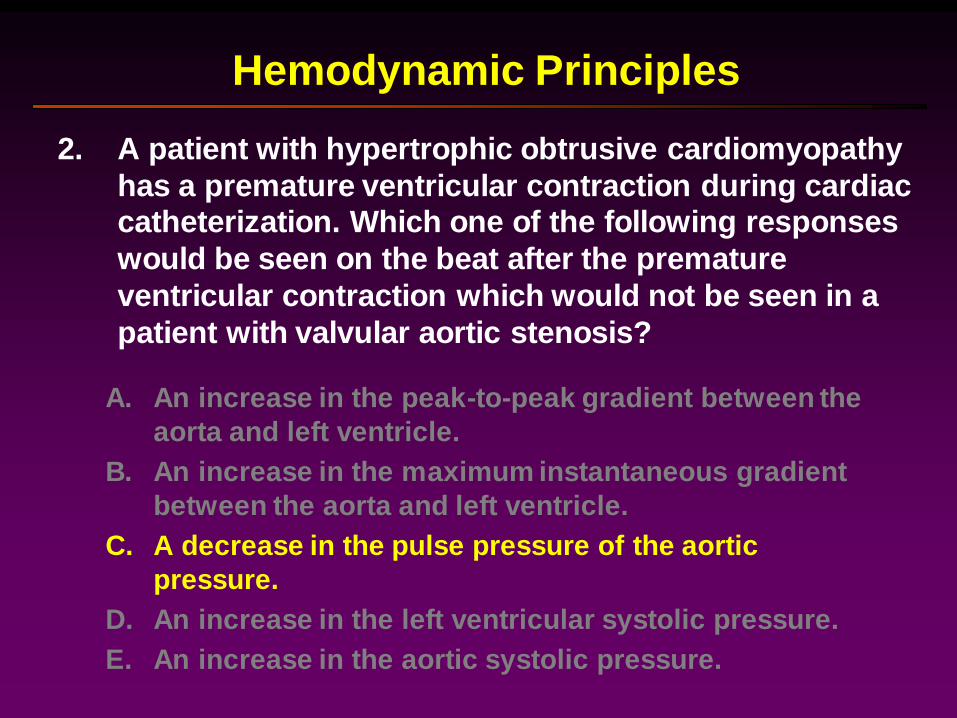
2. A patient with hypertrophic obtrusive cardiomyopathy
has a premature ventricular contraction during cardiac catheterization. Which one of the following responses
would be seen on the beat after the premature
ventricular contraction which would not be seen in a
patient with valvular aortic stenosis?
Hemodynamic Principles
A. An increase in the peak-to-peak gradient between the
aorta and left ventricle.
B. An increase in the maximum instantaneous gradient
between the aorta and left ventricle.
C. A decrease in the pulse pressure of the aortic
pressure.
D. An increase in the left ventricular systolic pressure.
E. An increase in the aortic systolic pressure.
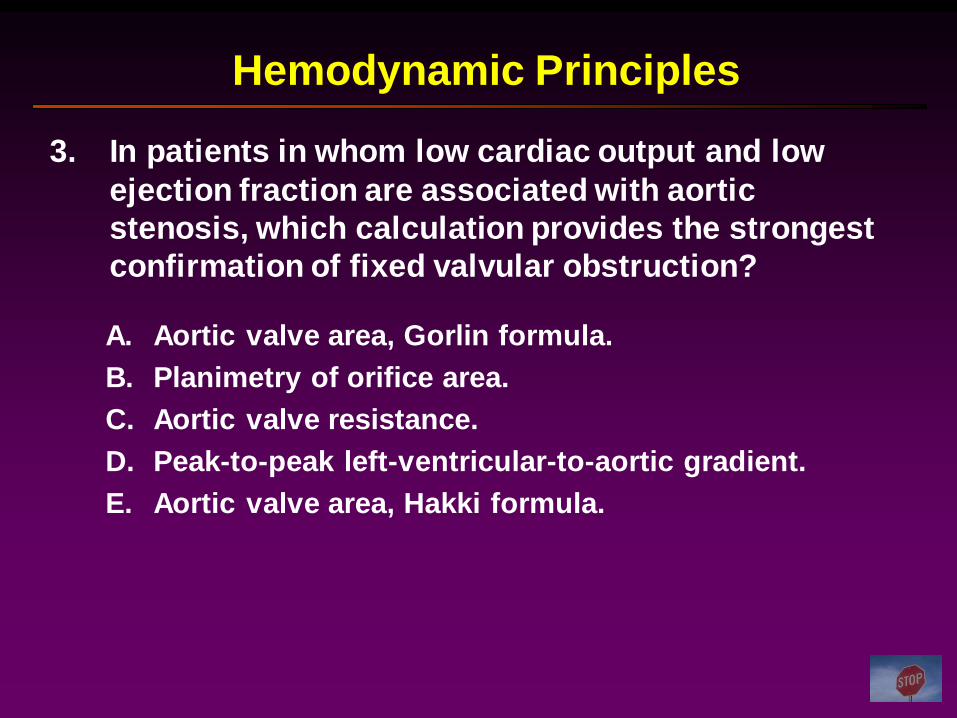
3. In patients in whom low cardiac output and low
ejection fraction are associated with aortic
stenosis, which calculation provides the strongest
confirmation of fixed valvular obstruction?
Hemodynamic Principles
A. Aortic valve area, Gorlin formula.
B. Planimetry of orifice area.
C. Aortic valve resistance.
D. Peak-to-peak left-ventricular-to-aortic gradient.
E. Aortic valve area, Hakki formula.
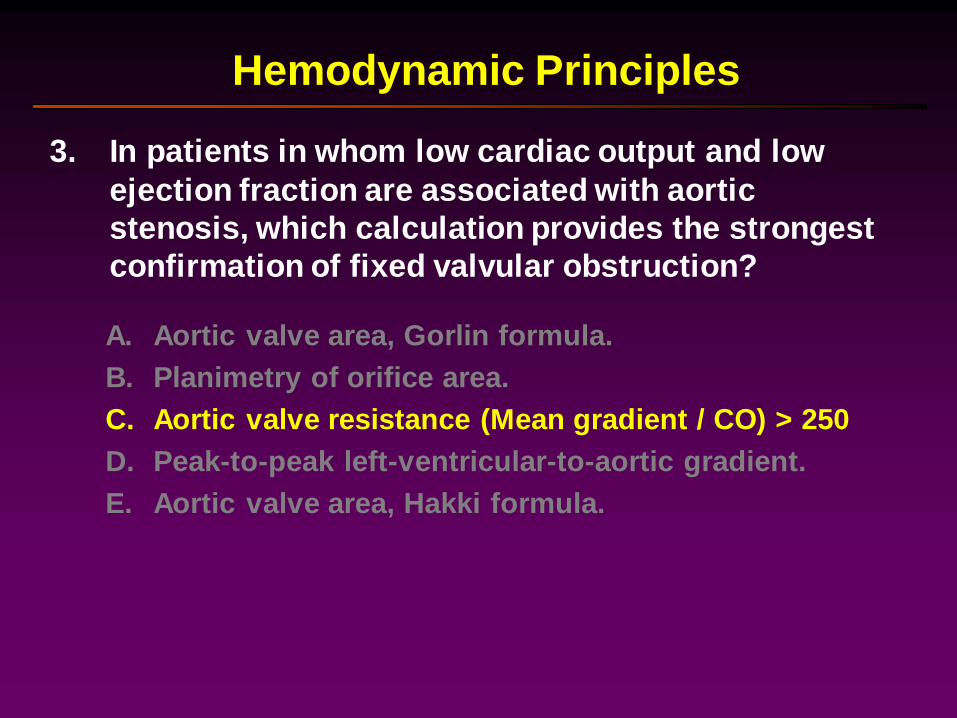
3. In patients in whom low cardiac output and low
ejection fraction are associated with aortic
stenosis, which calculation provides the strongest
confirmation of fixed valvular obstruction?
Hemodynamic Principles
A. Aortic valve area, Gorlin formula.
B. Planimetry of orifice area.
C. Aortic valve resistance (Mean gradient / CO) > 250
D. Peak-to-peak left-ventricular-to-aortic gradient.
E. Aortic valve area, Hakki formula.
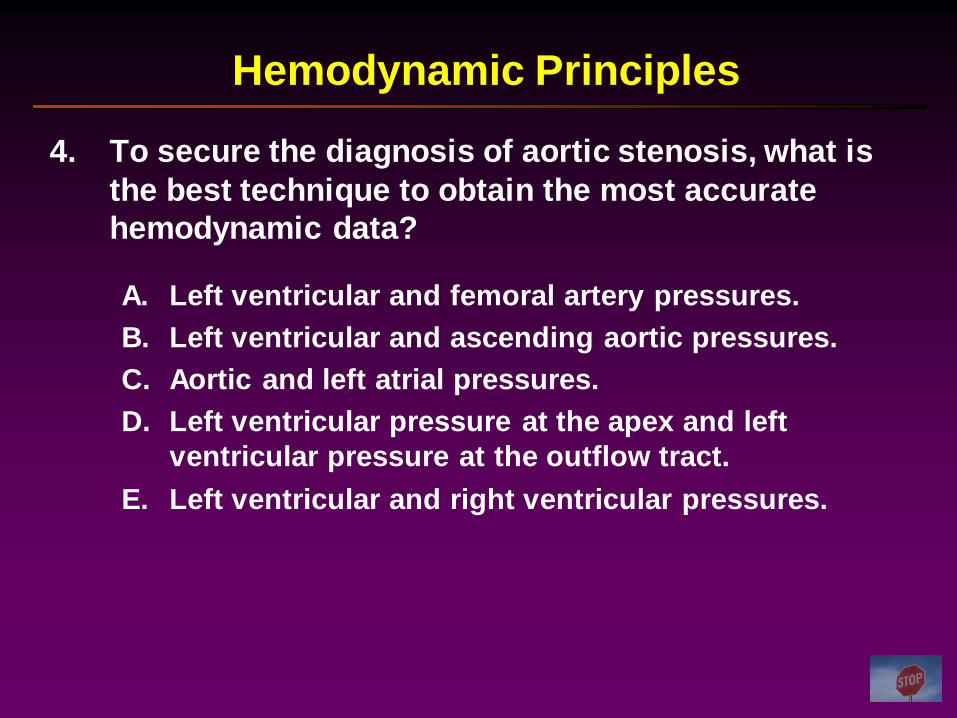
4. To secure the diagnosis of aortic stenosis, what is
the best technique to obtain the most accurate
hemodynamic data?
Hemodynamic Principles
A. Left ventricular and femoral artery pressures.
B. Left ventricular and ascending aortic pressures.
C. Aortic and left atrial pressures.
D. Left ventricular pressure at the apex and left
ventricular pressure at the outflow tract.
E. Left ventricular and right ventricular pressures.
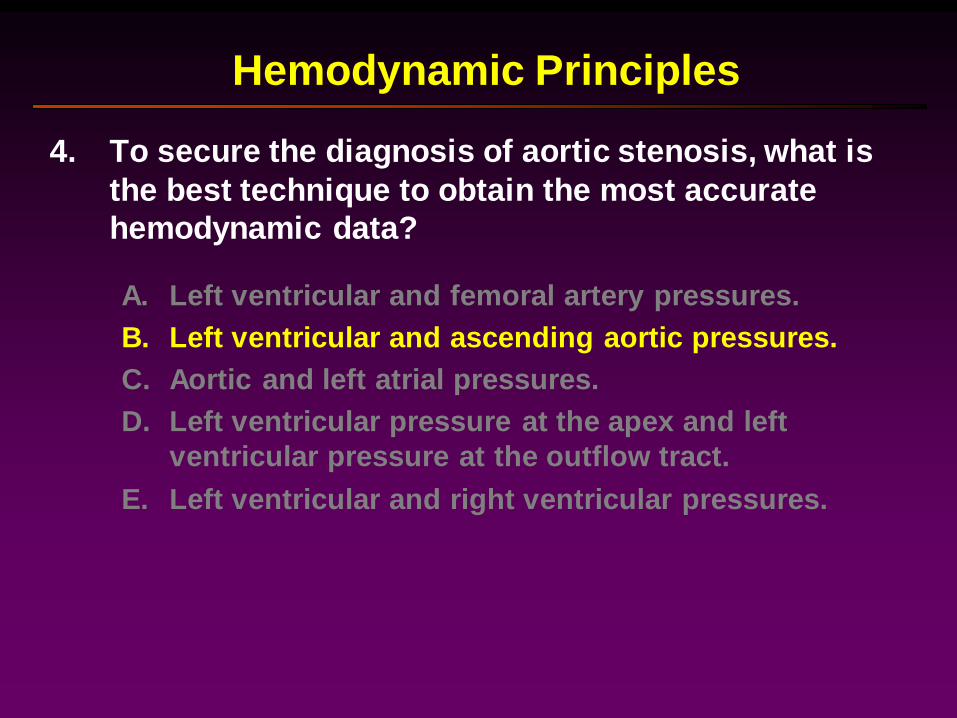
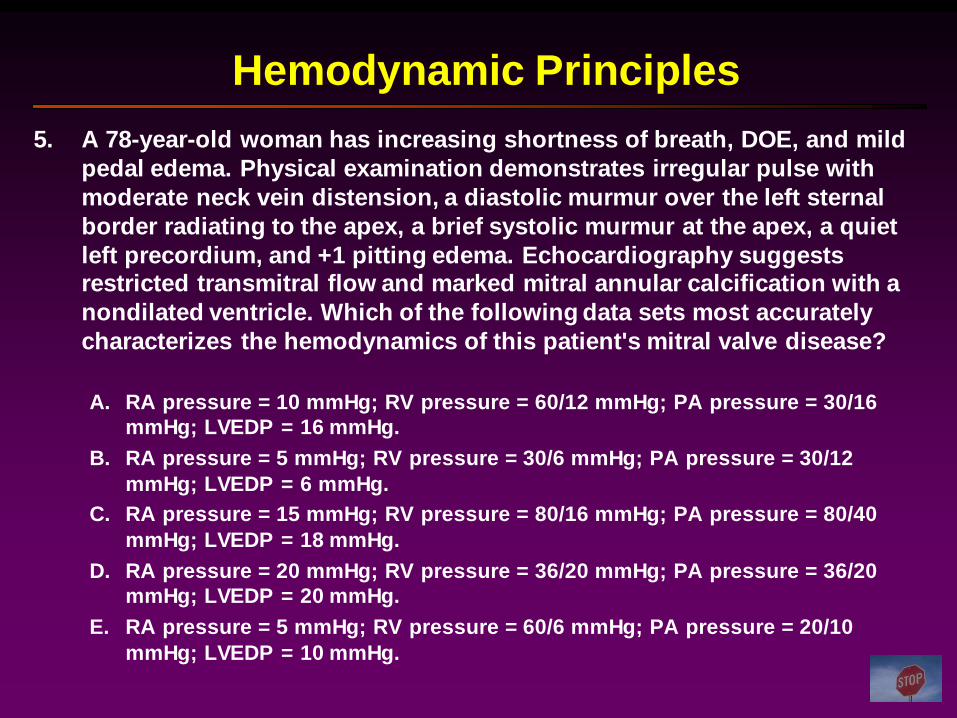
5. A 78-year-old woman has increasing shortness of breath, DOE, and mild
pedal edema. Physical examination demonstrates irregular pulse with
moderate neck vein distension, a diastolic murmur over the left sternal
border radiating to the apex, a brief systolic murmur at the apex, a quiet
left precordium, and +1 pitting edema. Echocardiography suggests restricted transmitral flow and marked mitral annular calcification with a
nondilated ventricle. Which of the following data sets most accurately
characterizes the hemodynamics of this patient's mitral valve disease?
Hemodynamic Principles
A. RA pressure = 10 mmHg; RV pressure = 60/12 mmHg; PA pressure = 30/16
mmHg; LVEDP = 16 mmHg.
B. RA pressure = 5 mmHg; RV pressure = 30/6 mmHg; PA pressure = 30/12
mmHg; LVEDP = 6 mmHg.
C. RA pressure = 15 mmHg; RV pressure = 80/16 mmHg; PA pressure = 80/40
mmHg; LVEDP = 18 mmHg.
D. RA pressure = 20 mmHg; RV pressure = 36/20 mmHg; PA pressure = 36/20
mmHg; LVEDP = 20 mmHg.
E. RA pressure = 5 mmHg; RV pressure = 60/6 mmHg; PA pressure = 20/10
mmHg; LVEDP = 10 mmHg.
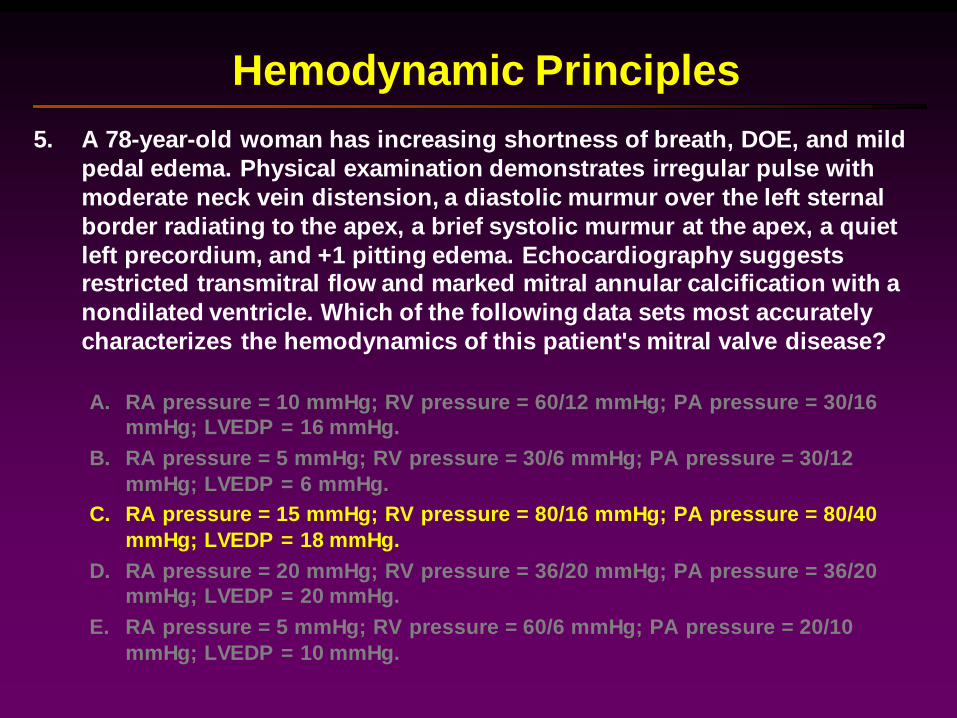
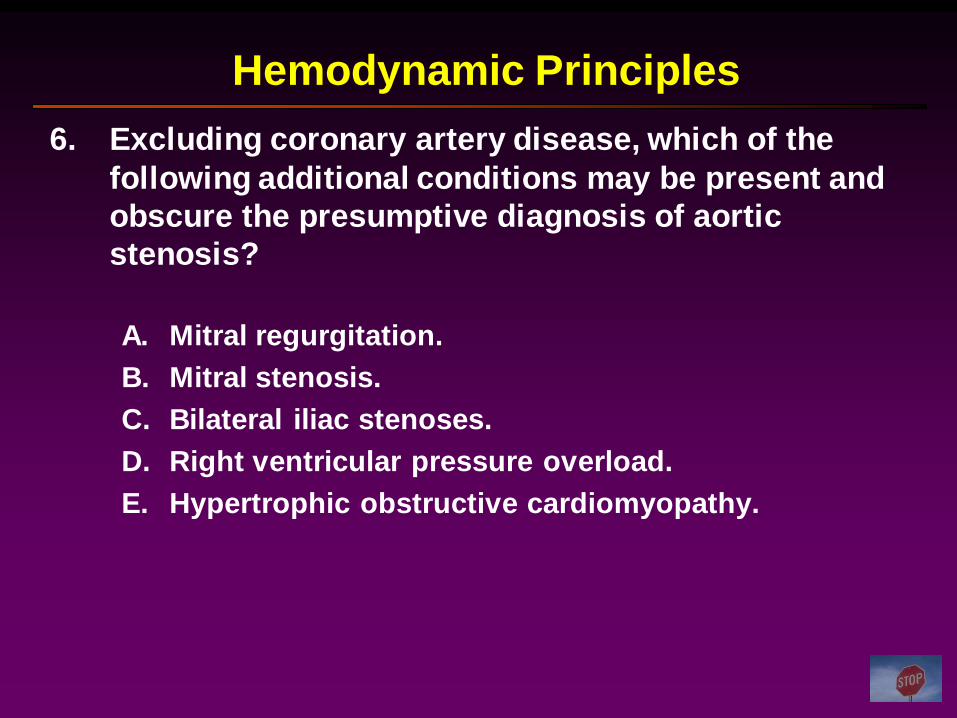
6. Excluding coronary artery disease, which of the
following additional conditions may be present and
obscure the presumptive diagnosis of aortic
stenosis?
Hemodynamic Principles
A. Mitral regurgitation.
B. Mitral stenosis.
C. Bilateral iliac stenoses.
D. Right ventricular pressure overload.
E. Hypertrophic obstructive cardiomyopathy.
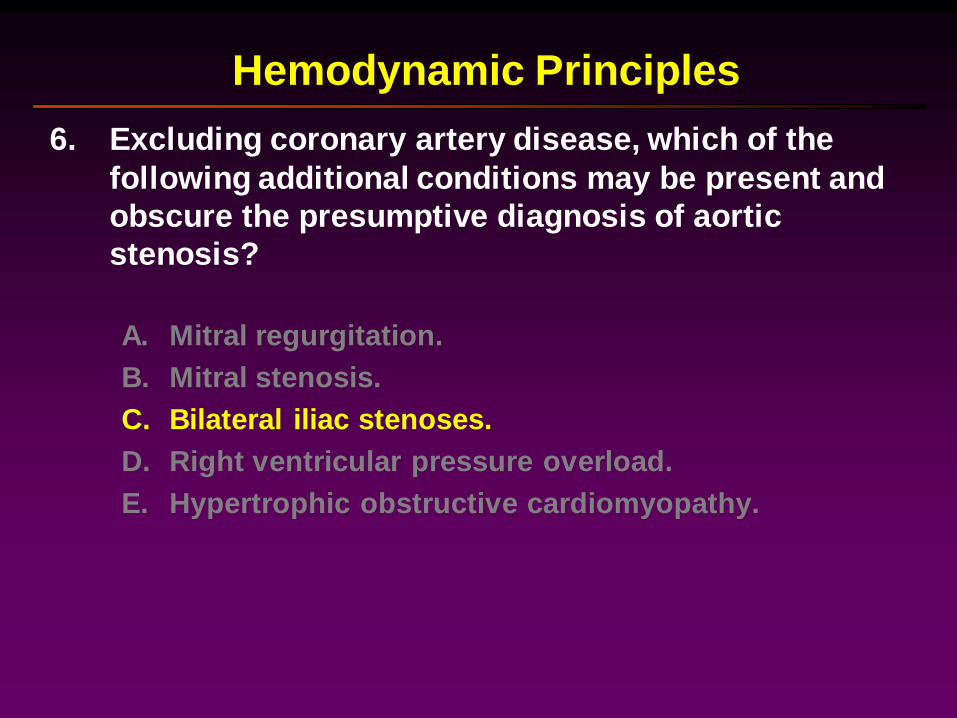
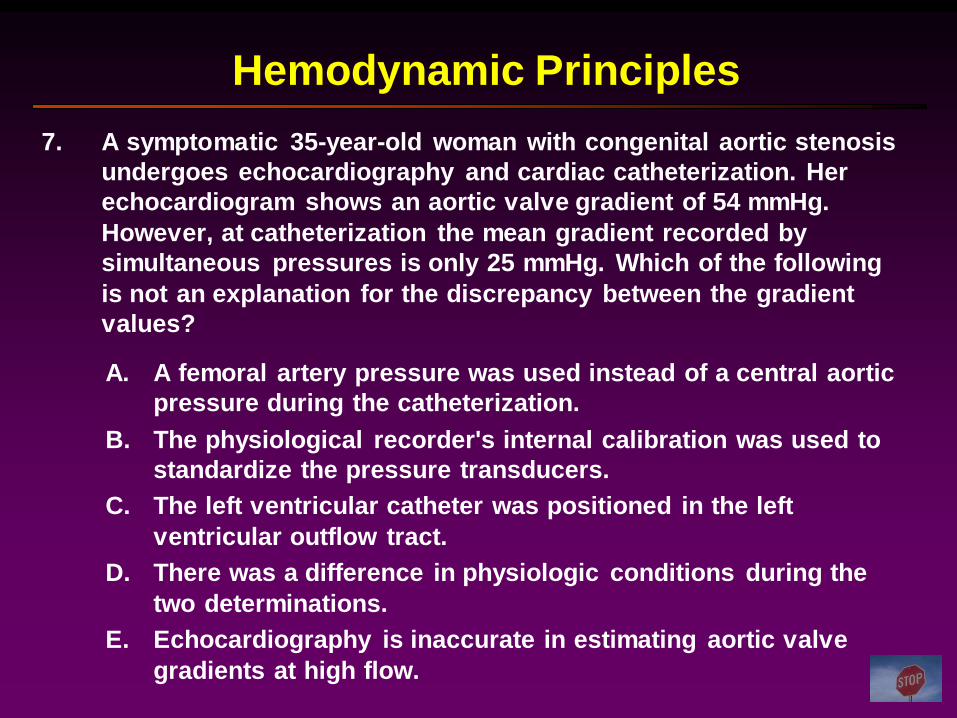
7. A symptomatic 35-year-old woman with congenital aortic stenosis
undergoes echocardiography and cardiac catheterization. Her
echocardiogram shows an aortic valve gradient of 54 mmHg.
However, at catheterization the mean gradient recorded by
simultaneous pressures is only 25 mmHg. Which of the following
is not an explanation for the discrepancy between the gradient
values?
Hemodynamic Principles
A. A femoral artery pressure was used instead of a central aortic
pressure during the catheterization.
B. The physiological recorder's internal calibration was used to
standardize the pressure transducers.
C. The left ventricular catheter was positioned in the left
ventricular outflow tract.
D. There was a difference in physiologic conditions during the
two determinations.
E. Echocardiography is inaccurate in estimating aortic valve
gradients at high flow.
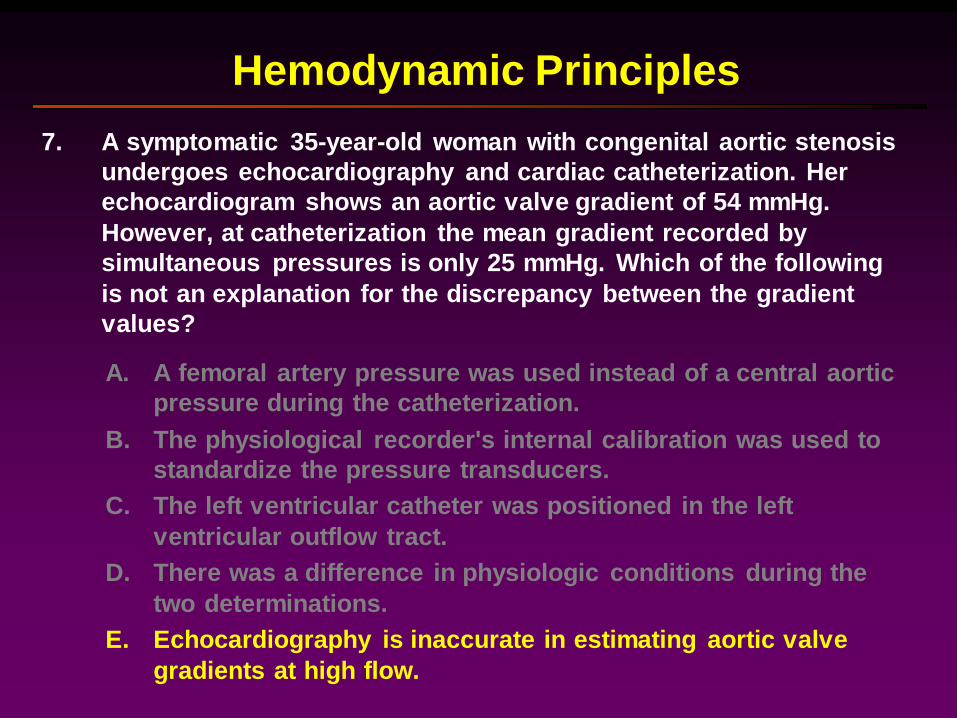
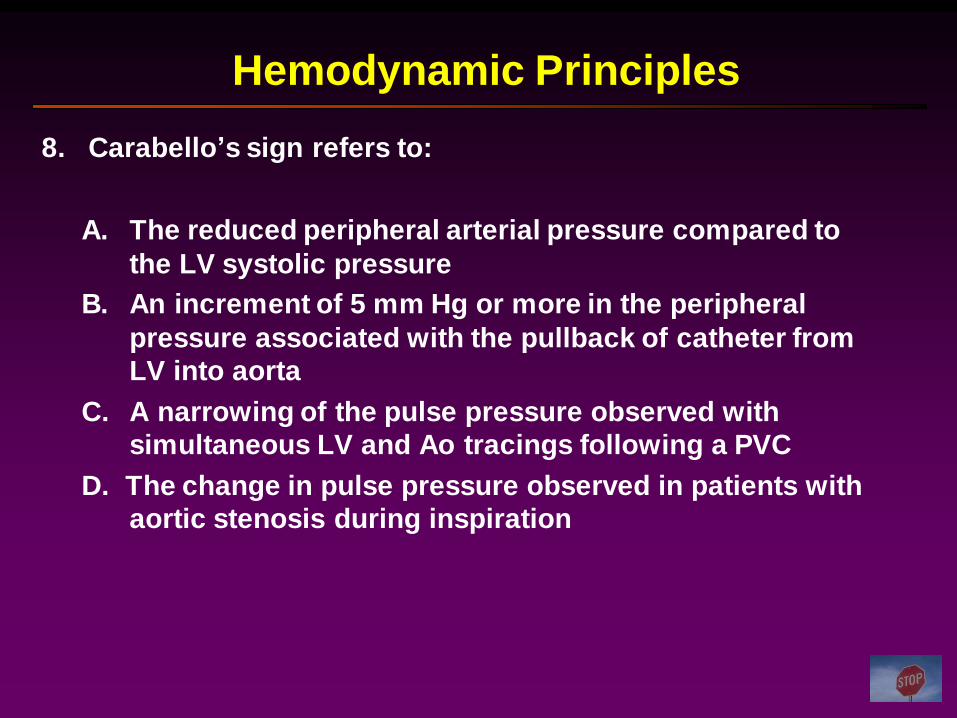
8. Carabello’s sign refers to:
Hemodynamic Principles
A. The reduced peripheral arterial pressure compared to
the LV systolic pressure
B. An increment of 5 mm Hg or more in the peripheral
pressure associated with the pullback of catheter from
LV into aorta
C. A narrowing of the pulse pressure observed with
simultaneous LV and Ao tracings following a PVC
D. The change in pulse pressure observed in patients with
aortic stenosis during inspiration
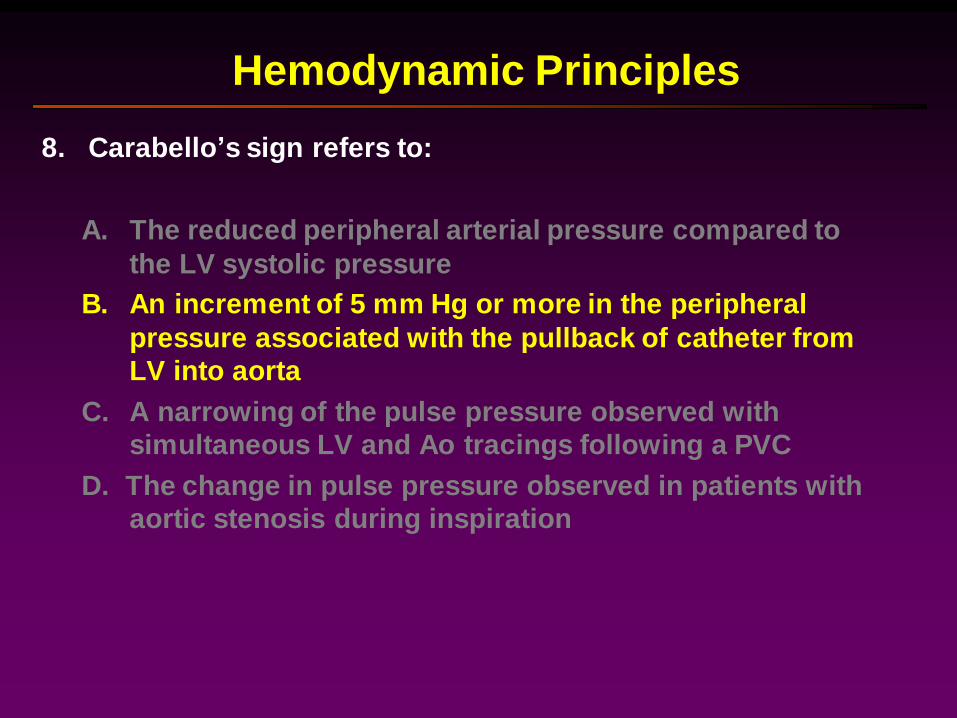
9. A patient with aortic stenosis is referred to you for a second
opinion to see if aortic valve replacement is warranted.
Specifically, you must compare the risk of the operation with
the potential benefit.
Hemodynamic Principles
A. A 68 year old patient with CHF, LVEF=20%, an AVA of 0.6 cm2, an mean transvalvular gradient of 60 mm Hg.
B. A 67 year old patient with CHF, LVEF=20%, an AVA of 0.6 cm2, an mean transvalvular gradient of 25 mm Hg in whom dobutamine doubles his CO and increases the valve gradient such that the calculated AVA remains 0.6 cm2.
C. A 66 year old patient with CHF, LVEF=20%, an AVA of 0.6 cm2, an mean transvalvular gradient of 25 mm Hg in whom dobutamine doubles his CO with little change in the gradient.
D. A 74 year old man who is symptomatic with normal LV function, a valve area of 0.9 cm2, and a mean transvalvular gradient of 70 mm Hg.
E. An 80 year old otherwise healthy man, asymptomatic, with a valve area of 0.7 cm2 and a mean transvalvular gradient of 70 mm Hg.
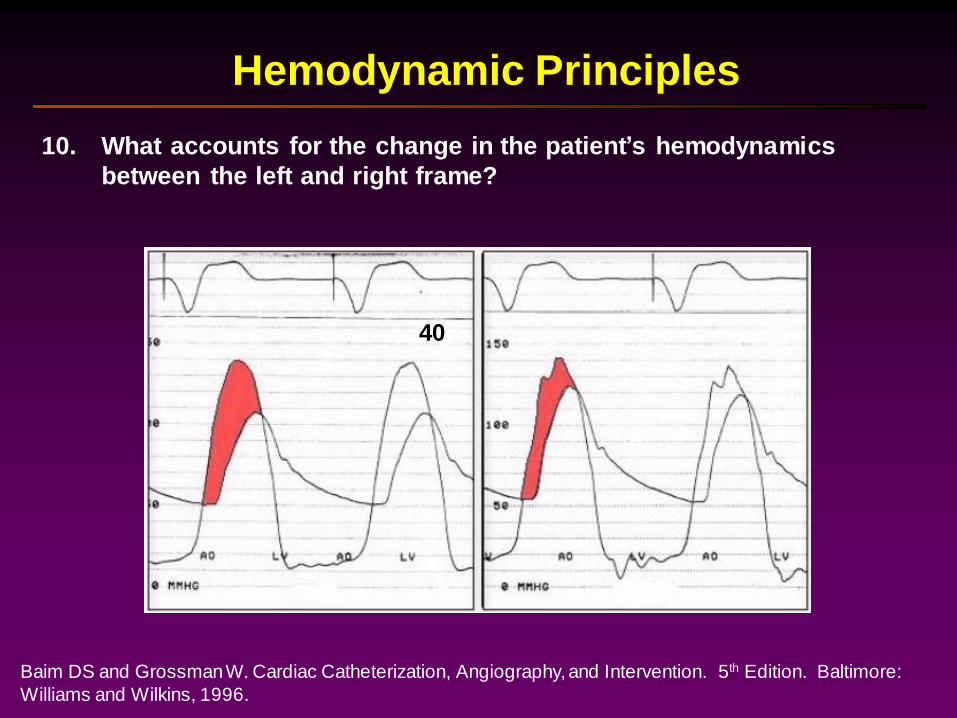
Baim DS and Grossman W. Cardiac Catheterization, Angiography, and Intervention. 5th Edition. Baltimore:
Williams and Wilkins, 1996.
Hemodynamic Principles
10. What accounts for the change in the patient’s hemodynamics
between the left and right frame?
40

The End