HEMATOLOGY CASE STUDIES - · PDF filehematology case studies barbara j connell ms,mt(ascp)sh...
28
1 HEMATOLOGY CASE STUDIES Barbara J Connell MS,MT(ASCP)SH Senior Product Manager RBC Parameters
Transcript of HEMATOLOGY CASE STUDIES - · PDF filehematology case studies barbara j connell ms,mt(ascp)sh...

1
HEMATOLOGY CASE
STUDIES
Barbara J Connell MS,MT(ASCP)SH
Senior Product Manager
RBC Parameters

2
SMALL PALE RED CELLSIRON DEFICIENCY
SMALL PALE RED CELLSANEMIA OF CHRONIC DISEASE
3
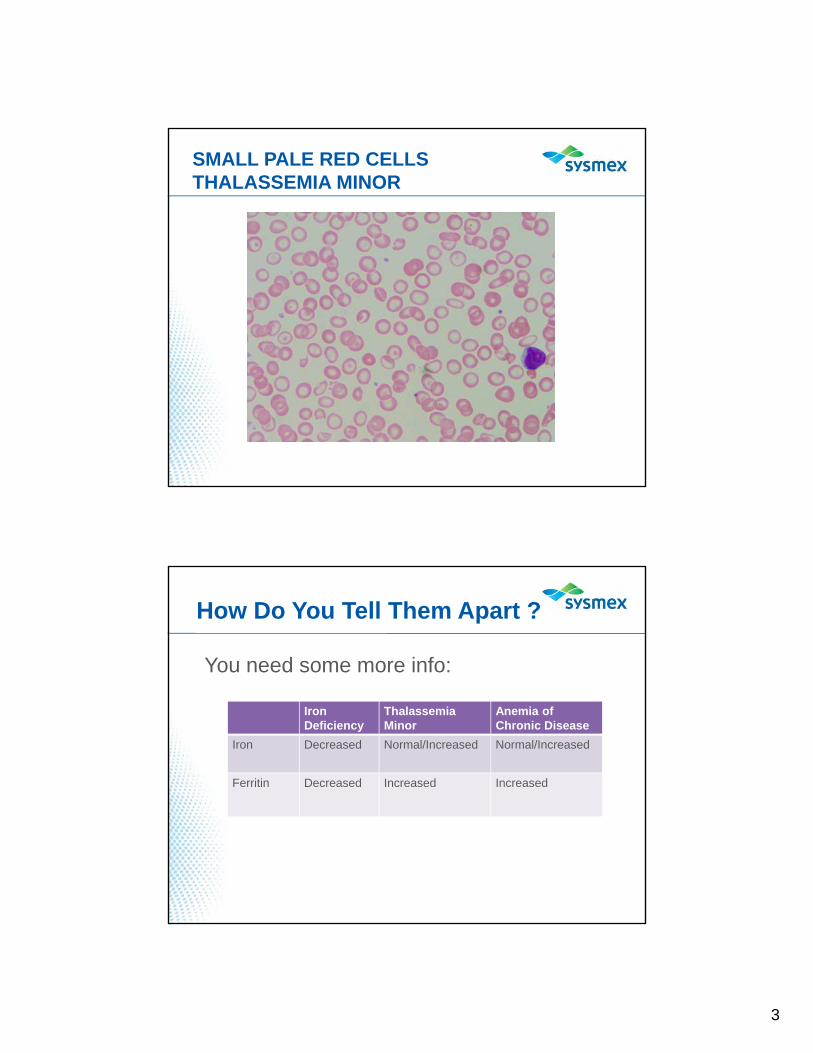
SMALL PALE RED CELLSTHALASSEMIA MINOR
How Do You Tell Them Apart ?
You need some more info:
IronDeficiency
ThalassemiaMinor
Anemia of Chronic Disease
Iron Decreased Normal/Increased Normal/Increased
Ferritin Decreased Increased Increased

4
RDW
Red Cell Distribution Width
Iron Deficiency
IRON 8 ug/dl (37 – 170)
FERRITIN 4 (10 – 200) F / 51

5
Anemia of Chronic Disease
IRON 83 ug/dl (37 – 170)
FERRITIN 337 (10 – 200)M/64 - DIABETES, CHRONIC RENAL INSUFFICIENCY
Thalassemia Minor
IRON 70 ug/dl (37 – 170)
FERRITIN 422 (10 – 200)
HGB A2 4.1 ( 1.8 – 3.4)
M / 61

6
Checkout the RDW-SD & RDW-CV
IRON DEFICIENCY ANEMIA OF CHRONIC DISEASE THALASSEMIA MINOR
RDW –SD 55.7 RDW –SD 57.9 RDW –SD 33.8
RDW-CV 22.1 RDW-CV 20.4 RDW-CV 14.8
RDW - CV
(L1) (L2)

7
RDW-SD
Iron Deficiency
ThalassemiaMinor (or
RDW-CV(Normal 11 – 13)
Elevated Normal
RDW-SD (Normal 39 – 49)
Elevated Decreased

8
Sometimes it Doesn’t Work
WHAT DOES THAT ALL MEAN ?
RDW – CV- VERY SENSITIVE TO IRON DEFICIENCY- NOT VERY SPECIFIC FOR THALASSEMIA MINOR
RDW – SD- NOT AS SENSITIVE TO EARLY IRON DEFICIENCY
- VERY SPECIFIC FOR THALASSEMIA MINOR
- CAN INDICATE COMBINED ABNORMALITIES

9
Combined Iron Deficiency / Thalassemia
F / 66Iron – 30µg/dl (N: 37 – 170)Hgb A2 - 2.2
Exercise
NO IRON STUDIES or HGB ELECTROPHORESIS NO INFORMATION
M / 54

10
M/90 ANEMIA

11

12
F/37

13

14
WNR Channel Scattergram - Normal Pattern
NRBC
WBC
BASO
Debris SFL
FS
C
Acute Erythroid Leukemia (AML-M6)

15
Acute Erythroid Leukemia (AML-M6)
Platelet Cases

16
PLT-F Channel
Reportable Parameters
PLT-FIPF
.
Binding sites of Fluorocell PLT
open tubuleα granule
←glycogen granule
microtubule
deep dyeing granule
rough-surfaced endoplasmic reticulum
Fluorocell PLT stains nucleic acid rich organelle
• Rough-surfaced endoplasmic reticulum (ribosomal RNA)
• Mitochondria (MtDNA)
mitochondria
RBCRBC
17
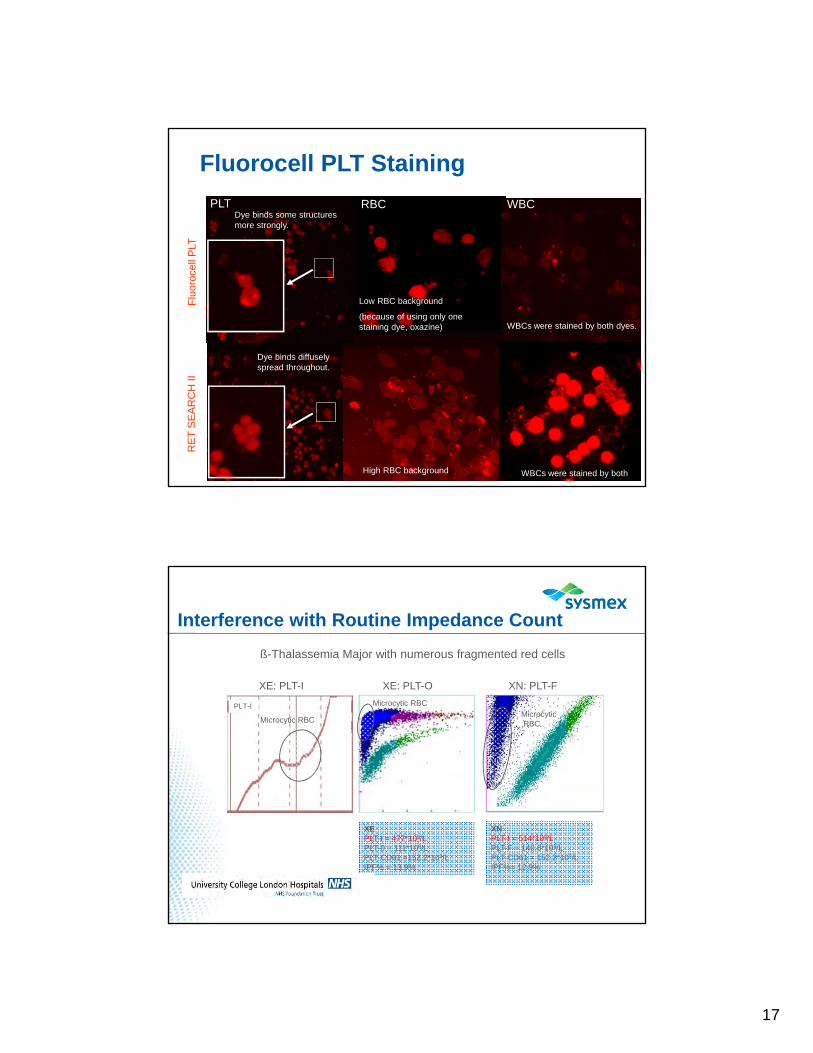
Fluorocell PLT Staining
PLT WBCRBCF
luor
ocel
l PLT
RE
T S
EA
RC
H II
Low RBC background
(because of using only one staining dye, oxazine) WBCs were stained by both dyes.
Dye binds diffusely spread throughout.
Dye binds some structures more strongly.
High RBC background WBCs were stained by both dyes.
Interference with Routine Impedance Count
ß-Thalassemia Major with numerous fragmented red cells
XN: PLT-FXE: PLT-O
PLT-I
XE: PLT-I
XEPLT-I = 477*109/L PLT-0 = 111*109/LPLT-CD61 =152.2*109/LIPF% = 13.9%
XNPLT-I = 514*109/L PLT-F = 140.8*109/LPLT-CD61 = 152.2*109/LIPF%= 12.9%
Microcytic RBC
Microcytic RBCMicrocyticRBC

18
Improved Performance of PLT-FAcute Promyelocytic Leukemia / chemo: white blood cell fragments
XNPLT-I = 28*109/L PLT-F = 24.2*109/LPLT-CD61 = 24.2*109/L IPF% = 1.1%IPF# = 0.3*109/L
XEPLT-I = 25*109/L PLT-0 = 181*109/LPLT-CD61 = 24.2*109/LIPF% = 41.2%IPF# = 74.6*109/L
XN: PLT-FXE: PLT- O
WBC cytoplasm fragments
IPF
PLT-F
WBC cytoplasm fragments
PLT measurement over time in the severe burn injury patient.
Burn injury
The feature:Huge micro-spherical FRCs appeared because of the heat shock.

19
PLT measurement over time in the sever burn injury patient.
Burn injury
Day 1
Day 2
PLT-F PLT-O
PLT-OPLT-F
PLT-I
PLT-I
PLT(x10^3/uL)
PLT-I 1118
PLT-O 515
PLT-F 228
CD61 204
PLT(x10^3/uL)
PLT-I 795
PLT-O 359
PLT-F 161
CD61 150XN Conference 2012 Kobe Japan
PLT measurement over time in the sever burn injury patient.
Burn injury
Day 3
Day 4
PLT-F PLT-O
PLT-OPLT-F
PLT-I
PLT-I
PLT(x10^3/uL)
PLT-I 632
PLT-O 211
PLT-F 116
CD61 115
PLT(x10^3/uL)
PLT-I 201
PLT-O 59
PLT-F 54
CD61 51

20
CML Patient
• High WBC Count
• Voted out Differential Results
• Abnormal Platelet Morphology
CML

21
CML
CML
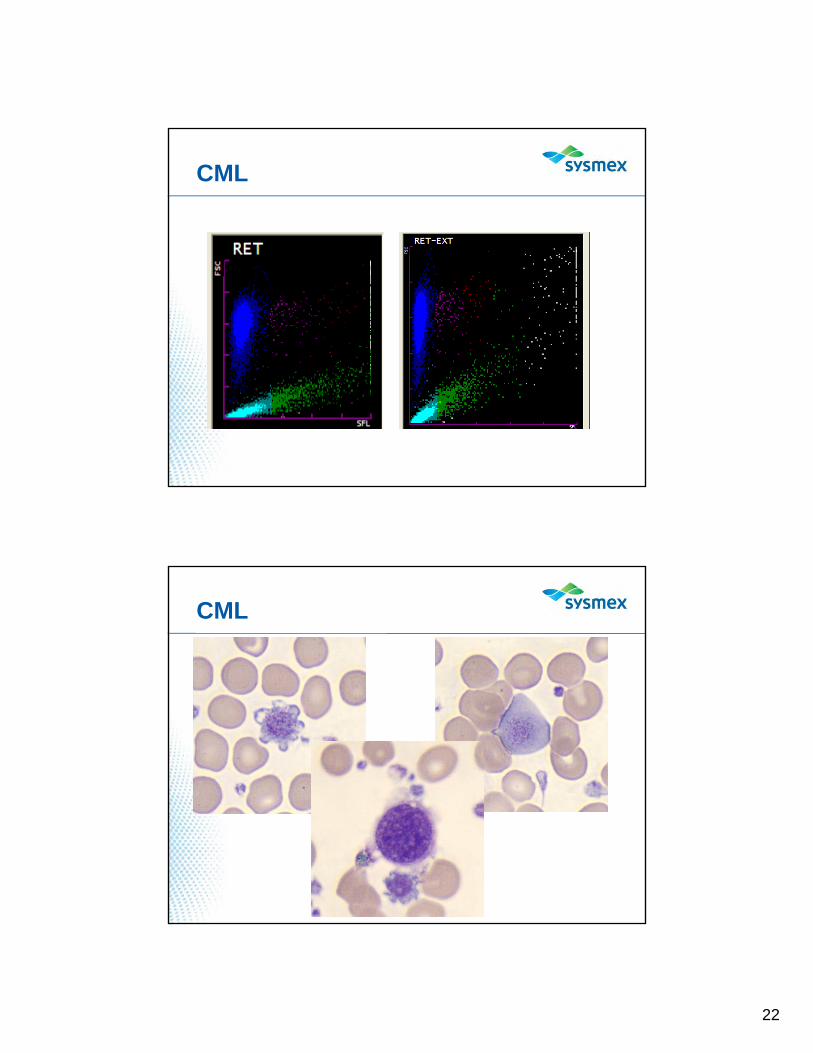
22
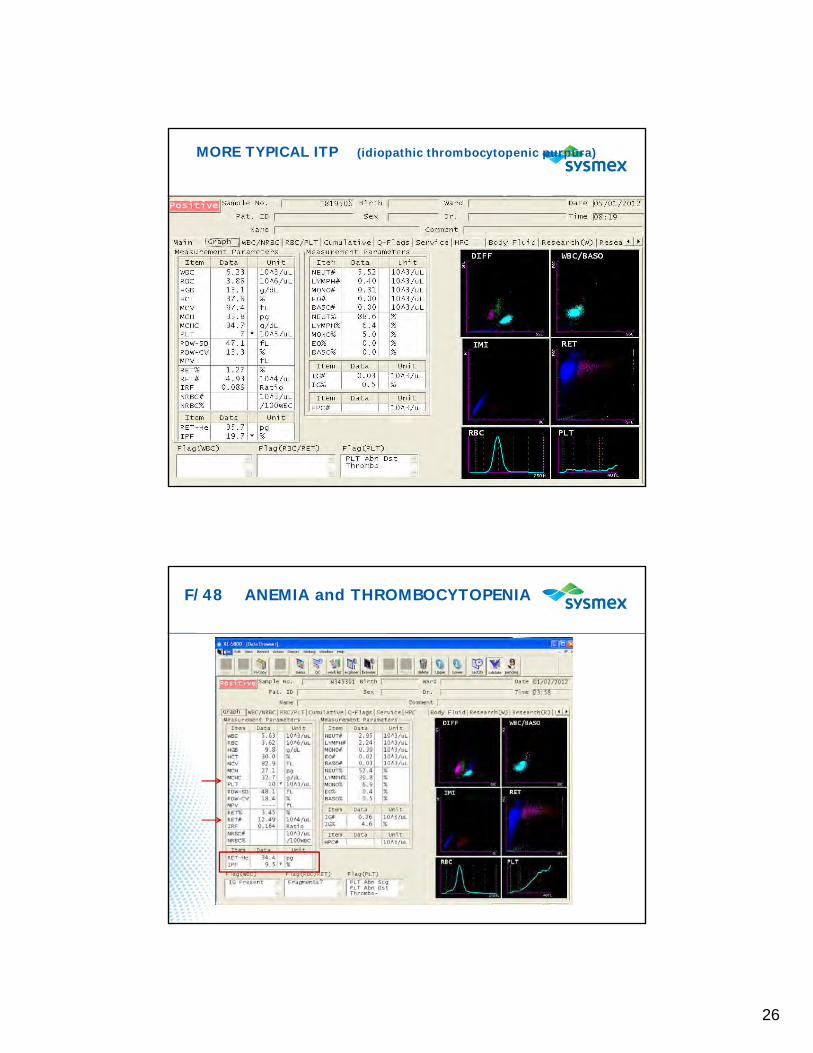
CML
CML

23
CML
CML

24
Giant Platelets
• Look at the histogram
• Look at the smear
• Look at the PLT-O upper discriminator
• Look at the RBC/PLT service screen
F/74 ANEMIA and THROMBOCYTOPENIA and…

25
26
MORE TYPICAL ITP (idiopathic thrombocytopenic purpura)
F/48 ANEMIA and THROMBOCYTOPENIA

27
DAY 3 TTP (THROMBOTIC THROMBOCYTOPENIC PURPURA)

28
M/59 –Oncology DECREASED PLATELET PRODUCTION
Thank You


![STANDOX JAGUAR 2010 [Kompatibilitätsmodus] · dark blue white mid red light green white white white white bright red bright red bright red pale grey pale grey pale grey pale grey](https://static.fdocuments.in/doc/165x107/5c7f8a0809d3f242188b8a38/standox-jaguar-2010-kompatibilitaetsmodus-dark-blue-white-mid-red-light-green.jpg)