Hematology Analyzer Manufacturer, Supplier of Hematology ...
Hematology and plasma chemistry reference values, body mass scores, and fecal
bacteriological analysis in tundra swans, Cygnus columbianus
By
Juliana F. Milani, D.V.M. M.S.
Submitted in Partial Fulfillment of the
Requirements for the Degree
MASTER OF PREVENTIVE VETERINARY MEDICINE
(MPVM)
School of Veterinary Medicine
University of California, Davis
Davis, California
August 2009
Reviewed and Approved by
_________________________________
Rance LeFebvre, Ph.D.
Professor; Veterinary Medicine: Pathology, Microbiology and Immunology
_________________________________
Michael Ziccardi, D.V.M., MPVM, Ph.D.
Assoc. Professor; Veterinary Medicine: Pathology, Microbiology and Immunology

ABSTRACT
Although the tundra swan (Cygnus columbianus) is very numerous and
possesses a wide distribution in North America, it has a very restricted literature. In
order to provide tools for future health-based monitoring programs, we developed
reference intervals for plasma biochemistry, hematology, and body weight (with
comparison among sexes) for 100 adult tundra swans (34 males and 66 females)
sampled in Kotzebue Sound, Alaska, during summer 2008. Moreover, to analyze
possible public health impacts, the prevalence of enteric Salmonella spp. and
Escherichia coli O157:H7 for a subset of 68 swans was attempted. Significant body
condition results included the unsurprising finding that females were significant lighter
than males. For the biochemical analysis, males had higher values in the upper limit of
the calcium interval when compared to females; while females had significant greater
mean levels of potassium. In comparing biochemical ranges to other avian species,
tundra swans were seen to have comparatively high values of creatine kinase, lactate
dehydrogenase, amylase, and alkaline phosphatase, and lower values for cholesterol.
Hematological analyses showed no gender differences, and the comparison with other
avian species demonstrated sizable differences in hematocrit, heterophils, white blood
cell count, and leukocyte differential estimates. There was no growth of either
Salmonella spp. or Escherichia coli O157:H7 in any of the animals sampled. In
conclusion, the fact that tundra swans’ plasma biochemistry and hematology vary
considerably from other avian species reinforces the fact that each avian species must
have its own normal values for ongoing health studies.
INTRODUCTION
Performing comprehensive health assessments on wild bird populations to
determine responses to environmental stressors typically include the evaluation of
physical and biochemical condition, and comparison of these values to established
baseline reference values. Specifically, hematology and plasma/serum biochemistry can
be used to assess the effects of health related problems, such as contaminant
intoxication, malnutrition, and exposure to infection (Sparling et al. 1999), and examine
relationships with important life history parameters (Dunbar et al. 2005). Because of this
association, ranges for biochemical parameters have been reported in the literature for
many common species of waterfowl (Franson et al. 1985, Perry et al. 1986). Body size
and weight are also important measures of individual health, which have been
correlated with both annual survival (Haramis et al. 1986, Conroy et al. 1989, Owen and
Black 1989, Schmutz 1993, Slattery and Alisauskas 2002, Hill et al. 2003) and
reproductive success in migratory waterfowl (Yerkes 2000, Bety et al. 2003). Body
condition in waterbirds can negatively be affected by factors such as population density
(Reed and Plante 1997), lead poisoning (Hohman et al. 1990), and physiologic stress
(Kitaysky et al. 1999). However, due to the broad physiological and seasonal
differences between genders for both biochemical and body measurements, any
baseline reference values must be careful to take this parameter into account,
One migratory bird species where sparse health data exist is the tundra swan
(Cygnus columbianus). Even though this bird is the most numerous and widespread of
the two swan species native to North America (the other being the trumpeter swan,
Cygnus buccinator), literature on this magnificent bird is exceptionally limited. From
information gathered in the last twenty years, only basic aspects related to migration,
breeding and demography are known (Limpert and Earnst 1994); baseline health
assessments and the range of normal blood parameters, with comparison between
genders, have not yet been published.
Another point in favor of better understanding health in tundra swans is related to
their potential role in public health. The tundra swan is a migratory waterfowl that breeds
during the summer in Alaska and Northern Canada on tundra lakes, ponds, and pools.
From there, this species migrates following one of two different routes (Western and
Eastern), wintering in shallow estuaries, lakes, ponds, and rivers on either the Pacific
Coast, Atlantic Coast, or in the interior West and Great Lakes (Limpert and Earnst
1994). Little is known about tundra swans’ potential for harboring and spreading
zoonoses, especially those related to enteric bacteria, and many public health
professionals feel that surveillance programs should include investigation of infectious
zoonotic agents in specific wildlife species (Chomel et al. 2007). In particular, due to
their flight range, migrating birds may easily spread zoonotic enteric bacteria,
contaminating soil, crops, and water. Hagedorn et al. (1999) analyzed the sources of
fecal pollution in a rural Virginia watershed and concluded that about 7% of fecal
streptococci found in the water had come from waterfowl. Furthermore, bacteria that
may be pathogenic to humans and domestic animals, such as Salmonella spp.,
Campylobacter spp., and Yersinia spp., have been previously isolated from seabirds
species (Butterfield et al. 1983, Kapperud and Rosef 1983, Smith et al. 2002).
Therefore, studying tundra swans may be a highly effective way to determine potential
threats in public health.

Beginning in 2006, the tundra swan was identified as a priority species for early
detection of Asian highly pathogenic avian influenza H5N1 (hereafter, Asian HPAI) in
North America (Alaska Interagency HPAI Bird Surveillance Working Group 2006).
Consequently, sampling of swans throughout Alaska significantly increased in 2008 (Ely
et al. 2008, Wilson 2008) though, comprehensive health assessments were sporadically
completed. Therefore, in conjunction with this increased disease detection effort, we
sampled and weighed tundra swans to establish baseline reference values and body
mass measurements for future health-based monitoring programs and examine broad
differences among sexes. In addition, cloacal swabs were collected for a subsample of
swans for isolation of Salmonella spp. and Escherichia coli O157:H7, two of the top five
waterborne zoonotic pathogens of primary human health concern (Craun et al. 2004).

MATERIALS AND METHODS
A population of 100 apparently healthy tundra swans (Cygnus columbianus) – 66
females - were sampled near Kotzebue Sound, Alaska (66°09’N, 162°0’W) during the
summer of 2008, in conjunction with planned Asian HPAI sampling, banding, and
deployment of satellite transmitters. Capture methods for molting swans followed those
outlined by Spindler and Hall (1986). Briefly, individuals from flightless molting flocks
and family groups were captured on foot with dip-nets or from small inflatable boats
deployed by aircraft. Birds were weighed to the nearest 10g using a digital scale, and
up to 6 ml of blood were drawn by jugular or brachial venipuncture from all flightless
birds captured. All sampling was conducted following protocols approved by the U.S.
Geological Survey, Alaska Science Center, Institutional Animal Care and Use
Committee (Assurance No. 2008-06). Immediately following sample collection, 2 mls of
whole blood was transferred to lithium-heparinized Vacutainers® (Becton Dickinson,
Rutherford, New Jersey, USA) and the remaining blood was transferred to sterile serum
separator Vacutainers®. The serum samples were allowed to clot for a minimum of 2
hr, centrifuged at 3000 rpm for up to 10 min, and the serum transferred to 1.5 ml
cryovials (Eppendorf North America, Westbury, New York, USA). Peripheral blood
smears were prepared from whole blood samples for manual differential blood cell
counts. All samples were kept cool (4oC to 8oC) and held no more than 48 hours until
standard avian complete blood count (CBC) and chemistry panels were performed
(Idexx Veterinary Services; Sacramento, CA, USA).
Cloacal samples for the first 68 animals captured were acquired by placing a
sterile BD CultureSwab™ Plus infused with Cary-Blair transport medium (BD
Diagnostics, Franklin Lakes, NJ, USA) into the cloacae and softly revolving the tip
against the mucosal lining. The swabs were transported from Alaska to Davis by plane
at room temperature (15ºC to 25ºC) and subsequently cultured at UC Davis, School of
Veterinary Medicine, Department of Pathology, Microbiology and Immunology. Each
swab was used to inoculate the first quadrant of 5% Sheep Blood Agar, MacConkey
agar, Xylose lysine deoxycholate (XLD) agar (for Salmonella) and MacConkey Sorbitol
(SMAC) agar (for E. coli O157:H7). The plates were then streaked in four quadrants for
isolation and incubated aerobically at 37°C for 24 hours. After incubation, MacConkey
plates were inspected for lactose negative colonies (possible Salmonella); XLD plates
were inspected for hydrogen sulfide positive (H2S+) colonies (Salmonella); and SMAC
plates were inspected for sorbitol negative colonies (E. coli O157:H7). Sheep Blood
Agar plates were used as a backup once swabs were no longer viable after 7 days. Any
suspect pathogens would undergo further biochemical tests towards identification.
Descriptive statistics and histograms for each analyte were calculated using
Minitab® Statistical Software. The reference intervals (including 95% confidence
intervals for lower and upper limits), means, medians, and standard deviations were
calculated for each blood analyte using MedCalc Software (MedCalc Software,
Broekstraat 52, 9030 Mariakerke, Belgium). Variation between sexes was examined
comparing either means (using t-tests, and accepting differences if p-value was smaller
than 0.05) or lower and upper limit confidence intervals - in the case of no overlapping
values, the interval between male and female was considered significantly different (I.
Gardner, pers. comm.).

RESULTS
Body mass
The reference intervals (including 95% confidence intervals (CI) for lower and
upper limits), means, medians, and standard deviations (SD) for animal weight
(categorized by gender) are shown in Table 1. Overall, the weight range went from
5.17Kg to 7.99Kg (median 6.50Kg), and females showed to be significant lighter than
males.
Plasma biochemistry and hematology
The results for plasma biochemical parameters are shown in Tables 2 and 3.
Seven of these 16 reference intervals [albumin globulin ratio (A/G), albumin, amylase
(AMYL), calcium, cholesterol (CHOL), glucose (GLU), and sodium] had 95% CIs
calculated for their upper and lower limits, thus comparisons between male and female
could be made by juxtaposing these bounds (Table 2). The only analyte that showed
significant gender differences was calcium, with males having slightly higher values
than females in the upper limit (the lower limit was considered to be the same).
Regarding the remainder nine parameters [alkaline phosphatase (ALP), aspartate
aminotransferase (AST), creatine kinase (CK), globulin (GLOB), lactate dehydrogenase
(LDH), phosphorus (PHOSP), potassium, total protein (TP) and uric acid (UA)] (Table
3), no 95% CI were able to be calculated due to small sample size in the male group;
therefore assessment of variation between sexes was made by comparison of
parameter’s means, using t-tests. The only analyte that showed gender difference was
potassium, with females having significant higher mean level than males (p=0.0108).

Tables 4 and 5 show the values of hematology results. The 95% CI of the
reference intervals’ bounds were calculable for hematocrit (HCT), heterophils, and
lymphocytes, but no significant difference between males and females were seen
(Table 4). The reference intervals for white blood cells (WBC), basophils, eosinophils,
and monocytes were not able to include 95% CI, and comparison of gender means
showed no significant difference (Table 5).
Fecal Bacteriological Analysis
Regarding the enteric bacteriological analysis, no H2S positive colonies were
found on XLD agar and no sorbitol negative colonies were found on SMAC agar,
meaning that there was no growth of E. coli O157 or of Samonella spp. The majority of
organisms growing on the MacConkey agar plates were lactose positive, indicative of
commensal E. coli.

DISCUSSION
This study establishes baseline reference intervals for blood values and body
weight in wild tundra swans, and examines differences between genders. Moreover,
isolation of enteric E. coli O157:H7 and Salmonella spp. were attempted to determine
zoonotic fecal pathogen prevalence.
Body Mass
The weight intervals of tundra swans evaluated in this study, 5.93Kg – 8.29Kg for
males (mean = 7.11Kg) and 5.10Kg – 7.50Kg for females (mean = 6.30Kg), were in
accordance with that acceptable for the species [adult males: 3.8Kg –10.5Kg (mean =
7.2 kg); and adult females: 4.1Kg – 9.0Kg (mean = 6.3 kg)] (Limpert and Earnst 1994).
Tundra swan females weighed less than males - a similar finding to that in other
commensal species such as free-ranging common loons (Haefele et al. 2005). Body
condition scores were not assessed because more than one person collected
measurements. Since this is a subjective measurement, it can be highly inconsistent
between different veterinarians/biologists, and results may not be directly comparable.
Plasma Biochemistry and Hematology
Our study showed very few differences between male and female tundra swans.
Only plasma calcium and potassium were seen to differ. The small calcium difference
found is expected when blood collection happens soon after egg-laying (Hannon 1979).
A similar result was appreciated in emperor geese (Chen canagica) (Franson et al.
2009). The potassium finding is not well explainable. In spotted dove (Streptopelia
chinesis) and blue rock pigeon (Columbia livia), females had higher potassium levels
than males (Umapathy and Ashokan 1997), but no gender variation was seen in either
king eiders (Somateria spectabilis) (Scott 2006) or captive California condors
(Gymnogyps californianus) (Dujowich et al. 2005). Overall, tundra swans showed
comparably high levels of CK, LDH, amylase and ALP, and low values of cholesterol,
while little to no discrepancy was observed for A/G, albumin, glucose, sodium, AST,
GLOB, PHOSP, potassium, TP and UA, when compared to other avian species such as
emperor geese (Franson et al. 2009), mallards (Anas platyrhynchos) (Fairbrother et al.
1990), king eiders (Scott 2006), captive and wild canvasbacks (Franson et al. 1985,
Perry et al. 1986), barn owls, screech owls, black crowned night herons, and redheads
(Franson et al. 1985) (Tables 2 and 3). According to Williams and Thorne (1996), CK
and LDH can be increased in case of exertional myopathy caused by active or
prolonged captures. The capture method of tundra swans involved the use of light
aircraft to maintain the flock in position for capture, while inflatable boats with two
biologists each captured flightless swans with dipnets, bound their feet with electrical
tape, and transported them to shorelines for processing (Wilson 2008). Many captured
swans were also restrained with custom-made harnesses (Evans and Kear 1972). This
intensive process likely contributed to the release of CK and LDH from muscle tissue
into the blood (Williams and Thorne 1996). Further, avian species at the same
reproductive stage (molting) experiencing muscle-related-stress during capture also
exhibited high values of CK and/or LDH, such as emperor geese (Franson et al. 2009)
and mallards (Fairbrother et al. 1990). The observed changes in ALP, amylase and
cholesterol are of unknown etiologies. In previous studies, female king eiders
demonstrated high levels of ALP and amylase, but blood collection was performed
during breeding and egg-laying phases when both ALP and amylase are expected to

increase due to estrogen-induced hyperproteinemia accompanying egg formation (Scott
2006). Similarly, Fairbrother et al. (1990) found that mallards during egg laying had
higher levels of ALP and amylase than those during molting. However, no similar
comparisons can be made for tundra swans, as there are no published studies
evaluating plasma biochemical results in egg-laying tundra swans. In commercial
turkeys, it has been observed that females carrying a mutating gene that inhibits normal
feather development had significant higher values of ALP and lower values of
cholesterol when compared to females with normal feather development (Zakrzewska
and Savage 1997). One hypothesis for the observed alteration in ALP and cholesterol
encountered in our study could be related to the loss and formation of feather during the
molting stage, but further studies are still needed to better understand the metabolism
involved in this process.
In this study, hematological analyses showed no differences between males and
females; a finding also noted previously in free-ranging common loons (Gavia immer)
(Haefele et al. 2005) and flightless cormorants (Phalacrocorax harrisi) (Travis et al.
2006) (Table 4). Similarly, hematocrit (HTC) values were comparable to those seen in
loons (Haefele et al. 2005) and flightless cormorants (Travis et al. 2006), but were
slightly lower than captive and wild canvasbacks (Perry et al. 1986). Small differences in
HTC may be seen due to dehydration or mild anemia (Haefele et al. 2005). Heterophils
were higher in tundra swans than in common loons (Haefele et al. 2005), king eiders
(Scott 2006) and cormorants (Travis et al. 2006). White blood cell counts (WBC) in our
study were comparable to those in common loons, but higher than king eiders (Scott
2006) and cormorants (Travis et al. 2006). Variation in leukograms in birds may occur

due to subclinical diseases, small traumas, and toxicities, as well as to stress related to
capture and manipulation (Campbell 1997, Fudge 1997). In the leukocyte differential,
tundra swans had similar proportions of basophils, but lower proportions of eosinophils,
lymphocytes and monocytes, as compared to cormorants (Travis et al. 2006); lower
basophils, higher eosinophils and lymphocytes, but similar monocytes than king eiders
(Scott 2006); and lower eosinophils than common loons (Haefele et al. 2005). While
most differences are likely to be species-related, parasitism may explain the
discrepancy encountered in the proportion of eosinophils. Even though eosinophils are
not a reliable measure of parasitism in avian species, parasitized birds may have
eosinophilia (Fudge and Joseph 2000). Further studies comparing level of dehydration
and stress, subclinical diseases, small traumas, and parasitism to hematological values
would be of great contribution to establish baseline normal values in tundra swans.
One weakness of this study lies on the fact that not all parameter gender
comparisons could be made through juxtaposition of their limits, and, consequently, we
had to rely on comparisons of means for some analytes. The vast majority of studies
analyzing blood values show means and standard deviation instead of reference
intervals. Ranges of “normal values” are more appropriate, as they are commonly used
by laboratories, clinicians and veterinarians to compare to patients’ test results. Creating
reference intervals with 95% CI in the lower and upper bounds has the disadvantage
that a large sample and data with appropriate distribution (e.g. normal distribution for
parametric analysis) are needed. According to Lumsden (1998), at least 40 samples
would be necessary in each subgroup analyzed in order to ensure that the 95% CIs for
the limits could be calculated. However, for males our sample was 34. Additional
samples from tundra swans are needed to make more comparable results.
Fecal Bacteriological Analysis
Neither Salmonella spp. nor E. coli O157 was found in any animal sampled. This
is in accordance with preliminary research conducted in California’s central coast that
demonstrated only about 0.5% of wildlife carried enteric E. coli O157 (Department of
Fish and Game 2009). A 1-year study carried out in rehabilitation centers in California
showed that 4% of wildlife were positive for Salmonella spp. (Smith et al. 2002), while
studies in Norway with avian wildlife (Kapperud and Rosef 1983) and in Trinidad with
wild and racing pigeon (Adesiyun et al. 1998) demonstrated that only 0.8% and 1% of
animals yielded Salmonella spp., respectively. One significant difference between these
studies (besides the fact that in California the samples were collected from rehabilitation
centers where animals are weaker and more susceptible to infection) is that feces were
used for the tests in California, while samples were collected with swabs in Trinidad and
Norway. Kotton et al. (2006) demonstrated that the sensitivity of tests using swabs to
detect Salmonella typhimurium in humans was only moderate when compared to fecal
cultures. Thus, the fact that our samples were collected by swabs may have affected
our results by missing potential infected birds. Moreover, it is important to notice that in
order to reach the 4% positive result demonstrated by Smith et al. (2002), we just
needed three positive animals, Therefore, studies using larger sample sizes of fecal
samples are needed to verify whether our results represent accurate prevalence
estimates of these pathogens.
This is the first study to create baseline reference blood values and to assess
possible public health threat of tundra swan. Although the sample size in the male group
was considered small to calculate the 95% CI for the reference intervals bounds, and
the use of swabs may have underestimated the presence of enteric E. coli and
Salmonella spp., the information of this study serves as basis for following researches,
not only in wild tundra swan, but in all wild bird populations. Furthermore, the fact that
values for hematology and plasma biochemistry vary from each avian species indicates
that each species has its own normal values, and emphasizes the importance of studies
evaluating baseline blood analyses in wildlife.

ACKNOWLEDGMENTS
Support for this project was provided by the Calvin Schwabe One Health Project;
the US Fish and Wildlife Service - Alaska Region; and the MPVM Program at the
University of California, Davis.
I would like to thank my advisors, Dr. Michael Ziccardi and Dr. Rance LeFebvre
for their precious guidance during the course of this study and in the writing of this
thesis. In addition, I would like to express my gratitude to Dr. Cheryl Scott, Heather
Wilson, and Dr. Ian Gardner for their support and expertise during planning,
implementation, and data analyzing of this experiment, and to the veterinarian Dr. Scott
Ford, for the training and help. I would also like to thank the Alaskan USFWS biologists
and personnel Brad Scotton, Karen Bollinger, Bill Larned, Paul Anderson, Nate Olson,
Rob MacDonald, Dennis Marks, Rachael Schively and Tina Moran, and the UC Davis
Microbiology Laboratory staff research associates Poyin Chen and Heather A. Van
Hoosear for their planning, implementation, expert assistance, and invaluable support.
Finally, I would like to express my appreciation to everyone that, by one way or
another, had any participation on this project, directly or indirectly, but whose names
would be impossible to mention in only one page.

Table 1. Reference intervals (including 95% confidence intervals (CI) for lower and upper limits), means, medians, and standard deviations (SD) of tundra swans’ weight (in Kg), sampled at Kotzebue Sound, Alaska, in summer 2008.
Reference Intervals
Lower Upper
Limit 95% CI Median Limit 95% CI Mean SD
Total 5.17 4.97 - 5.38 6.50 7.99 7.78 - 8.19 6.58 0.72
Male 5.93 5.64 - 6.23 7.16 8.29 8.00 - 8.59 7.11 0.60
Female 5.10 4.89 - 5.32 6.32 7.50 7.29 - 7.72 6.30 0.61
Total n=100, Female n=66, Male n=34 (n=number of animals sampled)

Table 2. Reference intervals (including 95% confidence intervals (CI) for lower and upper bounds), means, medians, and standard deviations (SD) for 7 of the 16 biochemical parameters of tundra swans, sampled at Kotzebue Sound, Alaska, in summer 2008.
Lower Upper
Limit 95% CI Median Limit 95% CI Mean SD
A/G Total 0.44 0.42 - 0.46 0.60 0.72 0.7 - 0.74 0.58 0.07
Male 0.45 0.41 - 0.48 0.60 0.72 0.69 - 0.76 0.59 0.07
Female 0.43 0.41 - 0.46 0.60 0.72 0.7 - 0.75 0.58 0.07
Albumin Total 1.05 1.01 - 1.08 1.30 1.52 1.49 - 1.56 1.28 1.12
g/dL Male 1.07 1.02 - 1.13 1.30 1.54 1.48 - 1.6 1.31 0.12
Female 1.03 0.99 - 1.08 1.30 1.51 1.47 - 1.56 1.27 0.12
AMYL Total 2246.00 2246 - 2246 4031.50 6247.00 6247 - 6247 4133.00 1140.22
(U/L) Male 2261.30 2261.3 - 2261.3 3831.00 6185.40 6185.4 - 6185.4 3889.62 1102.24
Female 2329.70 2329.7 - 2329.7 4072.00 7331.35 7331.35 - 7331.35 4258.38 1147.34
Calcium* Total 8.28 8.18 - 8.38 9.00 9.70 9.59 - 9.8 8.99 0.36
mg/dL Male 8.35 8.16 - 8.54 9.15 9.88 9.69 - 10.07 9.11 0.39
Female 8.28 8.16 - 8.39 9.00 9.57 9.45 - 9.68 8.92 0.33
CHOL Total 76.89 71.82 - 81.97 108.50 146.55 141.47 - 151.62 111.72 17.77
mg/dL Male 81.02 72.22 - 89.82 113.00 150.92 142.12 - 159.72 115.97 17.83
Female 75.30 69.14 - 81.45 106.50 143.76 137.61 - 149.92 109.53 17.47
GLU Total 201.57 188.2 - 214.94 289.50 384.95 371.58 - 398.32 293.26 46.78
mg/dL Male 195.47 170.03 - 220.91 289.00 397.53 372.09 - 422.97 296.50 51.55
Female 204.47 188.8 - 220.14 289.50 378.71 363.05 - 394.38 291.59 44.45
Sodium Total 144.37 143.79 - 144.96 148.00 152.43 151.84 - 153.01 148.40 2.05
mEq/L Male 144.72 143.67 - 145.78 149.00 153.10 152.05 - 154.16 148.91 2.14
Female 144.26 143.57 - 144.96 148.00 152.01 151.31 - 152.71 148.14 1.98
Total n=100, Female n=66, Male n=34 (n=number of animals sampled) * Male values in the upper bound were significantly higher than those of females

Table 3. Reference intervals, means, medians, and standard deviations (SD) for 9 of the 16 biochemical parameters of tundra swans, sampled at Kotzebue Sound, Alaska, in summer 2008, where 95% CIs could not be calculated.
Lower Upper
Limit Median Limit Mean SD
ALP Total 169 677.00 1544.00 720.88 334.43
(U/L) Male 276.75 683.00 1248.45 706.15 230.97
Female 90.8 672.50 1617.1 728.47 378.27
AST (U/L) Total 12 26.00 162.00 35.01 33.82
Male 11.35 24.50 111.20 31.00 23.03
Female 12 26.00 172.20 37.08 38.21
CK Total 260 957.00 6936.00 1576.72 2310.47
(U/L) Male 242.55 801.00 6054.70 1190.85 1288.11
Female 271.55 984.00 8363.25 1775.50 2677.73
GLOB Total 1.80 2.20 3.00 2.23 0.31
g/dL Male 1.70 2.25 3.10 2.26 0.35
Female 1.80 2.20 2.99 2.22 0.29
LDH Total 312.00 652.00 1365.00 670.50 273.38
(U/L) Male 335.80 644.50 1049.05 636.59 214.97
Female 305.20 660.00 1565.60 687.97 299.09
PHOSP Total 0.5 2.35 5.40 2.42 1.43
mg/dL Male 0.5 2.20 5.46 2.34 1.45
Female 0.62 2.45 5.27 2.45 1.42
Potassium* Total 2.00 2.50 3.70 2.60 1.26
mEq/L Male 1.97 2.45 3.03 2.48 0.26
Female 2.00 2.60 3.87 2.66 0.43
TP Total 2.90 3.45 4.60 3.52 0.40
g/dL Male 2.84 3.55 4.50 3.57 0.44
Female 3.00 3.40 4.56 3.49 0.38
UA Total 4.40 7.30 13.50 7.87 2.62
mg/dL Male 4.88 7.95 18.46 8.34 3.02
Female 4.32 7.20 12.84 7.63 2.38
Total n=100, Female n=66, Male n=34 (n=number of animals sampled) * Male mean values were significantly lower than those of females.
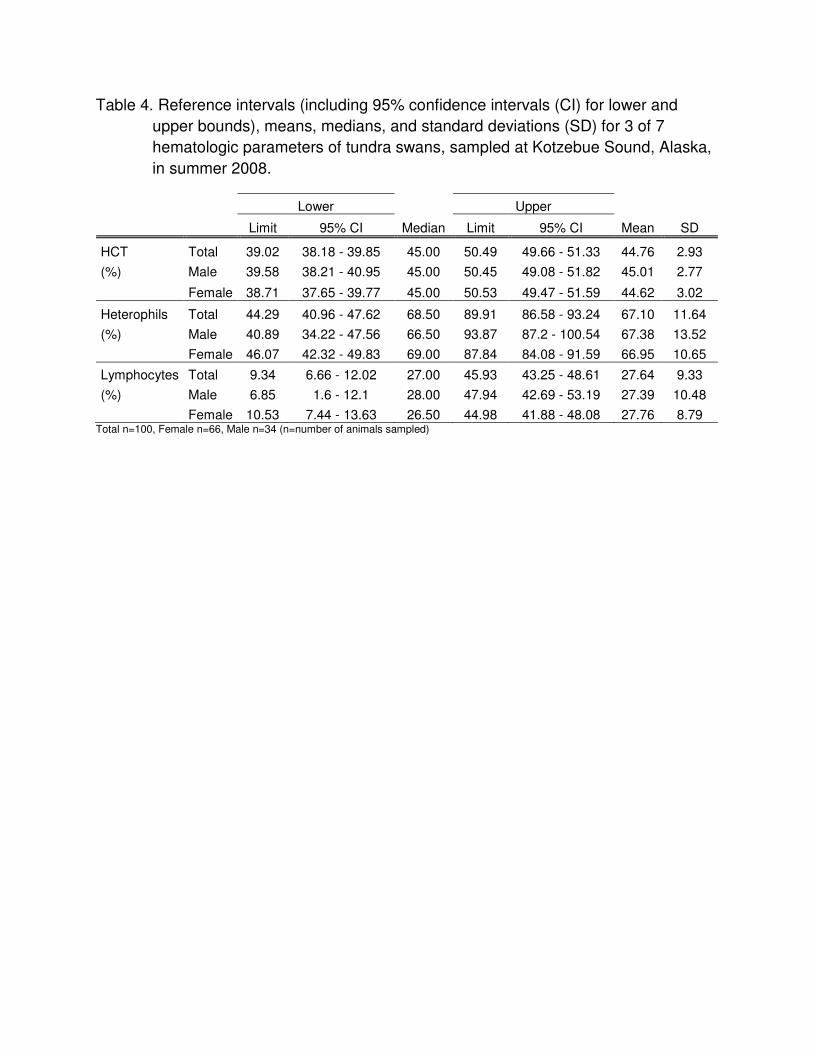
Table 4. Reference intervals (including 95% confidence intervals (CI) for lower and
upper bounds), means, medians, and standard deviations (SD) for 3 of 7
hematologic parameters of tundra swans, sampled at Kotzebue Sound, Alaska,
in summer 2008.
Lower Upper
Limit 95% CI Median Limit 95% CI Mean SD
HCT Total 39.02 38.18 - 39.85 45.00 50.49 49.66 - 51.33 44.76 2.93
(%) Male 39.58 38.21 - 40.95 45.00 50.45 49.08 - 51.82 45.01 2.77
Female 38.71 37.65 - 39.77 45.00 50.53 49.47 - 51.59 44.62 3.02
Heterophils Total 44.29 40.96 - 47.62 68.50 89.91 86.58 - 93.24 67.10 11.64
(%) Male 40.89 34.22 - 47.56 66.50 93.87 87.2 - 100.54 67.38 13.52
Female 46.07 42.32 - 49.83 69.00 87.84 84.08 - 91.59 66.95 10.65
Lymphocytes Total 9.34 6.66 - 12.02 27.00 45.93 43.25 - 48.61 27.64 9.33
(%) Male 6.85 1.6 - 12.1 28.00 47.94 42.69 - 53.19 27.39 10.48
Female 10.53 7.44 - 13.63 26.50 44.98 41.88 - 48.08 27.76 8.79 Total n=100, Female n=66, Male n=34 (n=number of animals sampled)
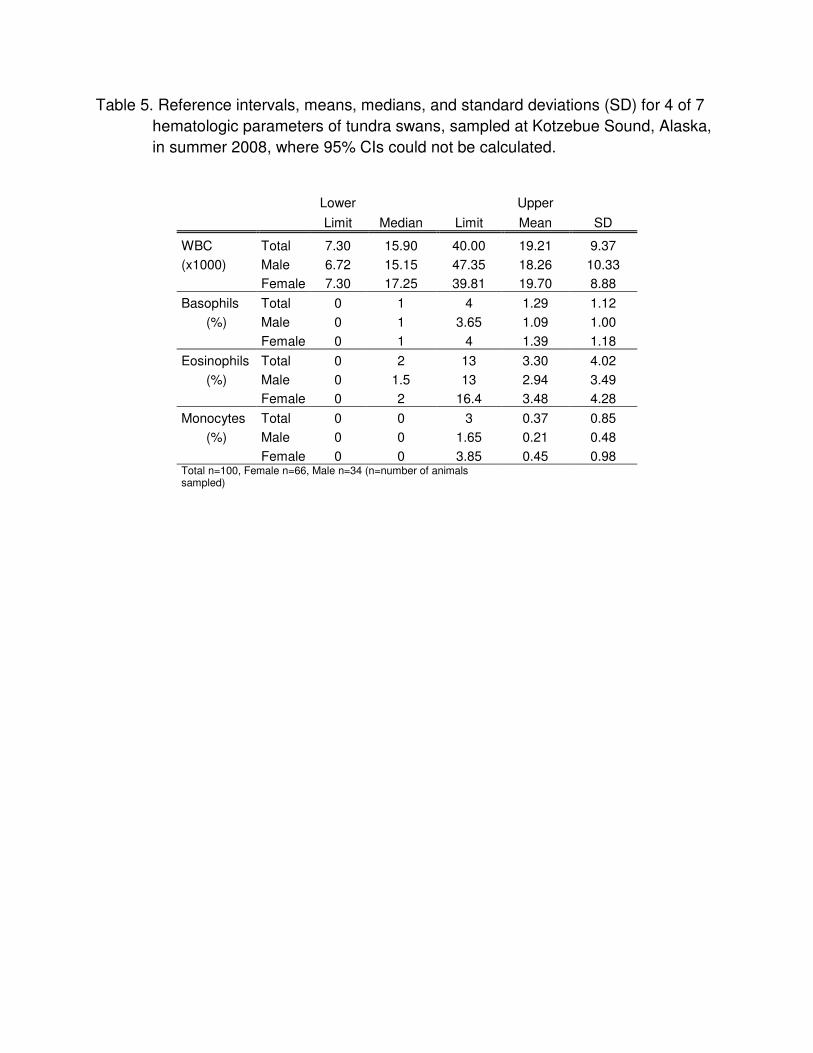
Table 5. Reference intervals, means, medians, and standard deviations (SD) for 4 of 7
hematologic parameters of tundra swans, sampled at Kotzebue Sound, Alaska,
in summer 2008, where 95% CIs could not be calculated.
Lower Upper
Limit Median Limit Mean SD
WBC Total 7.30 15.90 40.00 19.21 9.37
(x1000) Male 6.72 15.15 47.35 18.26 10.33
Female 7.30 17.25 39.81 19.70 8.88
Basophils Total 0 1 4 1.29 1.12
(%) Male 0 1 3.65 1.09 1.00
Female 0 1 4 1.39 1.18
Eosinophils Total 0 2 13 3.30 4.02
(%) Male 0 1.5 13 2.94 3.49
Female 0 2 16.4 3.48 4.28
Monocytes Total 0 0 3 0.37 0.85
(%) Male 0 0 1.65 0.21 0.48
Female 0 0 3.85 0.45 0.98 Total n=100, Female n=66, Male n=34 (n=number of animals sampled)

REFERENCES ADESIYUN, A. A., N. SEEPERSADSINGH, L. INDER, AND K. CAESAR. 1998. Some
bacterial enteropathogens in wildlife and racing pigeons from Trinidad. Journal of Wildlife Diseases 34: 73-80.
ALASKA INTERAGENCY HPAI BIRD SURVEILLANCE WORKING GROUP. 2006.
Sampling protocol for highly pathogenic Asian H5N1 avian influenza in migratory birds in Alaska Interagency planning report, Anchorage, AK.
BETY, J., G. GAUTHIER, AND G. JEAN-FRANCOIS. 2003. Body condition, migration,
and timing of reproduction in snow geese: a test of the condition-dependent model of optimal clutch size. The American Naturalist 162: 110-121.
BUTTERFIELD, J., J. C. COULSON, S. V. KEARSEY, P. MONAGHAN, J. H. MCCOY,
AND G. E. SPAIN. 1983. The herring gull Larus argentatus as a carrier of Salmonella. The Journal of hygiene (London) 91: 429-436.
CAMPBELL, T. W. 1997. Hematology. In Avian Medicine: Principles and Application,
W. B. RITCHIE, G. J. HARRISON, AND L. R. HARRISON (eds.). Wingers Publishing, Lake Worth, Florida. pp. 176-198
CHOMEL, B. B., A. BELOTTO, AND F. X. MESLIN. 2007. Wildlife, exotic pets, and
emerging zoonoses. Emerging Infectious Diseases 13: 6-11. CONROY, M. J., G. R. COSTANZO, AND D. B. STOTTS. 1989. Winter Survival of
Female American Black Ducks on the Atlantic Coast. The Journal of Wildlife Management 53: 99-109.
CRAUN, G., R. CALDERON, AND M. CRAUN. 2004. Waterborne outbreaks caused by
zoonotic pathogens in the USA. In Waterborne Zoonoses: Identification, Causes and Control, J. A. COTRUVO, A. DUFOUR, G. REES, J. BARTRAM, R. CARR, D. O. CLIVER, G. F. CRAUN, R. FAYER, AND V. P. J. GANNON (eds.). World Health Organization (WHO), IWA Publishing, London, UK. Chapter 8.
DEPARTMENT OF FISH AND GAME, California. 2009. Preliminary Research Results
Find Less Than One Half of One Percent Occurrences of E.coli 0157:H7 in Wildlife in California Central Coast Counties. Office of Communications, Education & Outreach, Sacramento. CA. Retrieved from http://www.dfg.ca.gov/news/news09/2009040702.asp
DUJOWICH, M., J. K. MAZET, ANDJ. R. ZUBA. 2005. Hematologic and biochemical
reference ranges for captive California condors (Gymnogyps californianus). J Zoo Wildl Med 36: 590-597.

DUNBAR, M. R., M. A. GREGG, M. R. GIORDANO, D. M. DAVIS, M. W. BYRNE, J. A. CRAWFORD, AND S. J. TORNQUIST. 2005. Normal hematologic and biochemical values for prelaying greater sage grouse (Centrocercus urophasianus) and their influence on chick survival. Journal of Zoo and Wildlife Medicine 36: 422-429.
ELY, C. R., S. TALBOT, J. PEARCE, D. V. DERKSEN, H. M. WILSON, J. B. FISCHER,
Z. SYROECHKOVSKIY, AND H. IP. 2008. Geographic variation in population structure and movement of tundra swans and avian influenza viruses. Proposal for avian influenza research in 2008.
EVANS, M., AND J. KEAR. 1972. A jacket for holding large birds for banding. Wildfowl
36: 1265-1267. FAIRBROTHER, A., M. A. CRAIG, K. WALKER, AND D. O'LOUGHLIN. 1990. Changes
in mallard (Anas platyrhynchos) serum chemistry due to age, sex, and reproductive condition. Journal of Wildlife Diseases 26: 67-77.
FRANSON, J. C., D. J. HOFFMAN, AND J. A. SCHMUTZ. 2009. Plasma Biochemistry
Values in Emperor Geese (Chen Canagica) in Alaska: Comparisons Among Age, Sex, Incubation, and Molt. Journal of Zoo and Wildlife Medicine 40: 321-327.
FRANSON, J. C., H. C. MURRAY, AND C. BUNCK. 1985. Enzyme activities in plasma,
kidney, liver, and muscle of five avian species. Journal of Wildlife Diseases 21: 33-39.
FUDGE, A. M. 1997. Avian clinical pathology - hematology and chemistry. In Avian
Medicine and Surgery, R. B. ALTMAN, S. L. CLUBB, G. M. DORRESTEIN, AND K. QUESENBERRY (eds.). W. B. Sauders Co., Philadelphia, Pennsylvania. pp. 142-157
FUDGE, A. M., AND V. JOSEPH. 2000. Disorders of avian leukocytes. In Laboratory
Medicine: Avian and exotic pets, A. M. FUDGE (ed.). W. B. Sauders Co., Philadelphia, Pennsylvania. pp. 56-60
HAEFELE, H. J., I. SIDOR, D. C. EVERS, D. E. HOYT, AND M. A. POKRAS. 2005.
Hematologic and physiologic reference ranges for free-ranging adult and young common loons (Gavia immer). Journal of Zoo and Wildlife Medicine 36: 385-390.
HAGEDORN, C., S. L. ROBINSON, J. R. FILTZ, S. M. GRUBBS, T. A. ANGIER, AND
R. B. RENEAU, JR. 1999. Determining sources of fecal pollution in a rural Virginia watershed with antibiotic resistance patterns in fecal streptococci. Applied and Environmental Microbiology 65: 5522-5531.
HANNON, S. J. 1979. Plasma calcium as an indicator of reproductive condition in
female blue grouse. Canadian Journal of Zoology 57: 463-465.

HARAMIS, G. M., J. D. NICHOLS, K. H. POLLOCK, AND J. E. HINES. 1986. The relationship between body mass and survival of wintering Canvasbacks Aythya-Valisineria. The Auk 103: 506-514.
HILL, M. R. J., R. T. ALISAUSKAS, C. D. ANKNEY, AND J. O. LEAFLOOR. 2003.
Influence of body size and condition on harvest and survival of juvenile Canada geese. Journal of Wildlife Management 67: 530-541.
HOHMAN, W. L., R. D. PRITCHERT, R. M. PACE III, D. W. WOOLINGTON, AND R.
HELM. 1990. Influence of ingested lead on body mass of wintering Canvasbacks. Journal of Wildlife Management 54: 211-215.
KAPPERUD, G., AND O. ROSEF. 1983. Avian wildlife reservoir of Campylobacter fetus
subsp. jejuni, Yersinia spp., and Salmonella spp. in Norway. Applied and Environmental Microbiology 45: 375-380.
KITAYSKY, A. S., J. C. WINGFIELD, AND J. F. PIATT. 1999. Dynamics of food
availability, body condition and physiological stress response in breeding Black-legged Kittiwakes. Functional Ecology 13: 577-584.
KOTTON, C. N., A. J. LANKOWSKI, AND E. L. HOHMANN. 2006. Comparison of rectal
swabs with fecal cultures for detection of Salmonella typhimurium in adult volunteers. Diagnostic Microbiology and Infectious Disease 56: 123-126.
LIMPERT, R. J., AND S. L. EARNST. 1994. Tundra Swan (Cygnus columbianus). In
The Birds of North America Online A. POOLE (ed.), Retrieved from http://bna.birds.cornell.edu/bna/species/089
LUMSDEN, J. H. 1998. "Normal" or reference values: questions and comments.
Veterinary Clinical Pathology 27: 102-106. OWEN, M., AND J. M. BLACK. 1989. Factors affecting the survival of Barnacle Geese
on migration from the breeding grounds. Journal of Animal Ecology 58: 603-618. PERRY, M. C., H. H. OBRECHT III, B. K. WILLIAMS, AND W. J. KUENZEL. 1986.
Blood Chemistry and Hematocrit of Captive and Wild Canvasbacks. The Journal of Wildlife Management 50: 435 - 441.
REED, A., AND N. PLANTE. 1997. Decline in body mass, size, and condition of greater
snow geese, 1975-94. Journal of Wildlife Management 61: 413-419. SCHMUTZ, J. A. 1993. Survival and pre-fledging body mass in juvenile emperor geese.
Condor 95: 222-225.
SCOTT, C. 2006. Health Evaluation of Western Arctic King Eiders (Somateria spectabilis). MPVM dissertation. School of Veterinary Medicine, University of California, Davis.
SLATTERY, S. M., AND R. T. ALISAUSKAS. 2002. Use of the Barker model in an
experiment examining covariate effects on first-year survival in Ross's Geese (Chen rossii): a case study. Journal of Applied Statistics 29: 497-508.
SMITH, W. A., J. A. MAZET, AND D. C. HIRSH. 2002. Salmonella in California wildlife
species: prevalence in rehabilitation centers and characterization of isolates. Journal of Zoo and Wildlife Medicine 33: 228-235.
SPARLING, D. W., D. DAY, AND P. KLEIN. 1999. Acute toxicity and sublethal effects of
white phosphorus in mute swans, Cygnus olor. Archives of Environmental Contamination and Toxicology 36: 316-322.
SPINDLER, M. A., AND K. F. HALL. 1986. Tundra swan populations, productivity and
local movements on Selawik National Wildlife Refuge, Northwest Alaska, 1985. USFWS report, Kotzebue, Alaska, USA.
TRAVIS, E. K., F. H. VARGAS, J. MERKEL, N. GOTTDENKER, R. E. MILLER, AND P.
G. PARKER. 2006. Hematology, plasma chemistry, and serology of the flightless cormorant (Phalacrocorax harrisi) in the Galapagos Islands, Ecuador. Journal of Wildlife Diseases 42: 133-141.
UMAPATHY, G., ANDS. ASHOKAN. 1997. Comparative studies on the haematology
and blood chemistry of spotted dove (Streptopelia chinensis) and blue rock pigeon (Columba livia). Pavo 35: 7-16.
WILLIAMS, E. S., AND E. T. THORNE. 1996. Exertional myopathy (capture myopathy).
In Noninfectious Diseases of Wildlife, A. FAIRBROTHER, L. N. LOCKE AND G. L. HOFF (eds.). Iowa State University Press, Ames, Iowa. pp. 181-193.
WILSON, H. M. 2008. Surveillance for highly pathogenic avian influenza (H5N1) in live
captured tundra swans in Northwest Alaska. USFWS Report, Anchorage, Alaska. YERKES, T. 2000. Influence of female age and body mass on brood and duckling
survival, number of surviving ducklings, and brood movements in Redheads. Condor 102: 926-929.
ZAKRZEWSKA, E. I., AND T. F. SAVAGE. 1997. Inhibited feathering: A new dominant
sex-linked gene in the turkey. Journal of Heredity 88: 238-246.