How to run SAP transaction ST04 – database performance monitor _ SAP application performance

The Best-Run Businesses Run SAP®
interim report January – march 2013
helping the World Run BetteR

TABLE OF CONTENTS INTERIM REPORT JANUARY – MARCH 2013
INTRODUCTORY NOTES 3 QUARTERLY FINANCIAL STATEMENTS (UNAUDITED) Interim Management Report 4 Consolidated Interim Financial Statements – IFRS 19 SUPPLEMENTARY FINANCIAL INFORMATION (UNAUDITED) IFRS and Non-IFRS Financial Data 44 Multi-Quarter Summary 48 ADDITIONAL INFORMATION Financial Calendar, Investor Services, Addresses, and Imprint 50

INTERIM REPORT JANUARY – MARCH 2013 3
Introductory Notes This interim group report meets the requirements of German Accounting Standard No. 16 “Zwischenberichterstattung” (DRS 16). We prepared the financial data in the Quarterly Financial Statements (Unaudited) section for SAP AG and its subsidiaries in accordance with International Financial Reporting Standards (IFRSs) of the International Accounting Standards Board (IASB) and the respective interpretations by the International Financial Reporting Interpretations Committee (IFRIC) endorsed by the European Union (EU) up to March 31, 2013. This does not apply to numbers expressly identified as non-IFRS. For additional IFRS and non-IFRS information, see the Supplementary Financial Information (Unaudited) section. This quarterly financial report updates our consolidated financial statements 2012, presents significant events and transactions of the first quarter 2013, and updates the forward-looking information contained in our Management Report 2012. Both the 2012 consolidated financial statements and the 2012 Management Report are part of our 2012 Integrated Report which is available at www.sapintegratedreport.de All of the information in this interim group report is unaudited. This means the information has been subject neither to any audit nor to any review by an independent auditor.

4 INTERIM MANAGEMENT REPORT
INTERIM MANAGEMENT REPORT
GENERAL INFORMATION Forward-Looking Statements This interim financial report contains forward-looking statements and information based on the beliefs of, and assumptions made by, our management using information currently available to them. Any statements contained in this report that are not historical facts are forward-looking statements as defined in the U.S. Private Securities Litigation Reform Act of 1995. We have based these forward-looking statements on our current expectations, assumptions, and projections about future conditions and events. As a result, our forward-looking statements and information are subject to uncertainties and risks, many of which are beyond our control. If one or more of these uncertainties or risks materializes, or if management’s underlying assumptions prove incorrect, our actual results could differ materially from those described in or inferred from our forward-looking statements and information. We describe these risks and uncertainties in the Risk and Opportunity Management section, respectively in the there mentioned sources. The words “aim,” “anticipate,” “assume,” “believe,” “continue,” “could,” “counting on,” “development,” “is confident,” “estimate,” “expect,” “forecast,” ”future trends,” “guidance,” “intend,” “may,” ”might,” “outlook,” “plan,” “project,” “predict,” “seek,” “should,” “strategy,” “want,” “will,” “would,” and similar expressions as they relate to us are intended to identify such forward-looking statements. Such statements include, for example, those made in the Operating Results section, the Risk and Opportunity Management section, our Forecast for SAP, and other forward-looking information appearing in other parts of this interim financial report. To fully consider the factors that could affect our future financial results, both our Annual Report for December 31, 2012, (extract from the SAP Integrated Report 2012) and Annual Report on Form 20-F for December 31, 2012, should be considered, as well as all of our other filings with the Securities and Exchange Commission (SEC). Readers are cautioned not to place undue reliance on these forward-looking statements, which speak only as of the date specified or the date of this report. Except where legally required, we undertake no obligation to publicly update or revise any forward-looking statements as a result of new information that we receive about conditions that
existed upon issuance of this report, future events, or otherwise unless we are required to do so by law. Statistical Data This report includes statistical data about the IT industry and global economic trends that comes from information published by sources including International Data Corporation (IDC), a provider of market information and advisory services for the information technology, telecommunications, and consumer technology markets; the European Central Bank (ECB); and the International Monetary Fund (IMF). This type of data represents only the estimates of IDC, ECB, IMF, and other sources of industry data. SAP does not adopt or endorse any of the statistical information provided by sources such as IDC, ECB, IMF, or other similar sources that is contained in this report. In addition, although we believe that data from these sources is generally reliable, this type of data is imprecise. We caution readers not to place undue reliance on this data. All of the information in this report relates to the situation on March 31, 2013, or the quarter ended on that date unless otherwise stated. Non-IFRS Financial Information This interim financial report contains non-IFRS measures as well as financial data prepared in accordance with IFRS. We present and discuss the reconciliation of these non-IFRS measures to the respective IFRS measures in the Supplementary Financial Information (Unaudited) section. For more information about non-IFRS measures, see our Web site www.sap.com/corporate-en/investors/newsandreports/reporting-framework.epx under “Non-IFRS Measures and Estimates.”

INTERIM REPORT JANUARY – MARCH 2013 5
ECONOMIC CONDITIONS Global Economic Trends According to figures published by the European Central Bank (ECB) and International Monetary Fund (IMF), the global economy recovered during the first quarter of 2013, growing about 3% compared with the same period of the previous year. Once again, economies developed very differently from country to country. Some of the larger industrialized markets recorded only a slight improvement of around 1% or less, whereas a number of emerging nations expanded by more than 5%. In the Europe, Middle East, and Africa (EMEA) region, the economic slump in the euro area persisted through the start of 2013. This was attributable first and foremost to declined domestic demand and subdued exports. The Americas region recorded solid economic growth in the reporting period, although cuts in government spending (fiscal cliff) did dampen the U.S. economy, causing gross domestic product (GDP) in the United States to increase only minimally in the first quarter compared to the year before. Economic activity in the Asia Pacific Japan (APJ) region was once again mixed in the first quarter: While Japan's GDP increased only marginally, the Chinese GDP grew almost 8% compared to the previous year. The IT Market As in 2012, first-quarter global IT spending increased year-over-year in the middle single-digit percentage range. That is according to the International Data Corporation (IDC), a market research firm based in the United States, which had lowered its earlier calculations somewhat due to the weak PC market. The hardware segment did well globally, benefiting in particular from a sharp increase in spending for smartphones and tablets. Investments in the software and services segments also increased, although only slightly compared to the previous year. In the EMEA region – most notably in Europe – the cost saving measures of several governments coupled with a high rate of unemployment in several countries slowed down IT spending growth. By contrast, the IT market in the Americas region remained stable. IT spending in the United States grew in the middle single-digit percentage range and thus within the global average. The APJ region recorded a strong increase in IT spending, in some cases even achieving double-digit growth, above all in China. Japan, however, proved to be the
exception, as IT spending there remained almost unchanged year-on-year. Impact on SAP Risks and uncertainties in the overall economy and IT industry did not negatively impact SAP business in the first quarter: In fact, we outperformed the global economy and the IT industry, thanks to our innovations in applications, analytics, cloud, mobile, and database and technology. Despite continued market uncertainty, the EMEA region performed well with 13% non-IFRS software and cloud subscription revenue growth. Emerging markets in the EMEA region, such as the Middle East, Africa and Russia, as well as the UK, Sweden and Switzerland are performing especially well with double-digit software growth rates. In the Americas region we achieved strong non-IFRS software and cloud subscription growth of 49%, driven by a excellent performance in Brazil and Mexico. We achieved strong cloud subscription and support revenue growth in North America. Our non-IFRS software license revenue grew by 6% in the Americas region and we believe this was primarily impacted by federal budget uncertainty in the United States, which delayed budgetary cycles in that country. We expect this to normalize during the remainder of the year. In the APJ region non-IFRS software and cloud subscription revenue declined by 10%. This slow start was partly due to some leadership changes we made in some markets. In addition, at the beginning of the year we saw slower than expected demand for IT investments in China from state-owned enterprises. SAP does, however, expect China to return to solid growth and we are optimistic we will be back on track in APJ in the second quarter. VISION, MISSION, AND STRATEGY We did not change our vision, mission, or strategy in the first three months of 2013. For a detailed description, see our 2012 Integrated Report and item 4 in our 2012 Annual Report on Form 20-F.

6 INTERIM MANAGEMENT REPORT
PORTFOLIO OF SOFTWARE AND SERVICES In the first quarter of 2013, we made the following enhancements to our portfolio of software and services. For a detailed description, see our 2012 Integrated Report and item 4 in our 2012 Annual Report on Form 20-F. Applications SAP continues to help its customers achieve a real-time enterprise with solutions that speed up processing and deliver insights based on the very latest information. A milestone of this strategy was introduced in January: SAP Business Suite powered by SAP HANA, a new option for SAP Business Suite customers. SAP now provides an integrated family of business applications that captures and analyzes transactional data in real time on a single in-memory platform. SAP Business Suite powered by SAP HANA empowers customers to manage all mission-critical business processes such as planning, execution, reporting, and analysis in real time, by using the same relevant live data. Customers of our applications for small and midsize enterprises will also benefit from the power of SAP HANA. In early March at CeBIT 2013 in Hanover, Germany, SAP announced SAP Business One, version for SAP HANA, the first business management solution for small and midsize enterprises (SMEs) that is run completely in-memory. The application is a scalable, affordable solution with embedded analytics capabilities and high-volume transactions that empower SMEs to run their businesses in real time. Analytics In the first quarter, SAP unveiled two highly specialized analytic applications to sports fans in the United States. In January, we introduced an online analytics dashboard based on SAP HANA that provided National Football League (NFL) fans with insights regarding the selection of the NFL.com Fantasy Player of the Year for the 2012 season. The dashboard, now live on NFL.com/honors, displays the statistics of the top eight Fantasy Player finalists in a visually rich format. In February, SAP and the National Basketball Association (NBA) announced the launch of NBA Stats, providing fans with interactive access to official NBA statistics and analyses. Powered by the real-time SAP HANA platform and free to all fans
and media, the NBA’s statistical offering will allow users to interact and analyze official league, team, and player statistics in real time through an intuitive, highly visual interface. Other analytic solutions introduced during the first quarter included the SAP Fraud Management analytic application, which helps companies detect fraud earlier for reduced financial loss and lower fraud investigation costs. Industry Recognition: SAP has once again been positioned in the Leaders Quadrant of Gartner's Business Intelligence and Analytics Magic Quadrant. We were also placed in the Leaders Quadrant of the Gartner Corporate Performance Management (CPM) Magic Quadrant. Cloud Since launching a revamped cloud strategy in May 2012, SAP has established itself as a leader in the cloud market, with a comprehensive offering of cloud-based business applications. In January, SAP expanded its SAP PartnerEdge program, allowing us to offer a broader portfolio of SAP cloud solutions through our sales partners. As a result, more than 500 partners of SuccessFactors, an SAP company, will be transitioned into the program in 2013. In February, SAP announced the release of the SAP ERP HCM Integration to SuccessFactors rapid-deployment solution. With this release, SAP and SuccessFactors create the leading cloud human capital management (HCM) solution to drive global HR efficiency and empower employees to manage their careers. Industry Recognition: SuccessFactors has been positioned as a Leader by Gartner in the 2013 Magic Quadrant for Talent Management Suites (TMS), based on talent, compensation, recruiting and learning. In the cloud-based collaborative commerce market, Ariba, an SAP company, was recognized as a leader for Sourcing and Vendor Management (SVM) tool sets in “The Forrester Wave: SVM Tool Set, Q1 2013” report by Forrester Research. The citation is based on the firm’s evaluation of Ariba Sourcing, Ariba Contract Management, Ariba Supplier Information and Performance Management, and Ariba Spend Visibility.

INTERIM REPORT JANUARY – MARCH 2013 7
Mobile During the first quarter, SAP unveiled a wide range of innovations that enable customers to compete and win through mobility. In January, for example, we introduced a new wave of mobile apps to help retailers market to and engage with consumers, enhancing the shopping experience and boosting customer loyalty. SAP Customer Loyalty, SAP On-Shelf Availability Manager, and SAP Retail Store Ops Associate mobile apps were announced at the National Retail Federation (NRF) 102nd Annual Convention & EXPO in New York City. In February, at the 2013 Mobile World Congress (MWC) in Barcelona, Spain, SAP introduced the SAP Mobile Documents solution designed to meet the demand for simple, highly secure file synchronization and sharing in the enterprise. The new mobile content management solution provides a single entry point to personal business documents and corporate content via any device. Also at MWC, SAP announced the launch of the cloud-based SAP Rich Communication Services 365 (SAP RCS 365) mobile service. For mobile subscribers, RCS makes services such as instant messaging, video, and file sharing as simple and intuitive as sending a text message. In addition, it enables mobile operators to create new innovative services, respond to competition in today's expanding mobile ecosystem, and increase potential revenue per subscriber. Addressing the growing demand for machine-to-machine (M2M) applications, SAP and Ericsson took advantage of the MWC forum to announce an agreement to jointly market and sell cloud-based M2M solutions and services to enterprises via operators around the globe. The solutions will be based on a combined software-as-a-service (SaaS) offering from SAP and Ericsson, and will provide the infrastructure and business solutions for automatic data transmission between technical devices, such as vehicles, freight containers, alarm systems, or vending machines. Database and Technology SAP continues to set new standards for performance in database applications and related technologies – including the breakthrough SAP HANA in-memory computing platform. In February, SAP announced the availability of SAP Sybase IQ 16 software, a critical component of the SAP Real-Time Data Platform. SAP Sybase IQ, the next-generation disk-based column store analytics
server, delivers speed and power for extreme-scale enterprise data warehousing and big data analytics with dramatic affordability and efficiency. In late February, at the Strata Conference in California, SAP and Intel announced a technical and business partnership that will help organizations in data-intensive industries become more competitive and agile by leveraging insights across business operations from all their data assets at the pace of business. The two companies plan to build and bring to market a breakthrough Big Data solution for enterprise customers centered on the SAP HANA platform and Intel Distribution for Apache Hadoop software. In early March, at the MIT Sloan Sports Analytics Conference in Boston, SAP announced the launch of the SAP Scouting solution. Powered by the SAP HANA platform, this enterprise offering will enable sports franchises to improve their ability to identify and acquire the talent that fuels their teams’ on-field success. SAP developed the solution in partnership with the NFL’s San Francisco 49ers during preparation for the 2013 NFL Draft. Industry Recognition: On the strength of our advances in database and technology, GRC 20/20, a leading analyst firm, named SAP as one of 12 winners of the 2013 GRC Technology Innovator Awards. SAP was recognized for advancing governance, risk, and compliance (GRC) analytics with SAP HANA Analytics Foundation for SAP solutions for GRC. This is the second year in a row that SAP has been awarded this honor.

8 INTERIM MANAGEMENT REPORT
RESEARCH AND DEVELOPMENT Our total research and development expense rose by 6% to €557 million in the first three months of 2013, compared to €523 million in the corresponding period in 2012. On our IFRS numbers, the portion of total revenue we spent on research and development in the first three months of 2013 was 15.5%, which remains virtually stable compared to the 15.6% recorded for the first three months of 2012. On the non-IFRS numbers, the portion of total revenue we spent on R & D in the first three months of 2013 was 14.7%, a 0.2 percentage point decrease in comparison with the portion in the first three months of the previous year, which was 14.9%. We had 18,060 full-time equivalent (FTE) employees working in research and development teams on March 31, 2013, an increase of 8% compared with March 31, 2012 (March 31, 2012: 16,762; December 31, 2012: 18,012). This growth mainly reflects the addition of research and development employees from Ariba. ACQUISITIONS The acquisition of Ticket-Web, KMS Software Company LLC, Camilion Inc., and SmartOps Corporation in March and April of 2013 was not material to SAP. Acquisitions of the prior year are described in the Consolidated Financial Statements 2012, which are included in our 2012 Integrated Report. EMPLOYEES Our vision to help the world run better and improve people’s lives relies on the power of human thinking, innovation, and creativity. For this reason, nothing is more critical to the long-term success of SAP and our customers than our employees. They deliver value to our customers and drive our sustainable growth and profitability. An important factor for our success is our ability to attract and retain talented employees. In the first quarter of 2013, the employee retention rate was 94% (up from 93% in the first quarter of 2012). We define employee retention rate as the ratio between the average number of employees less voluntary employee departures (fluctuation) and the average number of employees (in full-time equivalents). One of SAP’s overall non-financial goals is fostering a diverse workforce, specifically increasing the
number of women in management. At the end of the first quarter of 2013, the company employed 19.9% women in management, compared to 18.7% at the end of the first quarter of 2012. SAP has set a long-term target to increase the share of women in management to 25% by the year 2017. At the end of the first quarter of 2013, we had 64,598 full-time equivalent (FTE) employees worldwide (March 31, 2012: 59,420; December 31, 2012: 64,422) – an increase of 176 compared to year end 2012. Our overall employee headcount on March 31, 2013, included 16,675 FTEs based in Germany (March 31, 2012: 16,398; December 31, 2012: 16,671), and 13,533 based in the United States (March 31, 2012: 12,043; December 31, 2012: 13,492). ORGANIZATION On March 21, 2013, the Supervisory Board of SAP AG approved the proposal of the Executive Board to prepare the conversion of the legal form of SAP AG into a European Company (Societas Europaea, SE). The Executive Board and the Supervisory Board believe that the planned change of legal form reflects SAP’s position as an internationally-oriented company with European roots. The legal form of European Company takes into account SAP’s European and international business activities. Furthermore, this legal form offers the possibility to optimize both the corporate governance structure and work of the corporate bodies of SAP AG. With the conversion into an SE, the shareholders of SAP AG automatically become shareholders of SAP SE. Shareholders’ rights remain unchanged. The conversion of legal form requires the approval of the shareholders. This is planned to be secured at the Annual General Meeting of Shareholders in 2014. We currently believe that negotiations with the European employees regarding participation of employees in the SE will have been completed by the end of 2013. These negotiations are initiated based on the decision by the Executive Board on March 21, 2013.

INTERIM REPORT JANUARY – MARCH 2013 9
ASSETS, FINANCES, AND OPERATING RESULTS In the sections that follow, our assets, finances, and operating results are discussed in detail. In the discussion of our assets, finances, and operating results, the financial data presented for the first quarter of 2013 fully contains the revenue and expenses, assets, liabilities, and cash flows from SuccessFactors and Ariba. Comparator amounts contain SuccessFactors numbers on a pro rata basis effective February 21, 2012. Ariba numbers are not included – Ariba was acquired on October 1, 2012. Performance Against Our Outlook for 2013 (Non-IFRS)
In this section, all discussion of the first three months’ contribution to target achievement is based exclusively on non-IFRS measures. However, in the following section, the discussion of results refers to IFRS figures only, so those figures are not expressly identified as IFRS figures. We present, discuss, and explain the reconciliation from IFRS measures to non-IFRS measures in the Supplementary Financial Information (Unaudited) section. Operational Targets for 2013 (Non-IFRS) For our outlook based on non-IFRS numbers, see the Forecast for SAP passage in this interim management report.
Key Figures – SAP Group 1/1/ to 3/31/2013 (Non-IFRS) Non-IFRS€ millions, unless otherwise stated 1/1/ -
3/31/20131/1/ -
3/31/2012Change in % Change in %
(Constant Currency)
Software 657 637 3 5
Cloud subscriptions and support 167 35 380 385
Software and cloud subscription 824 672 23 25
Support 2,113 1,954 8 10
Software and software-related service revenue 2,937 2,626 12 14
Total revenue 3,636 3,357 8 10
Operating expense −2,734 −2,523 8 10
Operating profit 901 834 8 11
Operating margin in % 24.8 24.8 0 0.3pp
Profit after tax 689 583 18 n.a.
Effective tax rate in % 21.4 28.1 −6.7pp n.a.
Earnings per share – basic in € 0.58 0.49 18 n.a.
Deferred cloud subscriptions and support revenue (March 31)
377 193 95 n.a.
Actual Performance in the First Quarter of 2013 (Non-IFRS) In the first quarter of 2013, software and software-related service revenue (non-IFRS) increased 12% compared with the same period in the previous year to €2,937 million (Q1 2012: €2,626 million). At constant currencies, the increase was 14%. Included in our non-IFRS software and software-related service revenue, our revenue from cloud subscriptions and support was €167 million (Q1 2012: € 35 million), an increase of 380% compared to the same period in 2012. The amounts for 2013 include full cloud subscriptions and cloud support revenue from SuccessFactors and Ariba, comparator amounts contain SuccessFactors numbers on a pro rata basis effective February 21, 2012, only. Deferred cloud subscriptions and
support revenue was €377 million as of March 31, 2013 (March 31, 2012: €193 million). Our cloud subscription and support backlog as of December 31, 2012 was €800 million. Non-IFRS total revenue in the same period was €3,636 million (Q1 2012: €3,357 million), an increase of 8%. On a constant currency basis, the increase was 10%. Non-IFRS operating profit was €901 million (Q1 2012: €834 million), an increase of 8% (11% at constant currencies). Non-IFRS operating margin was 24.8% which remains unchanged compared to the prior year (Q1 2012: 24.8%). Non-IFRS operating margin was 25.1% at constant currencies, an increase of

10 INTERIM MANAGEMENT REPORT
0.3 percentage points. Non-IFRS operating profit and operating margin for the first quarter of 2013 were affected by the acquisitions of SuccessFactors and Ariba, which impacted the operating margin by approximately 80 basis points. The organic margin performance demonstrates that efficiency in SAP’s core business has improved further. In the first quarter of 2013, non-IFRS profit after tax was €689 million (Q1 2012: €583 million), an increase of 18%. Non-IFRS basic earnings per share was €0.58 (Q1 2012: €0.49), an increase of 18%. The non-IFRS effective tax rate in the first quarter of 2013 was 21.4% (Q1 2012: 28.1%). The year over year decrease in the effective tax rate mainly resulted from changes in the regional allocation of income, from taxes for prior years, and from tax effects on changes in foreign currency exchange rates. Overall, during the first three months, our Non-IFRS numbers at actual currencies experienced a negative currency impact compared to what they would have been if translated at the exchange rates from last year: SSRS revenue was impacted by €56m or minus 1.9%, total revenue was impacted by €67m or minus 1.8%, impacting the SSRS and total revenue growth rates by 2 percentage points each. The operating margin was negatively impacted by 30 basis points. If exchange rates remained unchanged at the March 2013 level for the remainder of the year, our 2013 full year Non-IFRS SSRS revenue and Non-IFRS total revenue at actual currencies would both be approximately 2% lower than the respective constant currency numbers, representing a negative impact of approximately 2-3 percentage points to the SSRS and total revenue growth rates. Our Non-IFRS operating margin at actual currencies would be approximately 40-50 basis points lower than the respective constant currency margin. Segment Information Following SAP’s increased focus on the cloud business, in the third quarter 2012 we changed both the structure of the components that SAP management uses to make decisions about operating matters, and the main profit measure used for the purposes of allocating resources to these components and measuring their performance. For information about the changes to our segment reporting and a description of the activities of our new segments, see the Notes to the Interim Financial Statements section, Note (17).
SAP has two divisions – On-Premise and Cloud, which are further divided into operating segments. Our On-Premise division is comprised of two operating segments: On-Premise Products and On-Premise Services. In the third quarter of 2012, our Cloud division was comprised of one operating segment: Cloud Applications. Following the acquisition of Ariba, we established a second operating segment in the Cloud division, mainly consisting of the acquired Ariba business (Ariba). The operations of Crossgate, which we acquired in 2011, are also included in the operating segment containing the acquired Ariba business. All operating segments are reportable segments. Key Figures in SAP Segment Reporting in the First Quarter of 2013 In the first quarter of 2013, revenue in the On-Premise division increased by 3% to €3,412 million (Q1 2012: €3,309 million). Of this, €2,756 million (Q1 2012: €2,590 million) was revenue from the Products segment, representing an increase of 6%. Revenue from the Services segment rose by 9% to €656 million (Q1 2012: €720 million). In the first quarter of 2013, segment revenue in the Cloud division achieved €224 million (Q1 2012: €48 million). Of this, €115 million (Q1 2012: €43 million) was revenue from the Cloud Applications segment, €109 million (Q1 2012: €5 million) was revenue from the Ariba segment. Comparator amounts for revenue from the Cloud Applications segment include revenues from SuccessFactors on a pro rata basis effective February 21, 2012. For the Ariba segment the trailing twelve month network spend volume was approximately $460 billion. The annual cloud revenue run rate is approaching €900 million. The annual revenue run rate is the first quarter 2013 cloud division revenue multiplied by 4. Segment profit for the On-Premise division was €1,600 million (Q1 2012: €1,545 million, including €1,484 million (Q1 2012: €1,407 million) from the Products segment and €117 million (Q1 2012: €138 million) from the Services segment. In the first quarter of 2013, the operating segment margin for the reportable segments was 54% (Q1 2012: 54%) for the Products segment, and 18% (Q1 2012: 19%) for the Services segment. This resulted in an operating margin of 47% (Q1 2012: 47%) for the entire On-Premise division. Segment profit for the Cloud division contains for the first time positive results from both segments: €1 million (Q1 2012: €-19 million) from the Cloud Applications segment and €26 million (Q1 2012:

INTERIM REPORT JANUARY – MARCH 2013 11
€-6 million) from the Ariba segment. Segment profit for the entire Cloud division was €28 million (Q1 2012: €-25 million). In the first quarter of 2013, the operating segment margin for the reportable segments was 0% (Q1 2012: -44%) for the Cloud Applications segment, and 24% (Q1 2012: -120%) for the Ariba segment. This resulted in an operating margin of 13% (Q1 2012: -52%) for the entire Cloud division.

12 INTERIM MANAGEMENT REPORT
Key Figures SAP Group in the First Quarter of 2013 (IFRS)
€ millions, unless otherwise stated 1/1/ -3/31/2013
1/1/ -3/31/2012
Change Change in %
Software 657 637 20 3
Cloud subscriptions and support 137 29 108 373
Software and cloud subscription 794 666 128 19
Support 2,109 1,953 156 8
Software and software-related service revenue 2,903 2,619 284 11
Total revenue 3,601 3,350 251 7
Operating expense −2,955 −2,719 −236 9
Operating profit 646 631 15 2
Operating margin in % 17.9 18.8 −0.9pp n.a.
Profit after tax 520 444 76 17
Effective tax rate in % 16.3 26.9 −10.6pp n.a.
Headcount in full-time equivalents (March 31) 64,598 59,420 5,178 9
Days sales outstanding in days (March 31) 61 60 1 2
Earnings per share – basic in € 0.44 0.37 0.06 19
Deferred cloud subscriptions and support revenue (March 31)
344 120 224 187
OPERATING RESULTS IN THE FIRST QUARTER (IFRS) Orders The total number of software deals we closed decreased by 11% from the comparator amount in the first quarter of 2013 to 11,987 (Q1 2012: 13,526). In contrast, the average value of software orders we received showed an increase of 23% compared with the previous year. In the first quarter of 2013, 22% (Q1 2012: 13%) of the value of new software orders came from orders whose volume exceeded €5 million, while 48% (Q1 2012: 59%) came from orders worth less than €1 million. Revenue In the first quarter of 2013, software revenue was €657 million (Q1 2012: €637 million), an increase of 3% compared to the same period in 2012. Software revenue in the first quarter of 2013 included amounts of €86 million (Q1 2012: €28 million) from SAP HANA. We had a strong double-digit growth in our mobile business in the first three months of 2013. Our revenue from cloud subscriptions and support was €137 million (Q1 2012: €29 million), an increase of 373% compared to the same period in 2012. The amounts for 2012 include cloud subscriptions and cloud support revenue from SuccessFactors since its acquisition date (February 21, 2012). Ariba is not included in prior year numbers.
Total revenue was €3,601 million (Q1 2012: €3,350 million), an increase of 7% compared to the same period in 2012. Operating Expenses In the first quarter of 2013, our operating expenses increased by 9% to €2,955 million (Q1 2012: €2,719 million). The increase in operating expenses is mainly due to the increased headcount. Operating Profit and Margin In the first quarter of 2013, operating profit increased by 2% compared with the same period in the previous year to €646 million (Q1 2012: €631 million). Our operating margin decreased mainly due to acquisitions by 0.9 percentage points to 17.9% (Q1 2012: 18.8%). Profit After Tax and Earnings per Share In the first quarter of 2013, profit after tax was €520 million (Q1 2012: €444 million), an increase of 17%. Basic earnings per share was €0.44 (Q1 2012: €0.37), an increase of 19%. The effective tax rate in the first quarter of 2013 was 16.3% (Q1 2012: 26.9%). The year over year decrease in the effective tax rate mainly resulted from changes in the regional allocation of income, from taxes for prior years, and from tax effects on changes in foreign currency exchange rates.

INTERIM REPORT JANUARY – MARCH 2013 13
FINANCES (IFRS) Cash Flow and Liquidity Operating cash flow for the first three months of 2013 was €2,162 million (first three months of 2012: €2,071 million), our highest first three months figure ever. The improvement in operating cash flow is due to a continuous good management of working capital focusing on receivables, which on January 1, 2013, were 12% higher than in the previous year thanks to the Company’s business success in 2012. Group liquidity stood at €4,610 million on March 31, 2013 (December 31, 2012: €2,492 million). Group liquidity comprised cash and cash equivalents totaling €4,473 million (December 31, 2012: €2,477 million) and short-term investments totaling €137 million (December 31, 2012: €15 million). Group Liquidity of SAP Group € millions March 31,
2013 Decem- ber 31,
2012
Change
Cash and cash equivalents 4,473 2,477 1,996
Short-term investments 137 15 122
Group Liquidity - gross 4,610 2,492 2,118
Current bonds 600 600 0
Net liquidity 1 4,010 1,892 2,118
Non-current private placement transactions
2,156 2,094 62
Non-current bonds 2,300 2,300 0
Net liquidity 2 −446 −2,502 2,056
Net liquidity 1 is total group liquidity minus current bonds. Net liquidity 2, defined as net liquidity 1 minus non-current private placement transactions, and bonds, was €-446 million (December 31, 2012: €-2,502 million). The reduction compared to December 31, 2012, is mainly attributable to the positive operating cash flow in the first three months of 2013. Free Cash Flow and Days Sales Outstanding (DSO) Our free cash flow and our DSO on March 31, 2013, were as follows: Free Cash Flow € millions 1/1 -
3/31/ 2013
1/1 - 3/31/
2012
Change in %
Free cash flow 2,049 1,958 5
We calculate free cash flow as net cash from operating activities minus purchases of intangible assets and property, plant, and equipment. Days Sales Outstanding
March 31, 2013
March 31, 2012
Change in Days
Days sales outstanding (DSO) in days
61 60 1
DSO measures the length of time it takes to collect receivables. SAP calculates DSO by dividing the average invoiced accounts receivables balance of the last 12 months by the average monthly sales of the last 12 months. ASSETS (IFRS) Analysis of Consolidated Statements of Financial Position The total assets of the Group were €29,294 million on March 31, 2013, an increase of €2,584 million since December 31, 2012, resulting mainly from an increase in cash and cash equivalents from the operating cash flow respectively the seasonal increase in deferred revenue. The equity ratio on March 31, 2013, was 51% (December 31, 2012: 53%), a slight decrease. Investments Investments in intangible assets and property, plant, and equipment decreased significantly in the first three months of 2013 to €116 million (first three months of 2012: €3,081 million). This decrease is due to our prior year acquisition of SuccessFactors and is mainly attributable to additions to goodwill and intangible assets. Off-Balance-Sheet Financial Instruments There are no off-balance-sheet financial instruments, such as sale-and-lease-back transactions, asset-backed securities, or liabilities related to special-purpose entities, that are not disclosed in our interim Consolidated Financial Statements. Any factoring contracts are not material in volume. Competitive Intangibles The assets that are the basis for our current and future success do not appear on the Consolidated Statements of Financial Position. This is apparent from a comparison of the market capitalization of SAP AG, which was €76.8 billion, with the equity of the SAP Group on the Consolidated Statements of Financial Position, which was €15.0 billion at the end of the first three months of 2013 (December 31,

14 INTERIM MANAGEMENT REPORT
2012: €14.2 billion). This means that the market capitalization of our equity is more than five times higher than the book value. Customer capital, our employees and their knowledge and skills, our ecosystem of partners, the SAP brand, and our past investments in research and development are some of the most important competitive intangibles that influence our market value. According to the 2012 Interbrand annual survey of the Top 100 Best Global Brands, SAP is ranked the 25th most valued brand in the world. Interbrand determined a value of US$15.6 billion. ENERGY AND EMISSIONS As we create solutions for our customers to better manage resources, we must also look to ourselves and improve our own environmental performance. We also acknowledge greenhouse gas (GHG) emissions as a proxy measure for inefficient operations and excess spending. For the first quarter ending March 31, 2013, SAP’s GHG emissions totaled 140 kilotons – an increase of 7.7% compared to the first quarter of 2012. This rise is primarily due to the acquisitions of SuccessFactors and Ariba. Comparator amounts contain SuccessFactors numbers on a pro rata basis effective February 21, 2012. Ariba numbers are not included – Ariba was acquired on October 1, 2012. Since the beginning of 2008, SAP has achieved a €235 million cost avoidance compared to a business-as-usual scenario, through energy saving and emission reduction initiatives. SAP STOCK SAP AG common stock is listed on the Frankfurt Stock Exchange as well as a number of other German exchanges. On the New York Stock Exchange (NYSE), SAP American depositary receipts (ADRs), each representing one common share, trade under the symbol SAP. SAP is a component of the DAX (the index of 30 German blue chip companies), the Dow Jones EURO STOXX 50, and the S&P North American Technology Software Index.
Key Facts About SAP Stock / SAP ADRs Listings Germany Berlin, Frankfurt, Stuttgart
United States (ADR) New York Stock Exchange
IDs and symbols
WKN/ISIN 716460/DE0007164600
NYSE (ADR) 803054204 (CUSIP)
Reuters SAPG.F or .DE
Bloomberg SAP GR Weight (%) in indices at 3/31/2013
DAX 30 8.47%
Prime All Share 6.80%
CDAX 6.89%
HDAX 7.12%
Dow Jones STOXX 50 2.01% Dow Jones EURO STOXX 50
3.66%
SAP stock developed better in the first quarter of 2013 than its two most important benchmark indices. The SAP share price rose 3.0%, while the DAX 30 index grew only 2.4%. In contrast, the EURO STOXX 50 index lost 0.5% over the same period. Having started the year at the end of 2012 with a Xetra closing price of €60.69, SAP stock reached its lowest level of the quarter on January 22 at €57.82. The very next day, however, the announcement of the Company's detailed 2012 fourth quarter, full year preliminary results and guidance initiated an upward trend that saw the share price climb to €60.91 on February 1 in a positive market environment. Worries about the financial stability of Spain and the political situation in Italy subsequently slowed the European stock markets. In an environment characterized by considerable uncertainty, the SAP stock price hovered within a narrow range around the €60.00 mark for most of February. The markets began to recover at the beginning of March after the U.S. Federal Reserve decided for further easing of its monetary policy. In mid-March for example, the DAX passed the 8,000 point mark for the first time since December 2007. SAP’s share price benefited from its appearance at CeBIT 2013, the world's largest IT industry trade fair. The share price increased to €64.80 on March 15 – its highest level since the week of March 6 – 10, 2000. The financial crisis in Cyprus and ongoing problems in Italy then caused the markets to decline. The SAP stock closed the first quarter at €62.50.

INTERIM REPORT JANUARY – MARCH 2013 15
Capital Stock SAP's capital stock on March 31, 2013, was €1,228,504,232 (December 31, 2012: €1,228,504,232). It is issued as 1,228,504,232 no-par shares, each with an attributable value of €1 in relation to the capital stock.
Free Float On March 31, 2013, the proportion of our stock in free float, applying the definition accepted on the Frankfurt Stock Exchange – which excludes treasury stock from the free float – stood at 74.4% (December 31, 2012: 74.4%). Market capitalization With the Xetra closing price at €62.50 on the last trading day in the first quarter, SAP’s market capitalization was €76.8 billion based on 1,228,504,232 million outstanding shares. SAP was therefore the largest DAX company based on market capitalization. Deutsche Börse uses the free-float factor to weight companies in the DAX. The free-float factor for SAP was 73.53% on the last trading day in the first quarter, resulting in a free-float market capitalization of approximately €56.6 billion. When measured by its free-float market capitalization, SAP was the forth-largest company listed on the DAX at the end of the quarter. For more information about SAP common stock, see the SAP Website at www.sap.com/investor.
RISK AND OPPORTUNITY MANAGEMENT We have comprehensive risk-management structures in place, which are intended to enable us to recognize and analyze risks early and to take the appropriate action. For changes in our legal liability risks since our last annual report, see Note 14 in the Notes to the Interim Financial Statements. The other risk factors remain largely unchanged since 2012, and are discussed more fully in our 2012 Integrated Report and our Annual Report on Form 20-F for 2012. We do not believe the risks we have identified jeopardize our ability to continue as a going concern. Opportunities also remain largely unchanged since 2012. SUPPLEMENTARY REPORT No events have occurred after March 31, 2013, which have a material significance for the Group’s assets, finances, and operating results. OUTLOOK Future Trends in the Global Economy The European Central Bank (ECB) and International Monetary Fund (IMF) expect the global economy to pick up speed through the remainder of 2013 and end the year with an average growth rate of almost 4%. However, economies will continue to develop very differently from one another: The institutions predict that the economic development in advanced economies will only expand slowly reaching an average of 1.4%, whereas emerging

16 INTERIM MANAGEMENT REPORT
markets will see an almost 5.5% increase in GDP and thus become important drivers of growth in the global economy. According to the analysts, the economy in the EMEA region will gradually stabilize in the second half of the year. Restrictive credit terms in the euro area could slow growth and reduce the region's GDP for the full year by 0.2% stated by the IMF. According to ECB growth could decline by up to 0.9%. The Americas region, on the other hand, is forecast to grow strongly, despite the fact that GDP in the United States is expected to rise only about 2% due to federal spending cuts and an increase in income tax rates. In the APJ region experts anticipate that economic development will remain mixed: Japan's economy is forecast to only grow about 1% for the year as a whole, whereas China can anticipate strong growth of about 8%. Economic Trends – Year-Over-Year GDP Growth % World 2012e 2013p 2014p
World 3.2 3.5 4.1
Advanced Economies 1.3 1.4 2.2
Developing and Emerging Economies
5.1 5.5 5.9
Europe, the Middle East, and Africa (EMEA)
European Union -0.2 0.2 1.4
Euro Area -0.4 -0.2 1.0
Germany 0.9 0.6 1.4
Central and Eastern Europe 1.8 2.4 3.1
Middle East and North Africa
5.2 3.4 3.8
Sub-Saharan Africa 4.8 5.8 5.7
Americas
United States 2.3 2.0 3.0
Canada 2.0 1.8 2.3
Central and South America, Caribbean
3.0 3.6 3.9
Asia Pacific Japan
Asian Emerging Economies 1.8 3.2 3.9
Asian Developing Economies
6.6 7.1 7.5
Japan 2.0 1.2 0.7
China 7.8 8.2 8.5
e = Estimate; p = Projection Source: IMF, p. 2. Future Trends in the IT Market Market research firm International Data Corporation (IDC) believes that companies and consumers will remain cautious with their IT spending over the course of 2013 as long as general uncertainty continues to impact the economic climate. The organization therefore assumes global
IT spending will remain constant at around 6%. Mobile devices are expected to account for half of all expenditures in the hardware segment, which IDC believes will expand at a slower pace than in the past. The software and services segments, on the other hand, is expected to grow somewhat faster than before. In the EMEA region, IDC envisions only a slight increase in IT spending in Europe, where investments in software and mobile devices are expected to increase at an above-average rate. In the Americas, the researchers predict that IT business growth will largely depend on the economic and political development in the United States, where higher taxes and lower government spending could cause a decline in IT investments in the entire region. The IT market in the APJ region, meanwhile, is once again forecast to grow considerably, especially in China, where IDC anticipates double-digit percentage growth rates. Only Japan's IT market is expected to remain relatively stable, due to the fact that reconstruction efforts following the earthquake of 2011 have held back IT spending in that country. Trends in the IT Market – Increased IT spending year-over-year % World 2012e 2013p 2014p
Total IT 5.9 5.5 5.7
Hardware 7.6 6.1 6.0
Packaged software 6.0 6.4 6.7
Applications 6.4 6.3 6.4
IT Services 3.3 3.9 4.5 Europe, Middle East, Africa (EMEA)
IT total 4.1 3.4 4.4
Packaged software 4.6 5.0 5.7
Applications 4.8 4.8 5.2
IT Services 0.9 2.3 3.8
Americas
IT total 5.4 6.4 6.4
Packaged software 6.9 7.3 7.4
Applications 7.4 7.3 7.2
IT Services 4.7 4.7 4.5
Asia Pacific Japan
IT total 8.9 6.5 6.0
Packaged software 6.3 6.2 6.4
Applications 6.2 6.1 6.2
IT Services 4.9 5.4 5.7 e= Estimate, p = Projection source: IDC Worldwide Black Book Q4 2012

INTERIM REPORT JANUARY – MARCH 2013 17
Impact on SAP As long as the global economy and IT industry develop as currently forecast, SAP expects to outpace them for the remainder of 2013. To achieve this, SAP will focus on our established innovation strategy and our clear customer focus. SAP is well positioned to absorb fluctuations in the economy due to its global presence across many industries. Our five innovative market categories: Applications, Analytics, Cloud, Mobile, and Database and Technology give us a competitive edge even during difficult economic times. In the coming months, we will continue to invest in countries in which we expect significant growth, such as Brazil, China, India, Russia, and countries in the Middle East and Africa. We see further growth potential in the future that will help us reach our ambitious goals for 2013 and our mid-term goals for 2015. For more information, see the Operational Targets for 2013 (Non-IFRS) section. Forecast for SAP Operational Targets for 2013 (Non-IFRS) Revenue and Operating Profit Outlook SAP reiterates the outlook for the full year 2013, which remains unchanged from the outlook provided on January 23, 2013:
- The Company expects full year 2013 non-IFRS software and cloud subscription revenue to increase in a range of 14% – 20% at constant currencies (2012: €5.00 billion). The full year 2013 non-IFRS cloud subscription and support revenue contributing to this growth is expected to be around €750 million at constant currencies (2012: €343 million).
- The Company expects full-year 2013 non-
IFRS software and software-related service revenue to increase in a range of 11% – 13% at constant currencies (2012: €13.25 billion).
- The Company expects full-year 2013 non-
IFRS operating profit to be in a range of €5.85 billion – €5.95 billion at constant currencies (2012: €5.21 billion).
- The Company projects a full-year 2013 IFRS
effective tax rate of 25.5% – 26.5% (2012: 26.2%) and a non-IFRS effective tax rate of 27.0% – 28.0% (2012: 27.5%).
We expect our professional services and other service revenue to grow in the low single-digit percentages range. But we also believe that the anticipated rise in software and software-related service revenue will bring about a significant increase in total revenue in 2013. We expect that total revenue (non-IFRS) will continue to depend largely on the revenues from the On-Premise Products segment. The expected growth in revenue from this segment, however, is below the outlook provided for software and cloud subscription revenue (non-IFRS). Keeping in line with the growth rate for professional services and other service revenue, we do not expect to see strong growth in the On-Premise Services segment. Looking at our above forecast for cloud subscriptions and support revenue (non-IFRS, at constant currencies), we anticipate a similar level of growth for segment revenues in the Cloud division (combining the Cloud Applications and Ariba segments). Particularly strong growth results are expected in the Ariba segment, since we only began including Ariba figures in the 2012 segment revenues at the beginning of the fourth quarter following the first consolidation. We expect an increase in segment profit in our On-Premise division with the On-Premise Products segment profit growing faster than the On-Premise Services segment, which is expected to only experience a slight profit improvement. The Cloud division is expected to achieve, for the first time, a positive segment profit resulting from a reduced segment loss in the Cloud Applications segment and a strong increase in the Ariba segment profit. We expect that software revenue from SAP HANA will range between €650 million to €700 million (2012: €392 million). Total cloud revenue is expected to approach €1billion in 2013. Differences Between IFRS and Non-IFRS Measures As noted above, our guidance is based on non-IFRS measures at constant currencies. The following provides additional insight into the impact of the constant currency notion and the items by which our IFRS measures and non-IFRS measures differ. The following amounts represent estimates for 2013 and a comparison of the actual differences between IFRS and non-IFRS measures on operating profit for the first three months of 2013 and 2012:

18 INTERIM MANAGEMENT REPORT
Non-IFRS Measures (€ millions) Estimated
amounts for 1/1 -
12/31/20131)
Actual Amounts
from 1/1 - 3/31/2013
Actual Amounts
from 1/1 - 3/31/2012
Deferred revenue write-down
Between 65 and 75
35 7
Discontinued activities 2)
< 10 0 −7
Share-based payment expenses 3),4)
Between 440 and 480
70 83
Acquisition-related charges 5)
Between 560 and 600
137 120
Restructuring Between 40 and 60
13 0
1) All adjusting items are partly incurred in currencies other than the euro. Consequently, the amounts are subject to currency volatility. All estimates for 2013 provided in the table are at actual currency and are calculated based on certain assumptions regarding the developments of the different currency exchange rates. Depending on the future development of these exchange rates, the total amounts for 2013 may differ significantly from the estimates provided in the table above. The reader should remember that SAP’s outlook is based on constant currency. 2) We will consider all new information that emerges from further developments of the TomorrowNow lawsuit to determine if the provision should be adjusted in the future, which could result in a change to the estimate provided in the table above. 3) Our share-based payment expenses are subject, among other factors, to share price volatility, volatility in SAP’s performance against the Tech PGI index, anticipated achievement of financial KPI objectives, and fluctuations in SAP’s workforce. The estimates in the table above are based on certain assumptions regarding these factors. Depending on how these factors change in the future, the total expense for 2013 may differ significantly from these estimates. 4) The estimates provided above for share-based compensation expenses include grants under existing programs. New share-based compensation plans or changes to the existing plans may make the total amounts for 2013 differ significantly from these estimates. 5) The estimates provided above for acquisition-related charges are based on the acquisitions performed by SAP until the day of this document. Further acquisitions may make the total amounts for 2013 differ significantly from these estimates. Goals for Liquidity, Finance, Investments, and Dividends Our goals for liquidity, finance, investments, and dividends as discussed in our 2012 Integrated Report have changed as follows: Our net liquidity position was slightly negative on March 31, 2013. We believe that our liquid assets combined with our undrawn credit facilities are sufficient to meet our present operating financing needs in 2013 and, together with expected cash flows from operations, will support our currently planned capital expenditure requirements over the near term and medium term. We intend to reduce
our financial debt as and when the debt falls due. We will consider issuing new debt, such as bonds or U.S. private placements, on an as-needed basis only and if market conditions are advantageous. We currently have no concrete plans for future share buybacks. Excepting acquisitions, our planned capital expenditures for 2013 and 2014 can be covered in full by operating cash flow and will chiefly be spent on increasing data center capacity in our locations in Newtown Square, Pennsylvania, United States, and St. Leon-Rot, Germany, and on renovating our office building in Vancouver, Canada. As part of our growth and innovation strategy, we plan to spend around US$2 billion in China by 2015. This demonstrates our long-term strategic commitment to China, the world’s second-largest economy. SAP continues to invest and increase its presence and market share in countries experiencing high growth. We plan to continue our dividend policy, which is that the payout ratio should be more than 30%. Premises on Which Our Outlook Is Based In preparing our outlook guidance, we have taken into account all events known to us at the time we prepared this report that could influence SAP’s business going forward. Among the premises on which this outlook is based are those presented concerning economic development. This outlook does not take into consideration any effects in 2013 from major acquisitions. Medium-Term Prospects Our medium-term prospects as discussed in our 2012 Integrated Report and our 2012 Annual Report on Form 20-F did not change in the first three months of 2013. We still aim to increase our total revenue to more than €20 billion by 2015. In the same period,we aim to widen our non-IFRS operating margin to 35%. To achieve these goals, we want to further strengthen our position in our five market categories and have one billion users by 2015. We want to extend our leadership in the
applications segment. We want to extend our market share in analytics. We want to extend our leadership in mobile
computing. We want to become a profitable market leader in
cloud computing, generating around €2 billion total revenue in this segment by 2015.
Our plan is for indirect sales (partner revenue) to contribute up to 40% of software revenue by 2015.
INTERIM REPORT JANUARY – MARCH 2013 19
CONSOLIDATED INTERIM FINANCIAL STATEMENTS – IFRS (Unaudited) Consolidated Income Statements – Quarter 20 Consolidated Statements of Comprehensive Income – Quarter 21 Consolidated Statements of Financial Position – March 31, 2013 22 Consolidated Statements of Changes in Equity – First Three Months 24 Consolidated Statements of Cash Flows – First Three Months 25 NOTES TO THE CONSOLIDATED INTERIM FINANCIAL STATEMENTS (1) General Information About Consolidated Financial Statements 26 (2) Scope of Consolidation 26 (3) Summary of Significant Accounting Policies 26 (4) Business Combinations 27 (5) Employee Benefits Expense and Headcount 28 (6) Income Tax 29 (7) Earnings per Share 29 (8) Other Financial Assets 30 (9) Trade and Other Receivables 30 (10) Financial Liabilities 31 (11) Deferred Income 31 (12) Total Equity 31 (13) Contingent Liabilities 32 (14) Litigation and Claims 32 (15) Share-Based Payments 34 (16) Other Financial Instruments 34 (17) Segment and Geographic Information 39 (18) Related Party Transactions 39 (19) Subsequent Events 43

20 CONSOLIDATED INTERIM FINANCIAL STATEMENTS – IFRS
CONSOLIDATED INCOME STATEMENTS For the three months ended March 31 € millions, unless otherwise stated Note 2013 2012 Change
in %Software 657 637 3Cloud subscriptions and support 137 29 373
Software and cloud subscription 794 666 19Support 2,109 1,953 8Software and software-related service revenue 2,903 2,619 11Consulting 557 597 −7Other services 142 134 6Professional services and other service revenue 698 731 −4
Total revenue 3,601 3,350 7
Cost of software and software-related services −604 −538 12Cost of professional services and other services −605 −624 −3Total cost of revenue −1,210 −1,162 4Gross profit 2,391 2,188 9Research and development −557 −523 6Sales and marketing −975 −831 18General and administration −197 −209 −6Restructuring −13 0 N/ATomorrowNow litigation 0 7 −97Other operating income/expense, net −3 −1 >100
Total operating expenses −2,955 −2,719 9Operating profit 646 631 2 Other non-operating income/expense, net −10 −8 32
Finance income 30 24 23Finance costs −44 −40 11
Financial income, net −15 −16 −8Profit before tax 621 607 2
Income tax TomorrowNow litigation 0 −2 −95Other income tax expense −101 −161 −38
Income tax expense (6) −101 −163 −38Profit after tax 520 444 17
Profit attributable to non-controlling interests 0 0 N/AProfit attributable to owners of parent 520 444 17
Basic earnings per share, in €* (7) 0.44 0.37 19
Diluted earnings per share, in €* (7) 0.44 0.37 19
* For the three months ended March 31, 2013 and 2012, the weighted average number of shares was 1,193 million (diluted 1,195 million) and 1,190 million (diluted: 1,191 million), respectively (treasury stock excluded).

INTERIM REPORT JANUARY – MARCH 2013 21
CONSOLIDATED STATEMENTS OF COMPREHENSIVE INCOME For the three months ended March 31 € millions 2013 2012Profit after tax 520 444
Items that will not be reclassified to profit and loss
Remeasurements on defined benefit pension plans −2 3
Income tax relating to items that will not be reclassified 0 −1
Other comprehensive income after tax for items that will not be reclassified to profit and loss −2 2
Items that will be reclassified subsequently to profit and loss
Exchange differences on translation 229 −164
Available-for-sale financial assets 0 35
Cash flow hedges 0 23
Income tax relating to items that will be reclassified 6 −12
Other comprehensive income after tax for items that will be reclassified to profit and loss 235 −118
Other comprehensive income net of tax 233 −116
Total comprehensive income 753 328
– Attributable to owners of parent 753 328
– Attributable to non-controlling interests 0 0

22 CONSOLIDATED INTERIM FINANCIAL STATEMENTS – IFRS
CONSOLIDATED STATEMENTS OF FINANCIAL POSITION As at March 31, 2013, and December 31, 2012 € millions Notes 2013 2012
Cash and cash equivalents 4,473 2,477
Other financial assets (8) 279 154
Trade and other receivables (9) 3,872 3,917
Other non-financial assets 346 294
Tax assets 299 156
Total current assets 9,269 6,998
Goodwill 13,512 13,274
Intangible assets 3,168 3,234
Property, plant, and equipment 1,725 1,708
Other financial assets (8) 531 509
Trade and other receivables (9) 97 88
Other non-financial assets 93 68
Tax assets 185 170
Deferred tax assets 715 660
Total non-current assets 20,025 19,711
Total assets 29,294 26,710

INTERIM REPORT JANUARY – MARCH 2013 23
€ millions Notes 2013 2012
Trade and other payables 809 870
Tax liabilities 552 511
Financial liabilities (10) 873 802
Other non-financial liabilities 1,471 2,136
Provision TomorrowNow litigation 240 234
Other provisions 406 609
Provisions 646 843
Deferred income (11) 3,959 1,386
Total current liabilities 8,309 6,547
Trade and other payables 45 63
Tax liabilities 394 388
Financial liabilities (10) 4,500 4,446
Other non-financial liabilities 111 98
Provisions 382 361
Deferred tax liabilities 535 574
Deferred income (11) 65 62
Total non-current liabilities 6,032 5,991
Total liabilities 14,341 12,538
Issued capital 1,229 1,229
Share premium 508 492
Retained earnings 14,500 13,973
Other components of equity 41 −194
Treasury shares −1,334 −1,337
Equity attributable to owners of parent 14,944 14,163
Non-controlling interests 9 8
Total equity (12) 14,953 14,171
Equity and liabilities 29,294 26,710

24 CONSOLIDATED INTERIM FINANCIAL STATEMENTS – IFRS
CONSOLIDATED STATEMENTS OF CHANGES IN EQUITY For the three months ended March 31 € millions Equity Attributable to Owners of Parent Non-
Controlling Interests
Total Equity
Issued Capital
Share Premium
Retained Earnings
Other Components of Equity Treasury Shares
Total
Exchange Diffe- rences
Available-for-Sale Financial
Assets
Cash Flow Hedges
1/1/2012 1,228 419 12,466 −19 9 −27 −1,377 12,699 8 12,707
Profit after tax 444 444 444Other comprehensive income
2 −170 35 17 −116 −116
Comprehensive income
446 −170 35 17 328 328
Share-based payments
4 4 4
Issuance of shares under share-based payments
10 10 10
Purchase of treasury shares
−53 −53 −53
Reissuance of treasury shares under share-based payments
4 46 50 50
Other changes 1 1
3/31/2012 1,228 437 12,912 −189 44 −10 −1,384 13,038 9 13,047
1/1/2013 1,229 492 13,973 −236 22 20 −1,337 14,163 8 14,171
Profit after tax 520 520 520Other comprehensive income
−2 235 233 233
Comprehensive income
518 235 753 753
Share-based payments
14 14 14
Reissuance of treasury shares under share-based payments
2 3 5 5
Other changes 9 9 1 10
3/31/2013 1,229 508 14,500 −1 22 20 −1,334 14,944 9 14,953

INTERIM REPORT JANUARY – MARCH 2013 25
CONSOLIDATED STATEMENTS OF CASH FLOWS For the three months ended March 31 € millions 2013 2012Profit after tax 520 444
Adjustments to reconcile profit after taxes to net cash provided by operating activities:
Depreciation and amortization 233 192
Income tax expense 101 163
Financial income, net 15 16
Decrease/increase in sales and bad debt allowances on trade receivables 24 28
Other adjustments for non-cash items 17 −30
Decrease/increase in trade and other receivables 97 36
Decrease/increase in other assets −81 −89
Decrease/increase in trade payables, provisions and other liabilities −881 −688
Decrease/increase in deferred income 2,446 2,277
Interest paid −7 −28
Interest received 15 26
Income taxes paid, net of refunds −337 −276
Net cash flows from operating activities 2,162 2,071
Business combinations, net of cash and cash equivalents acquired −12 −2,615
Purchase of intangible assets and property, plant, and equipment −113 −113
Proceeds from sales of intangible assets or property, plant, and equipment 12 13
Purchase of equity or debt instruments of other entities −250 −478
Proceeds from sales of equity or debt instruments of other entities 143 430
Net cash flows from investing activities −220 −2,763
Purchase of treasury shares 0 −53
Proceeds from reissuance of treasury shares 4 48
Proceeds from issuing shares (share-based payments) 0 10
Proceeds from borrowings 0 1,000
Repayments of borrowings 0 −600
Net cash flows from financing activities 4 405
Effect of foreign exchange rates on cash and cash equivalents 50 −130
Net decrease/increase in cash and cash equivalents 1,996 −417
Cash and cash equivalents at the beginning of the period 2,477 4,965
Cash and cash equivalents at the end of the period 4,473 4,548

26 CONSOLIDATED INTERIM FINANCIAL STATEMENTS – IFRS
NOTES TO THE CONSOLIDATED INTERIM FINANCIAL STATEMENTS (1) General Information About Consolidated Interim Financial Statements The accompanying Consolidated Interim Financial Statements of SAP AG and its subsidiaries (collectively, “we,” “us,” “our,” “SAP,” “Group,” and “Company”) have been prepared in accordance with the International Financial Reporting Standards (IFRSs) and in particular in compliance with International Accounting Standard (IAS) 34. The designation IFRS includes all standards issued by the International Accounting Standards Board (IASB) and related interpretations issued by the International Financial Reporting Interpretations Committee (IFRIC). The variances between the applicable IFRS standards as issued by the IASB and the standards as used by the European Union are not relevant to these financial statements. Certain information and disclosures normally included in the notes to annual financial statements prepared in accordance with IFRS have been condensed or omitted. We believe that the disclosures made are adequate and that the information gives a true and fair view. Our business activities are influenced by certain seasonal effects. Historically, our overall revenue tends to be highest in the fourth quarter. Interim results are therefore not necessarily indicative of results for a full year. Amounts reported in previous years have been reclassified as appropriate to conform to the presentation in this interim report. These unaudited condensed Consolidated Interim Financial Statements should be read in conjunction with SAP’s audited Consolidated IFRS Financial Statements for the Year Ended December 31, 2012, included in our 2012 Annual Report (extract from the SAP Integrated Report 2012) and our Annual Report 2012 on Form 20-F. Due to rounding, numbers presented throughout these Interim Financial Statements may not add up precisely to the totals we provide and percentages may not precisely reflect the absolute figures.
(2) Scope of Consolidation The following table summarizes the change in the number of legal entities included in the Consolidated Financial Statements. Number of Legal Entities Consolidated in the Financial Statements
German Foreign Total
January 1, 2012 23 176 199
Additions 4 92 96
Disposals -5 -23 -28
December 31, 2012 22 245 267
Additions 0 1 1
Disposals 0 -9 -9
March 31, 2013 22 237 259
The addition during the first quarter of 2013 relates to the foundation of a legal entity. The disposals are due to mergers and liquidations of operating and non-operating acquired legal entities. Our changes in the scope of consolidation in the first quarter of 2013 were not significant to our Consolidated Financial Statements. For more information about our business combinations and the effect on our Consolidated Financial Statements, see Note (4) and our Consolidated Financial Statements for 2012. (3) Summary of Significant Accounting Policies With the exception of the newly adopted accounting standards described below, the interim financial statements were prepared based on the same accounting policies as those applied and described in the Consolidated Financial Statements as at December 31, 2012. Our significant accounting policies are summarized in the notes to the Consolidated Financial Statements. For more information, see Note (3) in our Annual Report for 2012. Newly Adopted Accounting Standards The following accounting standards newly adopted in the first quarter of 2013 were relevant for the group:
- Amendments to IFRS 7 (Financial Instruments: Disclosures): Offsetting financial assets and financial liabilities;
- IFRS 10 (Consolidated Financial Statements), IFRS 11 (Joint Arrangements), and IFRS 12 (Disclosure of Interests in Other Entities) including amendments to

INTERIM REPORT JANUARY – MARCH 2013 27
the transition guidance for IFRS 10-12 issued in June 2012 (in other words, we adopted the new standards earlier than required by the European Union);
- IFRS 13 (Fair Value Measurement); - Amendments to IAS 1 (Presentation of
Financial Statements); - Amendments to IAS 19 (Employee
Benefits). The retrospective application of the revised IAS 19 has resulted in the netting of balance sheet items (mandatory netting of plan assets with time credits and early retirement obligations). Prior year numbers were restated accordingly (netting of financial assets with provisions in the amount of €124 million). Apart from that, the adoption of the standards/amendments does not have a material impact on the Consolidated Financial Statements but results, for example, in additional disclosures and reclassifications. New Accounting Standards Not Yet Adopted For detailed information about new accounting standards not yet adopted, see Note (3) in our Annual Report for 2012. (4) Business Combinations In the first quarter of 2013 and until the preparation of the related Interim Financial Statements, we acquired the following businesses in 2013:
Acquired Businesses Acquired Businesses
Sector Acquisi-tion Type
Acquired Voting Interest
Acquisi-tion Date
Ticket-Web GmbH & Co. KG Wildau, Germany
Solution provider of ticketing & customer relation- ship manage- ment.
Asset Deal n/a March 4, 2013
KMS Software Company LLC. Los Angeles, CA USA
Provider of employee onboarding solutions
Asset Deal n/a April 1, 2013
Camilion Solutions, Inc., Toronto, Canada
Solutions for the insurance industry
Share Deal 100% April 2, 2013
SmartOps Corporation, Pittsburgh, PA USA
Provider of inventory and service-level optimiza- tion software solutions
Share Deal 100% April 12, 2013
We acquire businesses in specific areas of strategic interest to us. All of the acquisitions listed in the above table are neither individually nor in aggregate material to SAP. Acquisitions made in the preceding year are described in the Consolidated Financial Statements in our 2012 Annual Report.

28 CONSOLIDATED INTERIM FINANCIAL STATEMENTS – IFRS
(5) Employee Benefits Expense and Headcount Employee benefits expense comprises the following: Employee Benefits Expense € millions Q1 2013 Q1 2012
Salaries 1,400 1,278
Social security expense 238 201
Share-based payments 70 83
Pension expense 63 62
Termination benefits 12 10
Employee-related restructuring expenses 6 0
Employee Benefits Expense 1,789 1,633
We acquired SuccessFactors on February 21, 2012, and Ariba on October 1, 2012. As a result, the employee benefit expenses from SuccessFactors are included in the data for 2012 as of the acquisition date – Ariba numbers are not included in the data for the previous year. On March 31, 2013, the breakdown of our full-time equivalent employee numbers by function in SAP and by region was as shown in the table below. The increase in headcount in the SAP Group to 64,598 includes 2,968 employees from additions from business combinations (especially Ariba). Number of Employees (in Full-Time Equivalents) March 31, 2013 March 31, 2012
Full-time equivalents EMEA Americas APJ Total EMEA Americas APJ Total
Software and software-related services 4,600 2,676 3,345 10,621 4,334 2,289 3,032 9,655
Professional services and other services 6,884 4,359 2,883 14,126 6,832 4,258 2,636 13,726
Research and development 8,965 3,685 5,411 18,060 8,834 3,367 4,561 16,762
Sales and marketing 5,828 6,240 2,972 15,040 5,220 5,239 2,626 13,085
General and administration 2,270 1,397 654 4,322 2,104 1,268 588 3,960
Infrastructure 1,286 825 319 2,429 1,224 727 281 2,232
SAP Group (March 31) 29,833 19,182 15,584 64,598 28,548 17,148 13,724 59,420
SAP Group (average first three months) 29,807 19,185 15,580 64,572 28,329 16,623 13,314 58,266

INTERIM REPORT JANUARY – MARCH 2013 29
The allocations of expenses for share-based payments to the various expense items are as follows: Share-Based Payments € millions Q1 2013 Q1 2012
Cost of software and software-related services
9 6
Cost of professional services and other services
12 24
Research and development 19 15
Sales and marketing 21 21
General and administration 9 17
Share-based payments 70 83
(6) Income Tax In the first quarter of 2013, income taxes and the effective tax rate, each compared with the first quarter of 2012, were as follows: Income Taxes € millions, unless stated otherwise Q1 2013 Q1 2012
Profit before income tax 621 607
Income tax expense −101 −163
Effective tax rate in % 16.3 26.9
(7) Earnings per Share Earnings per Share € millions, unless otherwise stated Q1 2013 Q1 2012
Profit attributable to owners of parent 520 444
Issued ordinary shares 1,229 1,228
Effect of treasury shares −36 −38
Weighted average number of shares in millions – basic 1,193 1,190
Dilutive effect of free-matching shares in millions 2 1
Weighted average number of shares in millions – diluted 1,195 1,191
Basic earnings per share in €, attributable to owners of parent 0.44 0.37
Diluted earnings per share in €, attributable to owners of parent 0.44 0.37

30 CONSOLIDATED INTERIM FINANCIAL STATEMENTS – IFRS
(8) Other Financial Assets Other financial assets comprise: Other Financial Assets March 31, 2013
€ millions Current Non-Current Total
Loans and other financial receivables
58 229 287
Debt investments
129 3 132
Equity investments
0 213 213
Available-for-sale financial assets
129 216 345
Derivatives 92 39 131
Investments in associates
0 47 47
Total 279 531 810
December 31, 2012
€ millions Current Non-Current Total
Loans and other financial receivables
35 208 243
Debt investments
15 14 29
Equity investments
0 201 201
Available-for-sale financial assets
15 215 230
Derivatives 104 40 144
Investments in associates
0 46 46
Total 154 509 663
(9) Trade and Other Receivables Trade and other receivables comprise: Trade and Other Receivables
March 31, 2013
€ millions Current Non-Current Total
Trade receivables, net
3,843 0 3,843
Other receivables 29 97 126
Total 3,872 97 3,969
December 31, 2012
€ millions Current Non-Current Total
Trade receivables, net
3,837 0 3,837
Other receivables 80 88 168
Total 3,917 88 4,005
The carrying amounts of our trade receivables and related allowances were as follows: Carrying Amounts of Trade Receivables € millions March
31, 2013Decem-ber 31,
2012Gross carrying amount 3,976 3,943
Sales allowances charged to revenue −94 −73
Allowance for doubtful accounts charged to expense
−39 −33
Carrying amount trade receivables, net
3,843 3,837

INTERIM REPORT JANUARY – MARCH 2013 31
(10) Financial Liabilities Financial liabilities comprise: Financial Liabilities March 31, 2013
€ millions Current Non-Current Total
Bank loans 0 0 0
Private placement transactions
0 2,150 2,150
Bonds 600 2,288 2,888
Other financial liabilities
273 62 335
Financial liabilities
873 4,500 5,373
December 31, 2012
€ millions Current Non-Current Total
Bank loans 0 0 0
Private placement transactions
0 2,088 2,088
Bonds 600 2,287 2,887
Other financial liabilities
202 71 273
Financial liabilities
802 4,446 5,248
(11) Deferred Income On March 31, 2013 short-term and long-term deferred income includes a total of €344 million in deferred revenue (December 31, 2012: €317 million; March 31, 2012: €120 million), which in future will likely be recognized as revenue from cloud subscriptions and support. (12) Total Equity Issued Shares As at March 31, 2013, SAP AG had 1,228,504,232 no-par issued shares (December 31, 2012: 1,228,504,232) issued with a calculated nominal value of €1 per share. Thus, issued shares remain unchanged in the first quarter of 2013. In the first quarter of 2012, the number of issued shares increased by 256,216 shares, resulting from the exercise of awards granted under certain share-based payments. Treasury Shares On March 31, 2013, we held 36 million treasury shares, representing €36 million or 2.95% of capital stock.
In the first quarter of 2013, we did not acquire shares for treasury (Q1 2012: 1.1 million shares at an average price of approximately €48.14 per share). In the first quarter of 2013 we disposed of 0.1 million shares (Q1 2012: 1.2 million) with a purchase price of approximately €36.80 (Q1 2012: €36.51) per share. Share purchases and share sales in 2013 and 2012 were in connection with our share-based payments, which are described in Note (27) in the Annual Report for 2012 included in our Integrated Report 2012. Other Comprehensive Income The component of other comprehensive income before tax that will be reclassified to profit or loss in the future includes the following items for the third quarter: € millions Q1 2013 Q1 2012
Gains (losses) on exchange differences on translation
229 −164
Reclassification adjustments on exchange differences on translation
0 0
Exchange differences on translation 229 −164
Gains (losses) on remeasuring available-for-sale financial assets
0 35
Reclassification adjustments on available-for-sale financial assets
0 0
Available-for-sale financial assets 0 35
Gains (losses) on cash flow hedges 13 16
Reclassification adjustments on cash flow hedges
−13 7
Cash flow hedges 0 23
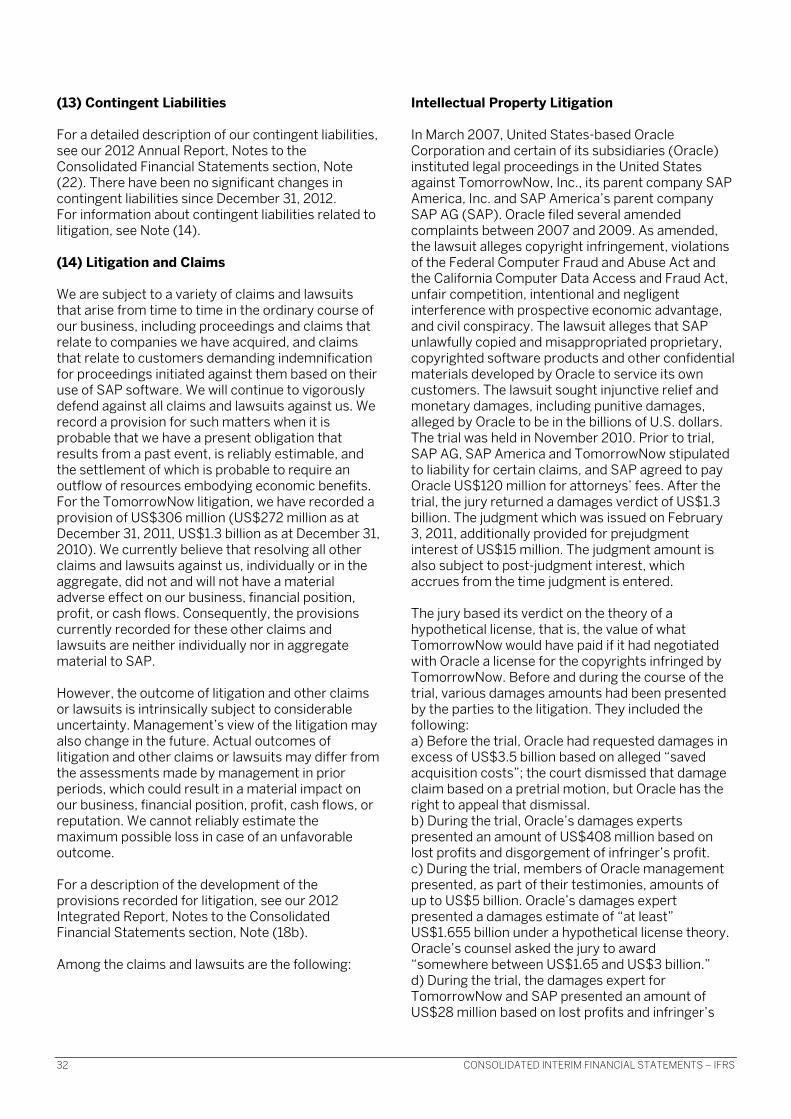
32 CONSOLIDATED INTERIM FINANCIAL STATEMENTS – IFRS
(13) Contingent Liabilities For a detailed description of our contingent liabilities, see our 2012 Annual Report, Notes to the Consolidated Financial Statements section, Note (22). There have been no significant changes in contingent liabilities since December 31, 2012. For information about contingent liabilities related to litigation, see Note (14). (14) Litigation and Claims We are subject to a variety of claims and lawsuits that arise from time to time in the ordinary course of our business, including proceedings and claims that relate to companies we have acquired, and claims that relate to customers demanding indemnification for proceedings initiated against them based on their use of SAP software. We will continue to vigorously defend against all claims and lawsuits against us. We record a provision for such matters when it is probable that we have a present obligation that results from a past event, is reliably estimable, and the settlement of which is probable to require an outflow of resources embodying economic benefits. For the TomorrowNow litigation, we have recorded a provision of US$306 million (US$272 million as at December 31, 2011, US$1.3 billion as at December 31, 2010). We currently believe that resolving all other claims and lawsuits against us, individually or in the aggregate, did not and will not have a material adverse effect on our business, financial position, profit, or cash flows. Consequently, the provisions currently recorded for these other claims and lawsuits are neither individually nor in aggregate material to SAP. However, the outcome of litigation and other claims or lawsuits is intrinsically subject to considerable uncertainty. Management’s view of the litigation may also change in the future. Actual outcomes of litigation and other claims or lawsuits may differ from the assessments made by management in prior periods, which could result in a material impact on our business, financial position, profit, cash flows, or reputation. We cannot reliably estimate the maximum possible loss in case of an unfavorable outcome. For a description of the development of the provisions recorded for litigation, see our 2012 Integrated Report, Notes to the Consolidated Financial Statements section, Note (18b). Among the claims and lawsuits are the following:
Intellectual Property Litigation In March 2007, United States-based Oracle Corporation and certain of its subsidiaries (Oracle) instituted legal proceedings in the United States against TomorrowNow, Inc., its parent company SAP America, Inc. and SAP America’s parent company SAP AG (SAP). Oracle filed several amended complaints between 2007 and 2009. As amended, the lawsuit alleges copyright infringement, violations of the Federal Computer Fraud and Abuse Act and the California Computer Data Access and Fraud Act, unfair competition, intentional and negligent interference with prospective economic advantage, and civil conspiracy. The lawsuit alleges that SAP unlawfully copied and misappropriated proprietary, copyrighted software products and other confidential materials developed by Oracle to service its own customers. The lawsuit sought injunctive relief and monetary damages, including punitive damages, alleged by Oracle to be in the billions of U.S. dollars. The trial was held in November 2010. Prior to trial, SAP AG, SAP America and TomorrowNow stipulated to liability for certain claims, and SAP agreed to pay Oracle US$120 million for attorneys’ fees. After the trial, the jury returned a damages verdict of US$1.3 billion. The judgment which was issued on February 3, 2011, additionally provided for prejudgment interest of US$15 million. The judgment amount is also subject to post-judgment interest, which accrues from the time judgment is entered. The jury based its verdict on the theory of a hypothetical license, that is, the value of what TomorrowNow would have paid if it had negotiated with Oracle a license for the copyrights infringed by TomorrowNow. Before and during the course of the trial, various damages amounts had been presented by the parties to the litigation. They included the following: a) Before the trial, Oracle had requested damages in excess of US$3.5 billion based on alleged “saved acquisition costs”; the court dismissed that damage claim based on a pretrial motion, but Oracle has the right to appeal that dismissal. b) During the trial, Oracle’s damages experts presented an amount of US$408 million based on lost profits and disgorgement of infringer’s profit. c) During the trial, members of Oracle management presented, as part of their testimonies, amounts of up to US$5 billion. Oracle’s damages expert presented a damages estimate of “at least” US$1.655 billion under a hypothetical license theory. Oracle’s counsel asked the jury to award “somewhere between US$1.65 and US$3 billion.” d) During the trial, the damages expert for TomorrowNow and SAP presented an amount of US$28 million based on lost profits and infringer’s

INTERIM REPORT JANUARY – MARCH 2013 33
profits or, alternatively, US$40.6 million based on a hypothetical license theory. Counsel for SAP and TomorrowNow asked the jury to award US$28 million. We believed both before and during the trial and continue to believe that the hypothetical license theory is not an appropriate basis for calculating the damages. Instead, we believe that damages should be based on lost profits and infringer’s profits. As such, SAP filed post-trial motions asking the judge to overturn the judgment. A hearing on the post-trial motions was held in July 2011. On September 1, 2011, the trial judge issued an order which set aside the jury verdict and vacated that part of the judgment awarding US$1.3 billion in damages. The trial judge also gave Oracle the choice of accepting reduced damages of US$272 million or having a new trial based on lost profits and infringer's profits. Oracle filed a motion seeking an early appeal from the ruling vacating the jury's damages award, which was denied by the judge. Consequently, Oracle elected to proceed with a new trial. In lieu of a new trial, the parties stipulated to a judgment of US$306 million while each preserving all rights for appeal. Both parties have filed their respective notice of appeal. On appeal, Oracle is seeking three forms of relief: (1) reinstatement of the November 2010 $1.3 billion verdict; (2) as a first alternative, a new trial at which Oracle may again seek hypothetical license damages (based in part on evidence of alleged saved development costs) plus SAP's alleged infringer's profits without any deduction of expenses (Oracle does not put a number on its claim for the requested new trial); and (3) as a second alternative, increase of the remittitur (alternative to new trial) to $408.7 million (versus the $272 million Oracle had previously rejected). SAP has dismissed its cross-appeal. The hearing is not yet scheduled. Additionally, in June 2007, SAP became aware that the United States Department of Justice (U.S. DOJ) had opened an investigation concerning related issues and had issued subpoenas to SAP and TomorrowNow. The DOJ investigation has been resolved by way of a plea agreement which includes TomorrowNow pleading guilty to 11 counts of violations of the Computer Fraud and Abuse Act, one count of criminal copyright infringement, the payment of a US$20 million fine and three years probation. No charges were brought against SAP AG or subsidiaries thereof other than TomorrowNow. In April 2007, United States-based Versata Software, Inc. (formerly Trilogy Software, Inc.) (Versata) instituted legal proceedings in the United States against SAP. Versata alleged that SAP’s products infringe one or more of the claims in each of five
patents held by Versata. In its complaint, Versata sought unspecified monetary damages and permanent injunctive relief. The first trial was held in August 2009. The jury returned a verdict in favor of Versata and awarded Versata US$138.6 million for past damages. In January 2011, the court vacated the jury’s damages award and ordered a new trial on damages. The re-trial was held in May 2011. The jury returned a verdict in favor of Versata and awarded Versata US$345 million for past damages. In September 2011, the judge denied SAP’s post-trial motions with the exception of reducing the damages verdict by US$16 million to approximately US$329 million. The judge also ordered approximately US$60 million in pre-judgment interest. Additionally, the judge granted Versata’s request for a broad injunction which prohibits SAP from 1) selling products in the United States with the infringing functionality, 2) providing maintenance to or accepting maintenance revenue from existing customers in the United States until such customers disable the infringing functionality and verify such disablement, and 3) licensing additional users to existing customers in the United States until such customers disable the infringing functionality and verify such disablement. Finally, the judge stayed the injunction pending the outcome of an appeal. Both parties are appealing and the appeal briefs have been filed. The hearing occurred in February 2013. Additionally, SAP filed a petition with the United States Patent Office (USPTO) challenging the validity of the asserted Versata patent. The USPTO granted SAP’s request to reconsider the validity of Versata’s patent and instituted the relevant procedure (transitional post grant review). A decision is expected by June 2013. In August 2007, United States-based elcommerce.com, Inc. (elcommerce) instituted legal proceedings in the United States against SAP. elcommerce alleged that SAP’s products infringe one or more of the claims in one patent held by elcommerce. In its complaint, elcommerce sought unspecified monetary damages and permanent injunctive relief. The court in East Texas granted SAP’s request to transfer the litigation from East Texas to Pennsylvania. Subsequent to the Markman ruling by the court, the parties agreed to the entry of final judgment regarding non-infringement by SAP. elcommerce has appealed the court’s Markman ruling. The hearing for the appeal was held in May 2012. In February 2010, United States-based TecSec, Inc. (TecSec) instituted legal proceedings in the United States against SAP, Sybase, IBM, and many other defendants. TecSec alleged that SAP’s products infringe one or more of the claims in five patents held

34 CONSOLIDATED INTERIM FINANCIAL STATEMENTS – IFRS
by TecSec. In its complaint, TecSec seeks unspecified monetary damages and permanent injunctive relief. The trial has not yet been scheduled. The legal proceedings have been stayed against all defendants pending the outcome of an appeal by TecSec regarding the court’s determination that IBM does not infringe the patents. SAP, along with the other defendants, is now appealing. The hearing occurred in March 2013 and a decision is expected mid-year 2013 or later. In April 2010, SAP instituted legal proceedings (a Declaratory Judgment action) in the United States against Wellogix, Inc. and Wellogix Technology Licensing, LLC (Wellogix). The lawsuit seeks a declaratory judgment that five patents owned by Wellogix are invalid and/or not infringed by SAP. The trial has not yet been scheduled. The legal proceedings have been stayed pending the outcome of re-examinations filed with the U.S. Patent and Trademark Office. Other Litigation In April 2008, South African-based Systems Applications Consultants (PTY) Limited (Securinfo) instituted legal proceedings in South Africa against SAP. Securinfo alleges that SAP has caused one of its subsidiaries to breach a software distribution agreement with Securinfo. In its complaint, Securinfo seeks damages of approximately €610 million plus interest. In September 2009, SAP filed a motion to dismiss which was rejected. A trial date which was scheduled for June 2011 has been postponed. In November 2012, SAP filed a motion to dismiss based on a procedural aspect of the case. The court followed SAP’s argument and dismissed the claim by Securinfo. Securinfo appealed against this decision on December 19, 2012. We are subject to ongoing audits by domestic and foreign tax authorities. Along with many other companies operating in Brazil, we are involved in various proceedings with Brazilian authorities regarding assessments and litigation matters on non-income taxes on intercompany royalty payments and intercompany services. The total potential amount related to these matters for all applicable years is approximately €87 million. We have not recorded a provision for these matters, as we believe that we will prevail on these matters. For more information about income tax risk-related litigation, see our 2012 Integrated Report, Notes to the Consolidated Financial Statements section, Note 10.
(15) Share-Based Payments For a detailed description of our share-based payment plans, see our 2012 Integrated Report, Notes to the Consolidated Financial Statements section, Note (27), or our Annual Report 2012 on Form 20-F. The outstanding bonus shares under the Share Matching Plan are: Outstanding Restricted Shares Number in thousands March 31,
2013Decem-ber 31,
2012Share Matching Plan 2010 (Bonus shares)
493 497
Share Matching Plan 2011(Bonus shares)
444 448
Share Matching Plan 2012(Bonus shares)
3,082 3,124
(16) Other Financial Instruments A detailed overview of our other financial instruments, financial risk factors, and the management of financial risks are presented in Notes (24) to (26) to our Consolidated Financial Statements for 2012, which are included in our 2012 Integrated Report, and our Annual Report 2012 on Form 20-F. In the following, we disclose the fair value of financial instruments, valuation techniques and inputs used and the level of the fair value hierarchy within which the fair value measurements are categorized. Fair Value of Financial Instruments We use various types of financial instruments in the ordinary course of business which are grouped into the following categories: loans and receivables (L&R), available-for-sale (AFS), held-for-trading (HFT), and amortized cost (AC). The table below shows the carrying amounts and fair values of financial assets and liabilities by category of financial instrument as well as by category of IAS 39. Since the line items “Trade receivables,” “Trade payables,” and “Other financial assets” contain both financial and non-financial assets or liabilities (such as other taxes or advance payments), the non-financial assets or liabilities are shown in the column headed “Not in Scope of IFRS 7” to allow a reconciliation to the corresponding line items in the Consolidated Statements of Financial Position. The carrying amounts and fair values of our financial instruments as at March 31 were as follows:

INTERIM REPORT JANUARY – MARCH 2013 35
Fair Values of Financial Instruments
€ millions 2013 Book
Value 3/31/2013
Measurement Categories Fair Value 3/31/2013
Not in Scope of
IFRS 7
Category At Amortized
Cost
At Cost At Fair Value
Assets
Cash and cash equivalents L&R 4,473 4,473 4,473
Trade receivables L&R 3,969 3,843 3,843 126
Other financial assets 810
Debt securities L&R/AFS 132 132
Equity securities AFS/- 158 55 55 47
Other nonderivative financial assets L&R 188 188 99
Derivative assets
With hedging relationship - 32 32
Without hedging relationship HFT 99 99
Liabilities
Trade payables AC −854 −604 −604 −250
Financial liabilities −5,373
Nonderivative financial liabilities AC −5,150 −5,312
Derivatives
With hedging relationship - −5 −5
Without hedging relationship HFT −218 −218
Total financial instruments, net 3,025 2,750 158 95 2,683 22
Aggregation according to IAS 39
Financial assets
At fair value through profit or loss HFT 99 99 99
Available-for-sale AFS 345 158 187 187
Loans and receivables L&R 8,630 8,504 8,504 126
Financial liabilities
At fair value through profit or loss HFT −218 −218 −218
At amortized cost AC −6,004 −5,754 −5,916 −250
Outside scope of IAS 39
Financial instruments related to employee benefit plans
99 99
Investment in associates 47 47
Derivatives with hedging relationship 27 27 27
Total financial instruments, net 3,025 2,750 158 95 2,683 22

36 CONSOLIDATED INTERIM FINANCIAL STATEMENTS – IFRS
€ millions 2012 Book
Value 12/31/
2012
Measurement Categories Fair Value 12/31/
2012
Not in Scope of
IFRS 7
Category At Amortized
Cost
At Cost At Fair Value
Assets
Cash and cash equivalents L&R 2,477 2,477 2,477
Trade receivables L&R 4,005 3,837 3,837 168
Other financial assets 663
Debt securities L&R/AFS 29 29
Equity securities AFS/- 149 52 52 46
Other nonderivative financial assets L&R 159 159 84
Derivative assets
With hedging relationship - 29 29
Without hedging relationship HFT 115 115
Liabilities
Trade payables AC −933 −684 −684 −249
Financial liabilities −5,248
Nonderivative financial liabilities AC −5,051 −5,228
Derivatives
With hedging relationship - −2 −2
Without hedging relationship HFT −195 −195
Total financial instruments, net 964 738 149 28 589 49
Aggregation according to IAS 39
Financial assets
At fair value through profit or loss HFT 115 115 115
Available-for-sale AFS 230 149 81 81
Loans and receivables L&R 6,641 6,473 6,473 168
Financial liabilities
At fair value through profit or loss HFT −195 −195 −195
At amortized cost AC −5,984 −5,735 −5,912 −249
Outside scope of IAS 39
Financial instruments related to employee benefit plans
84 84
Investment in associates 46 46
Derivatives with hedging relationship 27 27 27
Total financial instruments, net 964 738 149 28 589 49
Determination of Fair Value IFRS 13 defines fair value as the price that would be received to sell an asset or paid to transfer a liability in an orderly transaction between market participants at the measurement date. Accordingly, best evidence of fair value provides quoted prices in an active market. Where market prices are not readily available, valuation techniques have to be used to establish fair value. Depending on the inputs used in and their significance for the
valuation techniques, we have categorized our financial instruments at fair value into a three-level fair value hierarchy as mandated by IFRS 13. The fair value hierarchy gives the highest priority to quoted prices in active markets for identical assets or liabilities (Level 1) and the lowest priority to unobservable inputs (Level 3). The inputs used to measure fair value for one single instrument may fall into different levels of the fair value hierarchy. In such cases, the level in the fair value hierarchy within which the fair value measurement in its entirety falls

INTERIM REPORT JANUARY – MARCH 2013 37
has been determined based on the lowest level input that is significant to the fair value measurement in its entirety. Our assessment of the significance of a particular input to the fair value measurement in its entirety requires judgment, and considers factors specific to the asset or liability. The levels of the fair value hierarchy, its application to our financial assets and liabilities, and the respective determination of fair value are described below: - Level 1: Quoted prices in active markets for identical assets or liabilities.
- Marketable available-for-sale debt and equity investments: The fair values of these securities are based on quoted market prices as at March 31.
– Level 2: Inputs other than quoted prices included within Level 1 that are observable for the asset or liability, either directly or indirectly.
- Derivative financial instruments: The fair value of foreign exchange forward contracts is based on discounting the expected future cash flows over the respective remaining term of the contracts, using the respective market interest rates appropriate to the remaining term of the forwards contracts. The fair value of our foreign currency options is calculated
taking into account current spot rates and strike prices, the volatility of the respective currencies, the remaining term of the options, as well as market interest rates. The fair value of the derivatives entered into to hedge our share-based payments are calculated considering risk-free interest rates, the remaining term of the derivatives, the dividend yields, the stock price, and the volatility of our share.
- Available-for-sale equity investments in public companies: Certain of our equity investments in public companies were restricted from being sold for a limited period. Therefore, fair value is determined based on quoted market prices as at March 31, deducting a discount for the disposal restriction based on the premium for a respective put option.
– Level 3: Unobservable inputs for the assets or liabilities. The following table allocates those financial assets and liabilities that are measured at fair value in accordance with IAS 39 either through profit or loss or other comprehensive income as at March 31, 2013, to the three levels of the fair value hierarchy according to IFRS 13.

38 CONSOLIDATED INTERIM FINANCIAL STATEMENTS – IFRS
Classification of Financial Instruments
March 31, 2013 December 31, 2012
€ millions Level 1 Level 2 Level 3 Total Level 1 Level 2 Level 3 Total
Financial assets
Corporate Bonds 128 0 0 128 27 0 0 27
Government securities 0 0 0 0 0 0 0 0
Municipal bonds 4 0 0 4 2 0 0 2
Debt investments 132 0 0 132 29 0 0 29
Software industry 49 6 0 55 52 0 0 52
Equity investments 49 6 0 55 52 0 0 52
Available-for-sale financial assets 181 6 0 187 81 0 0 81
FX forward contracts 0 67 0 67 0 76 0 76
Call options for share-based payments 0 64 0 64 0 68 0 68
Derivative financial assets 0 131 0 131 0 144 0 144
Total 181 137 0 318 81 144 0 225
Financial liabilities
FX forward contracts 0 223 0 223 0 197 0 197
Derivative financial liabilities 0 223 0 223 0 197 0 197
Total 0 223 0 223 0 197 0 197
It is our policy to recognize transfers at the beginning of the respective quarter when the event or change in circumstances occurred that caused the transfer.

INTERIM REPORT JANUARY – MARCH 2013 39
(17) Segment and Geographic Information General Information Following SAP’s increased focus on the cloud business, in the third quarter of 2012 we changed both the structure of the components that SAP management uses to make decisions about operating matters, and the main profit measure used for the purposes of allocating resources to these components and measuring their performance. The segment information for earlier periods has been restated to conform with these changes. As part of this realignment, the previous Consulting and Training segments have been aggregated into the On-Premise Services segment. Certain activities of the previous Consulting and Training segments were shifted to the On-Premise Products segment. Discrete financial information for the previous Consulting and Training segments is no longer used by SAP management. At the beginning of the first quarter of 2012, we had already integrated the activities of the former Sybase segment into the segments existing at that time (Product, Consulting, Training). The decision to discontinue Sybase as an independent organization and the subsequent integration was driven by our decision to support our planned growth in the area of mobility and database & technology. Subsequent to the integration, discrete financial information for the previous Sybase segment is no longer used by SAP management. Our internal reporting system produces reports in which business activities are presented in a variety of ways, for example, by line of business, geography, and areas of responsibility of the individual Board members. Based on these reports, the Executive Board, which is responsible for assessing the performance of various company components and making resource allocation decisions as our Chief Operating Decision Maker (CODM), evaluates business activities in a number of different ways. The most important factors we use to identify operating segments are distinctions among our product and service offerings, notably: Between divisions, the software delivery model
(software to be installed on the customer’s hardware (on-premise software), distinct from software for delivery in the cloud)
Within the On-Premise division, the types of services offered
Within the Cloud division, the fields in which the cloud applications are used
SAP has two divisions – On-Premise and Cloud, which are further divided into operating segments. Our On-Premise division is comprised of two operating segments: On-Premise Products and On-Premise Services. In the third quarter of 2012, our Cloud division was comprised of one operating segment: Cloud Applications. Following the acquisition of Ariba, we established a second operating segment in the Cloud division, mainly consisting of the acquired Ariba business (Ariba). The operations of Crossgate, which we acquired in 2011, are also included in the operating segment containing the acquired Ariba business. All operating segments are reportable segments. The On-Premise division derives its revenues primarily from the sale of on-premise software (that is, software designed for use on hardware on the customer’s premises), mobile software (that is, software designed for use on mobile devices), and services relating to such software. Within the On-Premise division, the On-Premise Products segment is primarily engaged in marketing and licensing our on-premise and mobile software products and providing support services for these software products. The On-Premise Services segment primarily performs various professional services, mainly implementation services of our software products and educational services on the use of our software products. The Cloud division derives its revenues primarily from the sale of cloud software (that is, software designed for delivery through the cloud) and services relating to such software (including support services, professional services, and educational services). Within the Cloud division, the Cloud Applications segment is primarily engaged in marketing and selling subscriptions to the cloud software offerings developed by SAP and SuccessFactors. The Ariba segment primarily markets and sells the cloud software offerings developed by Ariba and derives revenue from its cloud-based collaborative business network.

40 CONSOLIDATED INTERIM FINANCIAL STATEMENTS – IFRS
Information About Profit or Loss, Assets and Liabilities Operating Segments Revenue and Profit or Loss On-Premise Division Cloud Division Total
€ millions On-PremiseProducts
On-Premise Services
Division Total
Cloud Applications
Ariba Division Total
Q1 2013 Software 657 0 657 0 0 0 657
Cloud subscriptions and support 0 0 0 87 81 167 167
Software and cloud subscriptions 657 0 657 87 81 168 824
Support 2,099 0 2,099 6 8 14 2,113
Software and software-related service revenue
2,756 0 2,756 93 88 181 2,937
Professional services and other service revenue
0 656 656 22 21 43 698
Total revenue 2,756 656 3,412 115 109 224 3,636
Cost of revenue −457 −539 −996 −42 −46 −88 −1,084
Gross profit 2,299 117 2,416 72 63 136 2,551
Cost of sales and marketing −815 0 −815 −71 −37 −108 −923
Reportable segment profit/loss 1,484 117 1,600 1 26 28 1,628
Q1 2012 Software 637 0 637 0 0 1 637
Cloud subscriptions and support 0 0 0 32 3 35 35
Software and cloud subscription 637 0 637 32 3 35 672
Support 1,953 0 1,953 1 0 1 1,954
Software and software-related service revenue
2,590 0 2,590 33 3 37 2,626
Professional services and other service revenue
0 720 720 10 2 11 731
Total revenue 2,590 720 3,309 43 5 48 3,357
Cost of revenue −443 −582 −1,025 −28 −8 −36 −1,061
Gross profit 2,147 138 2,285 15 −3 11 2,296
Cost of sales and marketing −740 0 −740 −34 −2 −36 −776
Reportable segment profit/loss 1,407 138 1,545 −19 −6 −25 1,520
Segment asset/liability information is not regularly provided to our CODM. Goodwill by operating segment is disclosed in our Integrated Report 2012, Notes to the Consolidated Financial Statements section, Note (15). For information about the Measurement and Presentation of the segment reporting, see the SAP Integrated Report 2012, Notes to the Consolidated Financial Statements section, Note (28).

INTERIM REPORT JANUARY – MARCH 2013 41
Reconciliation of Revenues and Segment Results € millions Q1/2013 Q1/2012
Total revenues for reportable segments 3,636 3,357
Adjustment recurring revenues −35 −7
Adjustment recurring cloud subscriptions and support revenues −30 −6
Adjustment recurring support revenues −4 −1
Total revenue 3,601 3,350
Total profit for reportable segments 1,628 1,520
Adjustment recurring revenues −35 −7
Research and development expense −535 −500
General and administration expense −188 −185
Other operating income/expense, net −3 −1
Restructuring −13 0
Share-based payment expense −70 −83
TomorrowNow litigation / Loss from discontinued operations 0 7
Acquisition-related charges −137 −120
Operating profit 646 631
Other non-operating income/expense, net −10 −8
Finance income, net −15 −16
Profit before tax 621 607
The research and development expense as well as the general and administration expense presented in the reconciliation differs from the corresponding expense in the consolidated income statement because the portions of share-based payments-related expenses, restructuring expenses, and acquisition-related expenses that are included in the research and development line item respectively the general and administration expense line item in the income statement, are presented as separate items in the reconciliation.

42 CONSOLIDATED INTERIM FINANCIAL STATEMENTS – IFRS
Geographic Information The tables below show the breakdown of software revenue by location of contract negotiation and by customer location. The presentation by location of contract negotiation reflects the fact that in some cases, software contracts are negotiated and the customer’s buying decision is made in one country but an affiliated legal entity of the same customer in another country serves as the contracting party. A revenue-by-region reporting based on the customer location attributes the revenue to the home country of the contracting legal entity. SAP believes that the location of the contract negotiation provides more useful insight into where the revenue was earned. Therefore we have reported software revenue both by customer location and by location of negotiation. Between these two views, the attribution of software revenues to the different geographies only differs for transactions where, based on objective evidence, all contract negotiations were performed in a country other than the domicile of the legal entity contracting on the customer’s behalf. Under both views, the software revenue from a given contract is always attributed to one geography, that is, revenues are not split between geographies. Revenue by Region Software Revenue by Location Where Contracts Were Negotiated € millions Q1/2013 Q1/2012
EMEA 298 275
Americas 254 239
APJ 105 123
SAP Group 657 637
Software Revenue by Location of Customers € millions Q1/2013 Q1/2012
EMEA 300 279
Americas 252 236
APJ 105 123
SAP Group 657 637
Software and Cloud Subscription Revenue by Location of Customers € millions Q1/2013 Q1/2012
EMEA 326 289
Americas 356 253
APJ 112 125
SAP Group 794 666
Software and Software-Related Service Revenue by Location of Customers € millions Q1/2013 Q1/2012
Germany 399 371
Rest of EMEA 936 862
Total EMEA 1,335 1,233
United States 808 692
Rest of Americas 307 255
Total Americas 1,115 946
Japan 134 144
Rest of APJ 319 297
Total APJ 453 440
SAP Group 2,903 2,619
Total Revenue by Location of Customers € millions Q1/2013 Q1/2012
Germany 526 517
Rest of EMEA 1,131 1,058
EMEA 1,657 1,575
United States 1,024 913
Rest of Americas 377 333
Americas 1,400 1,246
Japan 151 165
Rest of APJ 393 364
APJ 544 529
SAP Group 3,601 3,350

INTERIM REPORT JANUARY – MARCH 2013 43
(18) Related Party Transactions Certain Executive Board and Supervisory Board members of SAP AG currently hold (or have held within the last year) positions of significant responsibility with other entities (see the SAP Annual Report 2012, Notes to the Consolidated Financial Statements section, Note (29)). We have relationships with certain of these entities in the ordinary course of business whereby we buy and sell a wide variety of services and products at prices believed to be consistent with those negotiated at arm’s length between unrelated parties. During the reporting period, we had no related party transactions that had a material effect on our business, financial position, or results in the reporting period.
For more information about related party transactions, see the SAP Integrated Report 2012, Notes to the Consolidated Financial Statements section, Note (30). (19) Subsequent Events No events have occurred after March 31, 2013 which have a material impact on the Company’ s Consolidated Financial Statements. Release of the Interim Financial Statements The SAP Chief Financial Officer on behalf of the Executive Board approved these Consolidated Interim Financial Statements for the first quarter of 2013 on April 17, 2013, for submission to the Audit Committee of the Supervisory Board and for subsequent issuance.
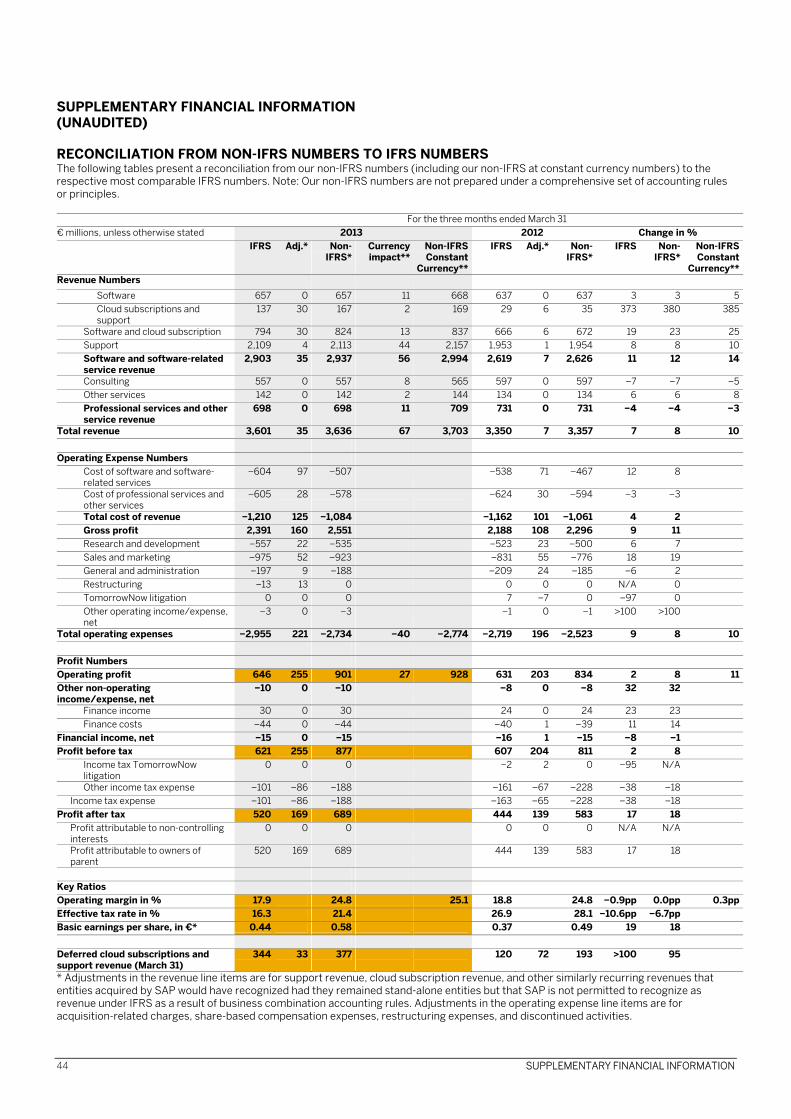
44 SUPPLEMENTARY FINANCIAL INFORMATION
SUPPLEMENTARY FINANCIAL INFORMATION (UNAUDITED) RECONCILIATION FROM NON-IFRS NUMBERS TO IFRS NUMBERS The following tables present a reconciliation from our non-IFRS numbers (including our non-IFRS at constant currency numbers) to the respective most comparable IFRS numbers. Note: Our non-IFRS numbers are not prepared under a comprehensive set of accounting rules or principles.
* Adjustments in the revenue line items are for support revenue, cloud subscription revenue, and other similarly recurring revenues that entities acquired by SAP would have recognized had they remained stand-alone entities but that SAP is not permitted to recognize as revenue under IFRS as a result of business combination accounting rules. Adjustments in the operating expense line items are for acquisition-related charges, share-based compensation expenses, restructuring expenses, and discontinued activities.
For the three months ended March 31 € millions, unless otherwise stated 2013 2012 Change in % IFRS Adj.* Non-
IFRS*Currencyimpact**
Non-IFRSConstant
Currency**
IFRS Adj.* Non-IFRS*
IFRS Non-IFRS*
Non-IFRSConstant
Currency**Revenue Numbers
Software 657 0 657 11 668 637 0 637 3 3 5Cloud subscriptions and support
137 30 167 2 169 29 6 35 373 380 385
Software and cloud subscription 794 30 824 13 837 666 6 672 19 23 25Support 2,109 4 2,113 44 2,157 1,953 1 1,954 8 8 10Software and software-related service revenue
2,903 35 2,937 56 2,994 2,619 7 2,626 11 12 14
Consulting 557 0 557 8 565 597 0 597 −7 −7 −5Other services 142 0 142 2 144 134 0 134 6 6 8Professional services and other service revenue
698 0 698 11 709 731 0 731 −4 −4 −3
Total revenue 3,601 35 3,636 67 3,703 3,350 7 3,357 7 8 10 Operating Expense Numbers
Cost of software and software-related services
−604 97 −507 −538 71 −467 12 8
Cost of professional services and other services
−605 28 −578 −624 30 −594 −3 −3
Total cost of revenue −1,210 125 −1,084 −1,162 101 −1,061 4 2Gross profit 2,391 160 2,551 2,188 108 2,296 9 11Research and development −557 22 −535 −523 23 −500 6 7Sales and marketing −975 52 −923 −831 55 −776 18 19General and administration −197 9 −188 −209 24 −185 −6 2Restructuring −13 13 0 0 0 0 N/A 0TomorrowNow litigation 0 0 0 7 −7 0 −97 0Other operating income/expense, net
−3 0 −3 −1 0 −1 >100 >100
Total operating expenses −2,955 221 −2,734 −40 −2,774 −2,719 196 −2,523 9 8 10 Profit Numbers Operating profit 646 255 901 27 928 631 203 834 2 8 11Other non-operating income/expense, net
−10 0 −10 −8 0 −8 32 32
Finance income 30 0 30 24 0 24 23 23Finance costs −44 0 −44 −40 1 −39 11 14
Financial income, net −15 0 −15 −16 1 −15 −8 −1Profit before tax 621 255 877 607 204 811 2 8
Income tax TomorrowNow litigation
0 0 0 −2 2 0 −95 N/A
Other income tax expense −101 −86 −188 −161 −67 −228 −38 −18Income tax expense −101 −86 −188 −163 −65 −228 −38 −18
Profit after tax 520 169 689 444 139 583 17 18Profit attributable to non-controlling interests
0 0 0 0 0 0 N/A N/A
Profit attributable to owners of parent
520 169 689 444 139 583 17 18
Key Ratios Operating margin in % 17.9 24.8 25.1 18.8 24.8 −0.9pp 0.0pp 0.3ppEffective tax rate in % 16.3 21.4 26.9 28.1 −10.6pp −6.7ppBasic earnings per share, in €* 0.44 0.58 0.37 0.49 19 18 Deferred cloud subscriptions and support revenue (March 31)
344 33 377 120 72 193 >100 95

INTERIM REPORT JANUARY – MARCH 2013 45
** Constant currency revenue and operating income figures are calculated by translating revenue and operating income of the current period using the average exchange rates from the previous year's respective period instead of the current period. Constant currency period-over-period changes are calculated by comparing the current year's non-IFRS constant currency numbers with the non-IFRS number of the previous year's respective period. Due to rounding, numbers may not add up precisely.

46 SUPPLEMENTARY FINANCIAL INFORMATION
REVENUE BY REGION The following table presents our IFRS and non-IFRS revenue by region. Software Revenue by Region shows the breakdown by location of contract negotiation and by customer location, whereas Software and Cloud Subscription Revenue by Region, Software and Software-Related Service Revenue by Region, and Total Revenue by Region are based on customer location. The table also presents a reconciliation from our non-IFRS revenue (including our non-IFRS revenue at constant currency) to the respective most comparable IFRS revenue. Note: Our non-IFRS revenues are not prepared under a comprehensive set of accounting rules or principles. Software Revenue by Location Where Contracts Were Negotiated
For the three months ended March 31 € millions 2013 2012 Change in % IFRS Adj.* Non-
IFRS*Currencyimpact**
Non-IFRSConstant
Currency**
IFRS Adj.* Non-IFRS*
IFRS Non-IFRS*
Non-IFRSConstant
Currency**Software revenue by region
EMEA 298 0 298 4 302 275 0 275 8 8 10Americas 254 0 254 3 257 239 0 239 6 6 8APJ 105 0 105 3 108 123 0 123 −15 −15 −12
Software revenue 657 0 657 11 668 637 0 637 3 3 5 Revenues by Location of Customers For the three months ended March 31 € millions 2013 2012 Change in % IFRS Adj.* Non-
IFRS*Currencyimpact**
Non-IFRSConstant
Currency**
IFRS Adj.* Non-IFRS*
IFRS Non-IFRS*
Non-IFRSConstant
Currency**Software revenue by region
EMEA 300 0 300 4 304 279 0 279 8 8 9Americas 252 0 252 3 255 236 0 236 7 7 8APJ 105 0 105 3 108 123 0 123 −15 −15 −12
Software revenue 657 0 657 11 668 637 0 637 3 3 5 Software and cloud subscription revenue by region
EMEA 326 0 326 5 331 289 0 289 13 13 15Americas 356 30 386 4 390 253 6 259 41 49 51APJ 112 0 112 4 116 125 0 125 −10 −10 −7
Software and cloud subscription revenue
794 30 824 13 837 666 6 672 19 23 25
Software and software-related service revenue by region
Germany 399 0 399 0 399 371 0 371 8 8 8Rest of EMEA 936 0 936 14 950 862 1 863 9 8 10
Total EMEA 1,335 0 1,335 14 1,348 1,233 1 1,234 8 8 9United States 808 35 842 5 847 692 6 698 17 21 21Rest of Americas 307 0 307 15 322 255 0 255 20 20 26
Total Americas 1,115 35 1,150 19 1,169 946 6 952 18 21 23Japan 134 0 134 22 156 144 0 144 −7 −7 8Rest of APJ 319 0 319 1 320 297 0 297 7 7 8
Total APJ 453 0 453 23 476 440 0 440 3 3 8Software and software-related service revenue
2,903 35 2,937 56 2,994 2,619 7 2,626 11 12 14
Total revenue by region
Germany 526 0 526 −1 525 517 0 517 2 2 2Rest of EMEA 1,131 0 1,131 16 1,147 1,058 1 1,059 7 7 8
Total EMEA 1,657 0 1,657 15 1,672 1,575 1 1,576 5 5 6United States 1,024 35 1,058 6 1,064 913 6 919 12 15 16Rest of Americas 377 0 377 18 395 333 0 333 13 13 19
Total Americas 1,400 35 1,435 24 1,459 1,246 6 1,252 12 15 17Japan 151 0 151 25 176 165 0 165 −8 −8 7Rest of APJ 393 0 393 2 395 364 0 364 8 8 9
Total APJ 544 0 544 27 571 529 0 529 3 3 8Total revenue 3,601 35 3,636 67 3,703 3,350 7 3,357 7 8 10

INTERIM REPORT JANUARY – MARCH 2013 47
* Adjustments in the revenue line items are for support revenue, cloud subscription revenue, and other similarly recurring revenues that entities acquired by SAP would have recognized had they remained stand-alone entities but that SAP is not permitted to recognize as revenue under IFRS as a result of business combination accounting rules. ** Constant currency revenue figures are calculated by translating revenue of the current period using the average exchange rates from the previous year's respective period instead of the current period. Constant currency period-over-period changes are calculated by comparing the current year's non-IFRS constant currency numbers with the non-IFRS number of the previous year's respective period. For a more detailed description of these adjustments and their limitations as well as our constant currency figures, see our Web site www.sap.com/corporate-en/investors/newsandreports/reporting-framework.epx under “Non-IFRS Measures and Estimates.”
Due to rounding, numbers may not add up precisely.

48 SUPPLEMENTARY FINANCIAL INFORMATION
MULTI-QUARTER SUMMARY (IFRS AND NON-IFRS) € millions, unless otherwise stated Q1/2012 Q2/2012 Q3/2012 Q4/2012 TY 2012 Q1/2013
Software (IFRS) 637 1,059 1,026 1,937 4,658 657
Revenue adjustment* 0 0 0 0 0 0
Software (non-IFRS) 637 1,059 1,026 1,937 4,658 657
Cloud subscriptions and support (IFRS) 29 52 63 126 270 137
Revenue adjustment* 6 17 17 33 73 30
Cloud subscriptions and support (non-IFRS) 35 69 80 159 343 167
Support (IFRS) 1,953 2,013 2,105 2,166 8,237 2,109
Revenue adjustment* 1 1 1 5 9 4
Support (non-IFRS) 1,954 2,014 2,106 2,171 8,246 2,113
Software and software-related service revenue (IFRS)
2,619 3,124 3,194 4,228 13,165 2,903
Revenue adjustment* 7 18 18 38 81 35
Software and software-related service revenue (non-IFRS)
2,626 3,142 3,212 4,266 13,246 2,937
Total revenue (IFRS) 3,350 3,898 3,952 5,023 16,223 3,601
Revenue adjustment* 7 18 18 38 81 35
Total revenue (non-IFRS) 3,357 3,916 3,970 5,062 16,304 3,636
Operating profit (IFRS) 631 921 921 1,592 4,065 646
Revenue adjustment* 7 18 18 38 81 35
Expense adjustment* 196 234 300 338 1,067 221
Operating profit (non-IFRS) 834 1,173 1,239 1,969 5,214 901
Operating margin (IFRS) in % 18.8 23.6 23.3 31.7 25.1 17.9
Operating margin (non-IFRS) in % 24.8 30.0 31.2 38.9 32.0 24.8
Effective tax rate (IFRS) in % 26.9 23.6 24.8 28.0 26.2 16.3
Effective tax rate (non-IFRS) in % 28.1 25.6 26.7 28.7 27.5 21.4
Earnings per share, basic in € (IFRS) 0.37 0.55 0.52 0.92 2.37 0.44
Earnings per share, basic in € (non-IFRS) 0.49 0.70 0.70 1.14 3.03 0.58
Net cash flows from operating activities 2,071 329 657 765 3,822 2,162
Purchases of intangible assets, and property, plant and equipment
−113 −162 −95 −171 −541 −113
Free cash flow 1,958 167 562 594 3,281 2,049
Deferred cloud subscriptions and support revenue (quarter end) (IFRS)
120 155 169 317 317 344
Revenue adjustment* 72 60 44 40 40 33
Deferred cloud subscriptions and support revenue (quarter end) (non-IFRS)
193 215 213 358 358 377
Days sales outstanding (DSO) in days** 60 61 60 59 59 61
Headcount*** 59,420 60,972 61,344 64,422 64,422 64,598
Employee retention in % (rolling 12 months) 93 94 94 94 94 94
Women in management in % (quarter end) 18.7 19.0 19.3 19.4 19.4 19.9
Greenhouse gas emissions in kilotons 130 120 115 120 485 140
* Adjustments in the revenue line items are for support revenue, cloud subscription revenue, and other similarly recurring revenues that entities acquired by SAP would have recognized had they remained stand-alone entities but that SAP is not permitted to recognize as

INTERIM REPORT JANUARY – MARCH 2013 49
revenue under IFRS as a result of business combination accounting rules. Adjustments in the operating expense line items are for acquisition-related charges, share-based compensation expenses, restructuring expenses, and discontinued activities. ** Days Sales Outstanding measures the length of time it takes to collect receivables. SAP calculates DSO by dividing the average invoiced accounts receivables balance of the last 12 months by the average monthly sales of the last 12 months. *** In full-time equivalents at quarter end

50 ADDITIONAL INFORMATION
ADDITIONAL INFORMATION Financial Calendar June 4, 2013 Annual General Meeting of Shareholders, Mannheim, Germany July 18, 2013 Second-quarter earnings release, telephone conference October 21, 2013 Third-quarter earnings release, telephone conference January 21, 2014 Fourth-quarter and full-year 2013 preliminary earnings release, telephone conference Investor Services For more information, see our Q1 2013 Earnings Release, our Q1 2013 Investor Presentation, and a replay of our Q1 2013 Conference Call, all of which are available at http://www.sap.com/corporate-en/investors/events/calendar.epx?cat=132. SAP offers additional services and resources on our investor relations Website, www.sap.com/investor, to help investors learn more about SAP stock including, for example, our e-mail newsletter, text message services, and Twitter messages. The SAP Integrated Report is available online only at www.sapintegratedreport.com in both English and German. The following publications are available in English at www.sap.com/investor (follow the link to Financial Reports and then to the period you are interested in), or in German at www.sap.de/investor, as indicated below: SAP Group Annual Report (IFRS, in English and
German, printed) Annual Report on Form 20-F (IFRS, only in
English, printed) SAP AG Statutory Financial Statements and
Review of Operations (HGB, only in German, printed)
Quarterly Reports (in English and German, printed)
SAP INVESTOR, SAP’s quarterly shareholder magazine (online at www.sap-investor.com, in English and German (printed))
You can also read SAP’s annual and quarterly reports on an iPad. The free and interactive app is now available in the App Store. If you would like to order a printed copy of the Annual Report or subscribe to our SAP INVESTOR shareholder magazine, you can do so on our Website or by sending an e-mail to [email protected]. If you prefer to order by phone or fax, you can reach us at the following investor services numbers: Europe, Asia Pacific Japan, Africa Tel. +49 6227 7-67336 Fax +49 6227 7-40805 Americas Tel. +1 877 727 7862 Addresses SAP AG Dietmar-Hopp-Allee 16 69190 Walldorf Germany Tel. +49 6227 7-47474 Fax +49 6227 7-57575 Internet www.sap.com E-mail [email protected] All international subsidiaries are listed on: www.sap.com/contactsap/directory Information About Content: Investor Relations: Tel. +49 6227 7-67336 Fax +49 6227 7-40805 E-mail [email protected] Twitter @SAPinvestor Internet www.sap.com/investor Imprint Overall Responsibility: SAP AG Corporate Financial Reporting Published on April 19, 2013 Copyright Usage in Collateral © 2013 SAP AG or an SAP affiliate company. All rights reserved. No part of this publication may be reproduced or transmitted in any form or for any purpose without the express permission of SAP AG. The information contained herein may be changed without prior notice.

INTERIM REPORT JANUARY – MARCH 2013 51
Some software products marketed by SAP AG and its distributors contain proprietary software components of other software vendors. National product specifications may vary. These materials are provided by SAP AG and its affiliated companies (“SAP Group”) for informational purposes only, without representation or warranty of any kind, and SAP Group shall not be liable for errors or omissions with respect to the materials. The only warranties for SAP Group products and services are those that are set forth in the express warranty statements accompanying such products and services, if any. Nothing herein should be construed as constituting an additional warranty. SAP and other SAP products and services mentioned herein as well as their respective logos are trademarks or registered trademarks of SAP AG in Germany and other countries. Please see www.sap.com/corporate-en/legal/copyright/ for additional trademark information and notices.

GROUP HEADQUARTERS
SAP AGDietmar-Hopp-Allee 1669190 WalldorfGermanywww.sap.com www.sap.com/investor