
Helping students or just taking their cuts? How ...
57
Running head: FUNDING STUDENT AID DURING DOWNTURNS 1 Helping students or just taking their cuts? How prioritization of state student aid programs responds to downturns in higher education appropriations Cover Page * One- or two-sentence description of the article (for the contents page): Using data on the 50 American states from 1980 to 2013, this study examines the prioritization of state student aid relative to institutional support during periods of substantial declines in higher education spending. Student aid is found to be most often prioritized in such downturns and this is generally consistent within states over time, while states with higher aid funding per student and lower unemployment rates at the onset of a downturn are more likely to prioritize aid during the downturn.
Transcript of Helping students or just taking their cuts? How ...

Running head: FUNDING STUDENT AID DURING DOWNTURNS 1
Helping students or just taking their cuts? How prioritization of state student aid programs
responds to downturns in higher education appropriations
Cover Page
* One- or two-sentence description of the article (for the contents page):
Using data on the 50 American states from 1980 to 2013, this study examines the prioritization
of state student aid relative to institutional support during periods of substantial declines in
higher education spending. Student aid is found to be most often prioritized in such downturns
and this is generally consistent within states over time, while states with higher aid funding per
student and lower unemployment rates at the onset of a downturn are more likely to prioritize aid
during the downturn.

FUNDING STUDENT AID DURING DOWNTURNS 2
Author 1:
Name: Amy Y. Li
Email: [email protected]
Phone: 970-351-3796
Address:
University of Northern Colorado
Department of Leadership, Policy, and Development
McKee Hall 418, Campus Box 103
Greeley, CO 80639
Amy Li is an Assistant Professor of Higher Education at the University of Northern Colorado.
Her research focuses on higher education finance and policy, specifically performance funding,
financial aid and student loan debt, “free” college programs, state appropriations, and state policy
adoption. Her recent works include “Performance Funding Policy Impacts on STEM Degree
Attainment” in Educational Policy, “Dramatic Declines in Higher Education Appropriations:
State Conditions for Budget Punctuations” in Research in Higher Education, and a co-authored
piece on “Institutional Accountability: A Comparison of the Predictors of Student Loan
Repayment and Default Rates” published in the ANNALS of the American Academy of Political
and Social Science.
Author 2:
Name: William Zumeta
Email: [email protected]
Phone: 206-543-0743
Address:
University of Washington
Evans School of Public Policy & Governance
Box 353055
Seattle, WA 98195-3055
William Zumeta is Professor of Public Policy & Governance and of Higher Education at the
University of Washington in Seattle. He is a TIAA Institute Fellow and served as President of
the Association for the Study of Higher Education in 2009-10. His research interests are in state
higher education policy and finance, including accountability policies and policies affecting
private institutions and community colleges, among others. He is first author of Financing
American Higher Education in the Era of Globalization, with D. Breneman, P. Callan, & J.
Finney (Harvard Education Press, 2012). He is co-author, with Alicia Kinne-Clawson, of, "The
State Higher Education Executive Officer and Higher Education Finance," a chapter in D.
Tandberg, B. Sponsler, R. Hanna, & J. Guilbeau (eds.), The State Higher Education Executive
Officer, in press at Teachers College Press.

FUNDING STUDENT AID DURING DOWNTURNS 3
Structured Abstract
Background/Context
During downturns in state higher education support, state student aid becomes especially
important for affordability because colleges react by increasing tuition, and other aid sources
may not fully respond. From a policy perspective, states might be expected to protect aid support
in response to fiscal stringency, yet this key relationship is understudied. We use social
construction theory framing, hypothesizing that, because college students are positively
construed as a “deserving” target population, policymakers prefer allocating benefits to them
relative to institutional support, particularly in hard times.
Purposes:
We seek to better understand the long-term shift in state higher education funding away from
institutional support toward student aid, with particular interest in whether this trend accelerates
during fiscal stringencies when tuition spikes increase the salience of students’ needs. Further,
we aim to understand structural, political and economic characteristics of states that prioritize
student aid during downturns versus not.
Research Design:
Across 50 states from 1980-2013, we identify periods of substantial downturn in higher
education appropriations, observing 109 such cases. Within these state-specific downturns, we
compare percentage changes in student aid funding versus institutional support, classifying
budgetary responses into three priority categories: student aid, institutional support, or budgetary
equity. We conduct a regression across 1700 state-years to investigate whether the share of
appropriations allocated to student aid differs in downturn versus non-downturn years, and
employ a random effects model to explore trends within states. A logistic regression estimates
the relationship between student aid prioritization and state-level factors.
Findings:
States prioritize funding for student aid in most downturns, fewer in the 1980s, but consistent at
around 80% across more recent sub-periods (1990s, early 2000s, late 2000s-2010s), indicating
considerable stability in this dimension of state higher education policy cultures. On average,
states increase student aid’s share of higher education appropriations more sharply during
downturn years (2.6 percentage points higher aid share) than other years. States with more aid
per student and a lower unemployment rate at downturn onset are more likely to prioritize aid.
Magnitude of tuition increase during downturns was not a significant factor.
Conclusions:
This study contributes to discussions about higher education affordability policies by
illuminating both the relative resilience of student aid support in downturns and that the long-
term increase in aid’s share of higher education appropriations is more likely a reaction to tuition
growth than an explicit “voucherization” of higher education finance policy.
Keywords: financial aid; state funding; higher education; higher education finance; social
construction

FUNDING STUDENT AID DURING DOWNTURNS 4
Executive Summary
During increasingly frequent periods of substantial downturn in state support of higher
education, to what extent do states protect their programs of financial aid to students relative to
their support for institutions? Virtually all states have student aid programs in place which in
total provide more than $10 billion annually to (largely undergraduate) students, with the
primary objective of making college more affordable and broadly accessible. These programs
also serve as a policy tool for states to advance their college completion and equity agendas. The
role of student aid is particularly important during downturns because public institution tuition
levels tend to increase sharply in such times, while federal and other sources of aid do not
necessarily respond to increased state-level needs.
We investigated whether state policymakers do indeed prioritize student aid over support
for institutions when overall cuts to state higher education budgets are deemed necessary. We
defined downturns as years in which inflation-adjusted state appropriations to higher education
fell by 5% or more across two consecutive years. A downturn was considered to be in effect until
either the state’s appropriation recovered to the pre-downturn level or had three consecutive
years of real increases. Using these criteria, we identified 109 state-specific downturns over
1980-2013. All states experienced at least one downturn, most states experienced two or three,
and three states experienced four downturns.
Applying concepts from the politics of public policy literature on social construction and
public budgetary processes, we hypothesized that during downturns policymakers would respond
to undergraduate students’ needs more than to those of public institutions because students are
more favorably constructed than are large institutions, and this favorable construction should be
especially salient in periods of budgetary stress. On the other hand, institutions could be more

FUNDING STUDENT AID DURING DOWNTURNS 5
successful in pressing their budgetary claims because they are better organized to lobby
legislators and can marshal support from influential local economic interests and alumni (some
of whom are legislators). We also expected that there would be cases where the two types of
claimants–“policy targets” in social construction language–would be perceived as equally
compelling so that changes in allocations would be similar, following common equity norms in
budgeting.
We defined the relative prioritization of student aid versus institutional support by
comparing the percentage change in these two major categories over each downturn period.
Thus, if the percentage-change in one of the two categories was at least 5 percentage points more
favorable than the percentage change in the other category (say, a 1% cut versus a 6% cut), then
the first category was counted as prioritized. Where the difference in relative treatment was less
than 5 percentage points, the state was categorized as practicing budgetary equity.
We further hypothesized that the relative treatment of the two policy targets might be
related to characteristics such as: a state’s commitment to student aid (state aid spending per
enrolled student); whether or not a substantial portion of the state’s student aid was distributed
on the basis of academic merit; share of enrollment in private nonprofit institutions, which are
likely more dependent on student aid; governance structure for higher education (statewide
governing board versus state coordinating or planning board); political party control of the
senate, house, and gubernatorial seat; and the unemployment rate, all at the onset of a downturn.
We additionally accounted for other state-level characteristics commonly used in studies of
higher education spending (per-capita personal income, Gini coefficient, region, public higher
education tuition level). Finally, our analyses took into account the extent to which each state’s
public tuition, per-capita income and unemployment rate changed over each downturn.

FUNDING STUDENT AID DURING DOWNTURNS 6
Findings:
As predicted, we found that most states generally treated student aid more favorably than
institutional support during their downturns in overall higher education support, although this
usually meant smaller reductions in student aid than in institutional support rather than increases
in aid spending. More favorable treatment of student aid occurred in 75% of the state downturns
overall and in around 80% of cases in each of the three more recent downturn eras (1990s, early
2000s, and Great Recession-2010s). Institutional support was prioritized in 17% of the
downturns and budgetary equity prevailed in the remaining 7%.
We also found considerable consistency in state classifications across downturns in the
different decadal periods, suggesting that states have embedded higher education “policy
cultures,” or established ways of coping with common problems—in this case periodic and
difficult fiscal circumstances. Generally, these patterns were consistent with more favorable
construction of students’ needs than those of institutions. Among the 38 states that experienced
two or more significant downturns in higher education support, 24 (63%) retained a policy
priority for student aid across their multiple downturns. Only one state, Wyoming, prioritized
institutional support across multiple (two) downturns.
Since the share of state higher education dollars going to student aid was increasing
overall during the period examined, we explored whether downturns tended to boost the upward
trajectory of student aid’s share of higher education support. We hypothesized that downturns
might produce such a boost because a favorable construction of students’ needs becomes more
salient given sharp tuition increases. Using a regression analysis of state student aid share across
the 1,700 state-years, we discovered that downturn years were associated with a 2.6 percentage
point higher student aid share compared to non-downturn years (against a context of a 5.7%

FUNDING STUDENT AID DURING DOWNTURNS 7
mean student aid share across all state-years). When we constructed a random effects model and
interacted state-specific downturns with individual state indicators in order to allow the direction
and size of effects to vary by state, the overall coefficient on the downturn identifier was no
longer statistically significant. However, eight states showed a positive and significantly higher
student aid share during their respective downturn years, while the majority showed a positive
yet non-significant coefficient estimate, and none allocated significantly less to student aid
during these periods. These patterns suggest that downturn conditions are at least in some cases
conducive to the growth of student aid share, as we expected.
Lastly, we conducted a logistic regression to analyze the relationship between a state’s
prioritization of student aid in its downturn years or not (collapsing together the institutional
support and budgetary equity categories) and the various state characteristics mentioned earlier.
In our preferred model, we found that a state’s commitment to student aid at onset of a downturn
positively predicted prioritizing student aid during the downturn, with every 10% increase in aid
dollars per student associated with a 6% increase in the likelihood of prioritizing student aid. On
the other hand, a higher state unemployment rate at the onset of a downturn was negatively
associated with student aid prioritization, with a 1-percentage point increase in unemployment
rate lowering the likelihood of prioritizing student aid by 36%. This suggests that states with
weaker economies may be less willing to reduce appropriations to institutions that they already
fear reach uncomfortably close to institutional core needs. Although limited degrees of freedom
may be a factor, we were mildly surprised to find no significant relationships between student aid
prioritization and: political party control; public tuition level; magnitude of public tuition
increase during the downturn; presence of a substantial merit aid program in a state; region;

FUNDING STUDENT AID DURING DOWNTURNS 8
state governance structure; or private enrollment share. We experimented with more
parsimonious models, which resulted in consistent findings.
Implications:
Given the context of a secular trend toward an increasing student aid share of state
appropriations relative to institutional support, we questioned initially if this might signify an
explicit policy move toward “voucherization” of higher education finance, i.e., deliberately
directing more state funding to students who then chose where to take their subsidies. We
conclude that the tendency of the aid share to increase during downturns, for aid share growth in
these periods to be significantly associated with a stronger state aid orientation, and the lack of
an association between aid prioritization and political party control together suggest that
something else is at work. More likely, state policymakers are responding to the long upward
march in real tuition charges to favorably constructed students by trying to allocate more benefits
to students in the form of financial aid, at a relatively modest cost. In substantial downturns, the
need to protect this vulnerable group is more salient, so the tendency to prioritize aid is perceived
as more urgent than institutional needs, perhaps because institutions have more options for
reducing inefficiencies and generating alternative revenue. This favorable construction of
students is a bright spot in the contemporary higher education finance landscape and provides
some assurance that the state policy tool of need-based student aid can continue to be used, and
perhaps honed further with appropriately designed incentives, to advance the completion and
equity agendas prominent in state higher education policy today.

FUNDING STUDENT AID DURING DOWNTURNS 9
Helping students or just taking their cuts? How prioritization of state student aid programs
responds to downturns in higher education appropriations
Introduction and Motivation
Economic recessions are recurring and fairly frequent phenomena. The U.S. has
experienced eight periods of negative economic growth since 1980, with four of these long
enough to be considered recessions (National Bureau of Economic Research, n.d.).1 These events
substantially and disproportionately impact state higher education funding (Delaney & Doyle,
2011; Zumeta, 2009; 2014) and their implications for important policies, such as state student
aid, need to be better understood. State student aid funding is especially important in periods of
recession and their aftermath because the typical reaction to state revenue shortfalls includes
both cuts in appropriations for higher education and sharp tuition increases by public colleges
and universities. Virtually all states have one or more programs of grant aid to college students,
or “student aid.” The total grant aid to students provided by these programs exceeds $10 billion,
of which 98% goes to undergraduates (College Board, 2017), demonstrating their considerable
importance in the array of governmental efforts to make college affordable. In some states, as
will be seen, the relative importance of these programs for student affordability is quite high.
This study examines patterns of prioritization of state student aid programs in relation to
the broader budgetary treatment of higher education by states over a period of 34 years (1980 –
2013 inclusive). From a public policy perspective, one might hope that states would seek to
respond to the recurring pattern of sharp public university tuition increases during difficult
economic times by amply funding student aid in order to help students afford such price hikes
and persist through college. This would be expected to occur if students are a target population

FUNDING STUDENT AID DURING DOWNTURNS 10
that is favorably constructed by citizens and their agents (policymakers) within the framework
suggested by social construction theorists (Schneider & Ingram, 1993; Schneider, Ingram, &
DeLeon, 2014). Alternatively, in such times of fiscal stress when competition for available
resources is particularly intense, student aid programs—which in nearly all states are available to
state residents attending private as well as public institutions—may have difficulty competing
with public colleges that could be better positioned to lobby legislators (Li, 2017; McLendon,
Hearn, & Mokher, 2009; Tandberg, 2010). Finally, the literature on public budgeting processes
indicates that equity norms are generally influential in the relative treatment of budgetary
claimants (Rubin, 1997; Wildavsky, 1984), so it would not be surprising to find that in some
states, student aid programs receive similar treatment to institutional appropriations during
economic downturns in higher education spending.
Our research seeks to understand which of these three plausible alternative patterns
characterizes more states—and which types of states—in each of the periods of sharp downturns
in state support for higher education since 1980, including the most recent period associated with
the “Great Recession” of 2007-09. As will be explained, we define a period of downturn in
higher education appropriations at the state-specific level but, since many of the state reductions
closely match U.S. recession periods and their immediate aftermath, we generally refer to the
downturns in relation to these well-known national recessions. Further, we examine the
characteristics of states that fall into each of the three categories using state-level postsecondary
education, economic, and political variables expected to relate to budgetary allocations. Better
understanding of the factors associated with the resilience of key student assistance programs in
hard times should help in assessing how much difference they can make in supporting the
FUNDING STUDENT AID DURING DOWNTURNS 11
national college completion agenda (Gates Foundation, n.d.; Lumina Foundation, 2013; Zumeta,
Breneman, Callan, & Finney, 2012).
By 2013, the U.S. had largely emerged from the worst recession since the 1930s and its
lingering hangover (Zumeta, 2014). Per-student appropriations had reversed an annual decline
that began in 2009, although much of this apparent gain was due to enrollment decline. Although
increases have been painfully slow and not uniform across states, nationwide, states were
providing about 20% more (in current dollars) for higher education in fiscal year 2017 than they
were five years earlier (Zumeta, 2017). This uptick follows a long-standing cyclical pattern,
likened to a “balance wheel” (Delaney & Doyle, 2011), whereby higher education support tends
to take disproportionate cuts in recessions and their immediate aftermath but eventually recovers
as times improve. While the majority of cuts made to state higher education appropriations from
1980 to 2009 have been incremental, many states have also experienced punctuated (unusually
large) cuts to appropriations (Li, 2017).
Each successive recession period since that of the early 1980s has affected more states
with larger cuts and longer periods of decreased state support (Delaney & Doyle, 2011; Zumeta
et al, 2012; Zumeta 2017). When state support for higher education stagnates or declines, public
colleges and universities typically respond by increasing tuition sharply (see Figure 1), with
(often veiled) acquiescence from state policymakers.
[Insert Figure 1]
Tuition increases and declines in state support, exacerbated in recessionary periods, have
shifted more of the cost of higher education onto students and families. Net tuition as a share of

FUNDING STUDENT AID DURING DOWNTURNS 12
total educational revenues grew extensively during the Great Recession and aftermath, from
36.0% in 2008 to 48.5% in 2013, then declined slightly to 47.3% in 2016 as state support inched
up (State Higher Education Executive Officers, 2017). Over a longer period, the reliance of
public higher education on tuition revenue has grown from approximately 26% in 1991 to the
levels just mentioned approaching 50% of total educational revenues. As tuition has climbed,
state student aid programs have become increasingly important to the key policy goal of ensuring
affordability of higher education for students so that they can enter college, persist, and complete
degrees. In 2016-17, 8% of all grant aid for students came from state governments (College
Board, 2017, Figure 3). Support for federal student aid programs, while much larger in total, has
its own rhythms and is not necessarily responsive to state fiscal conditions (Zumeta et al, 2012).
Moreover, federal grant aid has been slowly declining in constant dollar terms in recent years
(College Board, 2017). State policymakers, on the other hand, can adjust state student aid
programs and funding to be responsive to “unavoidable” tuition escalation in periods of
economic stress to at least mitigate price effects on students. Here we explore to what extent they
have done this over three decades, focusing on periods (defined at the state level) when overall
state support for higher education was significantly reduced, and we also examine the state
characteristics associated with more versus less prioritization of student aid funding during these
periods.
State Student Aid Grant Programs
In recent decades, nationwide, state grant aid programs have grown faster than state
appropriations to public higher education. In 1980-81, state grant expenditures constituted just
3.3% of total state support for higher education, with this share rising to 8% in 2001-02, and to
12.8% in 2014-15 (College Board, 2015; NASSGAP, 2015). This long-term trend has occurred

FUNDING STUDENT AID DURING DOWNTURNS 13
over an era when total state higher education support has grown relatively little in real per-
student terms. In current dollars, state undergraduate grant aid increased from $2.15 billion in
1990-01 to nearly $10.5 billion in 2014-15, according to the National Association of State
Student Grant and Aid Programs (NASSGAP, 2015).
This growth in the relative emphasis on student aid in states’ higher education budgets
raises the obvious question: Why? Does it reflect an explicit, philosophically-based
“voucherization”2 of state higher education finance policy in the sense of deliberately linking
more money to students and letting them choose where to enroll? Or, is the trend a function of
hard-pressed states simply seeking to reduce higher education subsidies overall by allowing
tuition to rise while providing the needy—at least where need is the primary criterion for aid
eligibility—more to help compensate? Perhaps the latter pattern is driven in important measure
by responses to episodic downturns when appropriations fall, tuition spikes, and many or most
states seek to mitigate the impacts on students by treating student aid budgets relatively
favorably. In this study, we focus specifically on the role of this last phenomenon—the relative
treatment of student aid by states during periods when overall higher education appropriations
are significantly reduced—which we term higher education downturns.
“Merit” aid. When state student aid programs first emerged, largely in the 1960s and
1970s, the vast majority of the funding was provided to students on the basis of their financial
need. After all, the raison d’tre for these programs was to help students who could not afford
tuition costs. Beginning in the early 1990s a new pattern began to emerge (Doyle, 2010a).
Although some state programs had long existed that awarded student aid on bases other than
financial need—such as to children of deceased public safety officers, to a small number of
honors students in each legislative district or to students studying fields thought to be

FUNDING STUDENT AID DURING DOWNTURNS 14
undersupplied within the state—the total dollar amount of such awards was generally quite small
compared to the dollars for need-based aid.
Starting with Georgia’s HOPE Scholarship program in 1993, a surge in so-called “merit-
based” aid began. These programs offered state grant aid, generally without regard to financial
need, to large numbers of high achieving students (e.g., those with high GPAs or college
entrance examination scores). The higher achieving group tends to include many more middle-
income and affluent than truly needy students, and generally includes fewer underrepresented
students (Heller, 2004; Zhang & Ness, 2010). States vary in the sources utilized to fund merit aid
programs, which include tobacco settlements, land leases and sales, turnpike tolls, state lotteries,
and, to a limited extent, state general funds (Tennessee Higher Education Commission, 2012).
Many programs, including the Georgia HOPE Scholarship, are financed by state lottery proceeds
(Doyle, 2010b; Heller, 2004), and thus tap a separate source of revenue than does need-based
student aid, which mostly comes from state general funds. Largely funded from a new, nontax
source and in an era when tuition was already climbing fast, merit aid programs proved to have
strong political appeal in addition to advancing policy objectives such as keeping capable
students from leaving a state and, arguably, increasing the state’s college attendance rates
(Cornwell & Mustard, 2005; Doyle, 2010a; Monks, 2009). Largely as a result, the nationwide
proportion of state grant aid awarded to undergraduates primarily on the basis of student
financial need fell from 76.7% in 1999-2000, to 61.5% in 2015-16 (NASSGAP, 2000; 2016).
Hence, our empirical analysis takes into account whether or not a state operates a broad-
based merit aid program, defined as a program that is large in terms of the proportion of students
who are eligible and the dollar amount of the award (Doyle, 2006). It would not be surprising to
find that the resilience of state aid support in downturn periods varies with this variable since

FUNDING STUDENT AID DURING DOWNTURNS 15
merit aid programs have notably different objectives and funding sources, and therefore
plausibly different politics, from traditional need-based aid.
Conceptual Framework
We conceptualize this study using social construction theory from the public policy and
political science literature, which posits that the portrayals of policy targets contain value-laden,
emotional, and powerful signals and images that influence policy decisions (Schneider &
Ingram, 1993). The positive and negative associations of target populations as well as their
political power influences policymakers’ decisions to allocate resources. Policymakers prefer to
allocate benefits to populations perceived as “deserving” and to minimize benefits to
“undeserving” populations, which in turn appeals to the public, increases policymakers’ political
capital, and supports their continued re-election (Schneider, Ingram, & DeLeon, 2014). For
example, college students are generally positively constructed as hardworking, worthy, and
deserving of benefits, so policymakers may tend to provide—and safeguard when necessary—
benefits to this group. Yet, students lack the political power to effectively demand more
resources, so they are often the first to feel the effects (via higher tuition) of cuts when budgets
are tight. A question arises, however, as to whether policymakers might prefer to expend modest
resources on (or minimize cuts to) student financial aid to try to mitigate these effects on a group
that is mostly positively constructed.
On the other hand, public colleges might be constructed more negatively by many as
greedy, costly, and inefficient, yet wield considerable influence by virtue of their lobbying. Even
though public universities usually face limits on lobbying expenditures and cannot make direct
campaign contributions, supporters such as alumni and economic interests in universities’ locales
can be mobilized to enhance institutions’ influence. Also, public colleges and universities
FUNDING STUDENT AID DURING DOWNTURNS 16
typically have a number of alumni among legislators. If colleges are framed as undeserving
contenders, policymakers may not want to openly appear to be swayed by lobbyists or help
colleges more than absolutely necessary. Consequently, public colleges would be likely to
receive relatively few contested benefits, and some of the benefits they do receive may be buried
within the details of legislation and hard to identify (Schneider et al., 2014). However, public
colleges may also be constructed as essential, innovative, and contributing to the public good,
which would support the maintenance of taxpayer funding for direct institutional support during
hard times.
When the financial interests of students and public colleges are in direct competition with
each other in terms of state funding, policymakers must make decisions on how to allocate
“benefits” and “burdens” (Schneider & Ingram, 1993). We propose that social construction
theory frames the differing values that policymakers place on protecting student aid programs
versus safeguarding funding for public colleges but that it is difficult a priori to specify which
claims will most often win out. Of course, it is possible that state policymakers are not so
intentional about their allocation decisions in some cases, and that allocations sometimes depend
on which target population voices its needs most loudly. In any case, beneath these competing
claims is the underlying norm in budgetary processes of equity of treatment. When claimants
seem roughly equally deserving (or equally loud in their clamor), rough equity in allocation of
pain or gains is likely to be the “default” posture of policymakers (Rubin, 1997; Wildavsky,
1984).
Research Questions
In this study, we are primarily interested in how states behave with respect to funding of
state student aid programs during the evidently increasingly frequent periods of downturn in

FUNDING STUDENT AID DURING DOWNTURNS 17
higher education support. We classify each state’s budgetary allocation response in each of its
downturns into one of three categories: 1) cases where funding for student aid programs is
treated more favorably meaning, typically in a downturn, that it declines less than appropriations
for public colleges and universities–student aid is assumed to be a high policy priority in these
cases; 2) cases where student aid programs are treated less favorably than appropriations to
public institutions–institutional support is judged to be the higher policy priority; and 3) a third
category where states treat student aid about the same as institutional appropriations, in which
case we term budgetary equity to be the prevailing value. We describe the precise basis for
placing states into these categories in specific downturns in a subsequent section.
Our research questions can be grouped as follows.
First, which of our three student aid funding priority categories contains the most (and
the fewest) states? In short, do most states make an effort to protect higher education’s
affordability for positively constructed students through student aid during downturn periods? In
those that do not, is it public institutional interests or equity norms across budget categories that
seem to be the prevailing values at work?
Second, are more recent downturns different from earlier ones? Do states tend to stay in
the same policy priority category over time with respect to their relative treatment of student aid
support? Or, do many behave differently in successive downturns? One might expect some
stability over time in “state policy culture”-driven approaches to higher education funding and
student affordability issues. Yet, downturns have usually occurred some years apart and, overall,
our data covers more than 30 years of state fiscal history so much could change within states.
Third, we explore to what extent state student aid funding behaves differently during
periods of higher education downturn as compared to more “normal” periods, that is, in periods

FUNDING STUDENT AID DURING DOWNTURNS 18
between downturns. In other words, do downturns alter the underlying secular trend, which in
most states is toward allocating a greater share of state funding to student aid? We tentatively
hypothesize that downturns would tend to produce upward inflection points to the general
trajectory of increase in student aid’s share on the theory that state policymakers make special
efforts to mitigate the effects of substantial appropriations cuts and their associated tuition hikes
on students, who are positively constructed. If this proves to be the case, does the pattern apply
universally or are some states exceptions? In what ways do states that are exceptions differ from
those that follow the general pattern?
Finally, we examine the major state-level variables that are associated with states’
behavior in protecting student aid (or not) during downturns as captured by the policy priority
categories. We explore postsecondary, political, and economic characteristics within each state
to determine whether they are associated with the prioritization of student aid. The specific
variables we consider and our hypotheses are described later.
Data and Descriptive Analysis
Definition and Anatomy of Downturns
We use the term “downturn” to distinguish periods of serious state fiscal stress that result
in significant reductions in state support for higher education. These periods often coincide with
national recessions and their immediate aftermath years so, for ease of reference, we refer to
them by the decade in which one of the national recessions occurred (i.e. 1980s, 1990s, 2000’s,
and, for the Great Recession and aftermath, 2010’s). We gathered annual data on higher
education appropriations from the State Higher Education Executive Officers’ (SHEEO) Finance
reports. Higher education appropriations consist of state (but not local) operating support for
higher education institutions and student aid (plus a few other small items). We included higher

FUNDING STUDENT AID DURING DOWNTURNS 19
education operating funds that were provided through the federal American Recovery and
Reinvestment Act (ARRA) during the fiscal years 2009 to 2012 because these temporary
supplementary funds were allocated by the states and reported (State Higher Education
Executive Officers, 2017). Among all 50 states across years 1980 to 2013, the total annual
appropriations allocated to higher education (including ARRA funds where applicable) ranged
from $62.2 million to $12.6 billion, with a mean of $1.39 billion (in 2013 CPI-adjusted dollars).
Operationally, we define a downturn as a period when total state appropriations of
operating funds for higher education (including state student aid) declined by at least 5%, in
inflation-adjusted terms, over a period of two years, i.e., higher education appropriations were at
least 5% lower in real terms in year 2 of the focal period than they were in the baseline year (the
year before the onset of the downturn). Also, year 2 of the downturn period must have shown
some decrease from year 1. This definition thus excluded cases where there was a short period of
decline that quickly recovered (e.g., when there was a 5% decline across two years, but it was
based on a 10% decline in year 1, followed by a 5% increase in year 2). This definition does not
consider enrollment, which typically increases in hard economic times, thus making a 5% real
cut even larger in per-student terms. We assert that a 5% real cut over two years is quite
substantial in an enterprise such as higher education with a large proportion of skilled personnel
costs and a consequent tendency for unit costs to grow over time at a greater rate than the
economy-wide rate of inflation (Archibald & Feldman, 2006). Our focus was thus on periods of
substantial (and not evanescent) fiscal stress.3
Further, by our basic definition, a period of budgetary downturn continues until inflation-
adjusted appropriations to higher education return to at least their level in the baseline year. After
examining the multiple downturns since 1980 state-by-state, however, we discovered a number

FUNDING STUDENT AID DURING DOWNTURNS 20
of cases after 2000 (but none before that year) in which the level of real appropriations to higher
education in the baseline year was not reached before the onset of a substantial new decline.
Therefore, if certain conditions were met, we define a state as having reached a “new normal”
condition of fiscal recovery even if it did not reach the previous peak. Specifically, we assume
that effective recovery had occurred after three consecutive years of real growth in higher
education appropriations following the lowest point of the downturn. In such cases the third year
of appropriations growth was not coded as part of the downturn period. If there were two years
of growth, but the third year showed a decline, the downturn was coded as continuing provided
that the previous baseline appropriations level was not reached. All in all, we found 109 state-
specific periods of significant downturn in state higher education support from 1980 to 2013 that
met our rather stringent definition.
Determining State Policy Priorities During Downturn Periods
Our first research question asks whether, in periods of fiscal stress, states are more likely
to prioritize student aid, support for public institutions, or simply treat both functions relatively
equally. We collected data on student aid funding from annual surveys conducted and reported
by the National Association of State Student Grant and Aid Programs (NASSGAP),
incorporating the “total aid awarded” amount by state (listed in Table 3 for the 2012-13
NASSGAP annual survey). Total aid includes aid to undergraduates (who receive about 98% of
it) and graduate students in the form of need-based and non-need-based grants, as well as a
relatively small amount of non-grant aid consisting of loans, loan assumption/forgiveness,
conditional grants, work-study, and tuition waivers (NASSGAP, 2013). We created a variable for
“institutional support” by subtracting each state’s total aid awarded (CPI-adjusted) from its total
FUNDING STUDENT AID DURING DOWNTURNS 21
higher education appropriations, since other components of higher education appropriations were
found to be quite small.
To contextualize, there was substantial range in the amounts of student aid allocated by
each state. Across all states from 1980 to 2013, the mean level of annual student aid support was
$105 million, with a standard deviation of $184 million (in 2013 dollars). Student aid allocations
ranged from a minimum of zero up to a maximum of $1.55 billion. There were several years in
which Alaska (1999 to 2005), Nevada (1985 to 1987, and 2003), and South Dakota (1998 to
2005) allocated no funds to student aid. On the other end of the spectrum, California and New
York commonly awarded the highest amount of aid by virtue of their large student populations,
while Vermont and New York consistently had the highest proportion of total student aid
expenditures compared to state higher education spending (Authors’ calculations). In regard to
regional differences, the northeastern, upper Midwestern and some southern states typically
allocated more to student aid, while the Rocky Mountain states allocated less.4 We later explore
the interesting question of how the size of a state’s student aid program (per enrolled student), a
plausible indicator of favorable construction of students in a state’s “higher education policy
culture,” is related to whether the state prioritizes aid during downturns.
To determine which of the three categories of hypothesized policy priorities best
represents a state’s student aid funding pattern in each downturn, we compared the percentage
change in student aid to the percentage change in all other higher education appropriations over
the downturn period. We operationalized the policy priority categories as follows. First, if the
percentage change in student aid funding over the downturn period was more favorable by five
or more percentage points than the percentage change in all other higher education
appropriations (say, a one percent cut versus a six percent cut), we placed the state in the student
FUNDING STUDENT AID DURING DOWNTURNS 22
aid priority category for the focal downturn. Second, if the percentage change in all other higher
education appropriations was five or more percentage points more favorable than the percentage
increase in student aid (the mirror image of the previous category), we characterized the state as
prioritizing institutional support. This would presumably be reflective of policymakers
attributing less favorable constructions of students compared to institutional needs in downturn
periods. Such institutional needs might be particularly salient where the colleges were already
perceived to be “underfunded.” Finally, if the percentage change in student aid was less than five
percentage points different from the percentage change in all other appropriations, we
categorized the state as employing a policy of budgetary equity, which we characterize as
reflective of underlying budgetary norms that carry the day when competing claims are
perceived as being equally compelling.
Within the total of 109 downturn periods, we found 82 downturns (75% of the total) in
which student aid was prioritized, 19 downturns (17%) in which institutional support was
prioritized, and 8 instances (7%) of budgetary equity as defined. To test the sensitivity of our
definition for classifying state policy priorities, we also examined thresholds of 2.5 and 7.5
percentage point changes in allocations to the two major categories to compare with our results
using the base 5 percentage point differences.5 By all definitions, the data was quite clear that
states generally prioritized student aid support in periods when higher education appropriations
decreased significantly.
Policy Priorities Across Decades
We examined patterns to see how many states fell into each of the three hypothesized
categories during each of the four national downturn periods.6 All 50 states experienced at least
one downturn by our definition (Table 1). We found that the largest share of states that

FUNDING STUDENT AID DURING DOWNTURNS 23
experienced downturns prioritized student aid funding in each of the four national downturn
periods and this was true by a large margin in the three most recent decades (Table 2). In each of
these latter three decadal periods, about 80% of states prioritized student aid, while institutional
support placed a distant second (tied with budgetary equity in the 2010s decade) and equity
across categories was in third place. Even in the 1980s, more states prioritized student aid than
institutional support or budgetary equity. This answers our first research question as to which of
our three student aid funding priority categories contains the most and the fewest states. Student
aid funding has clearly been most often prioritized by states in periods when higher education
appropriations fell significantly.
[Insert Tables 1 and 2]
Next, we addressed our second research question: Are more recent downturns different
from earlier ones? Do states tend to stay in the same one of the three policy priority categories
over time with respect to treatment of student aid support? In other words, are states’ policy
cultures with respect to student aid vs. institutional support prioritization stable over long
periods? Reading horizontally across Table 1 (states across decades) provides a sense of the
degree of stability in states’ prioritization in the downturns it experienced. To summarize, there
was considerable consistency in states’ policy priorities across the decades. Among the 38 states
that experienced two or more of these significant downturns in higher education support, 24
states (63%) retained a policy priority for student aid across their multiple downturns. Notably,
California and Oklahoma each had four downturns during which they consistently prioritized
student aid.
There were, however, a few states that failed to prioritize student aid during any
downturns in higher education support. Wyoming was one of only two states to give priority to

FUNDING STUDENT AID DURING DOWNTURNS 24
institutional support across multiple downturns, in its case two downturns that both came before
2000. South Carolina also prioritized institutional support in two downturns (one in the 1980s
and one in the early 2000s), while treating the two higher education budgetary components
relatively equally in its 1990s downturn. Mississippi had two downturns, prioritizing public
institutional support in the 1980s and distributing higher education resources equitably across the
two major components in the 2000s downturn. Massachusetts prioritized institutional support in
its 1980s and early 2000s downturns but favored student aid in the Great Recession era (2010s)
downturn. Alabama, Alaska and New Hampshire each had only one downturn that met our
criteria during which they all prioritized institutional support.
In summary, over the decades, the large majority of states consistently gave priority to
student aid during periods when overall higher education support was significantly reduced,
some consistently favored institutional support, and only a few states varied in their priorities
across the decades. There does seem to be considerable stability in this aspect of state higher
education policy cultures, consistent with the idea that student needs are more favorably
constructed than institutional needs in difficult financial times.
Multivariate Analyses and Results
Student Aid Share of Funding
Next we turn to our third research question: Does the pattern of state student aid funding
as a proportion of all higher education support change during periods of significant downturn in
state higher education support compared to the non-downturn periods across 1980 to 2013? We
expected that downturns might prompt most states to increase the student aid share of state
higher education support more sharply during these periods to help students shoulder the burden
of steep tuition increases. As previously noted, states in aggregate have gradually increased the

FUNDING STUDENT AID DURING DOWNTURNS 25
share of their higher education appropriations devoted to student aid over several decades, so we
were curious to see if the general pattern of increase in student aid share significantly accelerated
in downturn periods. Framed within social construction theory (Schneider et al., 2014),
policymakers may view students as more deserving and needing direct support through financial
aid programs as compared to public colleges, which may be conceptualized as large enterprises
that are more resilient and advantaged in their capacity to absorb cuts and generate alternative
revenues.
To contextualize, of the 1700 state-years included in our dataset covering 50 states from
1980 to 2013, any given state was experiencing a downturn period by our definition during
approximately 37% of the state-years. Student aid’s share across all state-years ranged from 0%
to 40%, with a mean of 5.7% and a standard deviation of 6.0 percentage points. In the downturn
years, student aid’s share of state higher education funding across all states had a mean of 7.6%.
During years that were not defined as part of a downturn, student aid’s share was notably lower,
with a mean of 4.6%.
We employed a regression analysis to investigate more fully the relationship of
downturns to allocations to student aid as a share of all state higher education appropriations. We
first analyzed the overall trend of student aid share across all states:
Yit = Xit β1 + εit (1)
where Yit is the amount allocated to student aid as a proportion of all higher education
appropriations for state i in year t, Xit is a binary variable indicating whether state i is in a
downturn in year t, and β1 is a coefficient estimated across all states.
Against the general background nationally of a growing student aid share of all higher
education appropriations, our analysis of this share over the time span supports the hypothesis

FUNDING STUDENT AID DURING DOWNTURNS 26
that states on average have increased their student aid share more sharply in downturn periods,
compared to the overall trend (results reported on first line in Table 3, coefficient of “Downturn
Year” = 0.026, p < .001). That is, across all states, student aid share during downturn periods was
2.6 percentage points higher than in non-downturn periods.
[Insert Table 3]
To determine whether individual states treated student aid differently during downturn
periods, we constructed a random effects model with state-specific parameters:
Yit = αi +Xit β1 + Si Xit β2 + εit (2)
where Yit is the amount allocated to student aid as a proportion of all higher education
appropriations for state i in year t, αi is a dummy variable representing each state, Xit is a binary
variable indicating whether state i is in a downturn in year t, β1 is a coefficient estimated across
all states, Si Xit is the interaction of state i’s dummy with Xit, and β2 is a coefficient for each state
(adapted from Snijders & Bosker, 2012, p. 43). The state-specific estimates allow the direction
and size of the effect of downturn versus non-downturn years on the share of student aid to vary
from state to state.
Table 3 reports the average difference between downturn and non-downturn years across
all states after the inclusion of state-specific estimates, in the second row (coefficient is 0.005,
and not statistically significant). More importantly, Table 3 displays each state’s coefficient, or
the estimated difference in the share of all higher education appropriations allocated to student
aid between the state’s downturn and non-downturn years, in order of largest positive coefficient
to largest negative coefficient. To interpret, Arkansas has a coefficient of 0.131, which is
statistically significant at the p < .001 level. After adding on the averaged base difference of
0.005, results indicate that Arkansas allocated 13.6 percentage points more of its share of higher

FUNDING STUDENT AID DURING DOWNTURNS 27
education funding to student aid during downturns. In all, eight states showed significant positive
coefficients for downturn years, implying that their long-term trajectory received a meaningful
boost in the direction of an increased student aid share during downturns. The states with
significant positive coefficients include Georgia, Indiana, and Pennsylvania, all which, in the
majority of years, had a relatively high commitment to student aid, measured as aid dollars per
student distributed above the 75th percentile of all states. These three states, along with Arkansas,
Kentucky, New Mexico, Tennessee, and West Virginia, all distribute relatively high levels of
grant aid per state population (NASSGAP, 2013), suggestive of a favorable construction of
students and their needs. Thus, at least some states that emphasize student aid in their higher
education spending seem to be particularly prone to protecting it in difficult economic times.
The majority of states did not treat student aid share differently between downturn and
non-downturn periods. Yet, there were no states with significant negative coefficients for their
downturn periods. The nine states whose proportion of funding for student aid was lower (but not
statistically significantly so) in downturn periods versus other periods include states with low
commitment to aid, specifically Hawaii, Montana, Nebraska, New Hampshire, North Dakota,
and Wyoming. Additionally, Hawaii, Montana, and Nebraska are ranked near the bottom for
grant aid funding per population (NASSGAP, 2013), suggesting a less favorable construction of
students and their needs. An exception was Texas, which was at the median level in terms of aid
dollars per student and among the more generous in terms of total grant dollars per capita.
Correlates of State Policy Priority Classifications
Finally, to address our fourth and last research question, we examined whether certain
higher education structural, political, economic, and geographic variables were associated with
states’ policy priority classifications. Since our primary interest was in the determinants of

FUNDING STUDENT AID DURING DOWNTURNS 28
student aid priority and relatively few states fell into the budgetary equity category, we combined
the budgetary equity and institutional support categories to create a dichotomous variable, which
also served to better balance the number of states in each category. That is, states were coded as
either prioritizing student aid or not in each downturn they experienced. Next, we describe the
independent variables in our analysis (definitions listed in Table 4) and our hypotheses.
[Insert Table 4]
Variable Definitions and Hypotheses
The value of each independent variable analyzed (change variables excepted) was its
value during the year before each downturn began (the baseline year), in order to capture the
state-level influences at work just before the onset of a downturn. These variables consisted of
state commitment to student aid, level of public higher education tuition, the proportion of
undergraduate students enrolled in private institutions, higher education governance structure,
the presence of a substantial merit-based aid program, per capita income, the state’s
unemployment rate, its Gini coefficient (a measure of income inequality), political party control,
and region of the country. To illustrate, for a downturn that started in 2001, we used the value of
tuition in 2000. In the case of the change variables (per capita income change, unemployment
rate change, public tuition change), we calculated the percentage change across the entire
downturn period in order to capture how simultaneous changes in such variables related to the
prioritization of student aid.
State commitment to student aid. As mentioned, states vary widely in the share of their
higher education funding directed to student aid programs (NASSGAP, 2013). We expect that
states showing stronger commitment to student aid, as measured by state student aid spending
per fall enrollment, would, all else held constant, be more likely to treat aid funding relatively

FUNDING STUDENT AID DURING DOWNTURNS 29
favorably in times of fiscal stress in higher education since a larger overall aid commitment
signals a more favorable construction of students and their needs. This variable was compiled
from the National Association of State Student Grant and Aid Programs (NASSGAP).
Public tuition level. We hypothesize that states charging higher tuition would be more
inclined to prioritize student aid during downturns, as they would be well aware of the impact of
higher tuition on affordability. Data was collected from the Integrated Postsecondary Education
Data System (IPEDS) and represents the average undergraduate tuition price charged to state
residents by public institutions in each state in the baseline year.
Change in public tuition. For many reasons, all states will not see the same increases in
tuition in their public colleges and universities in response to fiscal stringency. Since the rate of
tuition growth could quite plausibly affect budget allocations to student aid, we accounted for the
percentage change in a state’s average resident, undergraduate tuition level across the entire
downturn. We expect that states experiencing greater tuition growth during downturns would
tend to treat student aid more favorably in order to mitigate effects on students. To generate more
interpretable coefficients, we multiplied this and all of the percentage change variables by 100
(i.e., a range of 0 to 100 instead of 0 to 1).
Private sector share of enrollment. The larger the private, non-profit sector’s share of
all state higher education enrollments, the more favorably we expect to see student aid treated in
downturns, since the unsubsidized private sector’s higher tuition structure implies more
dependence upon student aid for its competitiveness (Zumeta, 1996), and larger private sectors
are more influential in state policymaking (Zumeta, 1992). Private sector enrollment share was
calculated from IPEDS institutional enrollment data, and multiplied by 100 for more
interpretable coefficients.

FUNDING STUDENT AID DURING DOWNTURNS 30
State higher education governance structure. For the purposes of this study, states
were divided into two broad categories of state-level higher education governance arrangements
as is fairly standard in the literature: 1) centralized governing board, and 2) coordinating or
planning board (Education Commission of the States, 2007; Smith & Fulton, 2013).
Coordinating board states have missions that encompass a broader constituency, including
private institutions that typically depend substantially on student aid dollars, so we expect these
states to be more supportive of student aid when times are difficult (Zumeta, 1992).7 By contrast,
centralized governing boards are concerned primarily with the health of the public institutions
they oversee, so we would expect to see greater emphasis on sustaining public institutional
funding in these states. State governance structure information was obtained from state profiles
and published reports by the Education Commission of the States. Coordinating and planning
board states were coded 0 and governing board states were coded 1.
Emphasis on need-based vs. merit-based aid. As suggested earlier, state student aid
programs that select students primarily on the basis of academic performance criteria comprise a
substantial share of total student aid in a number of states, and for many years these types of aid
grew at a faster rate nationally than need-based aid (NASSGAP, 2013). We expect that states
emphasizing need-based aid would fund their aid programs relatively better through a downturn
since the need emphasis more closely aligns with favorable construction of students and the
policy objective of helping them afford tuition increases. Yet, this policy impetus may be offset
by the political appeal to legislators of protecting merit-based aid to hard-pressed middle-class
families and by the fact that most of this aid comes from non-general-fund sources that may be
more protected from general downturns, so the direction of the relationship is uncertain. We

FUNDING STUDENT AID DURING DOWNTURNS 31
identified merit aid states as those defined by Doyle (2010b) to have “broad-based merit aid
programs” in a given state-year. These state-years were coded 1, and others were coded 0.
State personal income per capita. We expect that states with higher per capita income
at the outset of a downturn might be in a better position to protect student aid during it. We
obtained data on this variable from the U.S. Bureau of Economic Analysis. State personal
income per capita data were CPI-adjusted to 2013 dollars.
Change in personal income per capita. This variable was measured as the percentage
change in the income measure across the entire downturn, that is, from the baseline year before a
downturn started to the last year of the downturn. The idea was to capture state differences in
growth of this basic indicator of state prosperity. As with the underlying state personal income
variable, we expect that stronger income growth might facilitate support for student aid.
Gini coefficient. The Gini coefficient measures the level of state income inequality.
Previous research on higher education spending suggests that, holding other factors constant,
greater income inequality is associated with a lower likelihood of states drastically cutting higher
education appropriations (Li, 2017). To the extent that a state has high levels of inequality,
consistent with Li’s finding and the notion of positive construction of students and their needs,
we hypothesize that the state may be more likely to exert efforts to remedy this inequality by
protecting student aid funding during downturn periods to provide lower-income students the
means to afford college. The Gini coefficient ranges from 0 to 1, where 0 represents perfect
equality and 1 represents perfect inequality. We obtained data on the Gini coefficient from the
Bureau of Economic Analysis.
Unemployment rate. Previous research has shown that higher unemployment and more
rapid increases in state unemployment rates are associated with the onset of major cuts to higher
FUNDING STUDENT AID DURING DOWNTURNS 32
education appropriations (Li, 2017). A higher unemployment rate is an indicator of greater state
economic distress, so we expect that, ceteris paribus, during a downturn in state support for
higher education, higher state unemployment might be correlated with less favorable relative
treatment of student aid. Greater economic distress implies deeper overall budget cuts, which
may mean cutting closer to the “institutional core” of higher education budgets. In such
circumstances, policymakers may be more likely to feel that they must mitigate budget
reductions to institutions as best they can. Annual state unemployment rates were compiled from
the Bureau of Labor Statistics.
Change in unemployment rate. This variable was calculated as the percentage change
in the state’s unemployment rate across the entire downturn. Consistent with our expectations
regarding the previous variable, we anticipate that more rapid growth in unemployment, another
indicator of extent of economic distress, might be associated with less favorable treatment of
student aid.
Political control. Partisan control has been found to influence a state’s commitment to
funding higher education, as basic philosophical differences exist between political parties with
regard to subsidization, taxation, and market mechanisms (Li, 2017; McLendon, Hearn, &
Mokher, 2009; Tandberg, 2013). We predict that Republican-controlled states would be more
likely to sustain funding for student aid programs in times of budgetary stress, at least compared
to public institutional funding. The student-centered model of resource allocation implied by
portable student aid is more consistent with other market-based policy approaches that
Republican ideology tends to favor. In Democrat-dominated states, we theorize that
appropriations changes during periods of fiscal stress on higher education would be more likely
to favor public institutional appropriations, as this is more consistent with the Democratic Party’s

FUNDING STUDENT AID DURING DOWNTURNS 33
philosophy of supporting public policy goals primarily through public sector institutions. We
expect politically divided states to fall between these two strategies and so did not have strong
prior expectations about their prioritization of student aid.
We created a collapsed ordinal variable representing political control using: 1) party
affiliation of the state’s governor; 2) party majority in the Senate; and 3) party majority in the
House in each state-year. This variable has four categories: 1) Strong Republican government in
which all three power centers were controlled by Republicans (coded 0); 2) moderate Republican
government in which two of the three power centers were controlled by Republicans (coded 1);
3) moderate Democratic government in which two of the three centers of power were controlled
by Democrats (coded 2), and finally; 4) strong Democratic government with all three power
centers controlled by Democrats (coded 3).8 Data for this variable was collected from the
National Governors Association and the Census Bureau.
Regional compact membership. Since regional differences in state higher education
policies are often considerable, we accounted for these by utilizing states’ membership in
regional higher education compact organizations. There are four regional higher education
compacts, which are designed to provide a forum for sharing policy ideas and in some cases to
coordinate regional policies. All but three states belong to a compact; the exceptions are New
York, New Jersey, and Pennsylvania. These three states were included with their near neighbors,
the New England Higher Education Compact states, for purposes of constructing this variable.
The other three compacts are the Southern Regional Education Board, the Midwestern Higher
Education Commission, and the Western Interstate Commission for Higher Education.9
Variable definitions are shown in Table 4 and summary statistics for the variables are
shown in Table 5.

FUNDING STUDENT AID DURING DOWNTURNS 34
[Insert Tables 4 and 5]
State Characteristics and Student Aid Prioritization during Downturns
We conducted a logistic regression analysis to estimate the relationship between states’
prioritization of aid during downturns in higher education support and the state-level
postsecondary education, political, and economic variables described:
Yit = α +Xit β + εi (2)
where Yit is a dichotomous variable representing whether a state prioritizes student aid versus not
during its downturn period(s) starting in year t, Xit is a vector of independent variables for the ith
state in year t (t-1 for level variables and across the entire downturn for change variables), and β
is a vector of estimated parameters (Long, 1997). We used robust standard errors to account for
the effect of some states appearing multiple times in the analysis.10
Estimates are reported in Table 6. We conducted analyses using a stepwise modeling
approach (Tabachnick & Fidell, 2013), first analyzing the block of higher education variables
only (column 1); then adding the economic variables (column 2); next adding the political
variables (column 3); and finally adding the region variables (column 4). Columns 1-3 show
exploratory models designed to allow us to better understand the contributions of these specific
categories of variables. The full model in column 4 is our preferred model because it includes all
of the variables and shows the best model fit as indicated by the smallest negative value for the
log pseudo-likelihood statistic.
As seen in Table 6, most of the coefficients vary little across the models and signs are
almost uniformly the same. Although we were somewhat worried about degrees of freedom with
many variables and only 109 downturns to work with, it seems clear that the full model (column

FUNDING STUDENT AID DURING DOWNTURNS 35
4) not only covers the most ground conceptually but performs best statistically as well. Hence,
we focus on its results in our interpretation below.
[Insert Table 6]
State commitment to aid. All the models analyzed except the one excluding regions (in
which the coefficient has similar magnitude as in the other models but falls short of significance)
indicate that high levels of commitment to aid, captured by the dollar amount of state spending
on financial aid per student, was significantly associated with a greater likelihood of prioritizing
student aid during downturn periods. Thus, in states where the initial level of spending on
student aid was higher, there exists a preference for prioritizing student aid spending over direct
appropriations to public institutions during periods in which total higher education
appropriations decreased 5% or more across two consecutive years of declines. According to
estimates from the full model, every 10% increase in a state’s initial aid expenditures per student,
equivalent to $29.50 based on a mean of $295, was associated with a 6% increase in the
likelihood of its prioritizing student aid funding during a downturn [1.10 ß = 0.62 = 1.06]. This
result is consistent with our earlier finding that states with relatively large underlying
commitments to student aid are generally more likely to increase the share of their support going
to aid (relative to institutions) during downturn periods. It suggests that, in these types of states,
students have been positively constructed by policymakers in a way that is embedded in state
policies or policy cultures and that makes it more likely efforts will be made to mitigate the
effects of hard times on students.11
Unemployment rate. Results also suggest that, as expected, a higher state
unemployment rate in the year before a downturn began significantly decreased the odds of a
state prioritizing student aid during the downturn. A one-percentage point increase in the

FUNDING STUDENT AID DURING DOWNTURNS 36
unemployment rate was associated with a 36% decrease in the likelihood of favoring student aid,
based on estimates in Table 6, column 4. (This was calculated by exponentiating the log odds
and subtracting from 1.) The state unemployment rate variable ranges from 2.6% to 13.2% over
our years of analysis, with a mean value of 5.8%. Thus, a one-percentage point increase is fairly
substantial. A higher unemployment rate, indicative of a weaker state economy, seems to make it
harder for a state to prioritize student aid relative to basic support for public institutional
operations. This is consistent with our hypothesis that states in a weaker economic position may
feel that cuts to institutions reach uncomfortably close to their core operations and so have to be
alleviated to the extent possible.
Other state characteristics. None of the other independent variables were significantly
associated with whether or not a state prioritized student aid during downturns in higher
education support. We were surprised to find no evidence of a relationship between the
magnitude of public institution tuition increases (percentage change in tuition) over the downturn
period and student aid prioritization. One possibility is that the locus of tuition setting authority
differs across states in ways that blur the link between the magnitude of tuition increases and
decisions about student aid. In some states, the legislature or governing/coordinating board
determines tuition levels across all public colleges in the state, in a sector, or in a system. In
other states, the higher education board guides tuition levels and imposes limits to increases,
while other states place tuition-setting authority fully in the hands of colleges (Kim & Ko, 2015).
Therefore, it may be difficult to calibrate state student aid funding to institutional decisions about
tuition, especially when the timing of the respective decisions are not necessarily coordinated.
States with a coordinating or planning agency for all of higher education, as distinct from
a consolidated governing board responsible only for public institutions, were expected to be

FUNDING STUDENT AID DURING DOWNTURNS 37
more prone to prioritize student aid in a downturn due to presumed greater responsiveness to
private higher education’s needs, but this did not appear to be the case. State governance
arrangements evidently operate on a largely separate track from state student aid decision-
making. Perhaps this is not surprising since state student aid agencies are often separate from
governing agencies.
Results also indicate that the share of enrollment in private nonprofit institutions in a state
did not make any discernible difference, nor were significant differences found between states
with substantial merit-based aid programs and other states in the tendency to prioritize student
aid during downturns. This was somewhat surprising since merit aid programs usually have their
own funding sources (notably from state lotteries). On the other hand, lottery revenues are also
subject to the effects of economic downturns, even if less strongly so than general tax revenues.
Moreover, the partisan political control pattern of a state at the outset of a downturn was
not associated with its prioritization of student aid.12 Still, the positive direction of the
coefficients in the full model and their magnitude relative to their standard errors suggests that,
compared to the omitted category of uniformly Republican states (where Republicans control all
three power centers), moderately Republican, moderately Democratic, and strong Democratic
states may be somewhat more likely to prioritize student aid. This would be contrary to our party
philosophy-grounded hypothesis but would not be altogether surprising in that less strictly
conservatively governed states may be more sympathetic to (may more favorably construct)
needy students. Finally, the regional compact variables were not meaningfully associated with
the prioritization of student aid during downturns in higher education appropriations.
Summary and Discussion of Implications

FUNDING STUDENT AID DURING DOWNTURNS 38
In this study, we sought to better understand the fiscal dynamics of state student aid
programs during troubled fiscal periods (downturns) when state support of higher education
declines substantially (specifically by 5% or more in inflation-adjusted terms over at least two
years). We studied a 34-year period spanning 1980 through 2013 that included four major
national recessions and associated fiscal travails for higher education, while capturing variation
across states. The motivation for this study was that it is precisely during such downturn periods
that tuition rates at public institutions tend to spike and students typically have greater financial
needs in order to sustain their ability to enroll. So, we should seek to understand to what extent
states prioritize student financial aid when times are tough in higher education. Conceptually, we
framed the study in terms of social construction theory (Schneider et al, 2014), whereby in this
case undergraduate students may be more or less favorably constructed in a state’s policy culture
around higher education, relative to public colleges and universities themselves.
We summarize our results briefly before suggesting some implications. First, our analysis
across all states over the years 1980 to 2013 suggests that the general upward trend over time in
student aid’s share of state appropriations to higher education tended to be strengthened during
downturns. Individual states that exhibited this tendency to protect aid more strongly in
downturns were generally those with proportionately larger commitments to aid and that
distributed larger grant aid funding per capita. This implies that students are, in social
construction theory terms, favorably constructed in such states and aid to them is a significant
part of the state’s affordability strategy. Unsurprisingly, the states that did not significantly
change their trajectories in regard to student aid share during downturns included mainly states
with relatively low aid effort in the first place, suggesting less favorable construction of students
and their affordability needs. In sum, it makes sense that states with a strong, embedded

FUNDING STUDENT AID DURING DOWNTURNS 39
commitment to aid, with associated expectations and institutional pressures built on top of more
favorable construction of students, would be more prone than those lacking such a commitment
to try to sustain it to the extent possible when students need help the most.
Across the 109 downturns that met our rather strict criteria for a significant retrenchment
period in higher education support, in fully 82 (75%) of the cases states prioritized student aid
over institutional support in their allocations of available funds (which generally meant that
institutions experienced greater funding cuts than student aid programs). Institutional support
was prioritized over student aid in 19 (17%) of the state-downturn periods while in only 8 cases
(7%) were these two budgetary components prioritized relatively equally. The pattern favoring
prioritization of aid was weaker in the 1980s downturns (50% of cases) but was clear and quite
consistent across the more recent downturn sub-periods (1990s, early 2000s, late 2000s-2010s),
with around 80% of states prioritizing student aid in each. This increased focus on aid
prioritization in more recent decades may reflect some policymaker appreciation of the effects on
affordability of the long upward march in real tuition charges that began in the early 1980s.
Moreover, states showed considerable consistency as to which of the above categories they fell
in across successive downturns, most often consistently prioritizing student aid. This consistency
suggests that states often do establish “policy cultural” norms about topics such as the priority of
student aid.
A logistic regression analysis of states’ prioritization of student aid during downturns in
higher education support on a variety of postsecondary education, economic, and political
variables revealed that a higher level of state aid spending per student and a lower state
unemployment rate during the year before the onset of a downturn were both significantly
associated with a greater likelihood of prioritizing student aid during the downturn. On the other

FUNDING STUDENT AID DURING DOWNTURNS 40
hand, a state’s level of public sector tuition at the onset of a downturn, percent changes in tuition
during a downturn, enrollment share in private higher education institutions, state governance
structure for higher education, existence of a broad-based merit aid program, income per capita
and percentage changes in income, income inequality as measured by the Gini coefficient,
percentage change in unemployment rate over the downturn, political control, and regional
compact membership were not found to be significantly associated with its prioritization of aid
during downturns.
Researchers may want to further understand why student aid’s priority in state higher
education budgets has increased over time, and particularly during downturns for select states, by
qualitatively examining the nature of state budgetary deliberations during downturn periods to
the extent these can be documented. It is important to investigate whether a shift toward student
aid in state allocations is due to explicit policy philosophies (e.g., “voucherization” of higher
education finance) versus the relative political appeal of student aid compared to institutional
support in hard times (the logic behind which is suggested by our social construction theory
framework).
The evidence found here suggests that political philosophy, i.e., explicit voucherization,
is not the dominant factor. Rather, a state’s shift towards aid prioritization over time seems more
likely to be a logical response to the long upward movement in public university tuition as it has
become a major source of institutional financing. For states that feel that they cannot afford to
spend as heavily as in the past on higher education, and who thus allow real tuition to creep up
over time, supporting student aid is a relatively inexpensive way to provide a semblance of
affordability for some students, a group that is likely to be positively constructed in most states.
The statistical analysis shows that the small number of states that do not prioritize student aid

FUNDING STUDENT AID DURING DOWNTURNS 41
during downturns tend to be states without a large historic policy commitment to student aid,
which may suggest less favorable construction of students as a group in these states. Also, the
analysis shows that states with less favorable economic conditions at the outset of a downturn, as
measured by state unemployment rate, are less likely to prioritize student aid during it, perhaps
because they felt their public colleges and universities were already stretched thin.
We expected that structural factors in state budgeting for student aid (e.g. nontax funding
from lotteries and quasi-entitlements of individuals to student aid according to a formula such as
in Georgia’s HOPE scholarship and others like it) might play a significant role in aid’s resilience
during downturns in general higher education support. The lack of an apparent link between a
state’s merit aid emphasis and its priority on student aid suggests that the most obvious of such
factors do not seem to play a significant role. Similarly, no links were found between student
aid’s resilience in downturn periods and such structural factors as the relative share of private
sector enrollments in a state or its form of statewide governance. Looking ahead, the more we
can learn about why state student aid programs are relatively resilient, the better policies can be
designed to pursue aid-related policy goals by building on such features. Clearly, additional
research will be needed to establish which additional factors are associated with resilience in
state support for student aid.
A puzzle worthy of research attention is why the wide differences across states in
commitment to student aid are so persistent. We have seen that student aid is generally more
resilient budgetarily in hard times than other forms of higher education support and that states
with stronger aid commitments show at least some tendency to prioritize it when cuts in higher
education need to be made. Yet, there is more to be learned about how states get “over the
hump” to the point of such a strong commitment and the apparent associated relative budgetary
FUNDING STUDENT AID DURING DOWNTURNS 42
resilience. Social construction theory as it applies to the framing of undergraduates and their
needs may be helpful here in discerning factors affecting this tipping point.
Additionally, since state student aid programs are likely to continue to play an important
role in many states, policymakers should consider ways to more tightly link aid receipt and
continuation to timely student academic progress so as to further the emerging degree
completion agenda in state policies. One possibility is to provide an aid bonus for full time
students to take more credits per term, which is known to be a factor that increases student
completion chances (Belfield, Jenkins & Lahr, 2016). Another idea is to ensure that aid
continues to be tenable at reputable private institutions and that grant sizes at least keep up with
inflation, so that states continue to reap the benefit of appropriate private sector capacity at low
taxpayer cost (Zumeta, 1996; Zumeta & Huntington-Klein, 2015). Finally, states could consider
modest matching grants to public and perhaps private institutions that are willing to invest some
of their own funds to further develop proven or promising degree completion support programs
for aided students. We know that aided students are in many cases more likely than others to
need such extra support to complete their degrees. In sum, state student aid programs are
important for achieving historic and emerging policy goals and policy analysts should seek to
make the most of them while taking advantage of their relative cyclical resilience.
Notes
1 The National Bureau of Economic Research acts as the official arbiter of U.S. recession
periods. The recession periods of interest in this study are: January – July 1980 and July 1981 –
November 1982; July 1990 – March 1991; March 2001 – November 2001; and December 2007
to June 2009 (http://www.nber.org/cycles.html). The two recession periods of the early 1980s are
often viewed as one long recession and are considered so here. Here, we focus on periods of
downturn in state support of higher education that typically start during an official recession but
last for several years after the recession ends.
2 Colorado is a unique case of explicit voucherization in the funding of higher education. In
2004, the state introduced the College Opportunity Fund (COF), which provided stipends paid
FUNDING STUDENT AID DURING DOWNTURNS 43
directly to public (and eligible private) institutions on behalf of eligible, resident students
according to credit hours enrolled at an institution of the student’s choosing. Funds came from
allocations that would otherwise be considered direct state appropriations (Colorado Department
of Higher Education, 2011) and, according to SHEEO, funds for the COF were counted as state
appropriations in the reported data.
3 We explored using both 1% and 3% real declines across two years as alternative ways to define
downturns. These less stringent cutoff points generated only a few more downturn periods and
few differences in our results. We propose that the 5% cutoff better captures the idea of a
significant, non-temporary cut in higher education support that is likely to generate the budgetary
allocation behaviors about which we hypothesize.
4 These patterns persist when aid amounts are normalized for state population or student
enrollments.
5 For example, in one variant if the percentage change in student aid support over a downturn
period was less than 2.5 percentage points different from the percentage change in all other
appropriations, the state was placed in the budgetary equity category and consequently fewer
cases would fall in the other two categories. This 2.5 percentage point difference threshold for
the categories resulted in 85 classifications of student aid priority (compared to 82 in the base
case) among the 109 downturns. An analogous 7.5 percentage point difference threshold resulted
in 80 state downturns with a student aid priority classification. Therefore, we concluded that our
5-percentage point difference-in-allocations threshold definition was reasonable for our purposes
and not unduly sensitive to alternative specifications.
6 For purposes of presentation we identified the four most common downturn periods with
decades as follows: 1980s, 1990s, 2000s, and 2010s. The 2000s period corresponds generally to
the “dotcom” recession of the early 2000s and the period identified as 2010s corresponds to the
Great Recession and its aftermath that began around 2008 and continued in many states until the
end of our data in 2013. (A state downturn starting in 2008 or 2009 was associated with the
Great Recession period and grouped in the 2010s decade.) In the few cases where a state
experienced a downturn in higher education support during a period different from the national
recession pattern, we placed it in the nearest decadal period for purposes of our discussion.
7 This variable (coordinating vs. governing board) and the previous one, private enrollment
share, were not significantly correlated, so we retained both in the multivariate model.
8 Nebraska, which has a unicameral legislature, had just one downturn and was coded as 0 to
represent a strongly Republican government since that party controlled the legislature and the
governorship at the onset of this downturn period.
9 We thus classified states into regions as follows: New England/Mid-Atlantic: CT, ME, MA,
NH, RI, VT, PA, NY, NJ; Southern: AL, AR, DE, FL, GA, KY, LA, MD, MS, NC, OK, SC, TN,
TX, VA, WV; Midwestern: IL, IN, IA, KS, MI, MN, MO, NE, ND, OH, SD, WI; Western: AK,
AZ, CA, CO, HI, ID, MT, NV, NM, OR, UT, WA, WY.

FUNDING STUDENT AID DURING DOWNTURNS 44
10 As an alternative analytic approach, we utilized the full dataset of 1700 state-years instead of
the 109-downturn periods. In this alternative analysis, we included a dummy variable indicating
whether a state was in a downturn in each year. We created interactions between this indicator
for downturns and all the independent variables of interest and conducted a logistic regression
analysis identical to the reported model with the same independent variables. By adding
interaction variables, we intended to net out pre-existing state differences and differential
prioritization of state aid in downturn versus non-downturn years. However, the addition of
independent variables created by interactions with the downturn variable caused so much
collinearity in the models that they did not converge, rendering this approach unfeasible.
11 As an alternative analysis, we removed all of the level variables (tuition, per capita income,
unemployment rate at outset of downturn) and analyzed a model incorporating only the
corresponding change variables over the downturns (percent change in tuition, percent change in
income, percent change in unemployment rate). Results from this model also indicate that
commitment to aid was positively associated with student aid prioritization and the coefficient
was of similar magnitude (log odds = 0.57, p < .05).
12 We also ran models using alternative definitions of the political control variables. One variant
placed each state-year into one of three categories of political control: unified Democratic,
unified Republican, and divided government across the governorship, House, and Senate. Results
were substantively similar to those in Table 6. We also ran the two models shown in the table
using a strong Republican government compared to all other mixes of political control
(moderately Republican, moderately Democratic, and strongly Democratic, combined), based on
whether all three power centers were controlled by Republicans or not. Results were essentially
the same as in the reported models, which used the four categories of political control.

FUNDING STUDENT AID DURING DOWNTURNS 45
References
Archibald, R. B., & Feldman, D. H. (2006). State higher education spending and the tax revolt.
The Journal of Higher Education, 77(4), 618–644.
Belfield, C., Jenkins, D., & Lahr, H. (2016). Momentum: The academic and economic value of a
15-credit first-semester course load for college students in Tennessee. CCRC Working
Paper No. 88. New York: Community College Research Center, Columbia University.
College Board, The. (2015). Trends in Student Aid. Retrieved from
https://trends.collegeboard.org/student-aid
College Board, The. (2017). Trends in Student Aid. Retrieved from
https://trends.collegeboard.org/student-aid
Colorado Department of Higher Education. (2011). College opportunity fund: Guidelines &
FAQs. Denver, CO: Colorado Department of Higher Education. Retrieved from
https://highered.colorado.gov/finance/cof/COFGuidelines_100111.pdf
Cornwell, C. M., & Mustard, D. B. (2005). Student responses to merit scholarship retention
rules. The Journal of Human Resources, 40(4), 895–917.
Cornwell, C., Mustard, D. B., & Sridhar, D. J. (2006). The enrollment effects of merit-based
financial aid: Evidence from Georgia’s HOPE program. Journal of Labor Economics, 24(4),
761–786.
Delaney, J. A., & Doyle, W. R. (2011). State spending on higher education: Testing the balance
wheel over time. Journal of Education Finance, 36(4), 343–368.
Doyle, W. R. (2006). Adoption of merit-based student grant programs: An event history analysis.
Educational Evaluation and Policy Analysis, 28(3), 259–285.

FUNDING STUDENT AID DURING DOWNTURNS 46
Doyle, W. R. (2010a). Changes in institutional aid, 1992–2003: The evolving role of merit aid.
Research in Higher Education, 51(8), 789–810.
Doyle, W. R. (2010b). Does merit-based aid “crowd out” need-based aid? Research in Higher
Education, 51(5), 397–415.
Education Commission of the States. (2007). 50-state comparison: Postsecondary governance
structures. Retrieved from https://www.ecs.org/postsecondary-governance-structures/
Gates Foundation (n.d.) Postsecondary success strategy overview. Retrieved from
http://www.gatesfoundation.org/What-We-Do/US-Program/Postsecondary-Success
Heller, D. E. (2004). The changing nature of financial aid. Academe, 90(4), 36–38.
Kim, M. M., & Ko, J. (2015). The impacts of state control policies on college tuition increase.
Educational Policy, 29(5), 815–838. http://doi.org/10.1177/0895904813518100
Li, A. Y. (2017). Dramatic declines in higher education appropriations: State conditions for
budget punctuations. Research in Higher Education, 58(4), 395–429.
http://doi.org/10.1007%2Fs11162-016-9432-0
Long, J. S. (1997). Regression models for categorical and limited dependent variables.
Thousand Oaks, CA: Sage Publications.
Lumina Foundation (2013). Strategic Plan 2013-2016. Retrieved from
https://www.luminafoundation.org/files/file/2013-lumina-strategic-plan.pdf
McLendon, M. K., Hearn, J. C., & Mokher, C. G. (2009). Partisans, professionals and
power: The role of political factors in state higher education funding. The Journal of Higher
Education 80(6), 686-713.
Monks, J. (2009). The impact of merit-based financial aid on college enrollment: A field
experiment. Economics of Education Review, 28(1), 99–106.

FUNDING STUDENT AID DURING DOWNTURNS 47
NASSGAP. (1988). 19th annual survey report on state-sponsored student financial aid. National
Association of State Student Grant and Aid Programs. Retrieved from
http://www.nassgap.org/index.aspx
NASSGAP. (2000). 31st annual survey report on state-sponsored student financial aid. National
Association of State Student Grant and Aid Programs. Retrieved from
http://www.nassgap.org/index.aspx
NASSGAP. (2013). 44th annual survey report on state-sponsored student financial aid. National
Association of State Student Grant and Aid Programs. Retrieved from
http://www.nassgap.org/index.aspx
NASSGAP. (2015). 46th annual survey report on state-sponsored student financial aid. National
Association of State Student Grant and Aid Programs. Retrieved from
http://www.nassgap.org/index.aspx
NASSGAP. (2016). 47th annual survey report on state-sponsored student financial aid. National
Association of State Student Grant and Aid Programs. Retrieved from
http://www.nassgap.org/index.aspx
National Bureau of Economic Research. (n.d.). U.S. business cycle expansions and contractions.
Retrieved from http://www.nber.org/cycles.html
Rubin, I. S. (1997). The politics of public budgeting: Getting and spending, borrowing
and balancing, 3rd edition. Chatham, NJ: Chatham House.
Schneider, A., & Ingram, H. (1993). Social construction of target populations: Implications for
politics and policy. American Political Science Review, 87(2), 334–347.

FUNDING STUDENT AID DURING DOWNTURNS 48
Schneider, A. L., Ingram, H., & DeLeon, P. (2014). Democratic policy design: Social
construction of target populations. In P. A. Sabatier & C. M. Weible (Eds.), Theories of the
policy process (3rd ed., pp. 105–149). Boulder, CO: Westview Press.
Smith, M., & Fulton, M. (2013). Recent changes to postsecondary governance in states: 2011-
13. Education Commission of the States. Denver, CO. Retrived from
https://www.ecs.org/recent-changes-to-postsecondary-governance-in-states-2011-13/
Snijders, T. A. B., & Bosker, R. J. (2012). Multilevel analysis (2nd edition). Thousand Oaks,
CA: Sage Publications.
State Higher Education Executive Officers Association. (2017). State higher education finance:
FY 2016. Boulder, CO: SHEEO. Retrieved from http://www.sheeo.org/projects/shef-—-
state-higher-education-finance
Tandberg, D. A. (2013). The conditioning role of state higher education governance
structures. The Journal of Higher Education 84(4), 506-543.
Tandberg, D.A. (2010). Interest groups and governmental institutions: The politics of
state funding of public higher education. Educational Policy 24(5), 735-778.
Tennessee Higher Education Commission. (2012). A comparison of states’ lottery scholarship
programs. Nashville, TN: Author. Retrieved from
https://thec.ppr.tn.gov/THECSIS/Lottery/pdfs/SpecialReports/A Comparison of States%27
Lottery Scholarship Programs 120717.pdf
Wildavsky, A. B. (1984). The politics of the budgetary process (rev. 4th edition). Boston,
MA: Little, Brown.
Zhang, L., & Ness, E. C. (2010). Does state merit-based aid stem brain drain? Educational
Evaluation and Policy Analysis, 32(2), 143–165.

FUNDING STUDENT AID DURING DOWNTURNS 49
Zumeta, W. (1992). State policies and private higher education: Policies, correlates, and
linkages. The Journal of Higher Education 63(4), 363-417.
Zumeta, W. (1996). Meeting the demand for higher education without breaking the bank:
A framework for the design of state higher education policies for an era of increasing
demand. The Journal of Higher Education 67(4), 367-425.
Zumeta, W. (2009). State support of higher education: The roller coaster plunges downward yet
again. The NEA 2009 Almanac of Higher Education (pp. 29-43). Washington, DC: National
Education Association.
Zumeta, W. (2014). State funding of higher education: Back on track or a new, diminished
normal? The NEA 2014 Almanac of Higher Education (pp. 43-52). Washington, DC:
National Education Association.
Zumeta, W. (2017). Whither higher education in the Trump era? The NEA 2017 Almanac of
Higher Education (pp. 23-34). Washington, DC: National Education Association.
Zumeta, W., Breneman, D. B., Callan, P. M., & Finney, J. E. (2012). Financing American higher
education in the era of globalization. Cambridge, MA: Harvard Education Press.
Zumeta, W., and Huntington-Klein, N. (2015). The cost-effectiveness of undergraduate
education at private nondoctoral colleges and universities: Implications for students and
public policy. Washington, DC: Council of Independent Colleges.
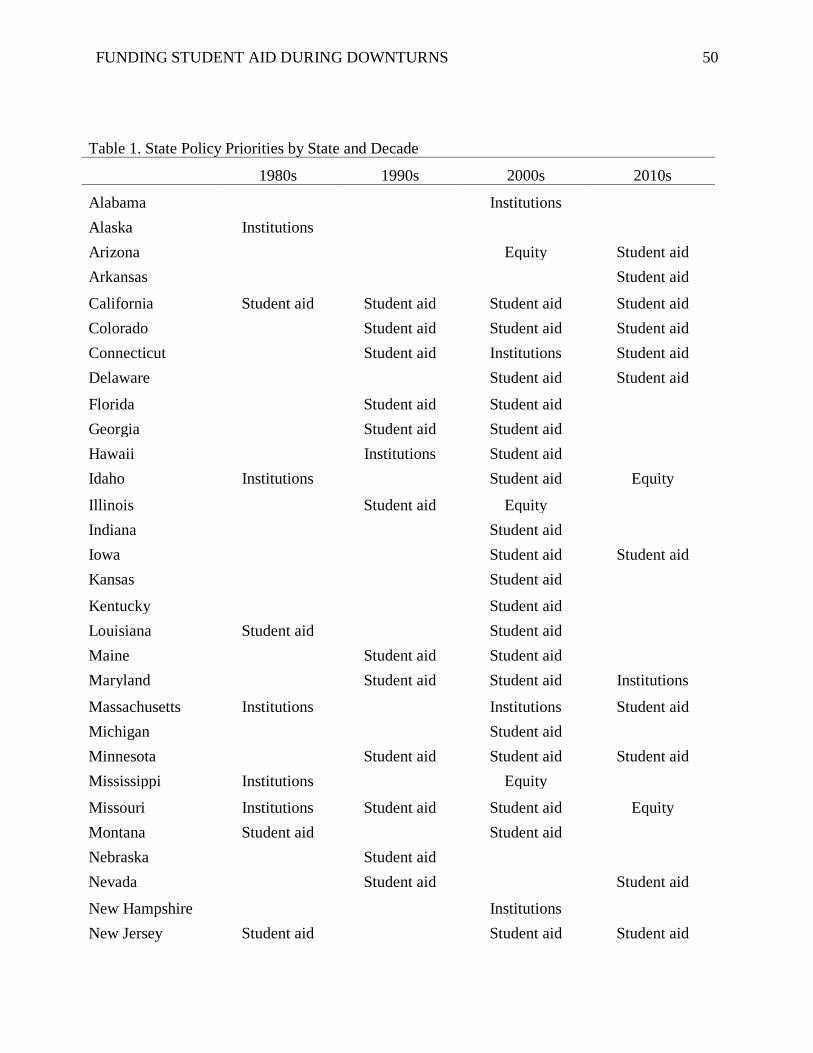
FUNDING STUDENT AID DURING DOWNTURNS 50
Table 1. State Policy Priorities by State and Decade
1980s 1990s 2000s 2010s
Alabama Institutions
Alaska Institutions
Arizona Equity Student aid
Arkansas Student aid
California Student aid Student aid Student aid Student aid
Colorado Student aid Student aid Student aid
Connecticut Student aid Institutions Student aid
Delaware Student aid Student aid
Florida Student aid Student aid
Georgia Student aid Student aid
Hawaii Institutions Student aid
Idaho Institutions Student aid Equity
Illinois Student aid Equity
Indiana Student aid
Iowa Student aid Student aid
Kansas Student aid
Kentucky Student aid
Louisiana Student aid Student aid
Maine Student aid Student aid
Maryland Student aid Student aid Institutions
Massachusetts Institutions Institutions Student aid
Michigan Student aid
Minnesota Student aid Student aid Student aid
Mississippi Institutions Equity
Missouri Institutions Student aid Student aid Equity
Montana Student aid Student aid
Nebraska Student aid
Nevada Student aid Student aid
New Hampshire Institutions
New Jersey Student aid Student aid Student aid

FUNDING STUDENT AID DURING DOWNTURNS 51
New Mexico Student aid Student aid Student aid
New York Student aid Student aid Student aid
North Carolina Student aid Student aid
North Dakota Student aid Institutions Student aid
Ohio Student aid Student aid Student aid Institutions
Oklahoma Student aid Student aid Student aid Student aid
Oregon Student aid Student aid
Pennsylvania Student aid
Rhode Island Institutions Student aid
South Carolina Institutions Equity Institutions
South Dakota Student aid Student aid
Tennessee Equity Student aid
Texas Equity
Utah Student aid
Vermont Student aid Student aid
Virginia Student aid Student aid Student aid
Washington Student aid Student aid Student aid
West Virginia Student aid Student aid
Wisconsin Institutions Student aid
Wyoming Institutions Institutions

FUNDING STUDENT AID DURING DOWNTURNS 52
Table 2. State Policy Priorities by Decade
1980s 1990s 2000s 2010s All Decades
Student aid 10 20 35 17 82
Institutions 8 4 5 2 19
Equity 2 1 3 2 8
Total 20 25 43 21 109
Percent of Total in Policy Priority
1980s 1990s 2000s 2010s All Decades
Student aid 0.50 0.80 0.81 0.81 0.75
Institutions 0.40 0.16 0.12 0.10 0.17
Equity 0.10 0.04 0.07 0.10 0.07

FUNDING STUDENT AID DURING DOWNTURNS 53
Table 3. Association Between Downturn Period and Student Aid Share of All Higher Education
Appropriations:
Percentage Point Change in Student Aid Share
Coefficient SE
Coefficient SE
Downturn Year 0.026 *** (0.002)
Average across all states
Downturn Year 0.005 (0.017)
Average across all states, with inclusion of state-specific estimates
Arkansas 0.131 *** (0.031) Louisiana 0.014 (0.021)
West Virginia 0.124 *** (0.022) Missouri 0.012 (0.021)
Kentucky 0.098 *** (0.024) Oklahoma 0.011 (0.021)
Tennessee 0.091 *** (0.022) California 0.010 (0.021)
Indiana 0.076 ** (0.025) South Dakota 0.008 (0.022)
Pennsylvania 0.066 ** (0.021) Iowa 0.004 (0.022)
Georgia 0.057 * (0.022) Arizona 0.003 (0.022)
New Mexico 0.055 * (0.022) Ohio 0.003 (0.021)
Delaware 0.042 (0.022) Washington 0.003 (0.021)
New Jersey 0.040 (0.021) Idaho 0.002 (0.021)
Oregon 0.037 (0.021) Massachusetts 0.002 (0.021)
Virginia 0.035 (0.021) Connecticut 0.001 (0.021)
Florida 0.034 (0.021) Mississippi 0.001 (0.021)
Maryland 0.034 (0.021) Rhode Island 0.001 (0.021)
New York 0.031 (0.021) Kansas 0.000 (0.021)
Colorado 0.030 (0.021) Hawaii -0.004 (0.021)
North Carolina 0.029 (0.022) Nebraska -0.004 (0.027)
Maine 0.028 (0.021) South Carolina -0.005 (0.021)
Nevada 0.027 (0.024) Alaska -0.009 (0.021)
Minnesota 0.025 (0.021) Montana -0.009 (0.021)
Utah 0.024 (0.024) Wyoming -0.010 (0.021)
Vermont 0.022 (0.021) New Hampshire -0.011 (0.025)
Wisconsin 0.021 (0.021) North Dakota -0.011 (0.021)
Illinois 0.016 (0.021) Texas -0.033 (0.025)
Michigan 0.016 (0.021) Alabama (omitted)
N (state-years) = 1700
Standard errors in parentheses
Student aid share is in units from 0 to 1 (0 to 100 percent)
* p < 0.05, ** p < 0.01, *** p < 0.001

FUNDING STUDENT AID DURING DOWNTURNS 54
Table 4. Descriptions for Independent Variables
Variable Description
Value in year before downturn starts
State commitment to aid Student aid dollars per fall enrollment
Tuition Average resident undergraduate tuition and fees
Private enrollment Percent of enrollment at private institutions
Governing board Higher education governance structure (omitted is planning or
coordinating board)
Emphasis on merit aid Broad-based merit program
Unemployment Unemployment rate
Income Personal income per capita
Gini coefficient Measure of income inequality
Strong Republican 3 chambers of government (governor, house, senate) are
Republican-controlled or Republican-majority (omitted)
Moderate Republican 2 chambers Republican; 1 Democrat
Moderate Democratic 2 chambers Democrat; 1 Republican
Strong Democratic 3 chambers of government are Democrat-controlled or Democrat-
majority
Change across downturn period
Tuition change Percent change
Income change Percent change
Unemployment rate change Percent change
Time-invariant regions
New England / Mid-Atlantic CT, ME, MA, NH, RI, VT, PA, NY, NJ (omitted)
Midwestern IL, IN, IA, KS, MI, MN, MO, NE, ND, OH, SD, WI
Southern AL, AR, DE, FL, GA, KY, LA, MD, MS, NC, OK, SC, TN, TX,
VA, WV
Western AK, AZ, CA, CO, HI, ID, MT, NV, NM, OR, UT, WA, WY

FUNDING STUDENT AID DURING DOWNTURNS 55
Table 5. Summary Statistics for Independent Variables
Variable Mean Std. Dev.
Commitment to aid 295.05 271.04
Commitment to aid (logged) 5.15 1.20
Tuition 2801.94 1782.04
Tuition (logged) 7.69 0.79
Tuition percent change (*100) 53.65 46.60
Percent private enrollment (*100) 20.90 12.40
Governing board (omitted is planning or coordinating) 0.42
Merit aid program 0.16
Income per capita (in 1000s) 38.27 7.66
Income percent change (*100) 6.52 6.50
Unemployment rate (*100) 5.82 1.91
Unemployment rate percent change (*100) 6.98 38.12
Gini coefficient (*100) 57.61 4.46
Strong Republican (omitted) 0.17
Moderate Republican 0.15
Moderate Democratic 0.32
Strong Democratic 0.36
New England compact, and NJ, NY, PA (omitted) 0.45
Southern compact 0.30
Midwestern compact 0.24
Western compact 0.28
N (downturn periods) = 109
For discrete variables, the mean displays the percent of downturns
All financial variables are CPI-adjusted

FUNDING STUDENT AID DURING DOWNTURNS 56
Table 6. State Prioritization of Student Aid during Downturns (Log Odds)
1 2 3 4
HE HE+Econ HE+Econ+Pol Full
Commitment to aid (logged) 0.49* 0.55* 0.53 0.62*
(0.24) (0.27) (0.29) (0.29)
Tuition (logged) 0.33 0.02 0.17 0.36
(0.40) (0.54) (0.59) (0.63)
Tuition percent change (*100) 0.00 0.01 0.01 0.01
(0.01) (0.01) (0.01) (0.01)
Percent private enrollment (*100) -0.03 -0.04 -0.04 -0.05
(0.02) (0.02) (0.03) (0.04)
Governing board -0.02 0.02 0.06 -0.10
(omitted is planning or coordinating) (0.52) (0.64) (0.70) (0.69)
Merit aid program -0.20 -0.24 -0.27 -0.24
(0.77) (0.82) (0.87) (0.89)
Income per capita (in 1000s) 0.02 0.02 -0.01
(0.06) (0.06) (0.06)
Income percent change (*100) -0.06 -0.05 -0.06
(0.05) (0.05) (0.05)
Gini coefficient (*100) 0.05 0.07 0.09
(0.08) (0.09) (0.09)
Unemployment rate (*100) -0.28 -0.34* -0.44*
(0.15) (0.16) (0.20)
Unemployment rate percent change (*100) -0.01 -0.01 -0.01
(0.01) (0.01) (0.01)
Moderate Republican 1.33 1.47
(omitted is strong Republican) (1.07) (1.13)
Moderate Democratic 0.53 0.91
(0.81) (0.86)
Strong Democratic 0.71 1.41
(0.82) (0.91)
Southern region -0.80
(omitted is New England/Mid-Atlantic) (1.21)
Midwestern region 0.31
(1.08)
Western region 0.57
(1.17)
Log pseudo-likelihood -56.65 -54.37 -53.44 -51.91
N (downturn periods) = 109
Standard errors in parentheses
* p < 0.05, ** p < 0.01, *** p < 0.001

FUNDING STUDENT AID DURING DOWNTURNS 57
Figure 1. Annual percentage change in inflation-adjusted per-student state funding for higher
education and in tuition and fees at public institutions, 1984-85 to 2014-15
Source: College Board (2015). Reprinted with permission.


