Hello Earth! - · PDF fileHello Earth! A grounded ... The extreme basics — IIi 6 7. plot...
37
Hello Earth! A grounded introduction to Matlab Frederik J Simons Christopher Harig Adam C. Maloof Princeton University
Transcript of Hello Earth! - · PDF fileHello Earth! A grounded ... The extreme basics — IIi 6 7. plot...

Hello Earth!
A grounded introduction to Matlab
Frederik J SimonsChristopher Harig
Adam C. Maloof
Princeton University
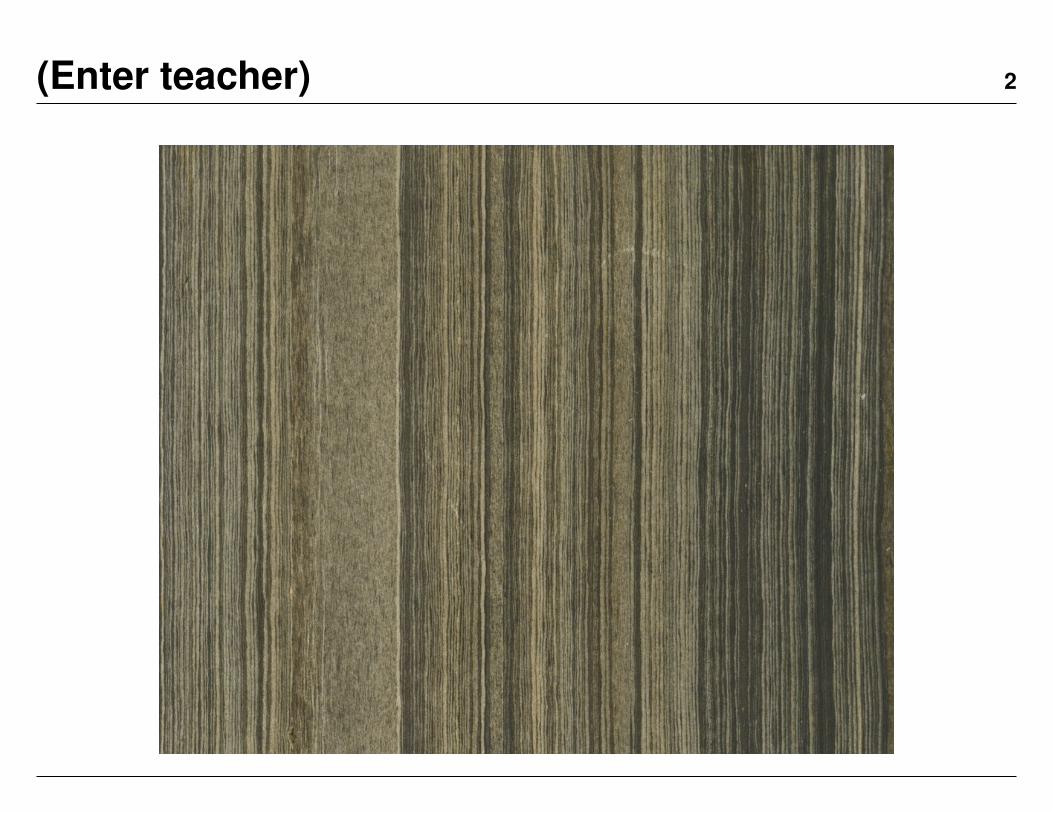
(Enter teacher) i 2
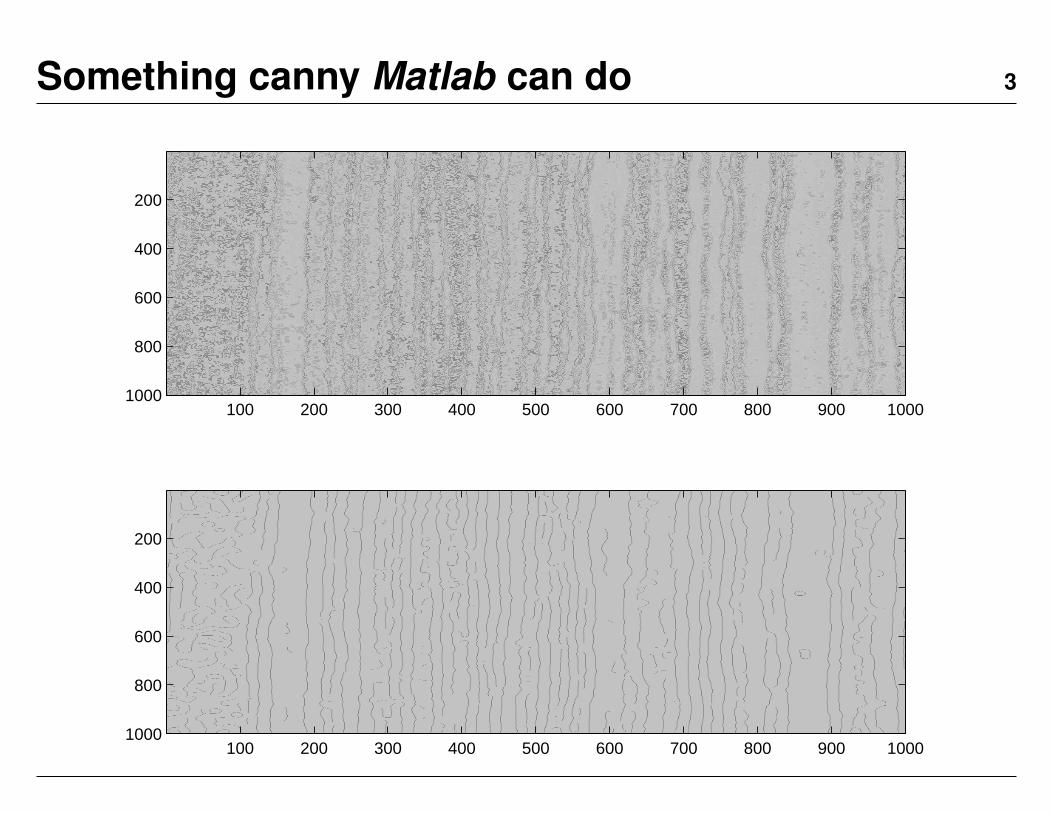
Something canny Matlab can do i 3
100 200 300 400 500 600 700 800 900 1000
200
400
600
800
1000
100 200 300 400 500 600 700 800 900 1000
200
400
600
800
1000
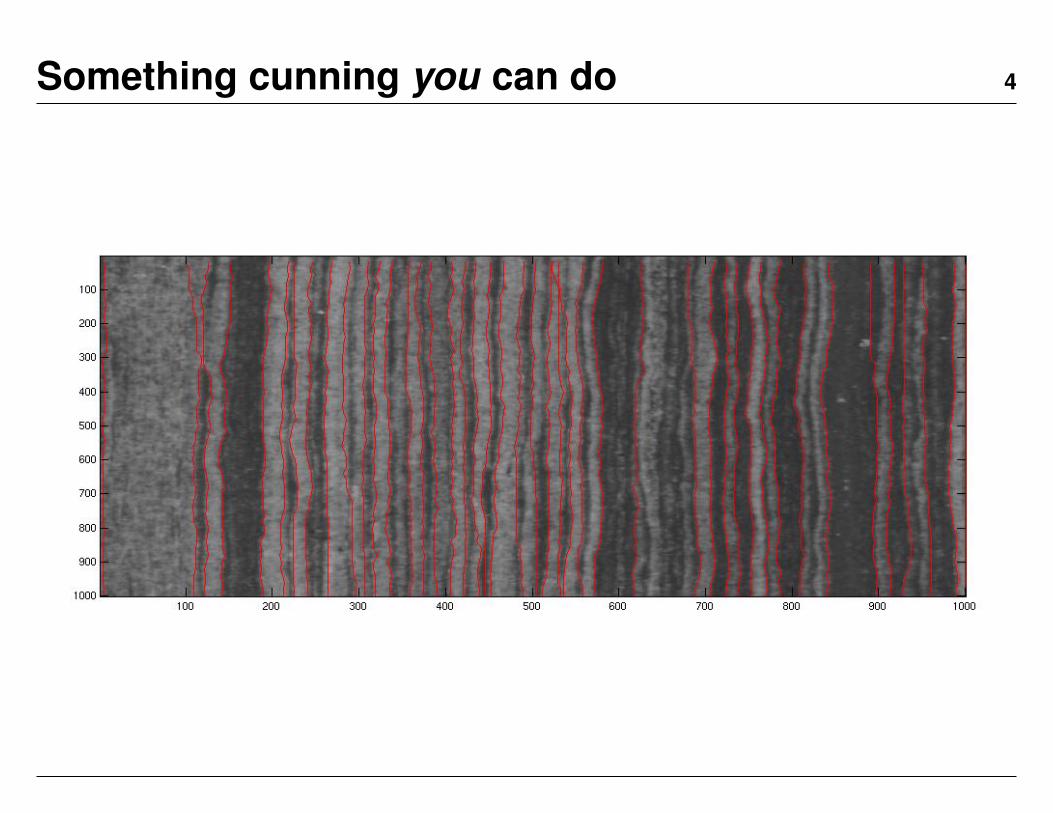
Something cunning you can do i 4
The extreme basics — I i 5
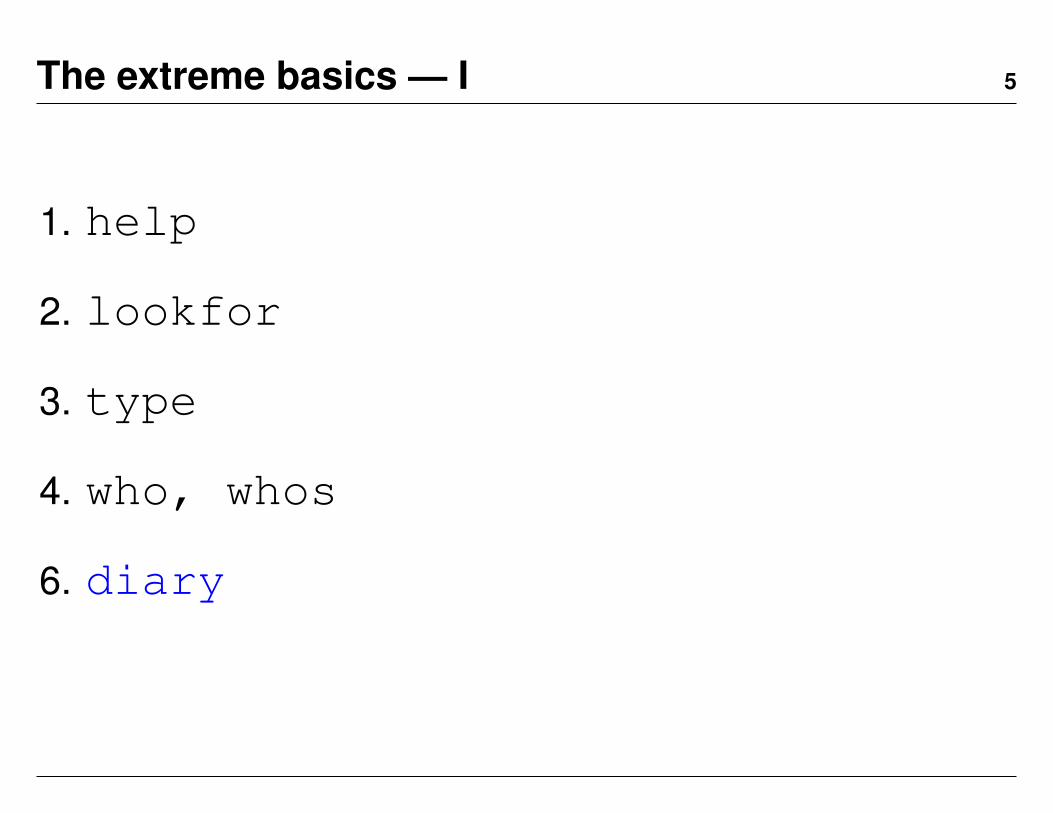
1. help

The extreme basics — I i 5
1. help
2. lookfor
The extreme basics — I i 5
1. help
2. lookfor
3. type
The extreme basics — I i 5
1. help
2. lookfor
3. type
4. who, whos
The extreme basics — I i 5
1. help
2. lookfor
3. type
4. who, whos
6. diary
The extreme basics — II i 6
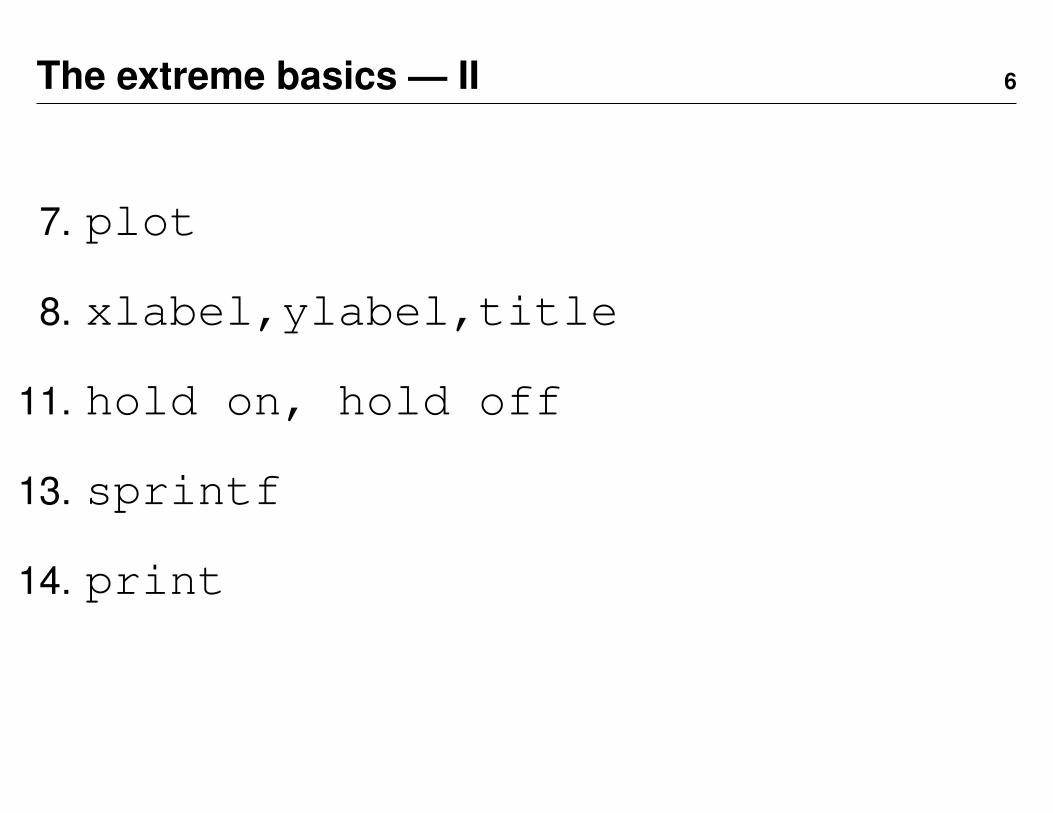
7. plot
The extreme basics — II i 6
7. plot
8. xlabel,ylabel,title

The extreme basics — II i 6
7. plot
8. xlabel,ylabel,title
11. hold on, hold off
The extreme basics — II i 6
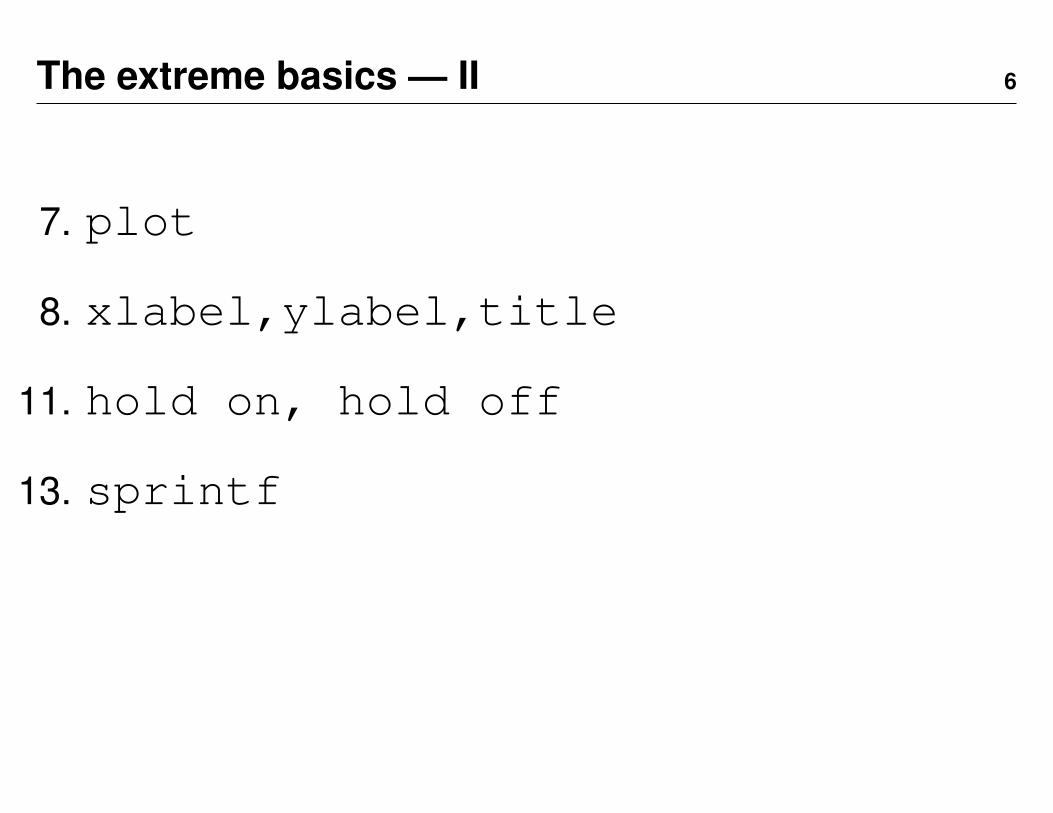
7. plot
8. xlabel,ylabel,title
11. hold on, hold off
13. sprintf
The extreme basics — II i 6
7. plot
8. xlabel,ylabel,title
11. hold on, hold off
13. sprintf
14. print
The extreme basics — II i 6
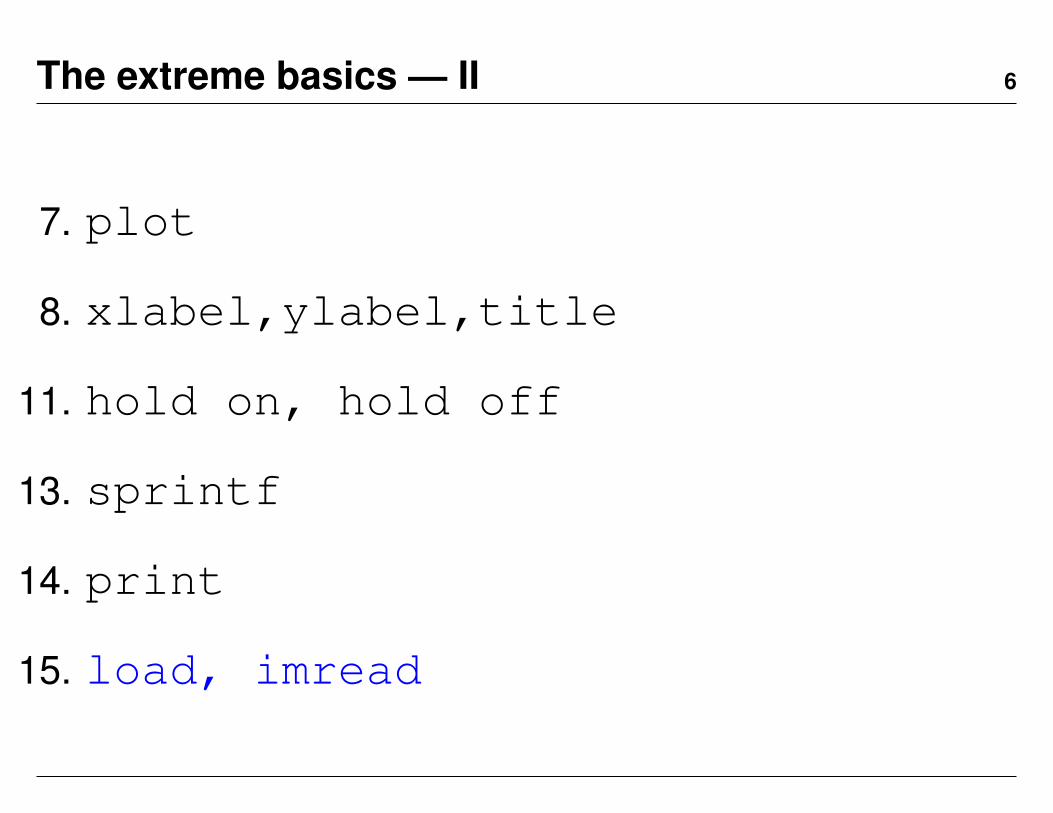
7. plot
8. xlabel,ylabel,title
11. hold on, hold off
13. sprintf
14. print
15. load, imread
Props i 7
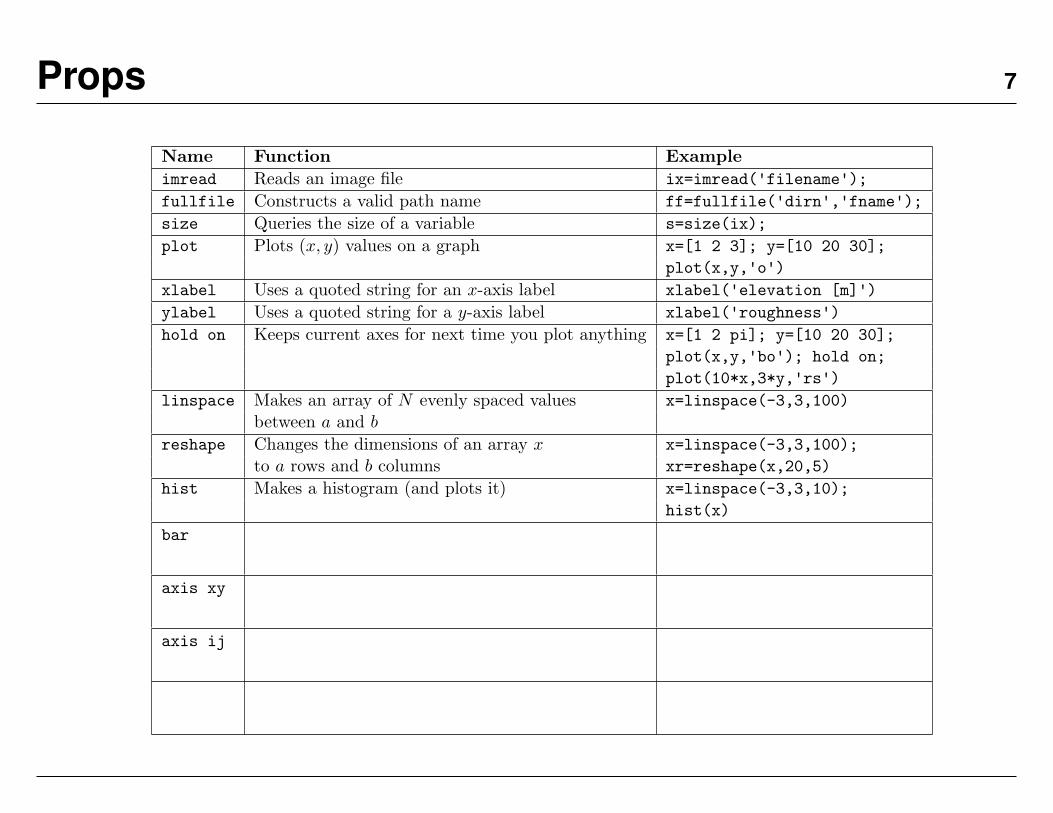
Name Function Exampleimread Reads an image file ix=imread('filename');fullfile Constructs a valid path name ff=fullfile('dirn','fname');size Queries the size of a variable s=size(ix);plot Plots (x, y) values on a graph x=[1 2 3]; y=[10 20 30];
plot(x,y,'o')xlabel Uses a quoted string for an x-axis label xlabel('elevation [m]')ylabel Uses a quoted string for a y-axis label xlabel('roughness')hold on Keeps current axes for next time you plot anything x=[1 2 pi]; y=[10 20 30];
plot(x,y,'bo'); hold on;plot(10*x,3*y,'rs')
linspace Makes an array of N evenly spaced values x=linspace(-3,3,100)between a and b
reshape Changes the dimensions of an array x x=linspace(-3,3,100);to a rows and b columns xr=reshape(x,20,5)
hist Makes a histogram (and plots it) x=linspace(-3,3,10);hist(x)
bar
axis xy
axis ij
Table 1: List of Matlab commands and their function and usage examples.
1
The extreme basics — III i 8
Addressing:rows, columns, dimensions, range
The extreme basics — III i 8
Addressing:rows, columns, dimensions, range
17. size
The extreme basics — III i 8
Addressing:rows, columns, dimensions, range
17. size
18. transpose
The extreme basics — III i 8
Addressing:rows, columns, dimensions, range
17. size
18. transpose
19. colon
The extreme basics — III i 8
Addressing:rows, columns, dimensions, range
17. size
18. transpose
19. colon
20. linspace
The extreme basics — III i 8
Addressing:rows, columns, dimensions, range
17. size
18. transpose
19. colon
20. linspace
Logic:logical, character, string, double
The extreme basics — III i 8
Addressing:rows, columns, dimensions, range
17. size
18. transpose
19. colon
20. linspace
Logic:logical, character, string, double
21. <, >, ==, ∼, &, |
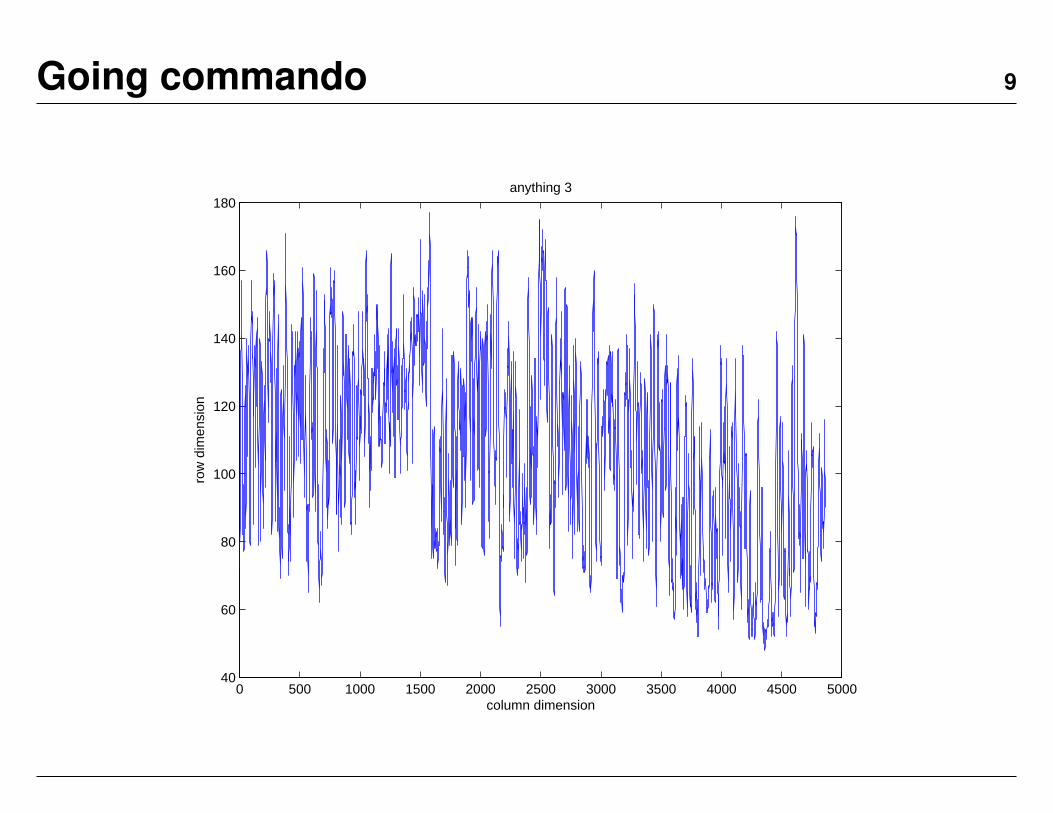
Going commando i 9
0 500 1000 1500 2000 2500 3000 3500 4000 4500 500040
60
80
100
120
140
160
180anything 3
column dimension
row
dim
ensi
on
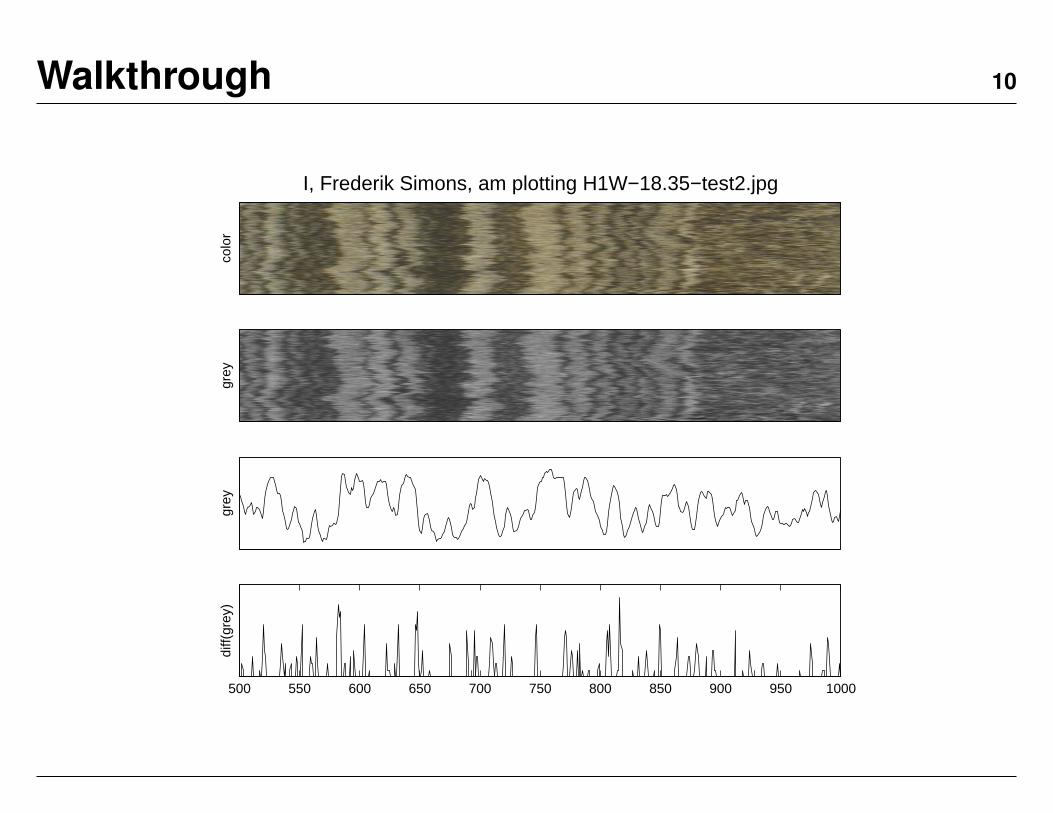
Walkthrough i 10
colo
r
I, Frederik Simons, am plotting H1W−18.35−test2.jpg
grey
grey
500 550 600 650 700 750 800 850 900 950 1000
diff(
grey
)
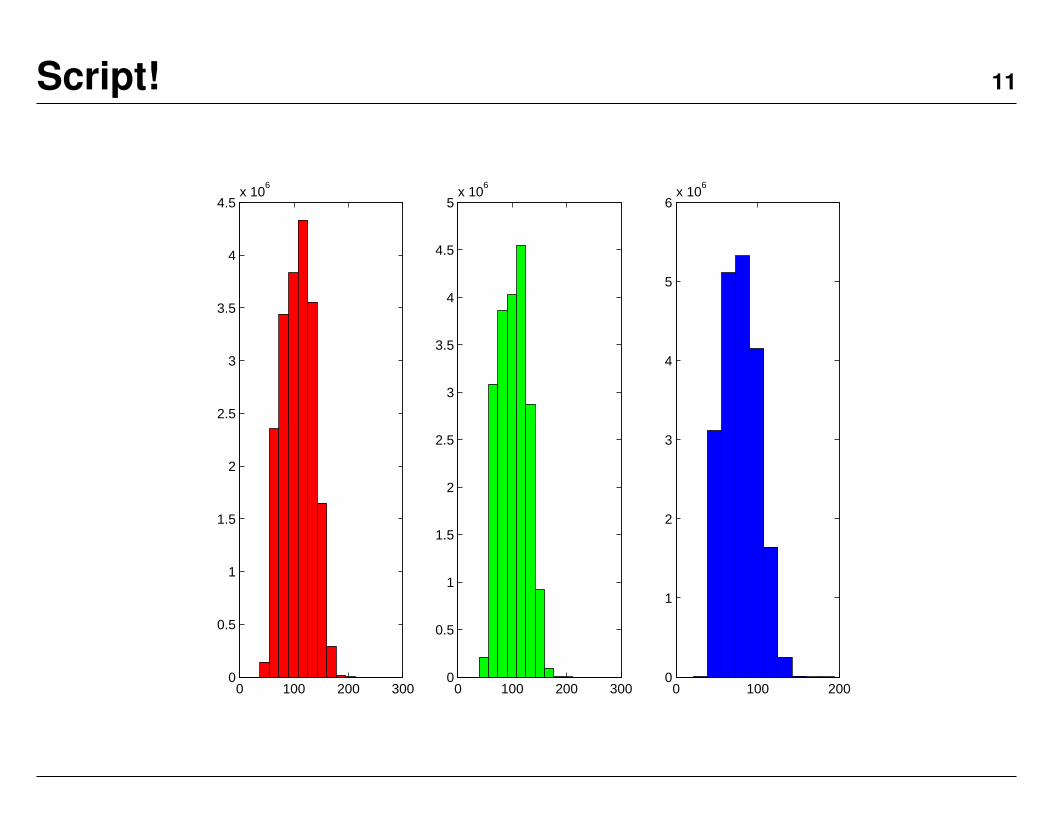
Script! i 11
0 100 200 3000
0.5
1
1.5
2
2.5
3
3.5
4
4.5x 10
6
0 100 200 3000
0.5
1
1.5
2
2.5
3
3.5
4
4.5
5x 10
6
0 100 2000
1
2
3
4
5
6x 10
6

Homework 1 i 12
Navigate to Course Materials, Software Installation and Templates.
1. Install Matlab as per the instructions.
2. Start Matlab: you will be making a Very Simple Plot.
3. Create ("edit") a new code (*.m) file called "lab01b.m" and in it,
type the following few instructions, or some slight variations
thereof, according to your taste (i.e. vary the numbers):
x=linspace(0,pi,100);
A=1; B=3; f1=0; f2=0;
y1=A*sin(x+f1); y2=B*cos(x+f2); y3=y1+y2;
figure (1)
plot(x,y1,’r’); hold on; plot(x,y2,’g’); plot(x,y3,’b’)
title(’yournetidl01b’)
hold off; axis tight
print(’-dpdf’,’yournetidl01b’)
4. Save this file, see that you can find it again.
5. In step 3, "yournetid" is once again your Princeton netid of course.
6. Now "run" or "execute" this "script" and make sure that something
pops up on your screen - and that a PDF gets made!
7. Find the PDF that you just made (’yournetidl01b.pdf’).
That is your second Assignment! Upload it to Blackboard by the deadline.

Homework 1 i 13
0 0.5 1 1.5 2 2.5 3 3.5−3
−2
−1
0
1
2
3
4yourpuidl01b
Code hygiene i 14
1. “If you type it twice, you need to use a variable”

Code hygiene i 14
1. “If you type it twice, you need to use a variable”
2. “If you say it in the absolute, you need to reformulate to the relative”
Code hygiene i 14
1. “If you type it twice, you need to use a variable”
2. “If you say it in the absolute, you need to reformulate to the relative”
3. “Annotate all graphs completely, and give them meaningful names ”

Code hygiene i 14
1. “If you type it twice, you need to use a variable”
2. “If you say it in the absolute, you need to reformulate to the relative”
3. “Annotate all graphs completely, and give them meaningful names ”
4. “Annotate all code completely, to a ridiculous degree”

Code hygiene i 14
1. “If you type it twice, you need to use a variable”
2. “If you say it in the absolute, you need to reformulate to the relative”
3. “Annotate all graphs completely, and give them meaningful names ”
4. “Annotate all code completely, to a ridiculous degree”
Documentation/Help/Date
Code hygiene i 14
1. “If you type it twice, you need to use a variable”
2. “If you say it in the absolute, you need to reformulate to the relative”
3. “Annotate all graphs completely, and give them meaningful names ”
4. “Annotate all code completely, to a ridiculous degree”
Documentation/Help/Date
Input/Output
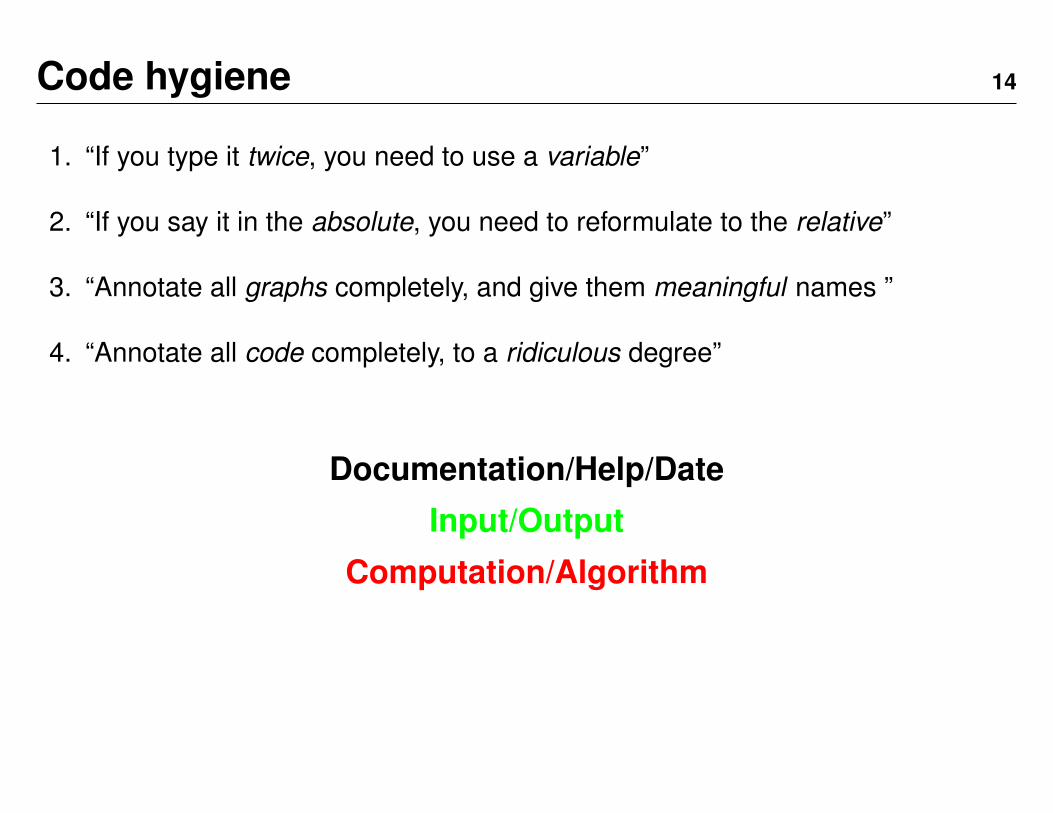
Computation/Algorithm
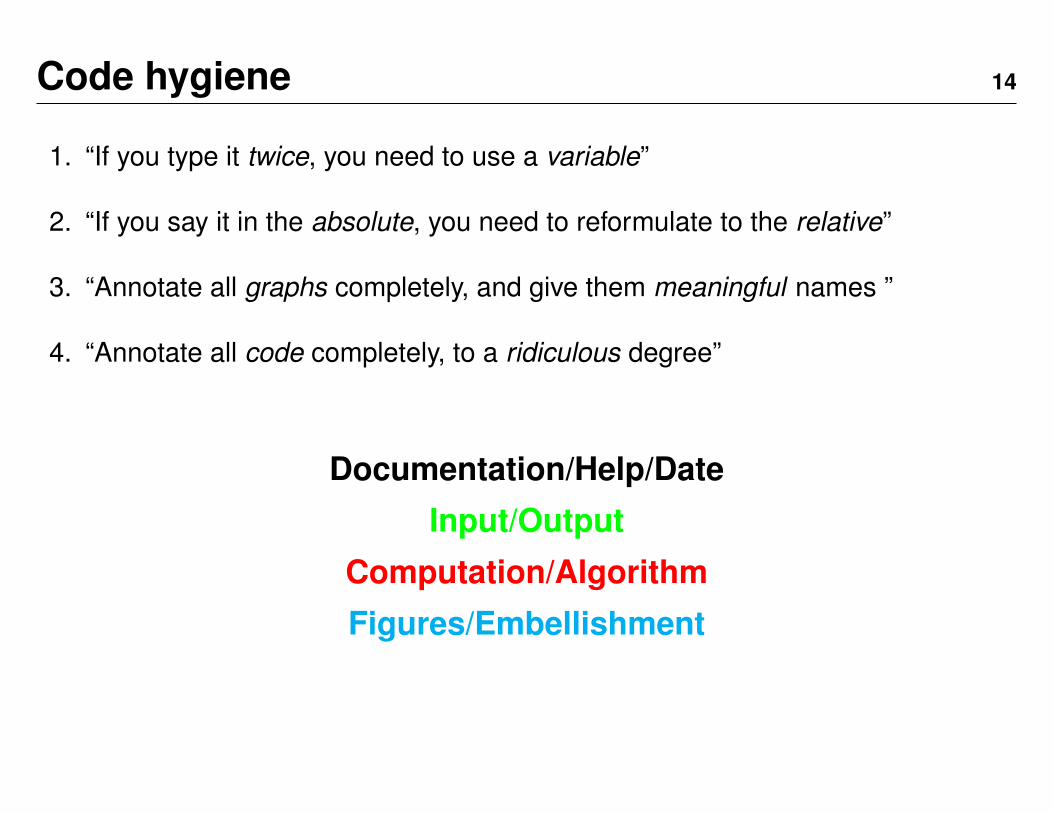
Figures/Embellishment
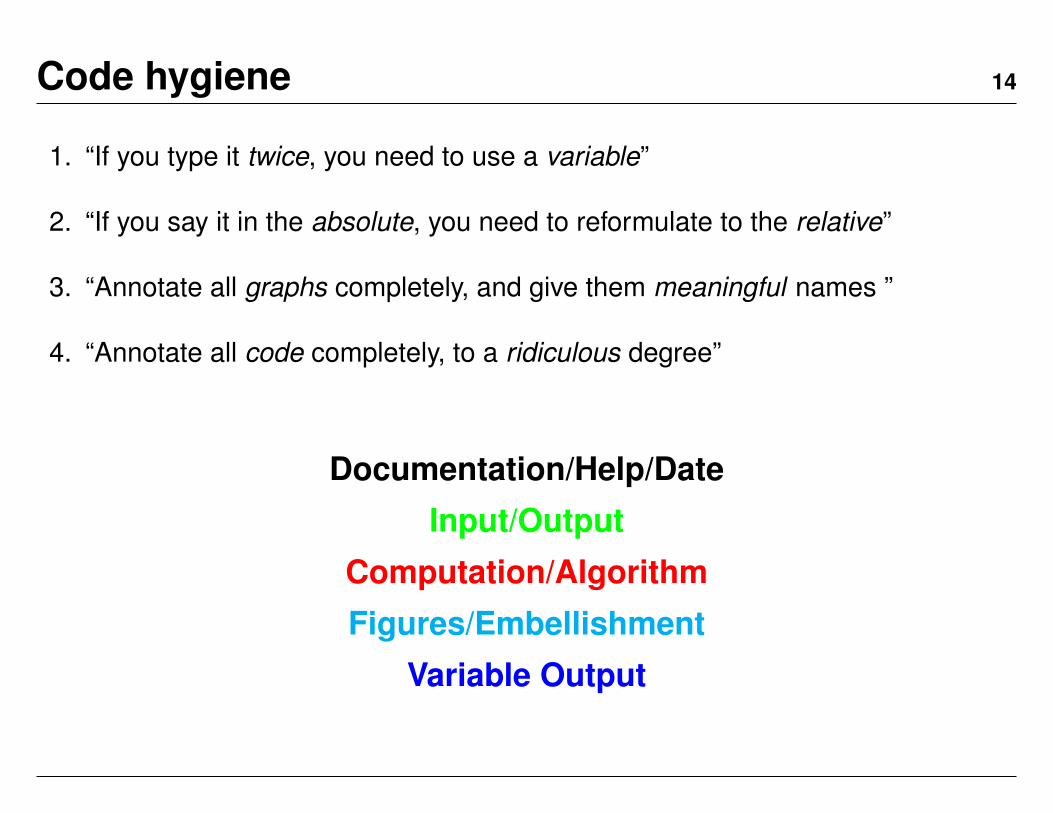
Variable Output