HELEN KELLER INTE RNATIONAL in Takeo Province, Cambodia ... · HELEN KELLER INTE RNATIONAL ......
30
HELEN KELLER INTE RNATIONAL Findings from the HKI Baseline Survey in Takeo Province, Cambodia Part 1: Food Consumption Questionnaire February 1997 Contact Person: Ms. Mary McMurtry Country Representative Helen Keller International House # 7 4 , Street 4 5 6 Sankat Toultumpoung 1, Khann Chamcar Mon P.O. Box 168 Phnom Penh Kingdom of CAMBODIA 011-855-23-3-62570 A world leader in blindness prevention and rehabilitation since 1915 WORLD HEADQUARTERS 90 WASHINGTON STREET, NEW YORK, NEW YORK 10006 TEL (212) 943-0890 FAX (212) 943-1220
Transcript of HELEN KELLER INTE RNATIONAL in Takeo Province, Cambodia ... · HELEN KELLER INTE RNATIONAL ......

HELEN KELLER INTE RNATIONAL
Findings from the HKI BaselineSurvey
in Takeo Province, Cambodia
Part 1: Food Consumption Questionnaire
February 1997
Contact Person:Ms. Mary McMurtryCountry RepresentativeHelen Keller InternationalHouse # 7 4 , Street 456Sankat Toultumpoung 1, Khann Chamcar MonP.O. Box 168Phnom PenhKingdom of CAMBODIA0 1 1 - 8 5 5 - 2 3 - 3 - 6 2 5 7 0
A world leader in blindness prevention and rehabilitation since 1915WORLD HEADQUARTERS 90 WASHINGTON STREET, NEW YORK, NEW YORK 10006 TEL (212) 943-0890 FAX (212) 943-1220

Executive Summary: Food Consumption
The HKI Food Frequency Questionnaire was administered in July and August 1996 to480 caretakers of preschool children (12-59 months old) in randomly selected households in16 randomly selected communities in Samrong District and Tram Kak District in the Provinceof Takeo. Approximately the same number of girls and boys were selected. More five yearolds were included in the survey than expected, possibly because of age misclassification.Almost all of the caretakers interviewed with the children's mother. The purpose of thisquestionnaire was to evaluate (i) whether or not the consumption of vitamin A-rich foods wasadequate, (ii) which vitamin A-rich foods are being consumed and with what frequency inorder to inform the nutrition communications strategy, (iii) key washing behaviors thattransmit diarrheal pathogens and trachoma, and (iv) how soon infants are introduced tovitamin A-rich colostrum after birth.
The frequency of consumption of animal sources of vitamin A appears to be adequate,primarly because of a high consumption of small fish with liver intact. Overall the animal foodfrequency scores were significantly above a cutoff score that had been validated against serumretinol. In more than two out of three of the communities surveyed, the animal foodfrequency scores were above the cutoff score, in one out of three communities, the scoreswere significantly above the cutoff (p < 0.05). The consumption of small fish with liver hadincreased significantly in the District of Samrong compared to a previous survey wasconducted in that district in March 1994. In contrast to the animal sources of vitamin A, theadditional consumption of plant sources of beta-carotene does not appear to be adequate. Infour out of five of the communities surveyed, the combined food frequency scores were notsignificantly above a cutoff score that had been validated against serum retinol. Consumptionof pumpkin and chun or laucama fruit had increased in the District of Samrong compared tothe March 1994 survey. Almost all children consumed dark green leafy vegetables (DGLVs),and the frequency of consumption was higher than for other foods. The changes inconsumption of small fish with liver, pumpkin, and chun or laucama fruit could either be dueto seasonal variation in consumption, or sustained increases in consumption from 1994 to1996. Fish ponds had been considered as an intervention to improve the consumption of thisimportant source of protein. The consumption of fresh water fish was eaten by nine out of ten .children.
The proportion of child caretakers who washed their hands after defecating is muchlower than the proportion of child caretakers who engage in any other handwashing behavior.Less than one in ten mothers wash their hands after defecating. In contrast, more than oneout of two mothers washed her hands before cooking and two out of three mothers washedtheir hands before eating. Even more women wash their hands after working in the field.Soap is used relatively often; less than one out of twenty caretakers never used soap. Facewashing is an almost univeral behavior; almost all caretakers washed their children's faces atleast once a day. More than one out of two caretakers washed her children's faces three ormore times a day.
Previous UNICEF surveys in Cambodia have shown that the proportion of mothersbreastfeeding and the duration of breastfeeding are quite good in Cambodia. Thebreastfeeding behavior that is not good in Cambodia, is the delay in the introduction of breastmilk that results in a very low intake of the vitamin A-rich colostrum. The main results of the

HKI baseline survey were that the proportion of women introducing breast milk during thefirst four hours after delivery and even during the first day after delivery is woefullyinadequate. Very few infants received the full benefit of the exceedingly high content ofvitamin A during the first three days of life.
The recommendations based on these survey findings are:
1. A follow-up survey needs to be conducted in March to evaluate whether or not thechanges in consumption of vitamin A -rich foods are due to seasonal variation or asustained increase. HKI has sufficient funds from nonUSAID sources to cover the costsof this survey.
2. The nutrition communications strategy should focus on promoting:
a) other animal sources of vitamin A in addition to small fish with the liver intact toensure that there is a safety margin in the event that the availabilty of this fooddecreases or that the liver is removed in some families.
b) plant sources of vitamin A other than DGLVs because of the uncertainty over theavailability of beta-carotene in DGLVs and the relatively high consumption of DGLVs,other plant sources of beta-carotene need to be promoted.
3. Consumption of fish is already so widespread and frequent that interventiosnto increase the use fish ponds are unlikely to improve nutrition.
4. Consumption of vitamin A-rich foods has already improved to the point where it is feasible to increase consumption to adequate levels in all communities by the end of the project.5. Hand washing after defecating needs to be improved to a greater extent than any other hand washing behavior. The project objectives should specifically address an increase in the proportion of children's caretakers who wash their hands after defecating as the key hygienic behavior.
6. Face washing is almost universally practiced and relatively frequent. The project objectives should specifically address an increase in the frequency of face washing.
7. Introduction of breast milk within the first four hours after delivery needs significant improvements in order for infants to benefit from the vitamin A-rich colostrum. The projects objectives should specifically address an increase in the proportion of mothers who introduce breast milk within the first four hours after delivery.

I. Methods and description of the sample population ........................................................1II. Frequency of consumption of foods .............................................................................. 2
Table of Contents
A. Verification of mother's willingness to respond accurately....................................3 B. Consumption of animal sources of vitamin A..........................................................4
C. Consumption of plant sources of beta-carotene..................................................... ........9
D. Consumption of fat and ..............................................................................……..15
E. Consumption of protein-rich foods .............................................................…….16
III. Washing to reduce disease transmission ......................................................................18
A. Hand washing...........................................................................................……...18
B. Face ing..........................................:.........................................................……..20
IV. Introduction of breast milk….......................................................................................21
V. Discussion ...............................................................................……...............................23VI. Recommendations...........................................................................…….........................25

1
HKI Baseline Survey in Takeo Province, Cambodia
Part I: Food Consumption
February, 1997
I. Methods and description of the sample population
As part of a baseline survey, the HKI Food Frequency Questionnaire was administeredin 16 communities selected by population proportional to size sampling in two districts ofTakeo: Samrong and Tram Kak Districts. The survey was conducted in July to August 1996.In each community 30 households were selected by random start systematic sampling. In eachhousehold one child between the age of one and six years of age was randomly selected. HKIpreviously conducted a survey in March 1994 in the Samrong District as part of an MGVitamin A Technical Assistance Project funded by USAID through Private AgenciesCollaborating Together (PACT).
Almost nine out of ten of the caretakers (87.1%) interviewed were the children'sactual mother. Grandmothers were the next most frequently interviewed caretaker (8.1%).Only 4.8% of the caretakers had some other relationship with the child.
The age distribution of preschool children in the selected communities and of thepreschool children that were selected from households are presented in table 1. The sample ofall the children from the selected households shows some bias towards five-year old children.Over one out of three of the children in selected households was in the five year old agegroup, rather than the expected one out of five children. The age distribution of the childrenthat were selected for the interview on frequency of food consumption is almost identical tothe distribution of children in the selected households. The sampling of children within thehousehold was not likely to be biased.
Table 1. Age distribution among children in households selected for the baseline survey inTakeo Province 1996.
All preschool children in households Children selected for the foodAge (years) selected for the baseline survey frequency questionnaire
n % n %1 126 17.7% 86 17.5%2 82 11.5% 50 10.2%
3 132 18.5% 92 18.7%4 127 17.8% 86 17.5%5 246 34.5% 177 360%
Total 713 100.0% 491 100.0%
The distribution of boys and girls among the selected preschool children is presented intable 2. There does not appear to be any gender bias in the sample of children that wereselected for the food frequency survey. Both boys and girls appear to be equally distributed.

Table 2. Gender distribution among preschool children (12-59 months old) selected forthe food frequency questionnaire in Takeo Province 1996.
Gender nfemale 235 49.0%male 245 51.0%Total 480 100.0%
The number of preschool children in each of the selected households is presented intable 3. The selection criteria for households was the presence of at least one child betweenone and six years old. Most of these households only had one child in this age range. Onlyone in three households had two children between one and six years old; less than one in tenhouseholds had three or more children between one and six years old.
Table .3 Number of preschool children (12-59 months old) in households selected for thebaseline survey in Takeo Province 1996.
# of preschool children (12-59 months old) in nhouseholds selected for the baseline survey
1 295 62.4%2 145 30.7%3 33 7.0% o4 7 1.5%Total 473 100.0%
II. Frequency of consumption of foods
The food frequency questionnaire contains a variety of foods to elicit informationabout various aspects of the diet. Chili peppers are included on the questionnaire to verifywhether or not children's caretakers were trying to please the interviewer by saying their childhad eaten that the child actually had not eaten. A main staple food is included on thequestionnaire to verify that children's caretakers felt comfortable responding that their childate a food every day in the week prior to the survey. Other staple foods are also included toget an idea of the composition of staple foods in the diet.
The food frequency questionnaire contains key animal sources of vitamin A. HKIvalidated a food frequency score for these animal sources of vitamin A (see description inNutrition NewsNotes). This food frequency score does not diagnose individual deficiency, itis a proxy indicator of risk of vitamin A deficiency in surveyed communities. Thequestionnaire also included key plant sources of beta-carotene. Beta-carotene, the precursorto vitamin A found in plants, is not as well absorbed as the retinol found in animal foods.Therefore, plant sources of beta-carotene are weighted by dividing by six in order to accountfor the difference in absorption. A combined animal and weighted plant score was alsovalidated as an indicator of risk of vitamin A deficiency in surveyed communities. The sourcesof vitamin A and beta-carotene provide insights into the major sources of vitamin A in the dietof the surveyed population. Dark green leafy vegetables (DGLVs) were included on thequestionnaire as a group, as well as individual types.
2

Fats and oils were included on the questionnaire because absorption of beta-caroteneis dependent upon the fat content of the diet. Finally, food rich in protein are also includedbecause protein influences the utilization of vitamin A.
A. Verification of mother's willingness to respond accurately
The frequency of consumption of chili peppers by the surveyed preschool children ispresented in table 4. The frequency of chili pepper consumption was so low that children'scaretakers do not appear to have difficulty in stating that their children don't eat particularfoods or stating that their children eat foods infrequently. Less than 5% of the selectedchildren had eaten chili peppers in the week prior to the survey. More children ate chilipeppers only one day in the week prior to the survey than ate chili peppers two or more daysin the week prior to the survey.
Table 4. Frequency of consumption of chili peppers by preschool children (12-59 monthsold) in Takeo Province 1996.
Days in the
last week n7 2 0.4%6 1 0.25 3 0.6%4 1 0.2%3 3 0.6%2 4 0.8%1 9 1.9%Subtotal 23 4.8%0 457 95.2%Total 480 100.0%
The main staple food, rice was included on the questionnaire to check whether or notthe mother would remember foods that were consumed every day. Chinese noodles wereincluded as well as rice to provide information about the consumption patterns for variousstaple foods. As expected, rice was the primary staple food eaten by all of the selectedpreschool children during the week prior to the survey (see table 5). In contrast, Chinesenoodles were eaten by about one out of ten children in the week prior to the survey.
3

Table S. 'Frequency of consumption of staple foods by preschool children (12-59 monthsold) in Takeo Province 1996.
Days in the Rice Chinese noodleslast week n % n %7 468 97.5% 0 0.0%6 2 0.4% 0 0.0%5 2 0.4% 0 0.0%4 3 0.6% 0 0.0%3 5 1.0% 3 0.6%2 0 0.0% 8 1.7%1 0 0.0% 51 10.6%Subtotal 480 100.0% 62 12.9%0 0 0.0% 418 87.1%Total 480 100.0% 480 100.0%
Almost all the surveyed preschool children ate rice seven days in the week prior to thesurvey. In contrast, Chinese noodles were generally eaten only one day in the week prior to the survey, if at all.
B. Consumption of animal sources of vitamin A
Small fish with liver and eggs were among the most commonly consumed animalsource of vitamin A (see table 6). Two out of three of the surveyed preschool children atefish with liver at least one day in the week prior to the survey. Similarly, two out of threechildren ate eggs in the week prior to the survey. Fewer children ate liver in the week prior tothe survey than eggs or small fish with the liver intact. Around one in five children ate liver.Fewer than 1% of children ate butter or cod liver oil. Both powdered milk and sweetenedcondensed milk are fortified with vitamin A. If the milk are not overly diluted with water, itcould be an important source of vitamin A. Sweetened condensed milk was consumed byonly 6.9% of the children. Powdered milk was consumed by less than 1% of the children.Ovaltine is also fortified with vitamin A, but it was only consumed by 1.1% of the children inthe week prior to the survey.
4

Table 6. Frequency of consumption of animal sources of vitamin A by preschool children(12-S9 months old) in Takeo Province 1996.
Small fishwith liver Eggs LiverDays in the n % n % n %,last week
7 76 15.8% 25 5.2% 0 0.0%6 14 2.9% 2 0.4% 0 0.0%5 30 6.3% 22 4.6% 1 0.2%4 32 6.7% 24 5.0% 5 1.1%3 47 9.8% 63 13.1% 11 2.3%2 64 13.3% 83 17.3% 19 4.0%1 65 13.5% 101 21.0% 55 11.6%Subtotal 328 68.3% 320 66.7% 91 19.2%0 152 31.7% 160 33.3% 383 80.8%Total 480 100.0% 480 100.0% 474 100.0%
Graph 1 illustrates the proportion of the surveyed preschool children eating animalsources of vitamin A The horizontal bars represent the proportion of children who ate thefood at least one day in the week prior to the survey. The shading within the bars indicatesthe specific frequency of consumption starting with seven days a week as a black bar andconcluding with one day a week as a white bar. Children ate small fish with liver morefrequently than eggs and in turn ate eggs more frequently than liver. More than one out ofeight children ate fish with liver every day in the week prior to the survey, while around oneout of twenty children ate eggs every day. Liver was generally eaten one day a week.
Graph 1. Frequency of consumption of animal sources of vitamin A by preschoolchildren (12-59 months old) in Takeo Province 1996
Proportion of Children
The consumption of animal sources of vitamin A by the subsample of preschoolchildren selected in Samrong District for the baseline survey in July to August to August 1996can be compared to the consumption of animal sources by the preschool children surveyed inSamrong District in March 1994 (see graph 2). There was a slight decline in consumption ofliver and eggs. Consumption of small fish with liver increased dramatically.
5

Graph 2. Frequency of consumption of animal sources of vitamin A by preschoolchildren (12-59 months old) surveyed in Samrong District in March 1994 and July to
August to August 1996.
Proportion of Children
Animal food frequency scores <5,4 days/week indicate that the surveyed population isat risk of vitamin A deficiency. The animal food frequency scores are presented in table 7.Communities that have a food frequency score that is significantly (p < 0.05 using a one-tailedtest) above the cutoff value are highlighted with bold and italics in the table. Over two out ofthree communities had animal scores above the cutoff value indicating risk of vitamin Adeficiency; one out of three of these communities had animal scores that were significantlyabove the cutoff..

Table 7. Animal food frequency scores for preschool children (12-39 months old) inselected communities of Takeo Province 1996
The animal scores vary considerably between communities (see graph 3). Tah So hasan animal score more than two times greater than the cutoff value while Tah Dok Pong has ananimal score that was almost a full point below the cutoff value.
Lower 95%Village Mean Confidence LimitKnah Roh 6.03 5.01Hong Haeng 3.97 3.18Tah Dok Pong 3.03 2.37Kam Por 4.77 3.79Trapi ang Veng 4.70 3.81Dok Po 4.83 3.88Srel Chey 4.41 3.59Chom Pul 4.27 3.42Trapi ang Kak 4.17 3.31Trapi ang Pring 3.90 3.22Rum Pek Pen 3.30 2.60Tah Sa 8.69 7.50Trapi ang Chuk 5.50 4.45Prey Cheur eat 6.25 5.06Rum Lech Svey 6.40 5.49
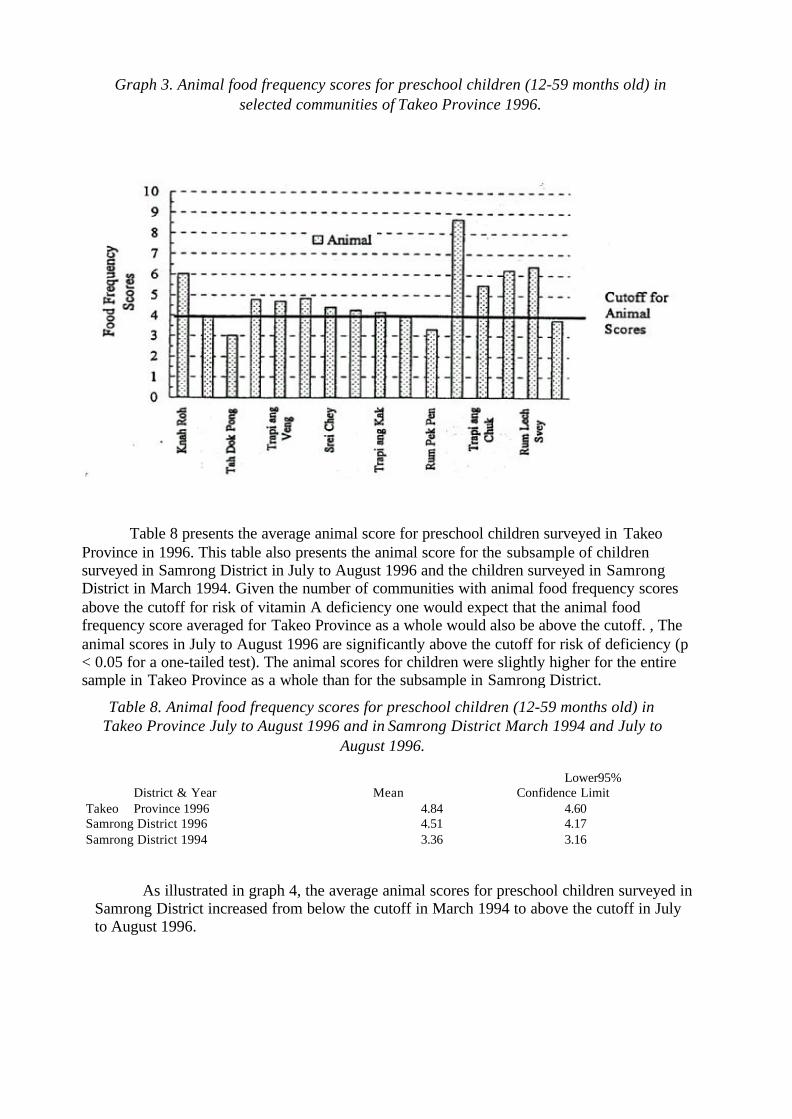
Graph 3. Animal food frequency scores for preschool children (12-59 months old) inselected communities of Takeo Province 1996.
Location
Table 8 presents the average animal score for preschool children surveyed in TakeoProvince in 1996. This table also presents the animal score for the subsample of childrensurveyed in Samrong District in July to August 1996 and the children surveyed in SamrongDistrict in March 1994. Given the number of communities with animal food frequency scoresabove the cutoff for risk of vitamin A deficiency one would expect that the animal foodfrequency score averaged for Takeo Province as a whole would also be above the cutoff. , Theanimal scores in July to August 1996 are significantly above the cutoff for risk of deficiency (p< 0.05 for a one-tailed test). The animal scores for children were slightly higher for the entiresample in Takeo Province as a whole than for the subsample in Samrong District.
Table 8. Animal food frequency scores for preschool children (12-59 months old) inTakeo Province July to August 1996 and in Samrong District March 1994 and July to
August 1996.
As illustrated in graph 4, the average animal scores for preschool children surveyed inSamrong District increased from below the cutoff in March 1994 to above the cutoff in Julyto August 1996.
Lower95%District & Year Mean Confidence Limit
Takeo Province 1996 4.84 4.60Samrong District 1996 4.51 4.17Samrong District 1994 3.36 3.16
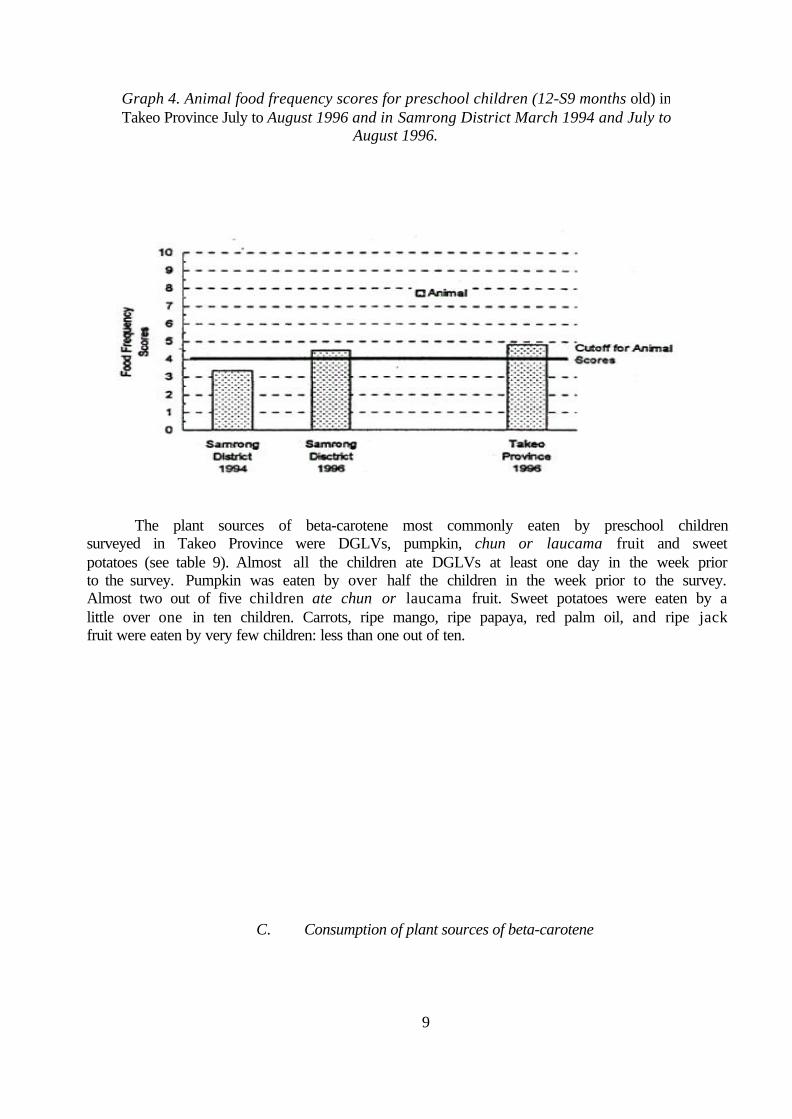
Graph 4. Animal food frequency scores for preschool children (12-S9 months old) inTakeo Province July to August 1996 and in Samrong District March 1994 and July to
August 1996.
Location & Survey Year
C. Consumption of plant sources of beta-carotene
The plant sources of beta-carotene most commonly eaten by preschool childrensurveyed in Takeo Province were DGLVs, pumpkin, chun or laucama fruit and sweetpotatoes (see table 9). Almost all the children ate DGLVs at least one day in the week priorto the survey. Pumpkin was eaten by over half the children in the week prior to the survey.Almost two out of five children ate chun or laucama fruit. Sweet potatoes were eaten by alittle over one in ten children. Carrots, ripe mango, ripe papaya, red palm oil, and ripe jackfruit were eaten by very few children: less than one out of ten.
9
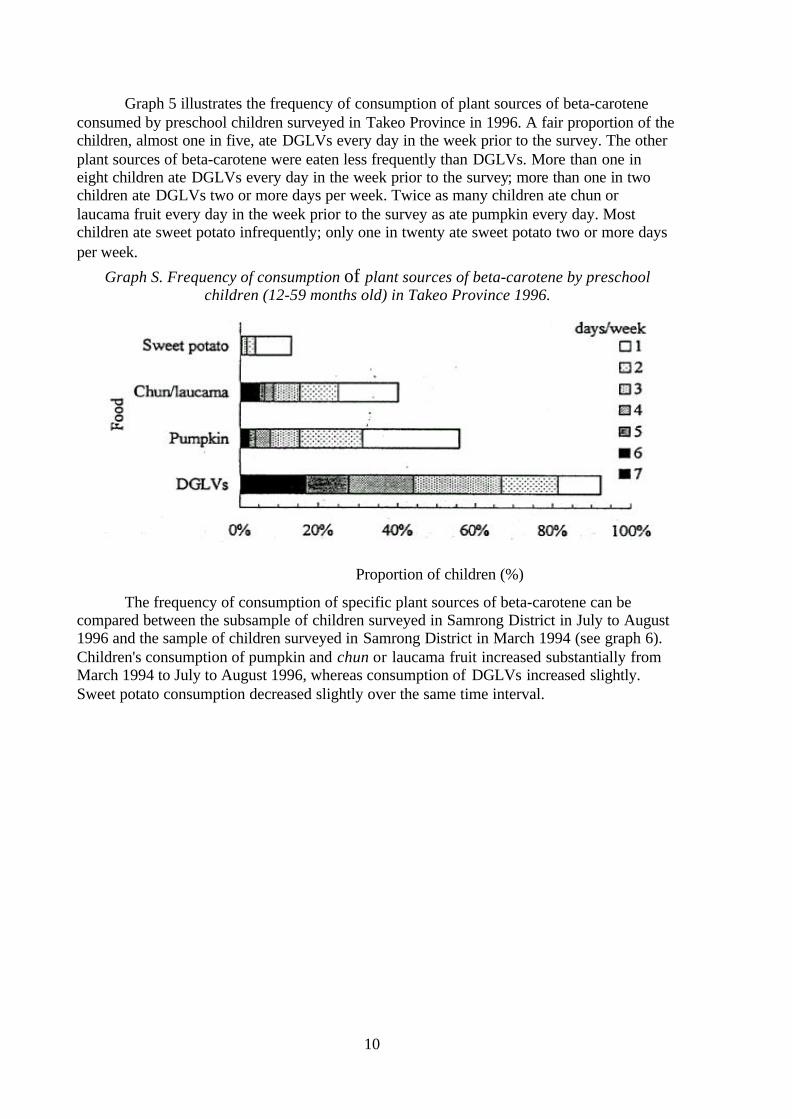
Graph 5 illustrates the frequency of consumption of plant sources of beta-caroteneconsumed by preschool children surveyed in Takeo Province in 1996. A fair proportion of thechildren, almost one in five, ate DGLVs every day in the week prior to the survey. The otherplant sources of beta-carotene were eaten less frequently than DGLVs. More than one ineight children ate DGLVs every day in the week prior to the survey; more than one in twochildren ate DGLVs two or more days per week. Twice as many children ate chun orlaucama fruit every day in the week prior to the survey as ate pumpkin every day. Mostchildren ate sweet potato infrequently; only one in twenty ate sweet potato two or more daysper week.
Graph S. Frequency of consumption of plant sources of beta-carotene by preschoolchildren (12-59 months old) in Takeo Province 1996.
Proportion of children (%)
The frequency of consumption of specific plant sources of beta-carotene can becompared between the subsample of children surveyed in Samrong District in July to August1996 and the sample of children surveyed in Samrong District in March 1994 (see graph 6).Children's consumption of pumpkin and chun or laucama fruit increased substantially fromMarch 1994 to July to August 1996, whereas consumption of DGLVs increased slightly.Sweet potato consumption decreased slightly over the same time interval.
10

Graph 6. Frequency of consumption of plant sources of beta-carotene by preschoolchildren (12-59 months old) in Samrong District in March 1994 and July to August1996
Proportion of Children
Various types of DGLVs were included on the food frequency questionnaire. Table10 presents the proportion of the preschool children surveyed in Takeo Province that ate theseDGLVs at least one day in the week prior to the survey. Kang kong was eaten by morechildren than ivy gourd or cassava leaves. About three out of four children ate kang kong atleast one day in the week prior to the survey, whereas only one in four children ate ivy gourdand a l i t t le over one in eight children ate cassava leaves.
11

Table 10. Frequency of consumption of various DGLVs by preschool children (12-59months old) in Takeo Province 1996
Kang kong Ivy Gourd Cassava leavesDays in the . n % n % n %
last week7 6 1.3% 0 0.0% 0 0.0%6 3 0.6% 0 0.0% 0 0.0%5 10 2.1% 1 0.2% 1 0.2%4 33 6.9% 3 0.6% 1 0.2%3 79 16.5% 10 2.1% 6 1.3%2 116 24.2% 30 6.3% 12 2.6%1 106 22.1% 81 16.9% 55 12.0%Subtotal 353 73.5% 125 26.0% 75 16.4%0 127 26.5% 355 74.0% 383 83.6%Total 480 100.0% 480 100.0% 458 100.0%
Kang kong was eaten more frequently by the surveyed preschool children than ivygourd leaves (see graph 7). Ivy gourd leaves were, in turn, eaten more frequently thancassava leaves. Around one in five children ate kang kong four or more days per week; morethan one in four children ate kang kong three or more days per week. Around one in five-children ate ivy gourd leaves two or more days in the week prior to the survey. Around onein five children ate ivy gourd leaves only one day in the week prior to the survey. Fewer thanone in twenty children ate cassava leaves two or more days in the week prior to the survey.
Graph 7. Frequency of consumption of various DGLVs by preschool children (12-59months old) in Takeo Province 1996.
Proportion of children (%)
Table 11 shows the animal scores, the plant scores, the weighted plant scores and thecombined scores for the selected communities. The cutoff value of <_ 6 days/week forcombined animal and weighted plant sources of beta-carotene indicates public health risk ofvitamin A deficiency in project areas. Those communities that have scores significantly (p <0.05 using a one-tailed test) above the cutoff are highlighted with bold and italics in table 11.
12

Table 11. Combined food frequency scores for preschool children (12-59 months old) inselected communities of Takeo Province 1996.
Animal Plant Scores Combined Scores Unweighted Weighted Scores Lower 95%Village Mean Mean Mean Mean Confidence LimitsKnah Roh 6.03 4.62 0.77 6.80 5.75Hong Haeng 3.97 5.1 0.85 4.82 4.04Tah Dok Pong 3.03 3.36 0.56 3.59 2.90Kam Por 4.77 4.74 0.79 5.56 4.51Trapi ang Veng 4.70 4.38 0.73 5.43 4.51Dok Po 4.83 6.66 1.11 5.94 4.92Srei Chey 4.41 5.82 0.97 5.38 4.50Chom Pul 4.27 4.2 0.70 4.97 4.06Trapi ang Kak 4.17 4.44 0.74 4.91 4.04Trapi ang Pring 3.90 5.22 0.87 4.77 4.08Rum Pek Pen 3.3 4.56 0.76 4.06 3.32Tah So 8.69 6.18 1.03 9.72 8.47Trapi ang Chuk 5.5 4.74 0.79 6.29 5.17Prey Cheut eat 6.25 5.4 0.90 7.15 5.95Rum Lech Svey 6.40 3.42 0.57 6.97 6.01Sro Nge 3.77 4.86 0.81 4.58 3.58
One out of three communities are above the cut off value for community risk ofdeficiency (see graph 8); one out of five communities are signifcantly above the cutoff values(at p < 0.05). Fewer communities are classified as vitamin A deficient using animal scoresthan using combined scores.

Graph & Combined food frequency scores for preschool children (12-59 months old) inTakeo Province 1996.
Location
The average animal, plant and combined food frequency scores for the surveyedpreschool children surveyed in Takeo Province and the subsample in Samrong District in Julyto August 1996, as well as the sample surveyed in Samrong District in March 1994 arepresented in table 12. All of the combined are below the cutoff for risk of vitamin Adeficiency.
Table 12. Combined food frequency scores for preschool children (12-59 months old) inTakeo Province July to August 1996 and Samrong District March 1994 and July toAugust 1996
Animal Plant ScoresScores Unweighted Weighted Combined Scores
Lower 95%District & Year Mean Mean Mean Mean Confidence Limits
Takeo Province 1996 4.84 4.92 0.82 5.66 5.41Samrong District 1996 4.51 6.90 0.83 5.34 4.99Samrong District 1994 3.36 2.88 0.48 3.84 3.64
The frequency of consumption of combined sources of vitamin A increasedsignificantly in Samrong District from March 1994 to July to August 1996, but did not attainadequate levels of intake to eliminate the risk of vitamin A deficiency (see graph 9).
14

Graph 9. Combined food frequency scores forpreschool children (12-59 months old) inTakeo Province July to August 1996 and Samrong District March 1994 and July to
August 1996
Location & Survey Year
D. Consumption of fat and oilsFats and oils are important for the absorption of vitamin A from beta-carotene-rich
fruits and vegetables. Butter and cod liver oil are animal sources of vitamin A that are alsogood sources of fat. Red palm oil is a plant source of beta-carotene that is also rich in fat.Unfortunately, few of the surveyed preschool children ate these foods. The other source offats and oils that were on the questionnaire were foods cooked in fats and oils and coconut(see table 13). Slightly less than four out of five of the children ate foods cooked in fats andoils at least one day in the week prior to the survey. About one out of five children atecoconut in the week prior to the survey.
15

Table 13. Frequency of consumption of fats and oils by preschool children (12-S9months old) in Takeo Province 1996.
Foods cooked with fatsDays in the or oils Coconut
last week n % n %7 37 7.7% 4 0.8%6 13 2.7% 2 0.4%5 37 - 7.7% 4 0.8%4 49 10.2% 8 1.7%3 94 19.6% 9 1.9%2 107 22.3% 32 6.7%1 91 19.0% 56 11.7%Subtotal 428 89.2% 115 24.0%0 52 10.8% 365 76.0%Total 480 100.0% 480 100.0%
The surveyed preschool children ate foods cooked with fat or oil relatively frequently.'More than one out of four children ate foods cooked with fat or oil four or more days in theweek prior to the survey; around two out of three children had eaten foods cooked with fat oroil two or more days (see graph 10). Coconut was consumed relatively infrequently. Onlyaround one out of ten children ate coconut two or more days in the last week.
Graph 10. Frequency of consumption of fats and oils by preschool children (12-59months old) in Takeo Province 1996.
Proportion of children (%)
E. Consumption of protein-rich foods
Foods rich in protein are important for the utilization of vitamin A. Many of theanimal sources of vitamin A are also good sources of protein. These foods include liver, eggsand small fish with the liver intact. As mentioned previously these foods are consumed by agood proportion of the surveyed preschool children and eaten relatively frequently. Milk is
16

also a good source of protein, but powdered milk and sweetened condensed milk were eatenby less than one in ten children.The other foods protein-rich foods that were included on the questionnaire were meatsuch as beef or pork, fresh water fish, and poultry such as chicken or duck (see table 14).Meat and fish were eaten by more than four out of five of the surveyed preschool children inthe week prior to the survey. Poultry was eaten by fewer children; around half of thesurveyed children had eaten poultry in the week prior to the survey.
Table U 4. Frequency of consumption of protein-rich foods by preschool children (12-59months ola in Takeo Province 1996
M eat Fresh water fish PoultryDays in the n % n % n %
last week7 23 4.8% 76 15.8% 7 1.5%6 5 1.0% 17 3.5% 1 0.2%5 . 21 4.4% 42 8.8% 4 0.8%4 42 8.8% 53 11.0% 10 2.1%3 78 16.3% 90 18.8% 42 8.8%2 93 19.4% 75 15.6% 81 16.9%1 . 142 29.6% 63 13.1% 120 25.0%Subtotal 404 84.2% 416 86.7% 265 55.2%0 76 15.8% 64 13.3% 215 44.8%Total 480 100.0% 480 100.0% 480 100.0%
The frequency of consumption of protein-rich foods by the surveyed preschoolchildren is illustrated in graph 11. Fresh water fish were eaten by children more frequentlythan meat. More than one in eight children ate fresh water fish every day in the week prior tothe survey. More than one in five children ate meat only one day per week. Poultry wasmainly eaten only one day per week.
17
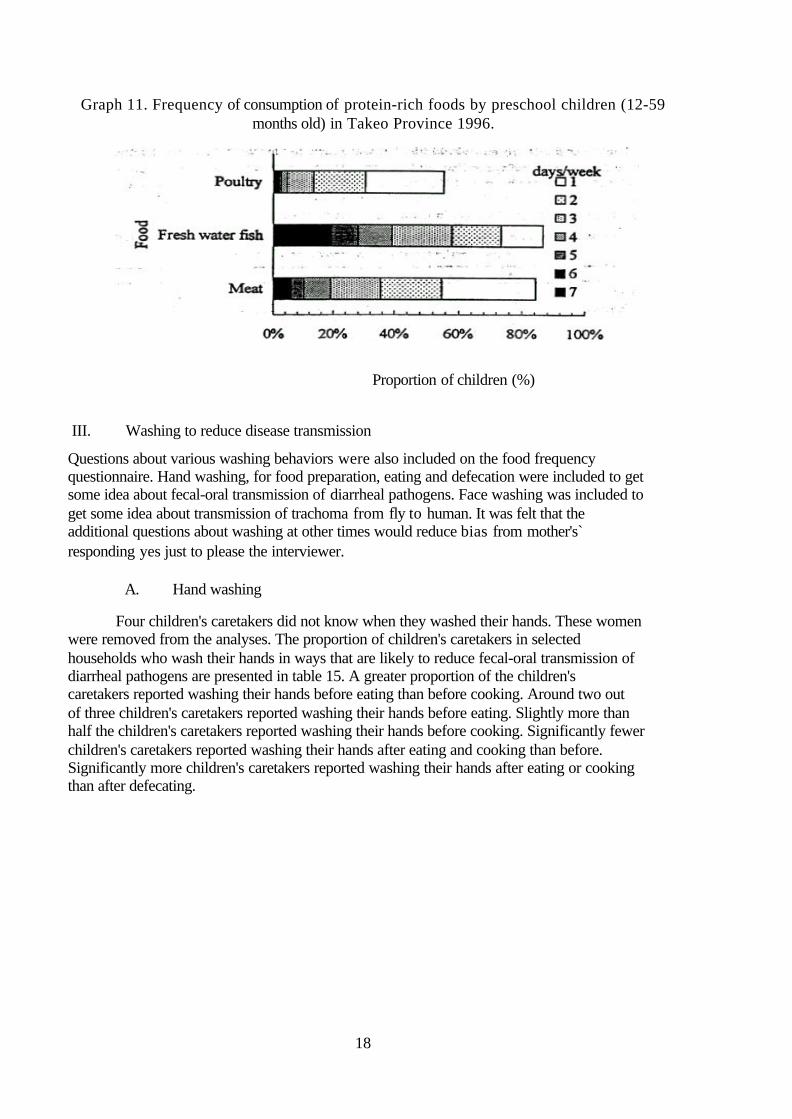
Graph 11. Frequency of consumption of protein-rich foods by preschool children (12-59months old) in Takeo Province 1996.
Proportion of children (%)
III. Washing to reduce disease transmission
Questions about various washing behaviors were also included on the food frequencyquestionnaire. Hand washing, for food preparation, eating and defecation were included to getsome idea about fecal-oral transmission of diarrheal pathogens. Face washing was included toget some idea about transmission of trachoma from fly to human. It was felt that theadditional questions about washing at other times would reduce bias from mother's`responding yes just to please the interviewer.
A. Hand washing
Four children's caretakers did not know when they washed their hands. These womenwere removed from the analyses. The proportion of children's caretakers in selectedhouseholds who wash their hands in ways that are likely to reduce fecal-oral transmission ofdiarrheal pathogens are presented in table 15. A greater proportion of the children'scaretakers reported washing their hands before eating than before cooking. Around two outof three children's caretakers reported washing their hands before eating. Slightly more thanhalf the children's caretakers reported washing their hands before cooking. Significantly fewerchildren's caretakers reported washing their hands after eating and cooking than before.Significantly more children's caretakers reported washing their hands after eating or cookingthan after defecating.
18
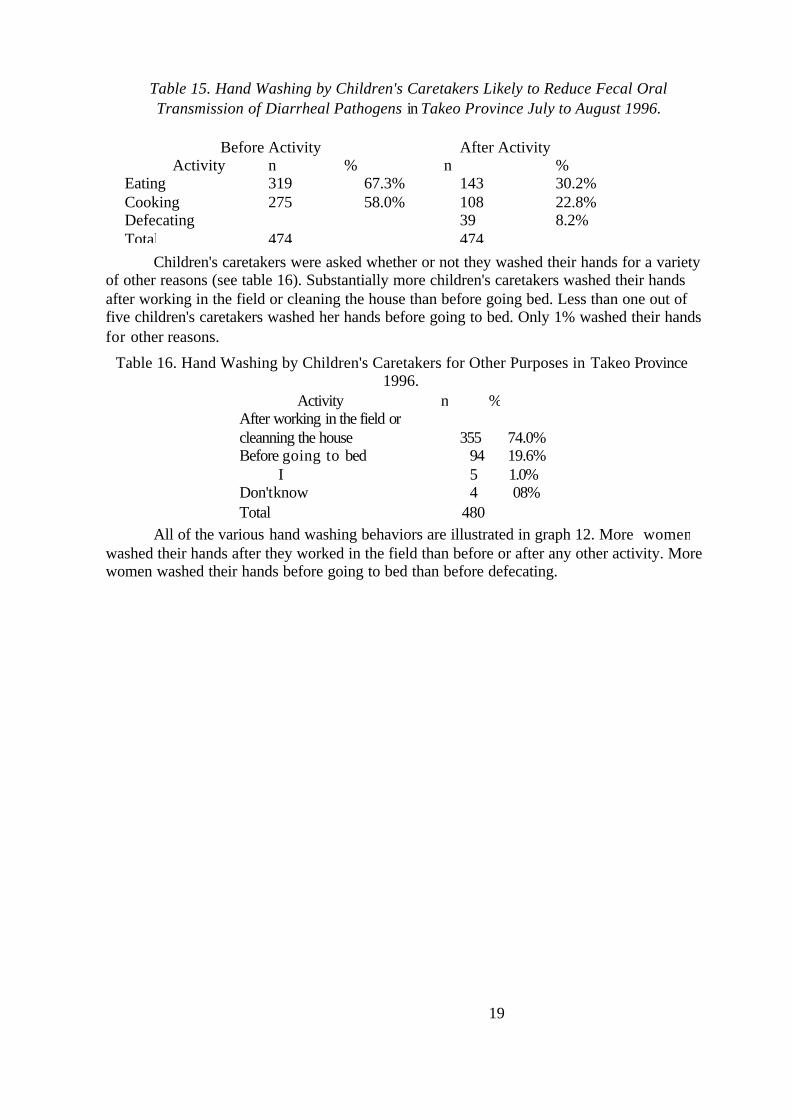
Table 15. Hand Washing by Children's Caretakers Likely to Reduce Fecal OralTransmission of Diarrheal Pathogens in Takeo Province July to August 1996.
Children's caretakers were asked whether or not they washed their hands for a varietyof other reasons (see table 16). Substantially more children's caretakers washed their handsafter working in the field or cleaning the house than before going bed. Less than one out offive children's caretakers washed her hands before going to bed. Only 1% washed their handsfor other reasons.
Table 16. Hand Washing by Children's Caretakers for Other Purposes in Takeo Province1996.
Activity n %After working in the field orcleanning the house 355 74.0%Before going to bed 94 19.6%
I 5 1.0%Don't know 4 08%Total 480
All of the various hand washing behaviors are illustrated in graph 12. More womenwashed their hands after they worked in the field than before or after any other activity. Morewomen washed their hands before going to bed than before defecating.
19
Before Activity After ActivityActivity n % n %
Eating 319 67.3% 143 30.2%Cooking 275 58.0% 108 22.8%Defecating 39 8.2%Total 474 474

Graph I2. Hand Washing by Children's Caretakers in Takeo Province 1996.
Proportion of respondents (%)
Children's caretakers were asked, to qualitatively, assess the frequency of their use of.soap while washing their hands (see table 17). Very few children's caretakers reported thatthey never used soap: around one in twenty. Around one in eight children's caretakersreported that they almost never used soap. More children's caretakers reported using soapalways or most of the time than never or almost never.
Table 17. Use of Soap For Hand Washing by Children's Caretakers in Takeo Province1996.
Frequency n %.Always 65 I3.7%Most of the time 145 30.5%Sometime 173 36.4%Almost never 67 14.1%Never 25 53%Total 475
B. Face washing
Children's caretakers were asked how many times a day they washed their child's face(see table 18). Face washing appears to be a common practice. Almost all caretakers washedtheir children's face at least once a day.
20

Table 18 Frequency of Washing Children's Faces in Takeo Province 1996.
Frequency7 2 0.4%6 3 06%5 19 4.0%4 28 5.8%3 192 40.0%2 153 319%1 71 14.8%Subtotal 468 97.5%0 12 25%Total 480 100.0%
Graph 13 illustrates the distribution of how frequently caretakers washed theirchildren's faces. Around one out of ten caretakers washed her children's faces five or moretimes a day; one out of two caretakers washed their children's faces three or more times aday; and more than four out of five caretaker's washed their children's faces two or moretimes a day.
Graph 13. Frequency of Washing Children's Faces in Takeo Province 1996.
Proportion of children (%)
IV. Introduction of breast milk
Questions were included about the timing of when breast milk is introduced afterdelivery because colostrum is extremely rich in vitamin A. Moreover, the introduction ofbreast milk soon after delivery has been shown to influence the duration of breastfeeding,particularly during the first four to six hours after delivery. The nutrient composition andcolor of breast milk soon after delivery is different from the breast milk that is produced later.Because of the differences in nutrient content and color, the first milk is referred to ascolostrum. The content of vitamin A is highest immediately after delivery and declines rapidlyduring the first three days. Hence this time interval is important for the intake of vitamin A bythe infant. The term "yellow milk" was used on the questionnaire in order to elicit mother's
21
responses about colostrum. The time of introduction of breast milk and of "yellow milk" orcolostrum are presented in table 19. Only four women reported that they did not know whenthey introduced breast milk; only five women reported that they did not know when theyintroduced "yellow milk". Almost all women reported that they introduced breast milk totheir infants.
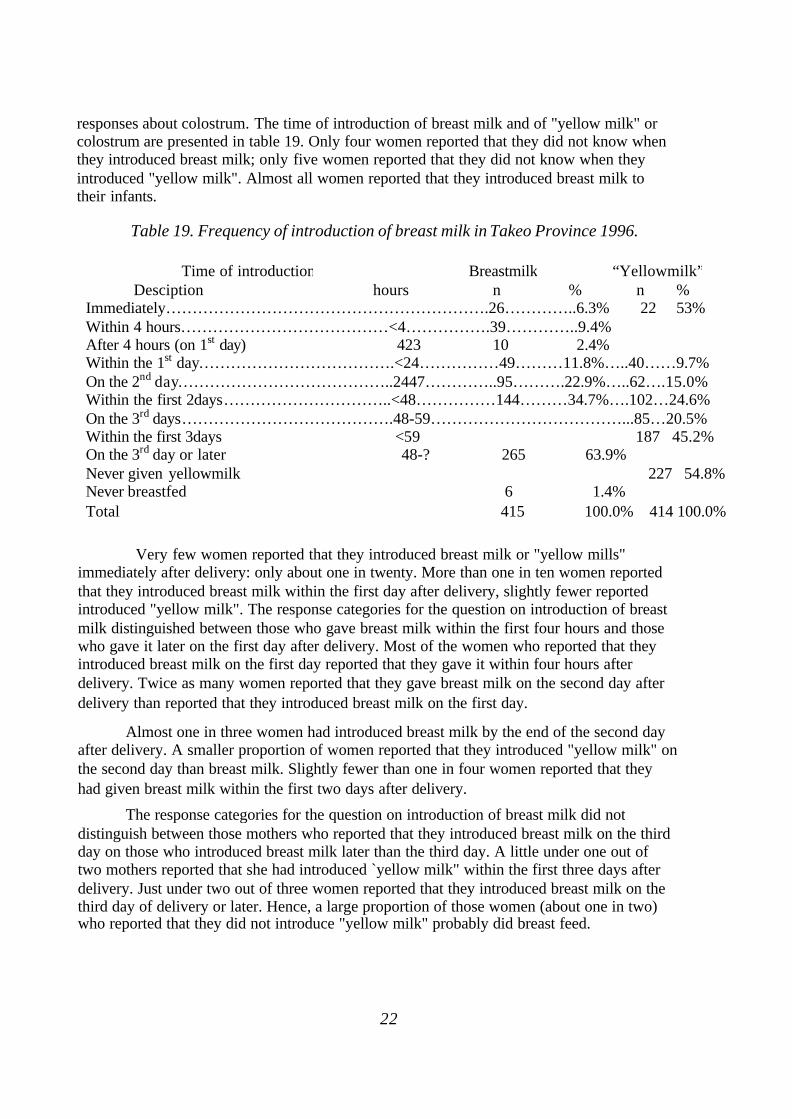
Table 19. Frequency of introduction of breast milk in Takeo Province 1996.
Very few women reported that they introduced breast milk or "yellow mills"immediately after delivery: only about one in twenty. More than one in ten women reportedthat they introduced breast milk within the first day after delivery, slightly fewer reportedintroduced "yellow milk". The response categories for the question on introduction of breastmilk distinguished between those who gave breast milk within the first four hours and thosewho gave it later on the first day after delivery. Most of the women who reported that theyintroduced breast milk on the first day reported that they gave it within four hours afterdelivery. Twice as many women reported that they gave breast milk on the second day afterdelivery than reported that they introduced breast milk on the first day.
Almost one in three women had introduced breast milk by the end of the second dayafter delivery. A smaller proportion of women reported that they introduced "yellow milk" onthe second day than breast milk. Slightly fewer than one in four women reported that theyhad given breast milk within the first two days after delivery.
The response categories for the question on introduction of breast milk did notdistinguish between those mothers who reported that they introduced breast milk on the thirdday on those who introduced breast milk later than the third day. A little under one out oftwo mothers reported that she had introduced `yellow milk" within the first three days afterdelivery. Just under two out of three women reported that they introduced breast milk on thethird day of delivery or later. Hence, a large proportion of those women (about one in two)who reported that they did not introduce "yellow milk" probably did breast feed.
22
Time of introduction Breastmilk “Yellowmilk”Desciption hours n % n %
Immediately…………………………………………………….26…………..6.3% 22 53%Within 4 hours…………………………………<4…………….39…………..9.4%After 4 hours (on 1st day) 423 10 2.4%Within the 1st day……………………………….<24……………49………11.8%…..40……9.7%On the 2nd day…………………………………..2447…………..95……….22.9%…..62….15.0%Within the first 2days…………………………..<48……………144………34.7%….102…24.6%On the 3rd days………………………………….48-59………………………………...85…20.5%Within the first 3days <59 187 45.2%On the 3rd day or later 48-? 265 63.9%Never given yellowmilk 227 54.8%Never breastfed 6 1.4%Total 415 100.0% 414 100.0%
V. Discussion
There is an age bias towards older preschool children in the households selected forthe survey. This bias towards older children could be due to: (i) an abrupt decline in thebirthrate after 1991, (ii) age clumping, whereby children's caretaker's tended to round off thechild's age to a fixed age such as five years old when the child was actually four years and tenmonths, (iii) overreporting of children as five years old who were actually six years old orolder so that the household could be included in the survey, or (iv) some other bias that led toselection of households with older children. It seem unlikely that a decline in the birthratecould have been so dramatic as to have produced half as many four years olds as five year oldand then remained consistent thereafter. Rounding up of ages is a commonly noted practice inmany cultures, so it seems likely that some rounding up did occur. Still, one would haveexpected a much lower proportion of four year olds if rounding up explained the reason forsuch a large proportion of five years olds in the sample. The third option of including childrenwho were actually six years old seems to be the most likely explanation.
The age distribution of the children that were selected from each household for theinterview on frequency of food consumption is almost identical to the distribution of childrenin the selected households. Hence, the sampling of children within the household was unlikelyto have been biased from the total sample. This indicates that the survey workers do notappear to have favored older children in the selection process. The implications of the apparent bias in the age distribution are that comparisons withthe earlier survey conducted in Samrong District in March 1994 might not be completely validsince the age distribution may have been different. The earlier survey did not record ages onthe children in selected in the households so it is not possible to correct for differences in theage distribution.There does not appear to be any particular bias towards overreporting the frequencyof consumption of foods based on the reporting of key food items such as chili peppers. Thevariation in responses and patterns are consistent with those found in other countries. Itseems unlikely that children's caretakers were able to distinguish between those foods thatspecifically related to vitamin A and specifically provide responses for those foods just toplease the interviewers.
The increase in consumption of animal sources of vitamin A could be due to: (i)increased food purchasing power from 1994 to 1996, (ii) increased seasonal availability ofsmall fish from March to July to August, (ii) increased availability of small fish from 1994 to1996, or (iii) response to nutritional education messages. The only animal source of vitamin Athat increased in the District of Samrong from March 1994 to July to August 1996 was smallfish with liver. Many of the United States private voluntary organizations (PVOs) and localnongovernmental organizations (NGOs) that had worked on nutrition education messagesconcentrated on promoting dark green leafy vegetables including Helen Keller International.Hence it is likely that the change in consumption of small fish with liver was unrelated tonutrition education. Hence the change is more likely due to the first two reasons or somecombination thereof.
The change in the animal food frequency scores in Samrong District from 1994 to1996 is almost entirely due to increases in small fish with liver. Moreover, if the animal food
23

frequency scores for Takeo Province in 1996 did not include small fish with liver, most of thecommunities and the average for the province would be below the cutoff. The one majorquestion of concern about the small fish is whether or not the liver is left in the fish. If thiskey fact is incorrectly reported, the adequacy of vitamin A intake is called into question.Hence, before Takeo Province is declared to have an adequate consumption of vitamin A-richfoods, this question needs to be answered and to be on the safe side, consumption of otheranimal sources of vitamin A should be improved as well.
The increase in consumption of plant sources of beta-carotene could be due to (i)increased food purchasing power, (ii) increased availability of beta-carotene-rich fruits andvegetables from 1994 to 1996, (iii) seasonal variation in the availability of beta-carotene-richfruits and vegetables between March and July to August, or (iv) a response to, nutritioneducation messages.The strength of the increase in consumption of ripe pumpkin and chun or laucama fruitseems to indicate that most likely explanation is an increase in the seasonal availability of thesefoods. These foods were not promoted as part of nutritional education messages. Since someof the increase could be due to increased food purchasing power or a general increase inavailability from 1994 to 1996, it is important to monitor the trends in consumption of thesefoods over time to determine the magnitude of the seasonal effect:
The consumption of DGLVs only increased slightly, but given the high proportion ofchildren who were already eating DGLVs in March 1994, the amount of increase that waspossible is minimal. This increase could have been due to some of the messages aboutDGLVs.
The large discrepancy between the apparent adequacy of the animal scores and thecombined animal and weighted plant scores is unprecedented in the use of this food frequencymethod by HKI. The original validation study did not include cases where the animal scoreswere well above the cutoff, while the plant scores were so low that the combined scoresremained below the cutoff Given that the animal scores are almost entirely dependent uponconsumption of small fish with liver, it seems much more prudent to continue to improve bothconsumption of other animal sources of vitamin A as well as plant sources of beta-carotene.
In terms of other foods, a fair proportion of children are eating foods that are cookedin fats or oils. The frequency could be increased. The consumption of foods rich in proteinappears to be quite good. The project had considered fish ponds as an intervention toincrease consumption of protein. The fact that nine out of ten children are already eating fishseems to indicate that availability of fish is not a constraint for consumption. It is unlikely thatfish ponds will have a substantial impact on nutrition, although income might improve. .
Given the greater proportion of mothers who report that they washed their hands afterworking in the fields, it is unlikely that there is much bias in self-reported hand washing.Clearly, hand washing after defecation stands out as the least frequent and most importantwashing behavior one could promote. There are ample opportunities for fecal-oraltransmission even without direct involvement in food preparation and eating. Given thatalmost all mothers reported that they use soap at one time or another, it seems feasible toencourage greater use of soap for hand washing as well.
24

Face washing see ms to be an accepted practice. The frequency of face washingcoupled with use of soap shoud also be encouraged.
The questions on introduction of breast milk compared with questions on introductionof "yellow milk" point to a potential confusion in mother's minds and perhaps that of theinterviewers concerning t h e concept of colostrum. All breast milk in the first three days isconsidered colostrum. So the reporting of introduction of breast milk and of nostrumshould have been identical. It is possible that mother's might be discarding some of the fat-rich fore milk and retaining the much more dilute hind milk. This possibility should beexplored with some in-depth interviews.
What is very clear is that very few women are introducing breast milk on the first day,let alone within the first few hours after delivery. Even by the second day, the proportion ofwomen introducing breast milk is woefully inadequate for infants to benefit from the vitaminA, other nutrients, and protective effects of colostrum. It is unfortunate that the responsesfor the introduction of breast milk did not include that very important third day after deliverysince responses to the "yellow milk" question appear to have been subject to underreporting.This response would have provided information about the critical time period when breastmilk is still exceedingly rich in vitamin A.
VT. Recommendations
Given the potential for seasonal variation in food consumption, it is highlyrecommended that a second survey be conducted in March 1997. This should provide criticalinformation about the patterns of consumption in Takeo Province.
The Nutrition Communication Committee has already gathered a great deal ofinformation about food preferences, taboos and uses during illness. This information shouldbe used to develop messages for foods other than DGLVs alone!. The survey clearly showsthat a large proportion of children already eat DGLVs. Moreover, recent evidence fromIndonesia has shown that the beta-carotene from DGLVs did not improve vitamin A status ashad been expected. When DGLVs were combined with sweet potatoes, however,improvements in vitamin A status were observed (see Nutrition NewsNotes) With so manyother beta-carotene rich plants and vitamin A-rich animal foods available and consumed inCambodia, the Nutrition Communication Comm mittee should seize the opportunity to promotethese other foods that are much more likely to lead to improvements in vitamin A statu us
The Nutrition Communication Committee should conduct a small qualitativeevaluation to explore the issue of whether or not the liver is removed from small fish.. Thisissue has tremendous implications for the adequacy of consumption of v itamin A in TakeoProvince. Based on the findings of this evaluation, appropriate messages' can be designed toencourage women to keep the liver in small fish or, if the obstacles are too great, to Placegreater emphasis on other animal sources of vitamin A.
Based on the findings of the baseline survey, the objective for consumption of vitaminA-rich foods should be revised as follows:
25

• increase the frequency of consumption of vitamin A -rich foods by preschool children in100% of the project communities to significantly above adequate levels (animal scores > 4and combined scores > 6) by the end of the project
The findings also seem to indicate that fish ponds are not warrented as an interventionto improve nutritional status.
Hand washing before cooking and eating are practiced by a relatively large proportionof women, whereas hand washing after defecation is not. While some additional improvementsmight be made in hand washing before cooking and eating, the magnitude of the impact is notlikely to be nearly as great as that possible for hand washing after defecation. The reasons fornot washing after defecation need to be explored by the Nutrition Communications Committeein order to design appropriate messages to promote this behavior. Based on the findings ofthe baseline survey, the objective for hand washing behavior should be revised as follows:• increase the proportion of children's caretakers who wash their hands after defecating
to50% by the end of the project.
• increase the proportion of children's caretakers who train their children to wash theirhands after defecating to 30% by the end of the project.
• increase the proportion of children whose faces are washed at least three times a day to70% by the end of the project.
Since the Nutrition Communication Committee is currently promoting vitamin A-richfoods, the next item that they should consider in a second phase of message developmentwould be introduction of breast milk within the first day after delivery. This issue isparticularly difficult and should therefore, be planned for year three of the project after,
adequate qualitative research is conducted on the reasons mothers delay the introduction ofbreast milk. Based on the findings of the baseline survey, the objective for introduction ofbreast milk should be revised as follows:
• increase the proportion of mothers who introduce breast milk within the first four hoursafter delivery to 20% by the end of the project.