Hein van Hout coordinator - IBenCibenc.eu/ibenc_downloads/02.-IBenC_intro-HvHout.pdfHein van Hout...
21
Introduction Hein van Hout coordinator Identifying best practices for care-dependent elderly by Benchmarking Costs and outcomes of Community Care
Transcript of Hein van Hout coordinator - IBenCibenc.eu/ibenc_downloads/02.-IBenC_intro-HvHout.pdfHein van Hout...
Introduction
Hein van Hout
coordinator
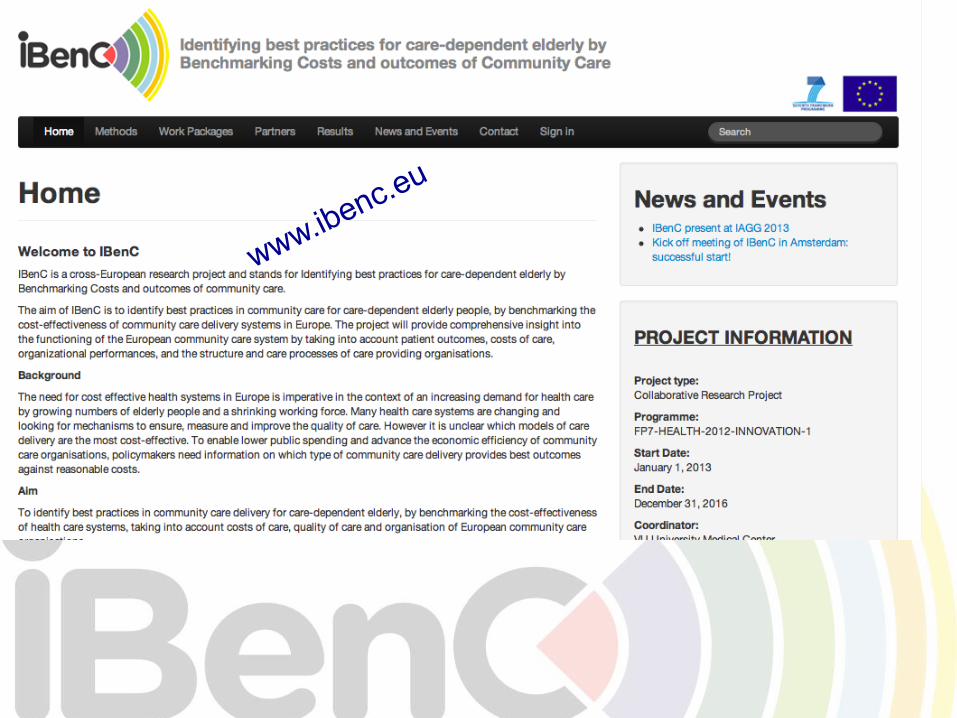
Identifying best practices for care-dependent elderly by Benchmarking Costs and outcomes of Community Care

Mission (im)possible?

Projection of ageing and costs of long term care

European variation in care systems
• Population
• Governmental policy
• Governmental spending long term care
• Reimbursement
• Availability (in)formal care
• Accessibility and equity
Van Eenoo et al, 2015
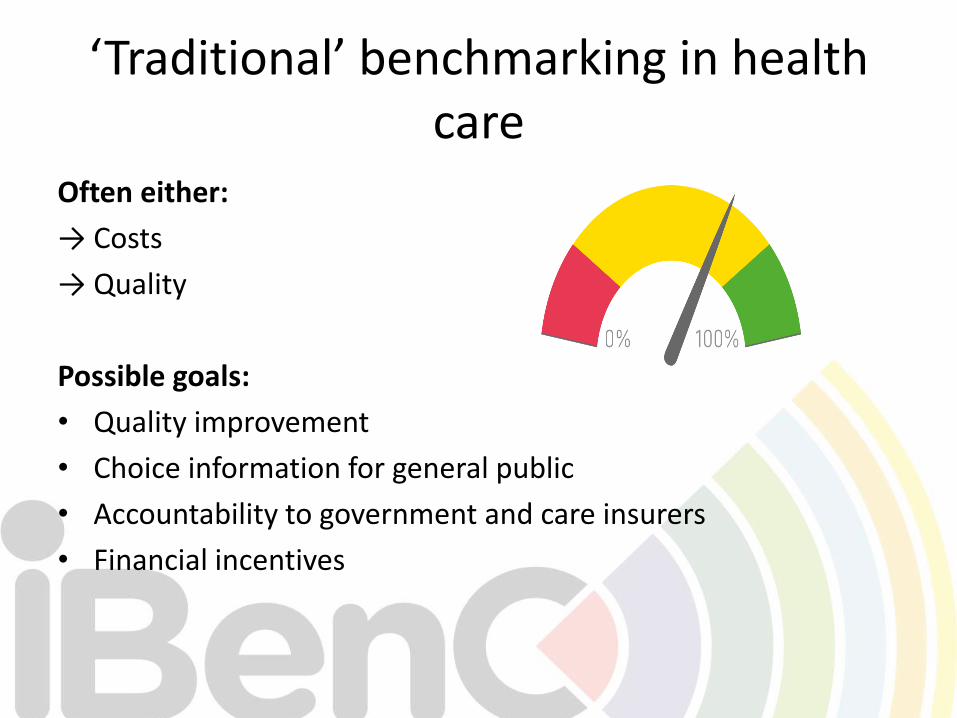
‘Traditional’ benchmarking in health care
Often either:
→ Costs
→ Quality
Possible goals:
• Quality improvement
• Choice information for general public
• Accountability to government and care insurers
• Financial incentives

What’s new?
• Integrating quality of care & costs of care metrics
• Data derived from routine care assessments
• Relate country, organisation and staff characteristics to costs and quality of care
Method to learn from other organisations & regions

Aim
To identify best practices in community health care delivery for care-dependent elderly
HowDevelop and test a new method to benchmark thecosts & quality, and relate this to the organisation of community care

Structure and outline
PHASE 3:
DATA ANALYSIS
MANAGEMENT AND
COORDINATION
DISSEMINATION
PHASE 1:
PREPARATION
WP 1
Project management and coordination
WP 3 Recruitment and assessment
PHASE 2: METHOD DEVELOPMENT
AND ASSESSMENTS
WP 5 Benchmarking costs of care
WP 8 Dissemination of IBenC results
WP 6 Identify care models for community care in health systems in six countries
WP 7 A benchmarking method to identify cost-effective practices
WP 4 Data management
WP 2
Benchmarking quality of care
1
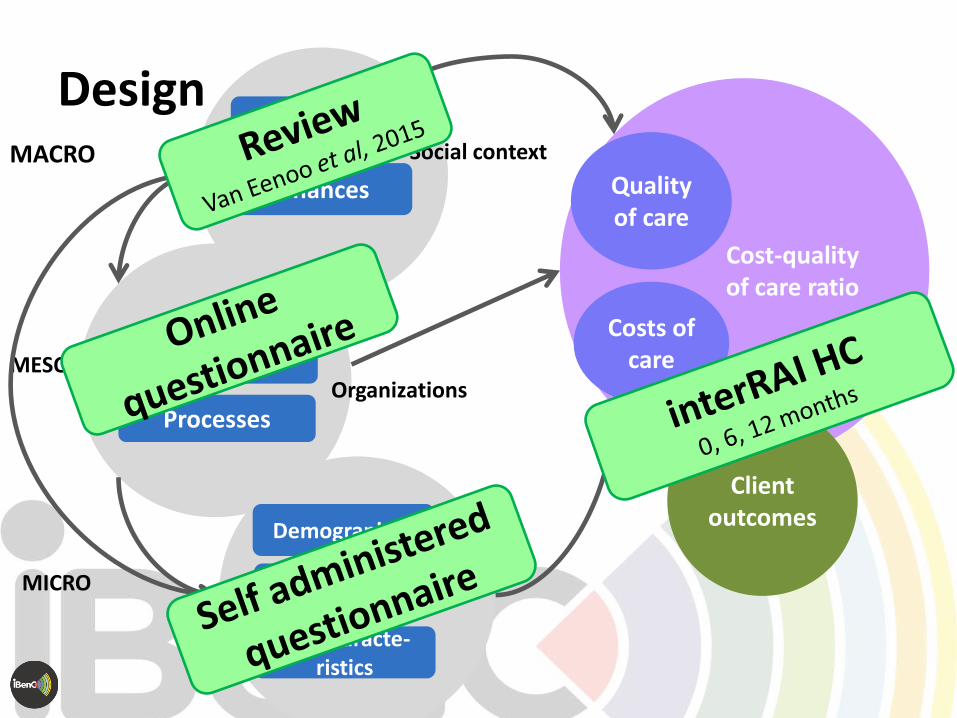
Cost-quality of care ratio
Quality of care
Costs of careStructure
Policy
Processes
Finances
Job characte-ristics
Personal characteristics
Demographics
Clientoutcomes
MACRO
MESO
MICRO
DesignSocial context
Organizations
Staff

interRAI-Home Care (HC)
31,2%68,8%
• Standardized comprehensive geriatric assessment instrument (300+ items)
• Used in Routine care in many countries
Decision support for Multiple purposes:
→ Scales for monitoring clients
→ Risk triggers for individualized care planning
→ Quality indicators (23 HCQIs, 2 summaries)
→ Staff resource planning (RUG-III/HC)
→ Resource use -> Care costs
Hirdes et al, 2008

nc = 499 no = 2
nc = 491 no = 3
nc = 420 no = 1
nc = 456 no = 3
nc = 493 no = 11
2884
38
1067
nc = 525 no = 18
IBenC study sample
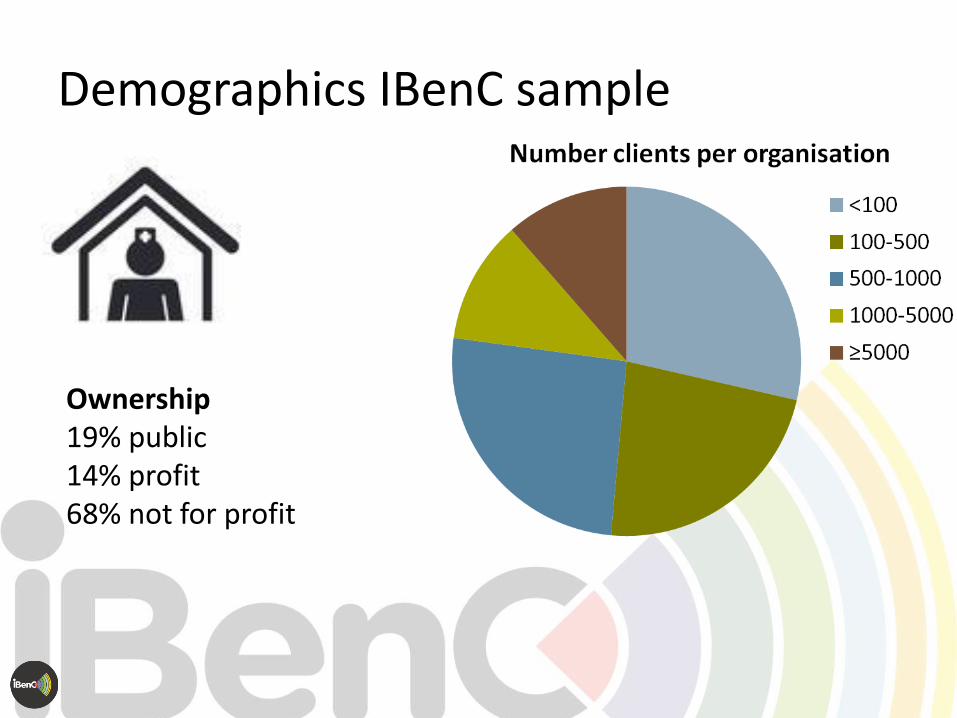
Demographics IBenC sample
Ownership19% public14% profit68% not for profit
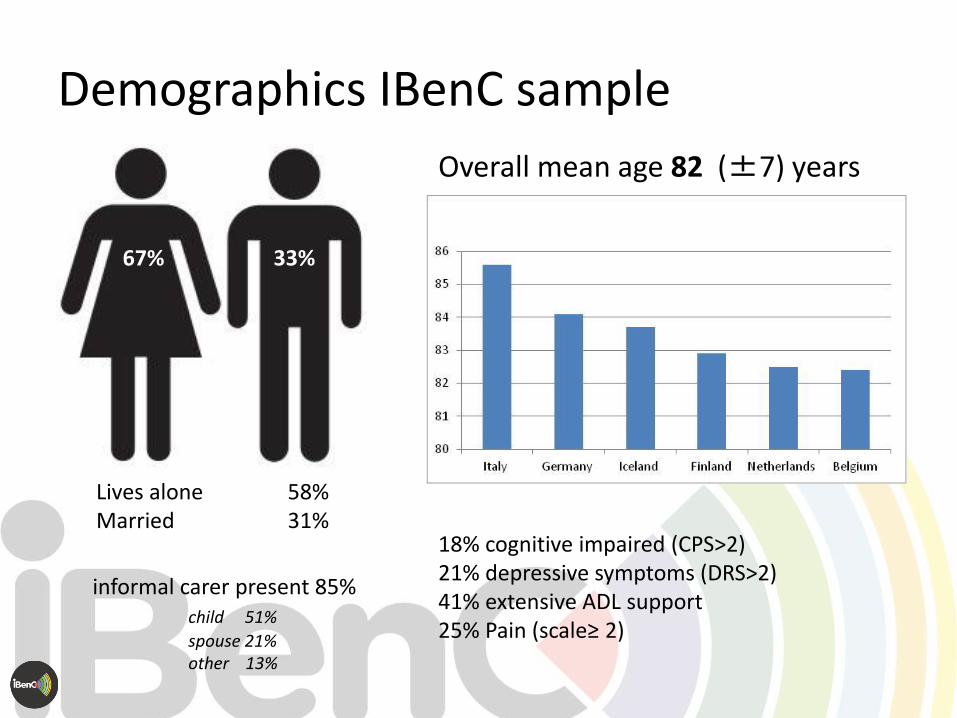
Demographics IBenC sample
Overall mean age 82 (±7) years
18% cognitive impaired (CPS>2)21% depressive symptoms (DRS>2)41% extensive ADL support25% Pain (scale≥ 2)
33%67%
Lives alone 58%Married 31%
informal carer present 85%child 51%
spouse 21%other 13%

311
312
313
321
331
332
333
334
335
341
342
0,0
1,0
2,0
3,0
4,0
5,0
6,0
0,0 0,5 1,0 1,5 2,0 2,5 3,0 3,5 4,0
Me
an A
DL
Hie
rarc
hy
Scal
e s
core
Mean Cognitive Performance Scale score
Impairment∆ Italy∆ The Netherlands∆ Belgium∆ Iceland∆ Finland
∆ Germany
Variation across organisations & countries

313
321
331
332
333
335
341
342
401
501
0,0
2,0
4,0
6,0
8,0
10,0
12,0
14,0
0,0% 10,0% 20,0% 30,0% 40,0% 50,0% 60,0% 70,0%
# h
ou
rs p
rofe
ssio
nal
car
e
QI score
Performance Pain Italy
The Netherlands
Belgium
Iceland
Finland
Germany
Variation in quality outcomes: presence of pain

Benchmarking quality against costs
€High
low
quality of care outcomes
Low good

Mission (im)possible!
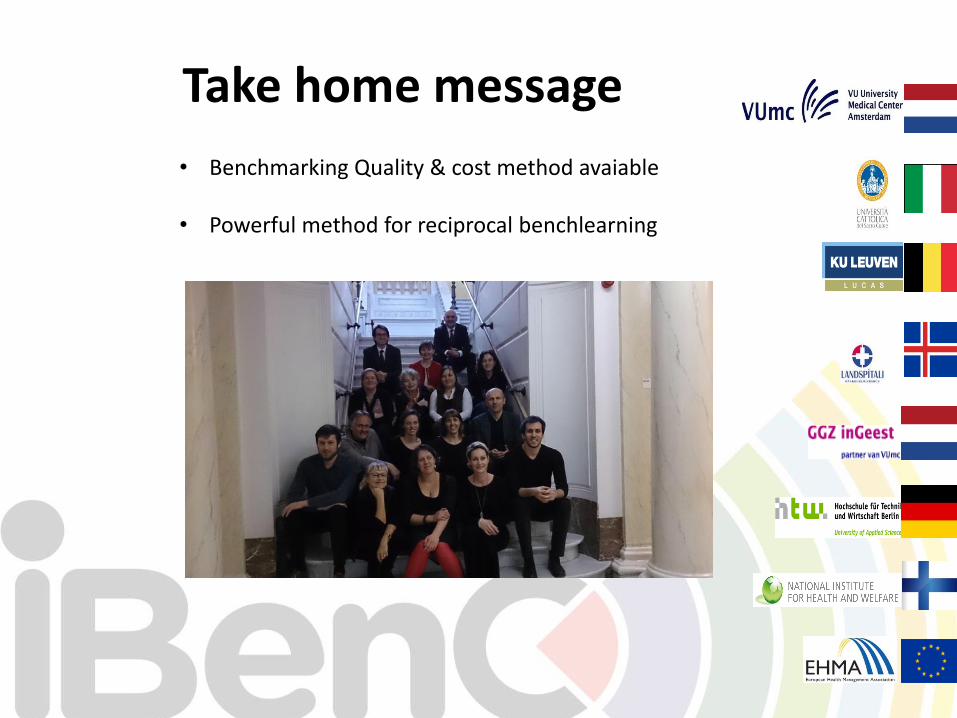
Take home message
• Benchmarking Quality & cost method avaiable
• Powerful method for reciprocal benchlearning

Benchmarking outcome(s)
Thank you
Questions?