HEHS-95-95 School Facilities: America's Schools Not Designed or ...
United States General Accounting Office
GAO Report to the Chairman, Subcommitteeon Human Resources, Committee onGovernment Reform and Oversight,House of Representatives
September 1998 BLOOD PLASMASAFETY
Plasma Product RisksAre Low if GoodManufacturingPractices Are Followed
GAO/HEHS-98-205

GAO United States
General Accounting Office
Washington, D.C. 20548
Health, Education, and
Human Services Division
B-278739
September 9, 1998
The Honorable Christopher ShaysChairman, Subcommittee on Human ResourcesCommittee on Government Reform and OversightHouse of Representatives
Dear Mr. Chairman:
Each year, an estimated 1 million people in the United States receiveproducts manufactured from human plasma. Many different componentsof plasma are used for medical treatment, ranging from treating the traumaof burns and surgery to replacing blood elements that are lacking as aresult of disease, such as hemophilia. In the 1980s, before the mechanismof HIV transmission was understood, many hemophilia patients usedplasma products made from donations by individuals infected with HIV,with 63 percent of all hemophilia patients in the United States becominginfected as a result. Many more contracted hepatitis B (HBV) and hepatitisC (HCV). While these diseases have been transmitted in many fewer casessince the introduction of antibody tests and viral inactivation and removalprocesses, some safety concerns remain.
One of these concerns relates to plasma donors, who are unpaid or paid.Through the volunteer sector, unpaid donors give whole blood, fromwhich the plasma may be separated and sent for further manufacturinginto plasma products. The commercial sector collects plasma from paiddonors, known as source plasma, for manufacture into these sameproducts. Some source plasma is also collected from unpaid donors. Therehas been a long-standing concern that the infectious disease rates amongpaid donors might be higher than those of volunteer donors because paiddonors may have a financial incentive to conceal risk factors that wouldprevent them from donating. Concerns have also been raised about thenumber of donors to whom a recipient is exposed because the productsare manufactured by pooling many donations. Further, the efficacy of viralclearance procedures used in manufacturing and the safety record of themanufacturers clearly affect the ultimate safety of the products.
In light of these concerns, you asked us to undertake a study to(1) compare the risk of incorporating an infectious unit of plasma intofurther manufacturing from volunteer versus paid plasma donors for HIV,HBV, and HCV; (2) examine the impacts on frequent and infrequent plasmausers when pooling large numbers of plasma donations into manufactured
GAO/HEHS-98-205 Blood Plasma SafetyPage 1
B-278739
plasma products; (3) assess the safety of end products from plasma afterthey have undergone further manufacturing and inactivation steps to killor remove viruses; and (4) examine the recent regulatory compliancehistory of plasma manufacturers.
In developing our information, we interviewed representatives of thevolunteer and commercial plasma sector and officials of the Food andDrug Administration (FDA). We also attended technical conferences andexamined the scientific literature on the collection and processing ofplasma products and current good manufacturing practices within theplasma industry. We obtained data from industry representatives fromwhich we calculated the chances of incorporating an infectious unit ofplasma into further manufacturing from volunteer and paid donors. We didnot independently verify data on infectious disease rates, but they are themost current and complete data available. We also obtained informationon the effect of the number of donations that are used in manufacturing onthe safety of the final products. We gathered information on the effect ofviral inactivation and removal techniques used to further reduce the risk ofviral transmission through plasma products. Finally, we obtainedinspection reports of plasma-derived-product manufacturing facilitiesfrom the FDA that showed the agency’s determination of whether thesefacilities were in compliance with current good manufacturing practices.We conducted our review from December 1997 to June 1998 in accordancewith generally accepted government auditing standards. (See app. I for afurther discussion of our methodology.)
Results in Brief Viral clearance techniques have made the risks of receiving an infectedplasma product extremely low when manufacturers follow all theprocedures in place to ensure safety. While paid plasma donors are overone and a half times more likely to donate potentially infectious units (1 inevery 3,834 units), a number of recent initiatives by the source plasmaindustry greatly reduce the chances of these units being pooled formanufacturing (to 1 in every 10,959 units). These initiatives include the useof only repeat donors (who have been found to have lower rates of viralinfection than first-time donors) and a 60-day inventory hold on all units toallow manufacturers to retrieve units from donors who subsequently testpositive or are otherwise disqualified. Even with these initiatives in place,the risks are still somewhat higher from plasma units donated by paiddonors than from volunteer donors (where 1 in every 15,662 units arepotentially infectious).
GAO/HEHS-98-205 Blood Plasma SafetyPage 2
B-278739
Limiting the number of donors whose plasma is pooled for production intoplasma products helps to reduce the risks of viral transmission for thosereceiving these products. Presently, a 60,000-donor limit has beenestablished for each individual plasma product. This effort has an impacton infrequent users by minimizing their exposure to a certain number ofdonors for the few times they would be infused with a plasma product. Forfrequent users of plasma products, such as severe hemophilia patients, thisdonor limit has a negligible impact because of the large number ofinfusions that they receive and, thus, the large number of pools that theywould be exposed to in the course of their lifetime.
A more significant step in reducing risk of infection occurs inmanufacturing—where all plasma products for intravenous use undergoviral removal, inactivation procedures, or both—which virtually eliminatesenveloped viruses such as HIV, HBV, and HCV. This is supported byepidemiological data on the transmission of viruses through plasmaproducts since the introduction of adequate viral removal and inactivationprocedures in the late 1980s as well as laboratory data that characterizethe effectiveness of viral clearance through these procedures. On the otherhand, these processes have limited effectiveness against non-lipidenveloped viruses such as hepatitis A (HAV) and human parvovirus.
Certain advances—such as voluntary initiatives by the commercial plasmaindustry, increasingly sophisticated screening tests that close the “windowperiod” between the time a donor becomes infected and the time aparticular laboratory test becomes positive, and viral removal andinactivation procedures—are only effective if the processes used toproduce finished plasma products adhere to current good manufacturingpractices. This, however, has not been the case with all of the majormanufacturing companies that produce plasma products. Recent FDA
inspection reports highlight numerous instances of noncompliance withcurrent good manufacturing practices. These problems have led to theimposition of consent decrees between FDA and two manufacturingcompanies, the temporary suspensions of production at onemanufacturing facility, and shortages of some plasma products. Althoughthere have been no known cases of transmission of HIV, HBV, or HCV fromplasma products during the time these problems were identified by FDA, itis clear that there were numerous instances of noncompliance in themanufacture of plasma products. Without strict adherence to current goodmanufacturing practices related to the efficacy of viral removal andinactivation procedures, the safety of these plasma products could becompromised. Actions being taken by FDA and the plasma manufacturers
GAO/HEHS-98-205 Blood Plasma SafetyPage 3
B-278739
since these problems were identified should help to alleviate some ofthese concerns.
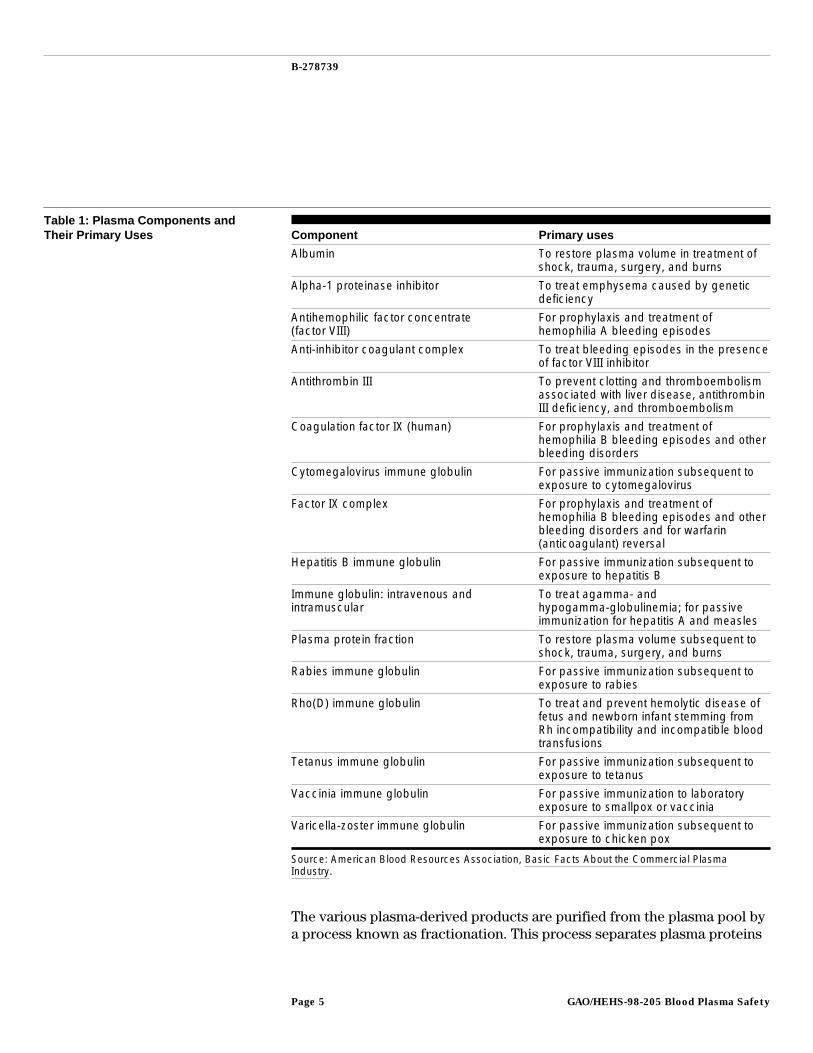
Background Plasma is the liquid portion of blood, containing nutrients, electrolytes(dissolved salts), gases, albumin, clotting factors, hormones, and wastes.Many components of plasma are used, and include treatments for thetrauma of burns and surgery and for replacing blood elements that arelacking as a result of disease, such as hemophilia. Table 1 lists the plasmacomponents that are currently available in the United States and theirprimary uses.
GAO/HEHS-98-205 Blood Plasma SafetyPage 4
B-278739
Table 1: Plasma Components andTheir Primary Uses Component Primary uses
Albumin To restore plasma volume in treatment ofshock, trauma, surgery, and burns
Alpha-1 proteinase inhibitor To treat emphysema caused by geneticdeficiency
Antihemophilic factor concentrate(factor VIII)
For prophylaxis and treatment ofhemophilia A bleeding episodes
Anti-inhibitor coagulant complex To treat bleeding episodes in the presenceof factor VIII inhibitor
Antithrombin III To prevent clotting and thromboembolismassociated with liver disease, antithrombinIII deficiency, and thromboembolism
Coagulation factor IX (human) For prophylaxis and treatment ofhemophilia B bleeding episodes and otherbleeding disorders
Cytomegalovirus immune globulin For passive immunization subsequent toexposure to cytomegalovirus
Factor IX complex For prophylaxis and treatment ofhemophilia B bleeding episodes and otherbleeding disorders and for warfarin(anticoagulant) reversal
Hepatitis B immune globulin For passive immunization subsequent toexposure to hepatitis B
Immune globulin: intravenous andintramuscular
To treat agamma- andhypogamma-globulinemia; for passiveimmunization for hepatitis A and measles
Plasma protein fraction To restore plasma volume subsequent toshock, trauma, surgery, and burns
Rabies immune globulin For passive immunization subsequent toexposure to rabies
Rho(D) immune globulin To treat and prevent hemolytic disease offetus and newborn infant stemming fromRh incompatibility and incompatible bloodtransfusions
Tetanus immune globulin For passive immunization subsequent toexposure to tetanus
Vaccinia immune globulin For passive immunization to laboratoryexposure to smallpox or vaccinia
Varicella-zoster immune globulin For passive immunization subsequent toexposure to chicken pox
Source: American Blood Resources Association, Basic Facts About the Commercial PlasmaIndustry.
The various plasma-derived products are purified from the plasma pool bya process known as fractionation. This process separates plasma proteins
GAO/HEHS-98-205 Blood Plasma SafetyPage 5
B-278739
based on the inherent differences of each protein. Fractionation involveschanging the conditions of the pool (for example, the temperature or theacidity) so that proteins that are normally dissolved in the plasma fluidbecome insoluble, forming large clumps called precipitate. The insolubleprotein can be collected by spinning the solution at high speeds or throughfiltration. One of the most effective ways for carrying out this process isthe addition of alcohol to the plasma pool while simultaneously coolingthe pool. For this reason, the process is sometimes called cold alcoholfractionation or ethanol fractionation. This procedure is carried out in aseries of steps so that a single pool of plasma yields several differentprotein products such as albumin and immune globulins.1
It is estimated that each year, as many as a million patients rely onproducts manufactured from human plasma: more than 400,000 are givenalbumin, 15,000 to 18,000 are given factor VIII, 3,000 to 5,000 receive factorIX, greater than 20,000 receive immune globulin intravenous (IGIV), and anestimated 100,000 to 500,000 receive immune globulin intramuscular(IGIM). Additional patients receive a variety of hyperimmune globulins andother specialized products.
Plasma Donation Plasma used for plasma-derived products manufactured and distributed inthe United States can only be collected at facilities registered with the FDA.Centers require donors to provide proof that they are legally in the UnitedStates and have a local permanent residence. About 85 percent of plasmais collected from paid donors in a commercial setting and is known assource plasma. Through a process known as plasmapheresis, the plasma isremoved and the red cells are reinfused into the donor. The remaining15 percent of plasma is collected from volunteer donors and is known asrecovered plasma. From the whole blood, plasma is “recovered”—that is,the red cells, platelets, and cryoprecipitate are separated for transfusionand the unused plasma is either transfused as plasma or sent for furthermanufacturing into plasma products. On the basis of a European Unionpolicy position, many European countries are working towardself-sufficiency in plasma products using an all-volunteer system, althoughmost countries continue to depend on U.S. products made from paiddonors and on source plasma obtained from U.S. donations.
1It can take up to 7 months from the time plasma is collected until there is a final product release.Approximate times for steps in this process include collection and testing of the plasma (10 days),inventory hold (60 days), staging and internal quality control (10 days), pooling of the plasma (1 to 2days), fractionation process (7 to 10 days), collection of intermediates and runs for internal qualitycontrol (20 days), preparation of final products (7 to 10 days), quality control testing prior to filling offinal product (25 to 28 days), and manufacture and FDA testing and release of final product (60 days).Recently, this last step has been reduced to 2 weeks or less for most products.
GAO/HEHS-98-205 Blood Plasma SafetyPage 6
B-278739
Units of plasma collected as source plasma contain approximately 825milliliters, while recovered plasma from whole blood donations containapproximately 250 milliliters. Thus, more than three times as manydonated units of recovered plasma are required to make up a pool of equalvolume to one made up of only source plasma.
Approximately 370 paid plasma collection centers annually collect about11 million liters of plasma from 1.5 million donors, involving a total ofapproximately 13 million separate donations each year. The industry,through its trade organization, the American Blood Resources Association,maintains a limited national donor deferral registry that is checked foreach first-time donor.2 This is a list of known donors who are unsuitablefor further donations because of positive test results. Repeat donors’records are checked at the plasmapheresis center where the plasma isremoved. Most of these centers also ensure that donors are not migratingfrom one center to another over the 48-hour minimum donation interval.3
The vast majority of source plasma is processed by four companies: AlphaTherapeutic Corporation, Baxter Healthcare Corporation, BayerCorporation, and Centeon LLC.
An additional 1.8 million liters of plasma are collected annually fromapproximately 8 million volunteer (not paid) donors who contribute 12 to13 million whole blood donations. Volunteer donors give blood atAmerican Red Cross blood centers and independent blood centersrepresented by America’s Blood Centers; the plasma is recovered forfurther manufacturing. Plasma collected by the American Red Cross isfractionated under contract by Baxter Healthcare and the Swiss Red Crossand returned to the American Red Cross for distribution. Plasma collectedat member facilities of America’s Blood Centers is currently sold only tothe Swiss Red Cross, which manufacturers the various plasma productsand sells them through U.S. distributors.
Paid donors typically receive between $15 and $20 for the 2 hours requiredto remove whole blood, separate the plasma from the cells and serum, andreinfuse the latter back into the donor. Source plasma donors may donate
2These 370 centers have been certified by the American Blood Resources Association. Under theassociation’s Quality Plasma Program, collection centers are inspected by a third party for complianceto specific standards, such as facility maintenance, employee training, and donor screening. There area total of 470 licensed plasma collection centers in the United States. The additional 100 centersinclude some whole blood facilities licensed to collect source plasma, centers that collect sourceplasma exclusively for export, and others. These centers do not provide source plasma to the fourmajor fractionators for U.S. production.
3For example, centers may mark different fingers with florescent dye or use other methods to identifydonors.
GAO/HEHS-98-205 Blood Plasma SafetyPage 7
B-278739
once every 48 hours but no more than twice a week. Whole blood donorscan donate only once every 56 days since their red cells are not reinfusedas is done with the paid donor.
Donor Screening Donor screening is designed to prevent the donation of blood by personswho have known risk factors or other conditions such as low bloodpressure. All prospective donors, both paid and volunteer, are screened formedical history and risk behaviors. High-risk donors, those whose bloodor plasma may pose a health hazard, are encouraged to excludethemselves. Everyone who seeks to donate plasma must answer a series ofbehavioral and medical questions. If the answers indicate high risk, theprospective donor is deferred from donating. The screening requirementsare completed before the donor is allowed to give plasma. Additionally,paid donors must pass an annual physical examination and a brief medicalexamination each time they donate. Similarly, volunteer donors undergo abrief medical examination each time they donate.
The American Blood Resources Association’s National Donor DeferralRegistry is one method by which the plasma industry has attempted toensure that donors who are presenting to donate for the first time at aplasma center are checked for past deferrals at other centers. TheAmerican Red Cross has a similar system that is a national list of thosedeferred through their blood collection system. Each member facility ofAmerica’s Blood Centers maintains its own donor deferral list againstwhich donors are checked.
Testing of Donors All donors are tested for certain viruses known to be transmissiblethrough blood, including HBV, HCV, and HIV.4 The specific screening testscheck for the presence of hepatitis B surface antigen (HBsAg), antibodies tohepatitis C (anti-HCV), HIV-1 antigen (Ag) and antibodies to HIV types 1 and 2(anti-HIV).5 Donors with repeatedly reactive test results are rejected fromfurther donations. (See app. II for more information on testingprocedures.) For units found to be reactive on HIV tests, the positive unitsand all previously donated plasma units not pooled for manufacture in thepreceding 6 months are retrieved, and those professional services who
4Additionally, paid donors are tested for syphilis every 4 months, while every volunteer donation istested for syphilis. Testing for syphilis is performed, for the most part, as an indicator of high-riskbehaviors. The value of this testing has been debated.
5Antibody tests detect antibodies that the human body produces in its immune response to a virus,whereas antigen tests detect a component of the actual virus. Because it takes time to developantibodies, antigen tests detect infection earlier than antibody tests.
GAO/HEHS-98-205 Blood Plasma SafetyPage 8
B-278739
receive the plasma products are notified according to federal regulations(21 C.F.R. 610.46).6
All of the plasma fractionation companies have also received permissionfrom the FDA to begin clinical trials of the polymerase chain reaction (PCR)technique, a more sensitive test that is now available, to detect viralmaterial for HIV, HBV, and HCV. PCR is used to amplify the number of copiesof a specific region of DNA or RNA in order to produce enough DNA or RNA tobe adequately tested. This technique appears to be able to identify, with avery high probability, disease-causing viruses such as HIV, HBV, and HCV.Because PCR testing detects virus particles at the genetic level, infecteddonors can be identified days or even months sooner than if onlytraditional antibody or antigen testing is performed, thus shortening thewindow period. PCR testing is being investigated using minipools that cancombine over 500 individual donations. All plasma used in themanufacturing process that undergoes PCR testing must be nonreactive forthat specific test.7
Risk of InfectiousUnits Entering PlasmaPools Is SomewhatHigher for PaidPlasma Donors Thanfor Volunteer Donors
We calculated the risk of incorporating an infectious unit of plasma into aplasma pool for HIV, HBV, and HCV for both volunteer and paid plasmadonors. Overall viral marker rates for HIV, HBV, and HCV are higher amongindividuals who present themselves to donate at paid plasma centers thanamong those who come to volunteer blood centers. This is due to higherHCV rates among paid donors. Units that test positive are excluded. Theincidence rate of collecting infectious units from donors who are in thewindow period between the time they become infected and the time theytest positive is much higher among paid plasma donors than amongvolunteer donors. However, a number of safety initiatives have beeninstituted by paid plasma centers that greatly reduce the likelihood ofinfectious units being pooled for manufacturing. Nevertheless, thefinal—or residual—risk of an infectious unit entering a plasma poolremains somewhat higher for paid donors than for volunteer donors.
6Additionally, tests are performed to examine the level of the liver enzyme alanine aminotransferase(ALT). An abnormal ALT may be an indicator of liver disease, a viral infection that causes liver disease,or both. Units with unacceptable ALT levels are not used. Whole blood donations are also tested forantibodies to human lymphotropic virus types I and II, but source plasma is not screened for thisbecause it is cell associated and not found in plasma.
7Because of pooled sample testing, an individual unit still could be positive but only at a very low titer.Such a low-titer unit may not be detected using pooled PCR and thus would be added to themanufacturing pool.
GAO/HEHS-98-205 Blood Plasma SafetyPage 9
B-278739
There are at least four potential ways in which viral agents go undetectedduring donation and may thus be transmitted through blood products.8
First, there exists a very rare chronic carrier state in which a clinicallyasymptomatic, yet infectious, donor will persistently test negative on adonation screening test. Second, a viral agent may have a large degree ofgenetic diversity so that laboratory screening tests fail to identify someinfectious donors who harbor an atypical genetic variant. Third, laboratoryerror in performing screening tests may occur, allowing positive units tobe made available for transfusion. Finally, the donor may have a negativelaboratory test during the window period before the virus is detected bycurrently licensed screening tests. The majority of cases in which aninfectious donation will be included in a plasma pool is a result of this lastcircumstance. As a result, modeling techniques have been developed todetermine the risk estimates of incorporating these infectious windowperiod units into the blood supply.
To determine the marker rate for HIV in plasma donations, we obtaineddata from California’s Department of Health Services (DHS), which collectsinformation on these rates for volunteer blood donors and paid donors atplasma collection facilities.9 We obtained information on HIV, HBV, and HCV
viral marker rates from the American Red Cross for donors who donate attheir centers. The American Blood Resources Association provided uswith data on repeatedly reactive test results for paid donors who donate attheir centers. We adjusted these data to obtain the viral marker rates.
In addition, we obtained information on incidence rates among AmericanRed Cross and American Blood Resources Association donors to adjustfor the effect of such variables as first-time donor versus repeat donors,the length of the interdonation interval (the time period betweendonations), and the number of seroconverters found among plasmadonors.10 We also compared the residual risk of a potentially infectiousplasma donation by a volunteer versus paid plasma donor actuallyentering a plasma pool by examining the effect of the length of the windowperiod as well as the use of only “qualified donors” and the 60-day
8Stephan Kleinman and others, “The Incidence/Window Period Model and Its Use to Assess the Risk ofTransfusion-Transmitted Human Immunodeficiency Virus and Hepatitis C Virus Infection,”Transfusion Medicine Reviews, Vol. 11 (1997), pp. 155-72.
9The term “viral marker rates” refers to the rate at which a particular group has confirmed-positivetests for particular viruses, in this case for HIV, HBV, and HCV.
10Seroconverting donors are those donors who are recently infected and test negative on a currentlylicensed test. Donors who have seroconverted will test positive.
GAO/HEHS-98-205 Blood Plasma SafetyPage 10
B-278739
inventory hold program instituted by the paid plasma industry. (See app. Ifor the calculations we used to derive our risk estimates).
Overall Marker Rates ofInfection Are HigherAmong Paid Donors
Although it has been difficult to obtain data on viral marker rates amongpaid plasma donors, data collected by California highlight differencesbetween paid plasma and volunteer whole blood donors.11 As shown intable 2, among the 833,178 units tested, 89 units (.0107 percent) testedpositive for HIV-1.12 Donations at plasma centers showed a higher rate oftesting positive for HIV-1 than did donations at blood banks. Plasma centershad an HIV-1 rate of .0266 percent (26.6 per 100,000 units tested), whileunits collected at blood banks had a rate of .0032 percent (3.2 per 100,000units tested). Thus, California plasma centers had over an eight-fold higherrate of HIV-1 positive donations than blood banks had among theirvolunteer donors.
Table 2: HIV-1 Antibody Test ResultsFrom California Blood Banks andPlasma Centers, July toDecember 1996
Facility type Units tested
Number ofconfirmed HIV-1
positive units
Number ofpositive
donations per100,000
Blood banks 566,677 18 3.17
Plasma centers 266,501 71 26.64
Total 833,178 89 10.68
For both blood banks and plasma centers in California, the seroprevalencerates for HIV have decreased significantly over time. More than 7 millionunits were tested at California blood banks between 1990 and 1996. Overthis period, HIV-1 seroprevalence among donors declined from .015 percentto .003 percent. Over 4.5 million units were tested at California plasmacenters during this same time frame. The HIV-1 seroprevalence amongplasma donors declined during this period from .056 percent in 1990 to.027 percent in the second half of 1996. However, while the rates of HIV aredropping in both groups, there is a consistent pattern of higher markerrates among paid donors than among volunteer donors. (See fig. 1.)
11DHS received results for HIV-1 and HIV-2 antibody testing from blood banks and plasma centers. Forthe last 6 months of 1996 they received results from 49 blood banks and 15 plasma centers. Thisinformation represents about 74.4 percent of the overall California facilities required to report HIV-1and HIV-2 antibody test results. A recent updating of the facilities that are required to respondindicates that the response rate was actually higher than 74.4 percent.
12Two units also tested positive for HIV-2 with supplemental unlicensed testing. To date, FDA has notlicensed a confirmatory test for HIV-2 infection. However, cross-reactivity between HIV-1 and HIV-2 isa strong possibility in instances where HIV-2 is confirmed by existing unlicensed testing.
GAO/HEHS-98-205 Blood Plasma SafetyPage 11
B-278739
Figure 1: Reported Confirmed HIV Rates Among Donations in California, 1990 to 1996
Note: Rates are per 100,000 commercial plasma donations and volunteer whole blood donations.
Source: DHS, Office of AIDS, Dec. 1997.
Although the California data were based on similar reporting requirementsand time frames for paid and volunteer donors, they only examined HIV
marker rates. There was also some question as to whether multiplecounting of donors may have skewed the results of the reporting. Becauseof these concerns, we also obtained information on marker rates from theAmerican Red Cross and American Blood Resources Association fordonors who presented themselves to donate at their respective collectioncenters.
We obtained data from the American Red Cross on 2,954,773 volunteerwhole blood donations from donors less than 60 years old (those used for
GAO/HEHS-98-205 Blood Plasma SafetyPage 12
B-278739
plasma products) between January 1, 1996, and June 30, 1997.13 Thisincludes donations that have occurred since the introduction of the HIV-1antigen screening test, implemented on March 15, 1996. As shown in table3, these data showed that 6.9 out of every 100,000 donations were found totest positive for HIV, while the rates were 33.4 per hundred thousand forHBsAg, and 112.4 per hundred thousand for HCV (results from confirmatorytesting).14 Assuming that no donation is positive for more than one virus,then 1 of every 6,549 volunteer donations is potentially infectious for HIV,HBV, or HCV.
Table 3: Marker Rates AmongVolunteer Donations, January 1, 1996,to June 30, 1997 Marker
Number of confirmedpositive units
Number of positivedonations per 100,000
Anti-HIV 205 6.94
HBsAg 987 33.40
Anti-HCV 3,320 112.36
Total 4,512 152.70
We obtained data from the American Blood Resources Association on4.6 million paid plasma donations in the second half of 1994.15 Thedonations contained in these data only included repeatedly reactive testresults—confirmatory testing was not performed. We have thereforeadjusted these data by the rate at which repeatedly reactive donationsconfirm positive based on the rates seen in American Red Cross wholeblood donations. As shown in table 4, these data showed thatapproximately 3.7 out of every 100,000 donations were positive for HIV,while the rates were 30.9 per hundred thousand for HBsAg and 226.2 perhundred thousand for HCV. Assuming that no donation is positive for morethan one virus, then 1 of every 3,834 paid donations is potentiallyinfectious for HIV, HBV, or HCV.
13These data represent 33 percent of the total collections by the American Red Cross during the timeperiod noted above. Data were collected from 19 regions from an ongoing data collection and analysiseffort by the American Red Cross. The regions represented in this data set make up the InfectiousDiseases Data Center.
14The data presented for HBV include only HBsAg screening and not anti-HBc (hepatitis B core)screening. Because there are few contemporary studies determining the infectivity of reactive anti-HBcdonations that are HBsAg nonreactive (and therefore are believed to be derived almost entirely fromeither immune individuals or individuals with false reactivity to the anti-HBc screening test), andbecause plasma donations from the commercial sector are not screened for anti-HBc, the contributionof anti-HBc is not addressed.
15Information on HCV is based on a smaller data set of 2.5 million donations. All data were collectedfrom approximately 340 source plasma collection centers that were certified under the Quality PlasmaProgram at the time.
GAO/HEHS-98-205 Blood Plasma SafetyPage 13
B-278739
Table 4: Marker Rates Among PaidPlasma Donations, July toDecember 1994 Marker
Number of confirmedpositive units a
Number of positivedonations per 100,000
Anti-HIV 169 3.67
HBsAg 1,423 30.93
Anti-HCV 5,655 226.20
Total 7,247 260.80aAdjusted by the rates at which whole blood donations that are repeatedly reactive are confirmedpositive.
These three data sets show differing viral marker rates for volunteer andpaid plasma donors. The California data show much higher HIV-1 markerrates for paid plasma donors than volunteer donors. However, the datafrom the American Blood Resources Association show lower rates for HIV,similar rates for HBV, and higher rates for HCV than data obtained from theAmerican Red Cross. Overall, the rates for paid donors are 1.7 times higherthan the rates for volunteer donors, which is due to the higher rates amongpaid donors for HCV.
Voluntary StandardsIntroduced by the SourcePlasma Industry to ReduceTransmission of Viruses
The source plasma industry has recently introduced voluntary standardsaimed at reducing the viral risks posed by two categories of paid plasmadonations: donations from one-time donors and donations from donorswho may be in the window period. One-time donors are a concern becausesome data show that the rates of viral infection are much higher amongsuch donors. The individuals may either not be aware that they areinfected or may be test-seeking. Donors in the window period are aconcern because they may not be aware of their infection and thescreening tests will not detect the infection.
The first voluntary initiative, implemented in July 1997, eliminates the useof plasma from one-time donors. This standard requires that no units ofplasma can be accepted for further processing unless the donor hassuccessfully passed at least two health history interviews and two panelsof all required screening tests within a 6-month period. Qualified donorsare those who have passed through these criteria. Applicant donors, on theother hand, are individuals presenting themselves who have not beenpreviously qualified as a donor in the past 6 months.
This standard on first-time donors does not apply to volunteer donors.Neither the American Red Cross nor America’s Blood Centers imposes
GAO/HEHS-98-205 Blood Plasma SafetyPage 14
B-278739
such a requirement for the use of plasma recovered from whole blooddonations. Because the patterns of donation are very different forvolunteer whole blood donors (who can donate no more frequently thanonce every 8 weeks) compared with paid plasma donors (who can donateas often as twice a week), the volunteer sector does not view a restrictionthat would require holding plasma until a donor returns to be a practicalrequirement. In fact, the average interval between donations for anAmerican Red Cross donor is about 5 months.
A second industry initiative is an inventory hold program that holds sourceplasma donations for 60 days. During this time, if a donor seroconvertsand subsequently tests positive—or is otherwise disqualified—the earlierdonation can be retrieved from inventory and destroyed. This standard,however, does not establish a true quarantine program that would excludeunits from donors in the window period of infection, when viral infectioncannot be determined. A donor who was within the window period couldreturn 2 days after the initial donation, pass both health history interviewsand screening tests, and contribute infected units that would be used after60 days, if the donor were not tested again at a time outside the windowperiod. The data provided to us for estimating risks for source plasmadonations take this possibility into account.
Furthermore, the 60-day inventory hold period does not appear to beadequate for all viruses under consideration, based on published data. Thewindow period for HIV, HBV, and HCV, using detection of seroconversion asan end point, are approximately 22 days, 59 days, and 82 days,respectively.16 Thus, the 60-day hold period does not encompass thewindow period for HCV and is barely within the limit for HBV. However, themajority of window period units would be interdicted as most of thesewould fall within the 60-day hold period. PCR testing would close thewindow period for these viruses to approximately 11 days for HIV, 34 daysfor HBV, and 23 days for HCV.17 As a result, if such testing becomes availablefor mass screening, the 60-day inventory hold would cover the windowperiod for these three viruses.
Incidence Rate for PaidDonors Is Higher Than forVolunteer Donors
We found the incidence rates of HIV, HBV, and HCV infection to be muchhigher for paid donors than for volunteer donors. These rates includedonors who pass the initial screening and donate but subsequently
16George Schreiber and others, “The Risk of Transfusion-Transmitted Viral Infections,” New EnglandJournal of Medicine, Vol. 334 (June 27, 1996), pp. 1685-90.
17George Schreiber and others, “The Risk of Transfusion-Transmitted Viral Infections.”
GAO/HEHS-98-205 Blood Plasma SafetyPage 15
B-278739
seroconvert and are detected at a later donation. As a result, potentiallyinfectious units from these donors may have been incorporated into aplasma pool for manufacturing.
Since prevalence rates of viral markers merely indicate the proportion ofinfected persons in the population at a given time, independent of wheninfection occurred, they do not accurately portray the chances ofincorporating an infectious window period unit into a plasma pool. Thus,to calculate the risk of collecting potentially infectious units—theincidence rate—the number of individuals who are seroconverting and thetime between donations for such individuals (the interdonation interval)need to be taken into account.
Incidence Rate for VolunteerDonors
The data used to calculate incidence rates among volunteer donors arebased on approximately 1 million donations from repeat donors under theage of 60 for the American Red Cross between July 1, 1996, and June 30,1997. The interdonation interval for these donors averaged 154 days.However, repeat donors account for only 80 percent of volunteer blooddonations. Thus, incidence calculations from first-time donors also need tobe taken into account to obtain an overall risk estimate of collecting aninfectious window period unit. A modified screening test was used todetermine incidence rates among first-time donors, which showed thatfirst-time whole blood donors have a 2.4 times higher HIV rate of prevalentinfections than repeat donors.18 This information is combined to estimatethe total incidence among volunteer blood donors. (See table 5.)
Table 5: Estimated Incidence Rates forVolunteer Donations, July 1, 1996, toJune 30, 1997
MarkerRepeat donors
(80%)First-time donors
(20%)
Total(per 100,000
person-years) a
Anti-HIV and Ag 2.59 6.22 3.31
HBsAg 6.25 15.02 8.01
Anti-HCV 11.65 28.96 14.91aPerson years is the number of donations multiplied by the mean time between donations dividedby 365 days.
Incidence Rate for Paid Donors We also obtained data from the American Blood Resources Associationthat were based on all of the approximately 4 million donations at theAmerican Blood Resources Association-member centers over a 4-month
18M. P. Busch and others, “Estimation of HIV Incidence in U.S. Blood Donors Using a Novel DetunedAnti-HIV EIA Test Strategy,” Fifth Conference on Retroviruses and Opportunistic Infections (Chicago,Ill.: Feb. 1-5, 1998). We used a similar calculation to estimate incidence rates for HBV and HCV amongvolunteer donors.
GAO/HEHS-98-205 Blood Plasma SafetyPage 16
B-278739
period in the second half of 1997. The average interdonation intervalamong these donors was 5.3 days. The American Blood ResourcesAssociation’s qualified donor program does not collect plasma fromfirst-time donors; therefore, no adjustment is needed for first-time donors.Table 6 shows the incidence rates among qualified source plasma donorsfor this period.19
Table 6: Estimated Incidence Rates forPaid Donations, July 1, 1997, toOctober 31, 1997
Marker
Total(per 100,000
person-years) a
Anti-HIV 61.80
HBsAg 245.50
Anti-HCV 63.52aPerson years is the number of donations multiplied by the mean time between donations dividedby 365 days.
When comparing the incidence rates between paid and volunteer plasmadonors, we found that the incidence rates for HIV, HBV, and HCV were muchhigher for paid donors. HIV incidence rates were 19 times higher amongpaid donors (61.8 versus 3.3 for volunteer donors), while HBV and HCV rateswere 31 times (245.5 versus 8.0) and 4 times higher (63.5 versus 14.9),respectively.
Residual Risks forIncorporating an InfectiousUnit Into a Plasma PoolAre Higher for Paid DonorsThan for Volunteer Donors
Calculating the chances that an infectious unit will be made available forpooling includes factoring in the length of the window period expressed asa fraction of a year. Calculating this residual risk is a more statisticallyappropriate way to determine the true impact of window period donations.
Residual Risk for VolunteerDonors
We calculated the residual risk of a potentially infectious unit being madeavailable for pooling for units collected from volunteer donors. Theseestimates are shown in table 7.
19The incidence rates for paid donors for HIV are based on antibody test results, whereas the rates forvolunteer donors are based on antibody and antigen tests.
GAO/HEHS-98-205 Blood Plasma SafetyPage 17
B-278739
Table 7: Estimated Residual Risk forVolunteer Plasma Donations
Marker
Estimatedresidual risk
per milliondonations Point estimate
Anti-HIV and Ag 1.45 1:689,655
HBsAg 12.95 1:77,220
HBsAg (with adjustment)a 28.89 1:34,614
Anti-HCV 33.50 1:29,850
Total 47.91 1:20,872
Total (with adjustment) a 63.85 1:15,662aAdjusted for the transient response on the HBsAg test.
The estimated adjusted risk per million donations—that is, the residualrisk—represents the incidence rate multiplied by the window period foreach virus. The resulting point estimate for the risk of pooling an HIV
seronegative unit from a window period donation is 1 in 689,655.20 For HBV
and HCV, the corresponding estimates are 1 in 77,220 and 1 in 29,850,respectively. When combined, we calculated the risk of incorporating aninfectious HIV, HBV, or HCV window period unit into a plasma pool fromvolunteer donors at 1 in every 20,872 units.21
Some researchers believe that an additional factor should be taken intoaccount when determining the risks associated with HBV.22 This is becauseindividuals who become infected with HBV show different patterns ofresponse over time on the HBsAg test. (See app. I for a more completediscussion.) If such an adjustment is taken into account, the estimatedtotal incidence per 100,000 person years for HBsAg would be 17.9, with anestimated adjusted risk per million donations of 28.9 and a point estimateof 1 in 34,614. This would yield an overall risk of incorporating an
20Estimates that are commonly quoted are point estimates. However, confidence intervals give a bettersense of possible risk. Point estimates are necessary for calculating purposes but should not beconstrued as definitive. Scientists know that statistical measurement is not precise. Thus, theycalculate a range, or confidence interval, of estimates that is wide enough that they are confident inbelieving that the real number is somewhere between the two endpoints of the range.
21This calculation assumes that the risks of incorporating a potentially infectious HIV, HBV, or HCVwindow period unit are independent. In fact, some units might be infectious with more than one virus.However, data on the over 4 million source plasma donations used in these analyses show that amongthe 215 confirmed positive donors, only 1 was positive for more than one virus.
22George Schreiber and others, “The Risk of Transfusion-Transmitted Viral Infections.”
GAO/HEHS-98-205 Blood Plasma SafetyPage 18
B-278739
infectious window period HIV, HBV, or HCV unit into a plasma pool of 1 inevery 15,622 units (instead of 1 in 20,872 without the adjustment).23
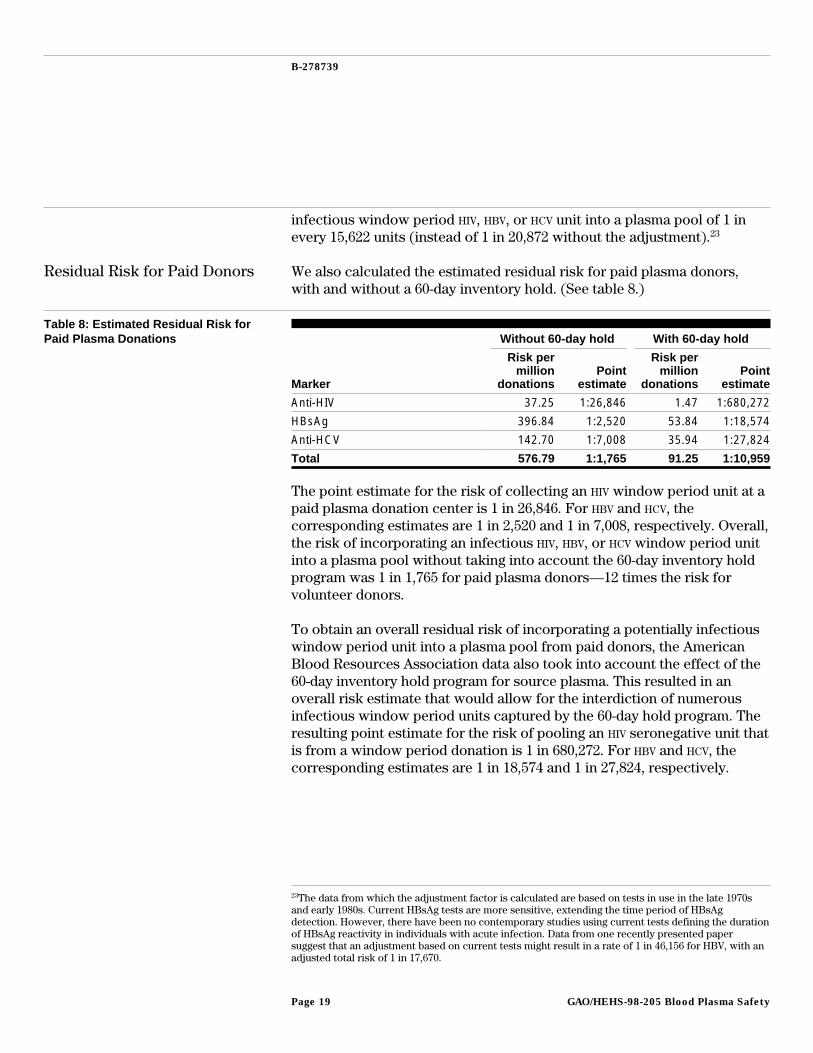
Residual Risk for Paid Donors We also calculated the estimated residual risk for paid plasma donors,with and without a 60-day inventory hold. (See table 8.)
Table 8: Estimated Residual Risk forPaid Plasma Donations Without 60-day hold With 60-day hold
Marker
Risk permillion
donationsPoint
estimate
Risk permillion
donationsPoint
estimate
Anti-HIV 37.25 1:26,846 1.47 1:680,272
HBsAg 396.84 1:2,520 53.84 1:18,574
Anti-HCV 142.70 1:7,008 35.94 1:27,824
Total 576.79 1:1,765 91.25 1:10,959
The point estimate for the risk of collecting an HIV window period unit at apaid plasma donation center is 1 in 26,846. For HBV and HCV, thecorresponding estimates are 1 in 2,520 and 1 in 7,008, respectively. Overall,the risk of incorporating an infectious HIV, HBV, or HCV window period unitinto a plasma pool without taking into account the 60-day inventory holdprogram was 1 in 1,765 for paid plasma donors—12 times the risk forvolunteer donors.
To obtain an overall residual risk of incorporating a potentially infectiouswindow period unit into a plasma pool from paid donors, the AmericanBlood Resources Association data also took into account the effect of the60-day inventory hold program for source plasma. This resulted in anoverall risk estimate that would allow for the interdiction of numerousinfectious window period units captured by the 60-day hold program. Theresulting point estimate for the risk of pooling an HIV seronegative unit thatis from a window period donation is 1 in 680,272. For HBV and HCV, thecorresponding estimates are 1 in 18,574 and 1 in 27,824, respectively.
23The data from which the adjustment factor is calculated are based on tests in use in the late 1970sand early 1980s. Current HBsAg tests are more sensitive, extending the time period of HBsAgdetection. However, there have been no contemporary studies using current tests defining the durationof HBsAg reactivity in individuals with acute infection. Data from one recently presented papersuggest that an adjustment based on current tests might result in a rate of 1 in 46,156 for HBV, with anadjusted total risk of 1 in 17,670.
GAO/HEHS-98-205 Blood Plasma SafetyPage 19
B-278739
Thus, the overall residual risk for paid plasma for HIV, HBV, and HCV is 1 in10,959, compared with 1 in 20,872 for volunteer donors.24 This would meanthat approximately 5.5 infectious units would be included in every 60,000paid donations, whereas about 2.9 infectious units would be included inevery 60,000 volunteer donations. Using the estimates based on theadjustment for HBV among volunteer donors (1 in 15,662) would mean that3.8 infectious units would be included in every 60,000 volunteer donations.
Overall Comparison of Risks ofPooling Infectious Units
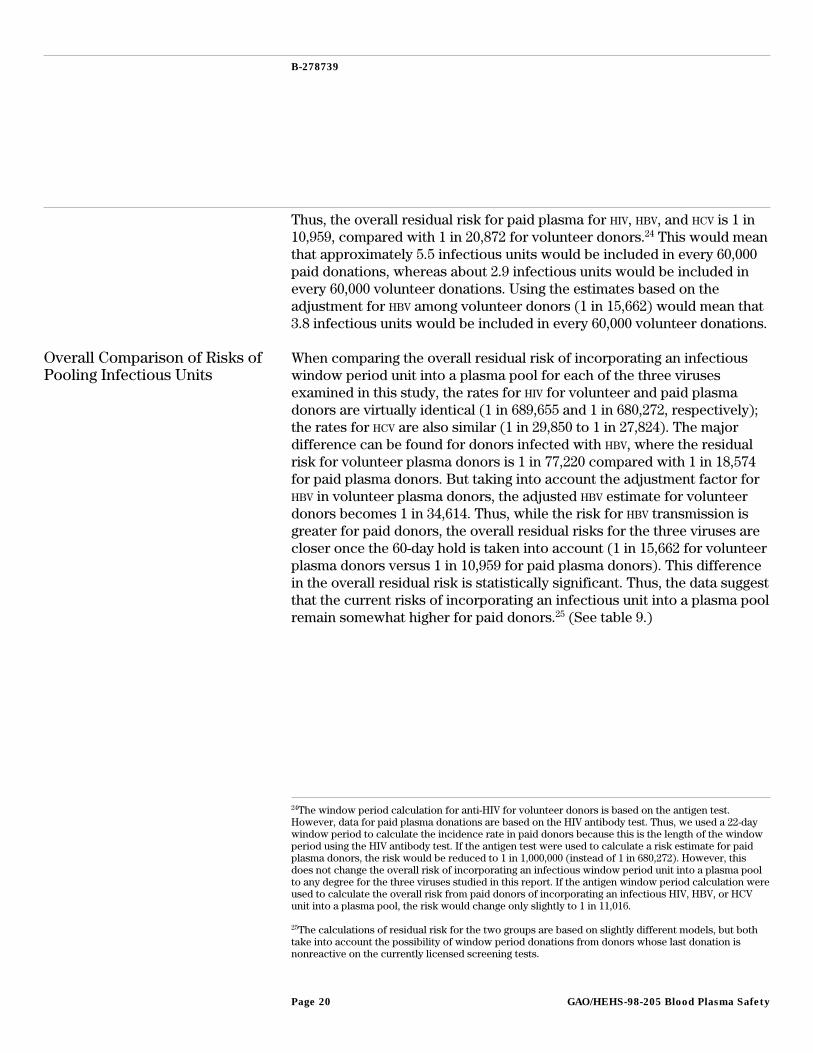
When comparing the overall residual risk of incorporating an infectiouswindow period unit into a plasma pool for each of the three virusesexamined in this study, the rates for HIV for volunteer and paid plasmadonors are virtually identical (1 in 689,655 and 1 in 680,272, respectively);the rates for HCV are also similar (1 in 29,850 to 1 in 27,824). The majordifference can be found for donors infected with HBV, where the residualrisk for volunteer plasma donors is 1 in 77,220 compared with 1 in 18,574for paid plasma donors. But taking into account the adjustment factor forHBV in volunteer plasma donors, the adjusted HBV estimate for volunteerdonors becomes 1 in 34,614. Thus, while the risk for HBV transmission isgreater for paid donors, the overall residual risks for the three viruses arecloser once the 60-day hold is taken into account (1 in 15,662 for volunteerplasma donors versus 1 in 10,959 for paid plasma donors). This differencein the overall residual risk is statistically significant. Thus, the data suggestthat the current risks of incorporating an infectious unit into a plasma poolremain somewhat higher for paid donors.25 (See table 9.)
24The window period calculation for anti-HIV for volunteer donors is based on the antigen test.However, data for paid plasma donations are based on the HIV antibody test. Thus, we used a 22-daywindow period to calculate the incidence rate in paid donors because this is the length of the windowperiod using the HIV antibody test. If the antigen test were used to calculate a risk estimate for paidplasma donors, the risk would be reduced to 1 in 1,000,000 (instead of 1 in 680,272). However, thisdoes not change the overall risk of incorporating an infectious window period unit into a plasma poolto any degree for the three viruses studied in this report. If the antigen window period calculation wereused to calculate the overall risk from paid donors of incorporating an infectious HIV, HBV, or HCVunit into a plasma pool, the risk would change only slightly to 1 in 11,016.
25The calculations of residual risk for the two groups are based on slightly different models, but bothtake into account the possibility of window period donations from donors whose last donation isnonreactive on the currently licensed screening tests.
GAO/HEHS-98-205 Blood Plasma SafetyPage 20
B-278739
Table 9: Residual Risks for Volunteerand Paid Plasma Donations Residual risk (1,000,000
donations) Point estimate
Marker Volunteer Paid Volunteer Paid
Anti-HIV 1.45 1.47 1:689,655 1:680,272
HBsAg 28.89 53.84 1:34,614 1:18,574
Anti-HCV 33.50 35.94 1:29,850 1:27,824
Total 63.85 91.25 1:15,662 1:10,959
ManufacturerReductions in PlasmaPool Sizes Tend to NotBenefit FrequentUsers
Concerns have been raised about the size of plasma pools because largerpools mean that a recipient of a product is exposed to more donors,raising the risks of infection because larger pools have more potentiallyinfectious units included. In response to these concerns, manufacturershave recently taken steps to reduce the size of the plasma pools they usefor producing plasma derivatives. Modeling techniques indicate that thiseffort can have an impact on infrequent users by minimizing theirexposure to a certain number of donors. However, for frequent users ofplasma products, such as hemophilia patients, this limit has a negligibleimpact due to the large number of different pools to which they areexposed throughout their lifetime.
The different proteins that make up the various components of plasma arepresent in only minute quantities in a single donation of plasma. Therefore,most plasma product manufacturing facilities have been designed to workat large scales, using large plasma pools made up of donations fromnumerous donors, in order to permit manufacturing of sufficient quantitiesof products. The number of units combined into a common mixture forprocessing is known as the pool size.26
There has been discussion by the plasma industry, FDA, consumer groups,and some Members of Congress regarding the potential benefits ofreducing the sizes of pools used by manufacturers to produce finishedplasma products. While no units of plasma known to be positive forviruses are combined in plasma pools for production, infectious units mayescape detection. A single unit has the potential to contaminate an entirepool. The larger the number of donors who contribute plasma to a pool,the greater the possibility that there will be at least one infectious unit
26Here we use the term “pool size” to include the total number of donors whose units are used in theproduction of a particular product and any material taken from other donations that were not in theinitial manufacturing pool. Thus, the pool sizes to which we refer include the total number of donors towhom a recipient of a product is exposed.
GAO/HEHS-98-205 Blood Plasma SafetyPage 21
B-278739
included. Based on the estimates we calculated above, a pool of as few as11,000 donations will still include one infectious unit.
Manufacturers HaveReduced Plasma Pool Sizes
As recently as a year ago, FDA believed that initial fractionation poolscontained 1,000 to 10,000 source plasma units or as many as 60,000recovered plasma units. However, in response to congressional inquiry,the FDA obtained information from plasma manufacturers showing that,after adjusting for the combination of intermediates, pooling of materialfrom several hundred thousand donors for single lots of some productssometimes occurred. For example, albumin can be added duringintermediate processing steps or to a final product, such as factor VIII, foruse as an excipient or stabilizer.27 This albumin often has been derivedfrom another plasma pool that contains donations from others that are notpart of the original pool.
As a result of the concerns raised about pool size, the four major plasmafractionators have voluntarily committed to reducing the size of plasmapools (measured by total number of donors) to 60,000 for all currentlylicensed U.S. plasma products, including factor VIII, factor IX, albumin,and IGIV. This measurement takes into account the composition of startingpools, the combining of intermediates from multiple pools, and the use ofplasma derivatives as additives or stabilizers in the manufacturing process.However, prior production streams are still being processed anddistributed; as a result, products distributed through the end of 1998 mayhave been produced from pools that exceeded the 60,000-donor limit.
The American Red Cross has also chosen to voluntarily reduce the size ofthe plasma pools from which its products are manufactured. As a policy,the American Red Cross has a 60,000-donor limit for plasma products thatare further manufactured by Baxter Healthcare. Seventy-five percent of allAmerican Red Cross plasma manufactured by the Swiss Red Cross ispresently at the 60,000 limit, with plans to have all production at that levelin the near future.
27Excipients are additives, other than the active ingredient of a drug, that confer a desired property onthe final dosage form. This may include a preservative to prevent microbial growth or a stabilizer thatmaintains potency. A stabilizer maintains the integrity of the active ingredient against chemicaldegradation or physical denaturation.
GAO/HEHS-98-205 Blood Plasma SafetyPage 22
B-278739
Modeling Techniques ShowPotential Benefits ofReductions in Pool Size forInfrequent Users
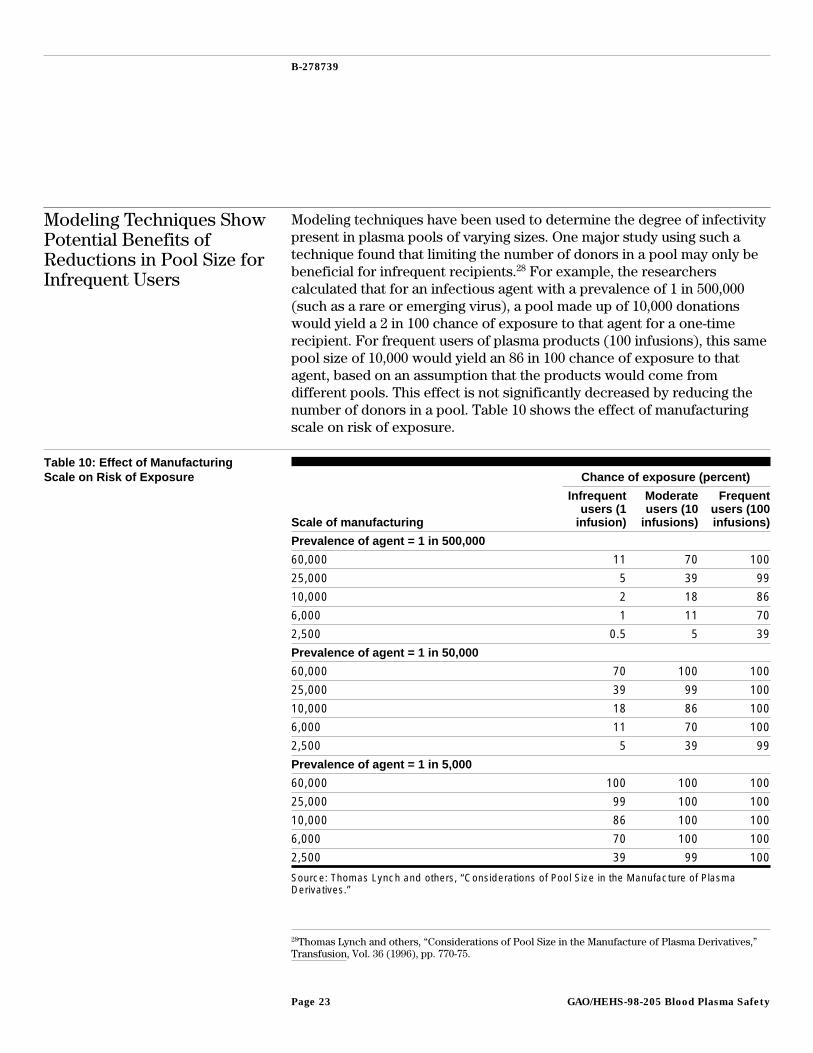
Modeling techniques have been used to determine the degree of infectivitypresent in plasma pools of varying sizes. One major study using such atechnique found that limiting the number of donors in a pool may only bebeneficial for infrequent recipients.28 For example, the researcherscalculated that for an infectious agent with a prevalence of 1 in 500,000(such as a rare or emerging virus), a pool made up of 10,000 donationswould yield a 2 in 100 chance of exposure to that agent for a one-timerecipient. For frequent users of plasma products (100 infusions), this samepool size of 10,000 would yield an 86 in 100 chance of exposure to thatagent, based on an assumption that the products would come fromdifferent pools. This effect is not significantly decreased by reducing thenumber of donors in a pool. Table 10 shows the effect of manufacturingscale on risk of exposure.
Table 10: Effect of ManufacturingScale on Risk of Exposure Chance of exposure (percent)
Scale of manufacturing
Infrequentusers (1
infusion)
Moderateusers (10
infusions)
Frequentusers (100infusions)
Prevalence of agent = 1 in 500,000
60,000 11 70 100
25,000 5 39 99
10,000 2 18 86
6,000 1 11 70
2,500 0.5 5 39
Prevalence of agent = 1 in 50,000
60,000 70 100 100
25,000 39 99 100
10,000 18 86 100
6,000 11 70 100
2,500 5 39 99
Prevalence of agent = 1 in 5,000
60,000 100 100 100
25,000 99 100 100
10,000 86 100 100
6,000 70 100 100
2,500 39 99 100
Source: Thomas Lynch and others, “Considerations of Pool Size in the Manufacture of PlasmaDerivatives.”
28Thomas Lynch and others, “Considerations of Pool Size in the Manufacture of Plasma Derivatives,”Transfusion, Vol. 36 (1996), pp. 770-75.
GAO/HEHS-98-205 Blood Plasma SafetyPage 23
B-278739
These modeling data suggest that smaller plasma pool sizes will reduce thelikelihood of transmission of viral agents to infrequent users of plasmaproducts but will not have a major effect on those who are frequentrecipients of such products.
It is also important to note that risk of exposure does not always equatewith risk of infection. In fact, risk of exposure is always greater than orequal to risk of infection. For example, the recent transmission of HCV by aplasma derivative that had not undergone viral inactivation proceduresshowed that the risk of seroconversion of recipients of this productincreased with the number of positive HCV lots infused and the quantity ofHCV viral material infused. However, not all recipients were infected; thehighest percentage of seroconversions seen with the highest levels of HCV
virus infused did not exceed 30 percent.29
The reasons for not observing seroconversions in 100 percent of therecipients may be due to two factors: (1) the recipient’s dose and (2) thereduction of infectiousness related to steps in the manufacture of theproduct in addition to viral removal and inactivation, such as duration ofstorage.
Risk of InfectionReduced ThroughViral Inactivation andRemoval Techniques
Since it is possible that certain infectious units could make it through thedonor screening, deferral, and testing process, manufacturers haveintroduced additional steps in the fractionation process to inactivate orremove viruses and bacteria that may have made their way into plasmapools. These techniques virtually eliminate enveloped viruses, such as HIV,HBV, and HCV. However, they are only partially effective againstnonenveloped viruses, such as HAV and human parvovirus.30
All plasma components listed in table 1 undergo viral inactivation orremoval steps during the manufacturing process.31 To be effective,inactivation techniques must disrupt the virus, rendering it noninfectious.The two main inactivation techniques are heat treatment and
29Joseph Bresee and others, “Hepatitis C Virus Infection Associated With Administration ofIntravenous Immune Globulin: A Cohort Study,” Journal of the American Medical Association, Vol. 276(Nov. 20, 1996), pp. 1563-7.
30Parvovirus is the cause of Fifth disease, a common childhood illness, which is usually mild and ofbrief duration. Approximately 50 percent of the population has been infected by parvovirus at sometime.
31FDA has encouraged manufacturers to incorporate viral inactivation or removal procedures forenveloped viruses. Currently, only two IGIM products are manufactured without the use of viralinactivation procedures.
GAO/HEHS-98-205 Blood Plasma SafetyPage 24
B-278739
solvent-detergent treatment. Heat treatment is accomplished either byexposing the freeze-dried product to dry heat or suspending it in asolution. Another technique heats the completely soluble liquid productwith the addition of various stabilizers, such as sucrose and glycine.32 Thesecond technique, solvent-detergent washing, exposes the product to anorganic solvent to dissolve the lipid coat of viruses, rendering theminactive without destroying the plasma-derived products. The lipidmembrane contains critical viral proteins needed for infection of hostcells. Disrupting the viral lipid envelope renders the virus noninfectious.However, solvent-detergent inactivation is only partially effective ineliminating non-lipid-coated viruses, such as HAV or human parvovirus.
To disable the virus without inactivating plasma derivatives, a delicatebalance in these procedures must be maintained. Heat and chemicals areparticularly damaging to plasma proteins. A number of potentially safermethods are in use or under investigation. These include the use of filtersto remove virus particles on the basis of the size of the virus; antibodies tocapture the desired protein, while the viruses and unwanted componentsare washed away;33 and irradiation to inactivate viruses. Virucidal agentsthat can be removed during further manufacturing and exposure toultraviolet light may also be safer methods for disabling viruses. Geneticengineering techniques are also being used to produce recombinantfactors VIII and IX—that is, the genes to produce the proteins have beencloned and harvested in the laboratory. These products have, so far, beenfound free of human viruses. However, manufacturing of theserecombinant products may include the use of human-derived productsduring production or as excipients in the final container. FDA has approvedrecombinant factor VIII and IX.
Determining the effectiveness of these different procedures isaccomplished by assessing the amount of viral clearance obtained througha particular inactivation or removal process. It is based on the amount ofvirus that is killed or removed and, therefore, the extent to which theseprocesses eliminate viruses through manufacturing. Individual
32Extensive research has carefully calculated specified temperatures and times for different heattreatment processes. For example, FDA regulations require that albumin (human) and plasma proteinfraction be heated for 10 to 11 hours at 60 degrees centigrade in the final container and in the presenceof defined stabilizers to ensure viral inactivation (21 C.F.R. 640.91(e), 640.81).
33One example of this process is the use of a monoclonal antibody column to purify a plasmaderivative such as factor VIII. In this case, antibodies to the factor VIII are generated in large amountsin tissue culture. The antibodies are attached to a support within the column. The plasma pool orintermediate product is passed through the column. The factor VIII binds to the specific antibodywhile the fluid containing other plasma-derived products, and possible contaminating viruses andother agents, flows through the column. The factor VIII can later be separated from the antibodycolumn.
GAO/HEHS-98-205 Blood Plasma SafetyPage 25
B-278739
manufacturing steps can be specifically designed for viral clearance orthey may be intended primarily as a purification process that will alsoassist in killing or removing viral agents. To meet FDA approval of theirparticular inactivation or removal technique, manufacturers mustseparately validate each clearance step.
The viral inactivation and removal steps currently in use have all beendemonstrated to reduce the levels of virus and, in many cases, likelyeliminate them. (See app. III for a more complete discussion of viralclearance.) Even when the virus is not completely eliminated, a significantreduction in viral load is of value. While theoretically even a single virus iscapable of causing infection, research has shown that infection is muchmore likely to occur with higher concentrations of virus.34 As a result ofthese techniques, there have been no documented cases of HIV, HCV, or HBV
transmission since 1988 for plasma products that were properlyinactivated.
RecentNoncompliance WithCurrent GoodManufacturingPractices CouldJeopardize the Safetyof Plasma Products
Although viral inactivation and removal techniques have been shown to behighly effective, they are only useful if the steps in the manufacturingprocess are carried out properly. Recent FDA inspections of plasmafractionation facilities have found numerous violations of current goodmanufacturing practices. Without strict adherence to these practices, thesafety of plasma products could be compromised.
The objective of good manufacturing practices is to ensure that plasmaproducts are safe, effective, adequately labeled, and possess the qualitypurported. To achieve this goal, plasma manufacturers should operate incompliance with applicable regulations and principles of qualityassurance.
To ensure that manufacturing processes, including inactivationprocedures, follow current good manufacturing procedures, FDA isauthorized to inspect plasma fractionation establishments. If themanufacturer does not conform to the standards in its license or theregulations such that the safety and purity of the product is not ensuredand this constitutes a danger to health, necessitating immediate correctiveaction, and the deficiencies are well documented, FDA may pursue anaction to suspend the facility’s license.
34Joseph Bresee and others, “Hepatitis C Infection Associated With Administration of IntravenousImmune Globulin.”
GAO/HEHS-98-205 Blood Plasma SafetyPage 26
B-278739
When deficiencies are noted during an inspection, FDA may also issue awarning letter to the facility. A warning letter does not suspend operationsbut rather gives the facility an opportunity to correct deviations. Awarning letter acts as notification to a firm that FDA considers its activitiesto be in violation of statutory or regulatory requirements and that failureto take appropriate and prompt corrective action may result in furtheraction by FDA.
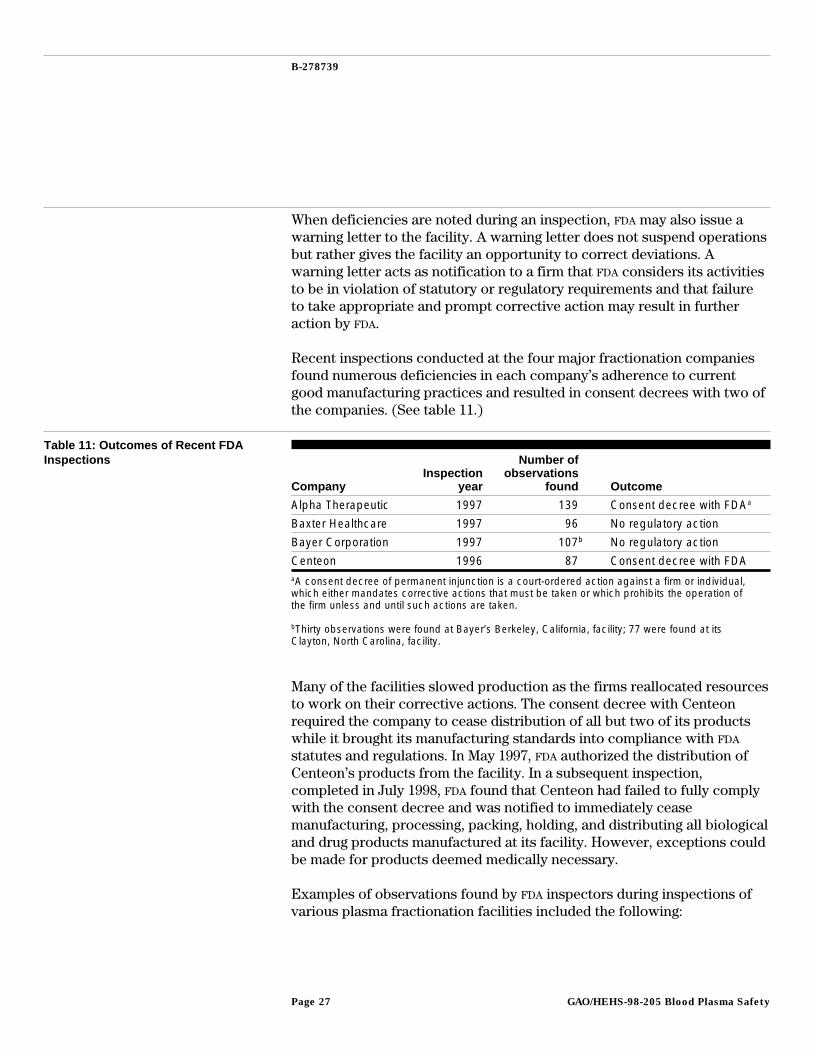
Recent inspections conducted at the four major fractionation companiesfound numerous deficiencies in each company’s adherence to currentgood manufacturing practices and resulted in consent decrees with two ofthe companies. (See table 11.)
Table 11: Outcomes of Recent FDAInspections
CompanyInspection
year
Number ofobservations
found Outcome
Alpha Therapeutic 1997 139 Consent decree with FDAa
Baxter Healthcare 1997 96 No regulatory action
Bayer Corporation 1997 107b No regulatory action
Centeon 1996 87 Consent decree with FDAaA consent decree of permanent injunction is a court-ordered action against a firm or individual,which either mandates corrective actions that must be taken or which prohibits the operation ofthe firm unless and until such actions are taken.
bThirty observations were found at Bayer’s Berkeley, California, facility; 77 were found at itsClayton, North Carolina, facility.
Many of the facilities slowed production as the firms reallocated resourcesto work on their corrective actions. The consent decree with Centeonrequired the company to cease distribution of all but two of its productswhile it brought its manufacturing standards into compliance with FDA
statutes and regulations. In May 1997, FDA authorized the distribution ofCenteon’s products from the facility. In a subsequent inspection,completed in July 1998, FDA found that Centeon had failed to fully complywith the consent decree and was notified to immediately ceasemanufacturing, processing, packing, holding, and distributing all biologicaland drug products manufactured at its facility. However, exceptions couldbe made for products deemed medically necessary.
Examples of observations found by FDA inspectors during inspections ofvarious plasma fractionation facilities included the following:
GAO/HEHS-98-205 Blood Plasma SafetyPage 27
B-278739
• In-house developed software that had not been validated was being usedfor performance of finished product testing.
• Calibration and preventive maintenance records were incomplete andsometimes inaccurate.
• Reports of problems with plasma products after distribution were notbeing reviewed and investigated in a timely manner.
• Viral inactivation processes used on several lots of factor VIII haddeviations that were undetected or not corrected.
• Albumin product lots that failed final container testing for sterility werereprocessed by repooling, and there was no validation for thesereprocessing steps.
• The cleaning process and removal of cleaning agent residues fromfractionation kettles, bulk tanks, buffer tanks, or centrifuge bowls werenot validated.
• Albumin manufacturing processes were not validated, and final productsdid not consistently conform to release specifications. (In 1997, 54 percentof albumin lots for one company failed final container inspection due tovisible evidence of proteinaceous material.)
To overcome these problems, the major fractionation companies havetaken certain steps, such as increasing quality assurance and qualitycontrol and production staff and training, implementing capitalinvestments at the fractionation facilities, and equipment processvalidation.
FDA has also taken several actions within the last year to better ensuremanufacturer compliance with current good manufacturing practices. In aprevious study examining the safety of the blood supply, we had foundinconsistencies in FDA inspection practices.35 As a result of this andanother study examining FDA’s regulatory role in the field of biologics, anew inspection program was adopted.36 Under this program, FDA hasdesignated two groups of investigators: one to focus on blood banks andplasmapheresis centers and another to focus on plasma fractionation andmanufacturers of allergenic products, therapeutics, licensed in-vitrodiagnostics, and vaccines. This approach is intended to ensure that all FDA
current good manufacturing practice inspections are conducted by a singleagency unit using a similar approach. If properly implemented, theseactions by plasma manufacturers and FDA should help alleviate the
35Blood Supply: FDA Oversight and Remaining Issues of Safety (GAO/PEMD-97-1, Feb. 25, 1997).
36Office of Inspector General, Review of the Food and Drug Administration’s Inspection Process ofPlasma Fractionators, A-03-97-00350 (Washington, D.C.: Department of Health and Human Services,June 1997).
GAO/HEHS-98-205 Blood Plasma SafetyPage 28
B-278739
problems related to adherence to current good manufacturing practicesand quality assurance.
Agency Comments We provided copies of a draft of this report to FDA and the Centers forDisease Control and Prevention for their review. Both generally agreedwith our findings. They provided technical comments, which weincorporated as appropriate. We also provided copies of the draft report tothe American Red Cross, the American Blood Resources Association, andthe International Plasma Products Industry Association. Each providedtechnical comments, which we incorporated as appropriate. The AmericanBlood Resources Association provided additional data on viral markerrates, which we have included.
We will send copies of this report to the Secretary of Health and HumanServices, the Lead Deputy Commissioner of FDA, and others who areinterested. If you have any questions or would like additional information,please call me at (202) 512-7119 or Marcia Crosse, Assistant Director, at(202) 512-3407. Other contributors to this report were Kurt Kroemer,Project Manager, and Richard Weston, Senior Social Science Analyst.
Sincerely yours,
Bernice SteinhardtDirector, Health Services Quality and Public Health Issues
GAO/HEHS-98-205 Blood Plasma SafetyPage 29
Contents
Letter 1
Appendix I Calculations for RiskEstimates
32Viral Marker Rates 33Incidence Rates and Residual Risk 35
Appendix II AdditionalInformation onTesting Procedures
41
Appendix III Viral ClearanceThrough Inactivationand Removal
43
Tables Table 1: Plasma Components and Their Primary Uses 5Table 2: HIV-1 Antibody Test Results From California Blood
Banks and Plasma Centers, July to December 199611
Table 3: Marker Rates Among Volunteer Donations, January 1,1996, to June 30, 1997
13
Table 4: Marker Rates Among Paid Plasma Donations, July toDecember 1994
14
Table 5: Estimated Incidence Rates for Volunteer Donations, July1, 1996, to June 30, 1997
16
Table 6: Estimated Incidence Rates for Paid Donations, July 1,1997, to October 31, 1997
17
Table 7: Estimated Residual Risk for Volunteer Plasma Donations 18Table 8: Estimated Residual Risk for Paid Plasma Donations 19Table 9: Residual Risks for Volunteer and Paid Plasma Donations 21Table 10: Effect of Manufacturing Scale on Risk of Exposure 23Table 11: Outcomes of Recent FDA Inspections 27Table I.1: Marker Rates Among Volunteer Donations 34Table I.2: Marker Rates Among Paid Plasma Donations 35Table I.3: Incidence Rates Among Repeat Volunteer Plasma
Donations36
GAO/HEHS-98-205 Blood Plasma SafetyPage 30
Contents
Table I.4: Total Incidence Rates and Residual Risk EstimatesAmong Volunteer Plasma Donations
37
Table I.5: Incidence Rates and Residual Risk Estimates for PaidPlasma Donations, Without the 60-Day Inventory Hold Program
39
Table I.6: Incidence Rates and Residual Risk Estimates for PaidPlasma Donations, With the 60-Day Inventory Hold Program
40
Table II.1: Results From and Actions After Viral Testing 41
Figure Figure 1: Reported Confirmed HIV Rates Among Donations inCalifornia, 1990 to 1996
12
Abbreviations
ABRA American Blood Resources AssociationALT alanine aminotransferaseDHS Department of Health ServicesFDA Food and Drug AdministrationHAV hepatitis A virusHBc hepatitis B coreHBsAg hepatitis B surface antigenHBV hepatitis B virusHCV hepatitis C virusIGIM immune globulin transmusularIGIV immune globulin intravenousLRF log reduction factorPCR polymerase chain reactionPPF plasma protein fraction
GAO/HEHS-98-205 Blood Plasma SafetyPage 31
Appendix I
Calculations for Risk Estimates
Our analysis of viral risks from volunteer and paid plasma donors includedcalculations for the three major viruses known to be transmissible throughplasma products—HIV, HBV, and HCV—and is based on a model thatcalculated similar estimates for whole blood donations.37 We did notestimate risks associated with nonenveloped viruses, where currentremoval or inactivation techniques are only effective to a limited extent,because no screening tests are currently used for these viruses. Thenonenveloped viruses currently known to be transmitted through plasma,primarily HAV and human parvovirus, are generally not life threatening.38
The window period outlined in our calculations is based on the“conventional” window period—defined as the interval between the timethe donor acquired the infection and the development of a positivelaboratory test. The conventional window period differs from the“infectious” window period
if there is a lag between the acquisition time of infection and the donor’s ability to transmitthe infection to others by blood transfusion. Theoretically, such a lag would exist if, oninitial exposure to the virus, the donor were able to sequester the virus in the organs of theimmune system before becoming infectious.39
Experimental animal evidence suggests that the difference between theconventional and infectious windows for retroviruses, such as HIV, mayrange from 2 to 14 days.40
Two ways of measuring risk of infection from blood transfusions are toexamine prevalence and incidence of disease. Prevalence indicates theoverall proportion of infected persons in the population at a given time,independent of when the infection occurred. Incidence is the proportion ofpersons newly infected in the population during the period of time understudy, or the rate of new infections. As such, incidence is calculated as thenumber of seroconverters divided by the person-time of observation,where the person-time of observation equals the number of donationsmultiplied by the mean time between donations (interdonation interval).
37George Schreiber and others, “The Risk of Transfusion-Transmitted Viral Infections.”
38Bernard Horowitz and others, “Viral Safety of Solvent-Detergent Treated Blood Products,” inVirological Safety Aspects of Plasma Derivatives, F. Brown, ed., Vol. 81 (1993), pp. 147-61.
39Stephan Kleinman and others, “The Incidence/Window Period Model and Its Use to Assess the Riskof Transfusion-Transmitted Human Immunodeficiency Virus and Hepatitis C Virus Infection.”
40M. T. Niu and others, “Primary Human Immunodeficiency Virus Type 1 Infection: Review ofPathogenesis and Early Treatment Intervention in Humans and Animal Retrovirus Infections,” Journalof Infectious Diseases, Vol. 168 (1993), pp. 1490-1501.
GAO/HEHS-98-205 Blood Plasma SafetyPage 32
Appendix I
Calculations for Risk Estimates
To calculate the overall residual risk from window period donations, theincidence rate is multiplied by the length of the window period fromseroconverting (repeat) donors. Adjustment factors can also be used toincorporate the effect of first-time donors and probability estimates fordonors who do not return but may be in the infectious window periodwhen they donate.
Viral Marker Rates Information on viral marker rates among volunteer and paid plasmadonors in California was obtained from California’s Department of HealthServices, Office of AIDS, HIV/AIDS Epidemiology Branch. Data illustrated infigure 1 are for HIV-1 confirmed positive test results. Starting in the secondquarter of 1991, the totals do not include autologous donations.Information pertaining to data for the second half of 1996 were obtainedfrom 49 blood banks and 15 plasma centers, representing approximately75 percent of the overall California facilities required to report HIV
antibody test results to DHS.41
Table I.1 outlines the calculations for the viral marker rates for volunteerplasma donors. This information was obtained from 19 American RedCross regions and was based on 2,954,773 donations from donors underage 60. This is approximately 33 percent of the total number of donationsmade to the American Red Cross during the reporting period of this datacollection effort (January 1, 1996, to June 30, 1997).
41California Health and Safety Code, Chap. 7, Sect. 120980(j).
GAO/HEHS-98-205 Blood Plasma SafetyPage 33
Appendix I
Calculations for Risk Estimates
Table I.1: Marker Rates AmongVolunteer Donations Number Percent Calculation
Anti-HIV marker
Repeat reactive 2,551 .09 2,551 ÷ 2,954,773
Confirmed negative 1,185 46.45 1,185 ÷ 2,551
Confirmed indeterminate 1,161 45.51 1,161 ÷ 2,551
Confirmed positive 205 8.04 205 ÷ 2,551
Positive donations per100,000
6.94 NA 100,000 x (205 ÷ 2,954,773)
HBsAg marker
Repeat reactive 1,404 .05 1,404 ÷ 2,954,773
Confirmed negative 417 29.70 417 ÷ 1,404
Confirmed indeterminate NA NA NA
Confirmed positive 987 70.30 987 ÷ 1,404
Positive donations per100,000
33.40 NA 100,000 x (987 ÷ 2,954,773)
Anti-HCV marker
Repeat reactive 5,728 .19 5,728 ÷ 2,954,773
Confirmed negative 1,289 22.50 1,289 ÷ 5,728
Confirmed indeterminate 1,119 19.54 1,119 ÷ 5,728
Confirmed positive 3,320 57.96 3,320 ÷ 5,728
Positive donations per100,000
112.36 NA 100,000 x (3,320 ÷ 2,954,773)
Note: NA = not applicable.
There were 205 confirmed positive HIV donations found among the 19regions reporting for the Infectious Disease Data Center. The number ofpositive donations per 100,000 is derived by dividing these 205 cases by thenumber of total donations and then multiplying the resulting figure by100,000. For HIV, this calculation yielded an estimated 7 positive donationsper 100,000 given at American Red Cross centers. Similar calculations canbe used to obtain estimates for HBV and HCV. To obtain our estimate of 1 inevery 6,549 volunteer donations as potentially infectious for HIV, HBV, orHCV, we added the positive donations per 100,000 for each virus (6.93 +33.40 + 112.36) and divided 1 million by this amount.
Table I.2 outlines the calculations for the viral marker rates for paidplasma donations. The calculations are based on 4,600,000 donations forHIV and HBV and 2,500,000 donations for HCV made in the second half of1994 to 340 American Blood Resources Association collection centers. The
GAO/HEHS-98-205 Blood Plasma SafetyPage 34
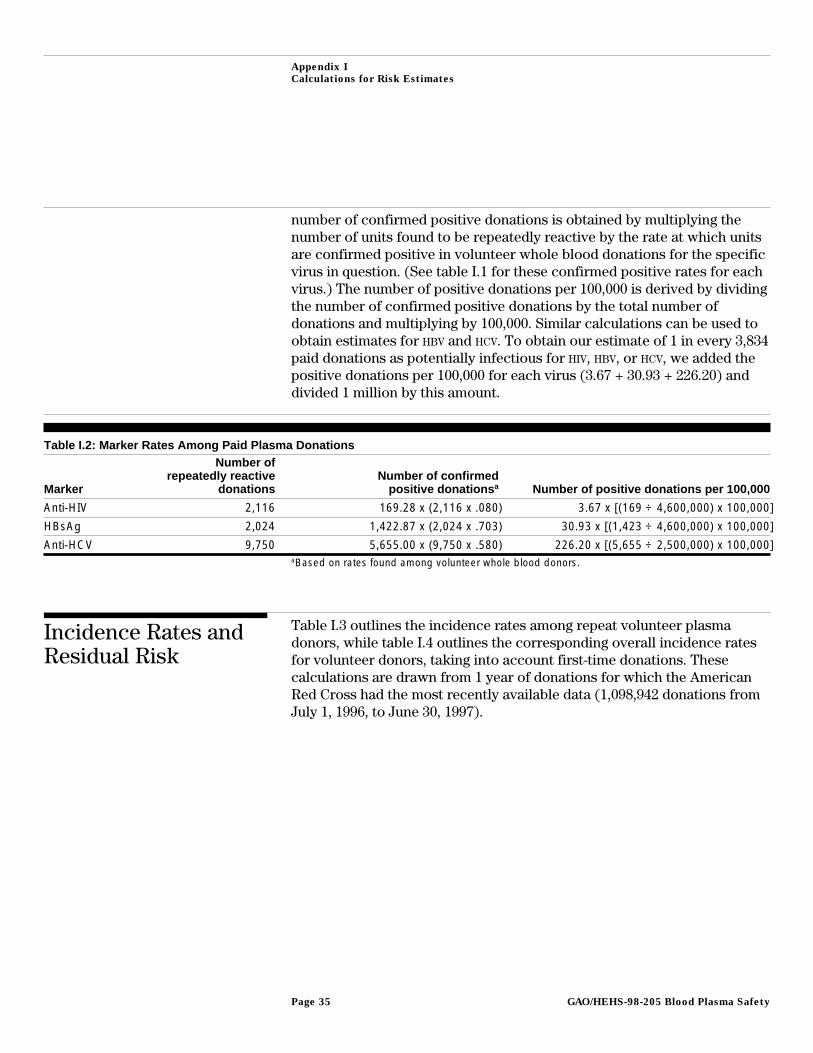
Appendix I
Calculations for Risk Estimates
number of confirmed positive donations is obtained by multiplying thenumber of units found to be repeatedly reactive by the rate at which unitsare confirmed positive in volunteer whole blood donations for the specificvirus in question. (See table I.1 for these confirmed positive rates for eachvirus.) The number of positive donations per 100,000 is derived by dividingthe number of confirmed positive donations by the total number ofdonations and multiplying by 100,000. Similar calculations can be used toobtain estimates for HBV and HCV. To obtain our estimate of 1 in every 3,834paid donations as potentially infectious for HIV, HBV, or HCV, we added thepositive donations per 100,000 for each virus (3.67 + 30.93 + 226.20) anddivided 1 million by this amount.
Table I.2: Marker Rates Among Paid Plasma Donations
Marker
Number ofrepeatedly reactive
donationsNumber of confirmed
positive donations a Number of positive donations per 100,000
Anti-HIV 2,116 169.28 x (2,116 x .080) 3.67 x [(169 ÷ 4,600,000) x 100,000]
HBsAg 2,024 1,422.87 x (2,024 x .703) 30.93 x [(1,423 ÷ 4,600,000) x 100,000]
Anti-HCV 9,750 5,655.00 x (9,750 x .580) 226.20 x [(5,655 ÷ 2,500,000) x 100,000]aBased on rates found among volunteer whole blood donors.
Incidence Rates andResidual Risk
Table I.3 outlines the incidence rates among repeat volunteer plasmadonors, while table I.4 outlines the corresponding overall incidence ratesfor volunteer donors, taking into account first-time donations. Thesecalculations are drawn from 1 year of donations for which the AmericanRed Cross had the most recently available data (1,098,942 donations fromJuly 1, 1996, to June 30, 1997).
GAO/HEHS-98-205 Blood Plasma SafetyPage 35
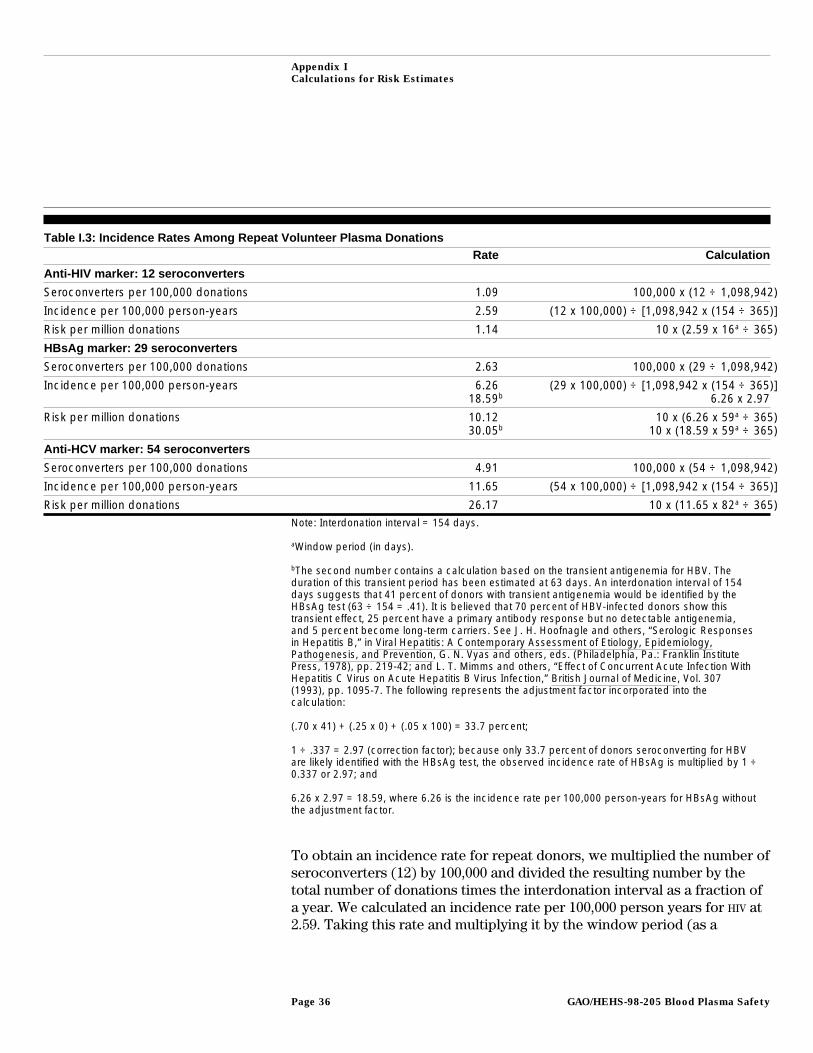
Appendix I
Calculations for Risk Estimates
Table I.3: Incidence Rates Among Repeat Volunteer Plasma DonationsRate Calculation
Anti-HIV marker: 12 seroconverters
Seroconverters per 100,000 donations 1.09 100,000 x (12 ÷ 1,098,942)
Incidence per 100,000 person-years 2.59 (12 x 100,000) ÷ [1,098,942 x (154 ÷ 365)]
Risk per million donations 1.14 10 x (2.59 x 16a ÷ 365)
HBsAg marker: 29 seroconverters
Seroconverters per 100,000 donations 2.63 100,000 x (29 ÷ 1,098,942)
Incidence per 100,000 person-years 6.2618.59b
(29 x 100,000) ÷ [1,098,942 x (154 ÷ 365)]6.26 x 2.97
Risk per million donations 10.1230.05b
10 x (6.26 x 59a ÷ 365)10 x (18.59 x 59a ÷ 365)
Anti-HCV marker: 54 seroconverters
Seroconverters per 100,000 donations 4.91 100,000 x (54 ÷ 1,098,942)
Incidence per 100,000 person-years 11.65 (54 x 100,000) ÷ [1,098,942 x (154 ÷ 365)]
Risk per million donations 26.17 10 x (11.65 x 82a ÷ 365)Note: Interdonation interval = 154 days.
aWindow period (in days).
bThe second number contains a calculation based on the transient antigenemia for HBV. Theduration of this transient period has been estimated at 63 days. An interdonation interval of 154days suggests that 41 percent of donors with transient antigenemia would be identified by theHBsAg test (63 ÷ 154 = .41). It is believed that 70 percent of HBV-infected donors show thistransient effect, 25 percent have a primary antibody response but no detectable antigenemia,and 5 percent become long-term carriers. See J. H. Hoofnagle and others, “Serologic Responsesin Hepatitis B,” in Viral Hepatitis: A Contemporary Assessment of Etiology, Epidemiology,Pathogenesis, and Prevention, G. N. Vyas and others, eds. (Philadelphia, Pa.: Franklin InstitutePress, 1978), pp. 219-42; and L. T. Mimms and others, “Effect of Concurrent Acute Infection WithHepatitis C Virus on Acute Hepatitis B Virus Infection,” British Journal of Medicine, Vol. 307(1993), pp. 1095-7. The following represents the adjustment factor incorporated into thecalculation:
(.70 x 41) + (.25 x 0) + (.05 x 100) = 33.7 percent;
1 ÷ .337 = 2.97 (correction factor); because only 33.7 percent of donors seroconverting for HBVare likely identified with the HBsAg test, the observed incidence rate of HBsAg is multiplied by 1 ÷0.337 or 2.97; and
6.26 x 2.97 = 18.59, where 6.26 is the incidence rate per 100,000 person-years for HBsAg withoutthe adjustment factor.
To obtain an incidence rate for repeat donors, we multiplied the number ofseroconverters (12) by 100,000 and divided the resulting number by thetotal number of donations times the interdonation interval as a fraction ofa year. We calculated an incidence rate per 100,000 person years for HIV at2.59. Taking this rate and multiplying it by the window period (as a
GAO/HEHS-98-205 Blood Plasma SafetyPage 36
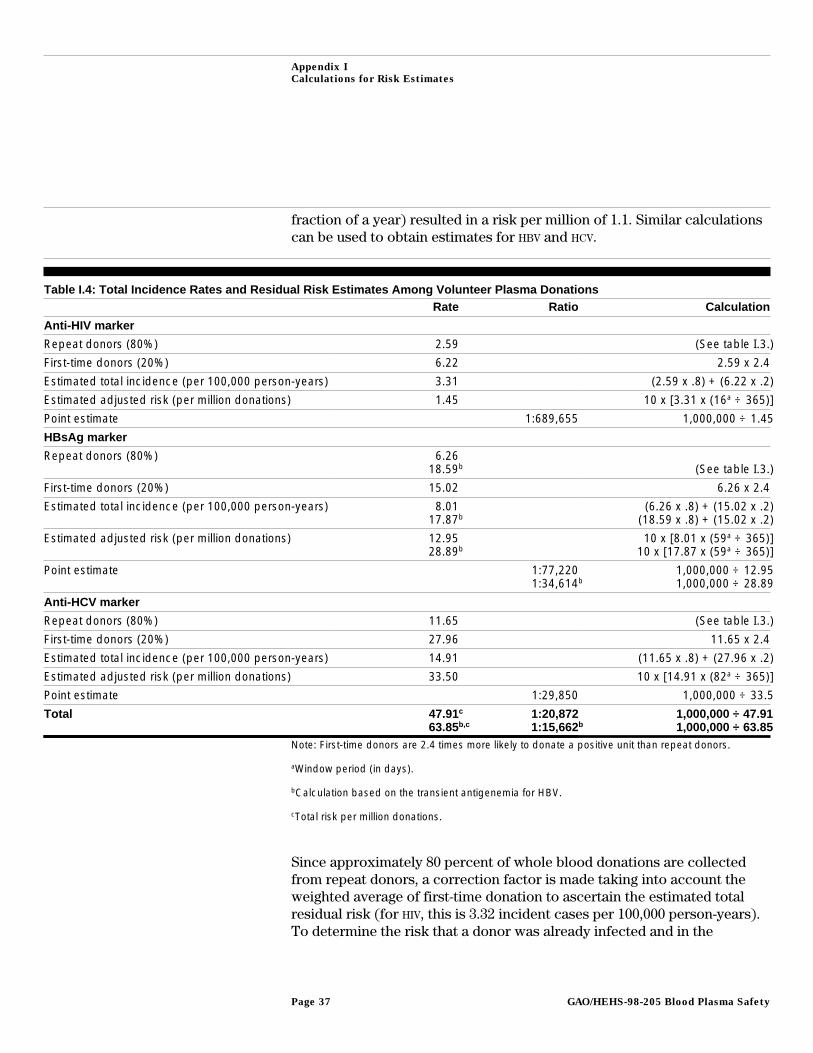
Appendix I
Calculations for Risk Estimates
fraction of a year) resulted in a risk per million of 1.1. Similar calculationscan be used to obtain estimates for HBV and HCV.
Table I.4: Total Incidence Rates and Residual Risk Estimates Among Volunteer Plasma DonationsRate Ratio Calculation
Anti-HIV marker
Repeat donors (80%) 2.59 (See table I.3.)
First-time donors (20%) 6.22 2.59 x 2.4
Estimated total incidence (per 100,000 person-years) 3.31 (2.59 x .8) + (6.22 x .2)
Estimated adjusted risk (per million donations) 1.45 10 x [3.31 x (16a ÷ 365)]
Point estimate 1:689,655 1,000,000 ÷ 1.45
HBsAg marker
Repeat donors (80%) 6.2618.59b (See table I.3.)
First-time donors (20%) 15.02 6.26 x 2.4
Estimated total incidence (per 100,000 person-years) 8.0117.87b
(6.26 x .8) + (15.02 x .2)(18.59 x .8) + (15.02 x .2)
Estimated adjusted risk (per million donations) 12.9528.89b
10 x [8.01 x (59a ÷ 365)]10 x [17.87 x (59a ÷ 365)]
Point estimate 1:77,2201:34,614b
1,000,000 ÷ 12.951,000,000 ÷ 28.89
Anti-HCV marker
Repeat donors (80%) 11.65 (See table I.3.)
First-time donors (20%) 27.96 11.65 x 2.4
Estimated total incidence (per 100,000 person-years) 14.91 (11.65 x .8) + (27.96 x .2)
Estimated adjusted risk (per million donations) 33.50 10 x [14.91 x (82a ÷ 365)]
Point estimate 1:29,850 1,000,000 ÷ 33.5
Total 47.91c
63.85b,c1:20,8721:15,662b
1,000,000 ÷ 47.911,000,000 ÷ 63.85
Note: First-time donors are 2.4 times more likely to donate a positive unit than repeat donors.
aWindow period (in days).
bCalculation based on the transient antigenemia for HBV.
cTotal risk per million donations.
Since approximately 80 percent of whole blood donations are collectedfrom repeat donors, a correction factor is made taking into account theweighted average of first-time donation to ascertain the estimated totalresidual risk (for HIV, this is 3.32 incident cases per 100,000 person-years).To determine the risk that a donor was already infected and in the
GAO/HEHS-98-205 Blood Plasma SafetyPage 37
Appendix I
Calculations for Risk Estimates
infectious, seronegative window period, the adjusted incidence rate for HIV
of 3.32 was multiplied by .044 (the 16-day window period for antigenexpressed as a fraction of a year), yielding a residual risk of 1.5 per milliondonations. Our point estimate was calculated by taking this residual riskand dividing by 1 million. Similar calculations can be used to obtainestimates for HBV and HCV.
Table I.5 highlights the corresponding incidence rates and residual risk forpaid plasma donors without taking into account the 60-day hold program.This information was obtained from the American Blood ResourcesAssociation and was based on 4,011,449 donations from 370 collectioncenters from July 1997 through October 1997. The confirmed positivedonations were analyzed to ensure that they were, in fact, from qualifieddonors. Additionally, donation histories were examined for approximately16,000 nonreactive donors (representing 300,288 donations) to obtainprobability estimates for the effect of donors who did not return but mayhave donated a seronegative, but infectious, window period unit at theirlast donation. Calculations made above for volunteer donors were done ina similar fashion for paid plasma donors to obtain incidence rates, risksper million donations, and a point estimate.
GAO/HEHS-98-205 Blood Plasma SafetyPage 38
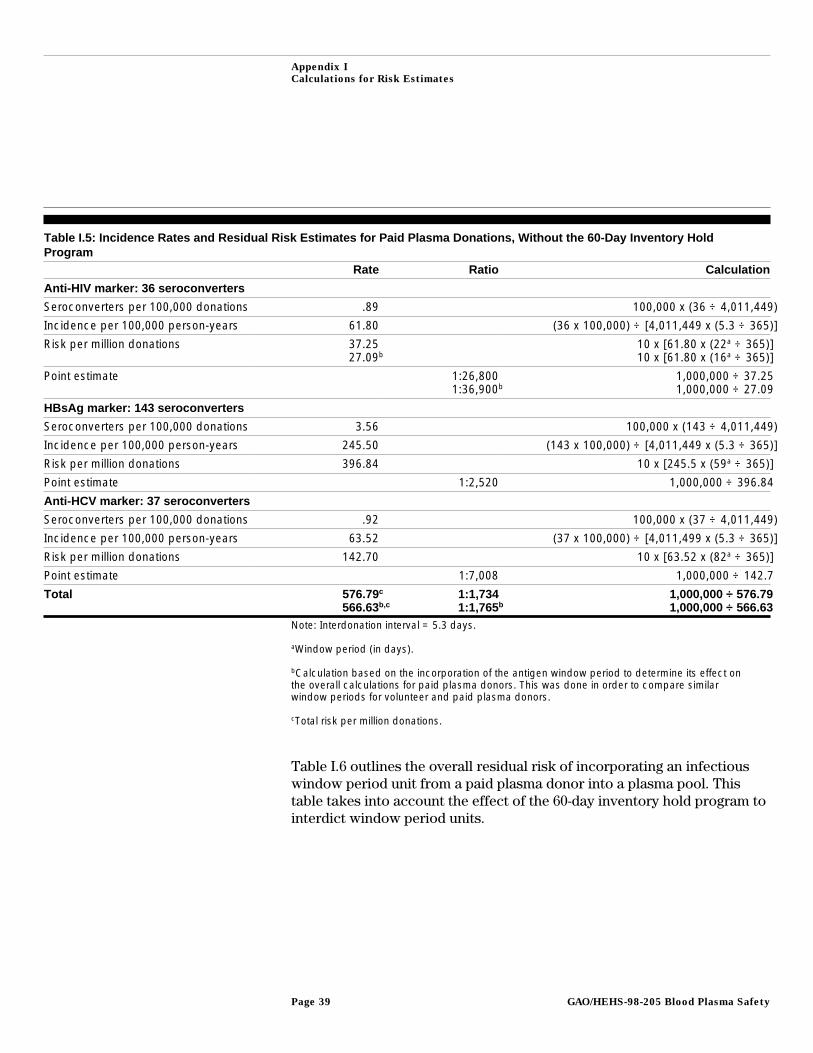
Appendix I
Calculations for Risk Estimates
Table I.5: Incidence Rates and Residual Risk Estimates for Paid Plasma Donations, Without the 60-Day Inventory HoldProgram
Rate Ratio Calculation
Anti-HIV marker: 36 seroconverters
Seroconverters per 100,000 donations .89 100,000 x (36 ÷ 4,011,449)
Incidence per 100,000 person-years 61.80 (36 x 100,000) ÷ [4,011,449 x (5.3 ÷ 365)]
Risk per million donations 37.2527.09b
10 x [61.80 x (22a ÷ 365)]10 x [61.80 x (16a ÷ 365)]
Point estimate 1:26,8001:36,900b
1,000,000 ÷ 37.251,000,000 ÷ 27.09
HBsAg marker: 143 seroconverters
Seroconverters per 100,000 donations 3.56 100,000 x (143 ÷ 4,011,449)
Incidence per 100,000 person-years 245.50 (143 x 100,000) ÷ [4,011,449 x (5.3 ÷ 365)]
Risk per million donations 396.84 10 x [245.5 x (59a ÷ 365)]
Point estimate 1:2,520 1,000,000 ÷ 396.84
Anti-HCV marker: 37 seroconverters
Seroconverters per 100,000 donations .92 100,000 x (37 ÷ 4,011,449)
Incidence per 100,000 person-years 63.52 (37 x 100,000) ÷ [4,011,499 x (5.3 ÷ 365)]
Risk per million donations 142.70 10 x [63.52 x (82a ÷ 365)]
Point estimate 1:7,008 1,000,000 ÷ 142.7
Total 576.79c
566.63b,c1:1,7341:1,765b
1,000,000 ÷ 576.791,000,000 ÷ 566.63
Note: Interdonation interval = 5.3 days.
aWindow period (in days).
bCalculation based on the incorporation of the antigen window period to determine its effect onthe overall calculations for paid plasma donors. This was done in order to compare similarwindow periods for volunteer and paid plasma donors.
cTotal risk per million donations.
Table I.6 outlines the overall residual risk of incorporating an infectiouswindow period unit from a paid plasma donor into a plasma pool. Thistable takes into account the effect of the 60-day inventory hold program tointerdict window period units.
GAO/HEHS-98-205 Blood Plasma SafetyPage 39
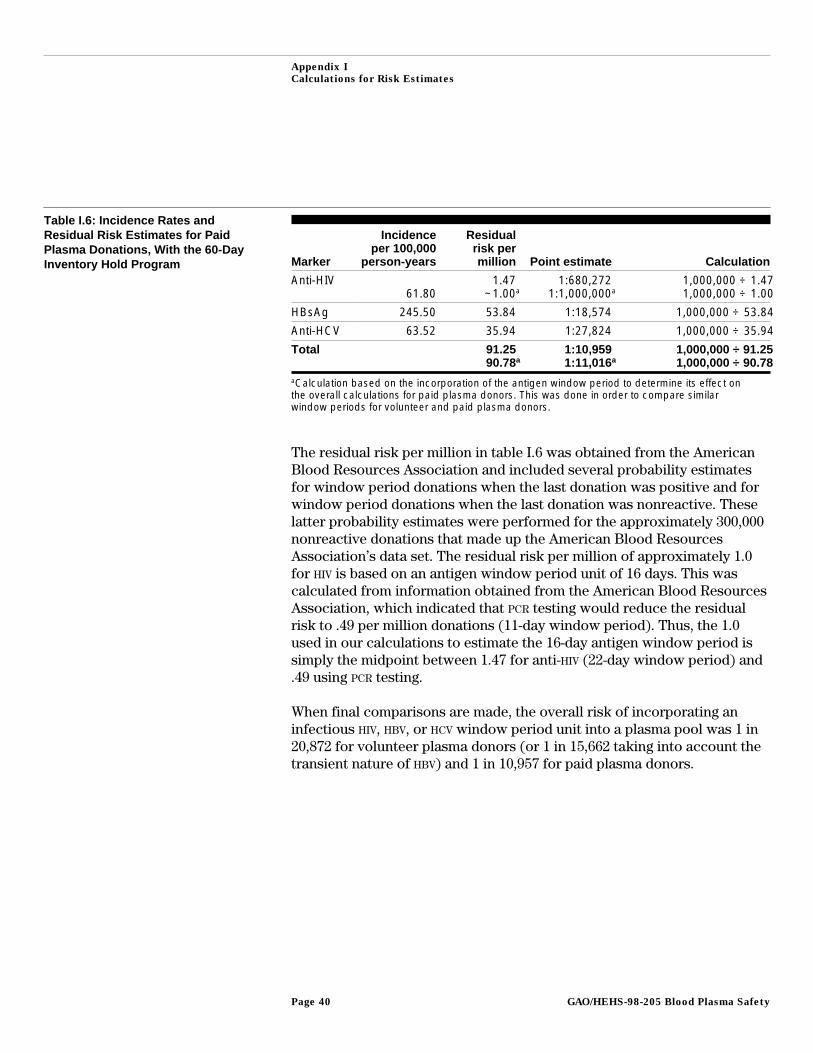
Appendix I
Calculations for Risk Estimates
Table I.6: Incidence Rates andResidual Risk Estimates for PaidPlasma Donations, With the 60-DayInventory Hold Program Marker
Incidenceper 100,000
person-years
Residualrisk permillion Point estimate Calculation
Anti-HIV61.80
1.47~1.00a
1:680,2721:1,000,000a
1,000,000 ÷ 1.471,000,000 ÷ 1.00
HBsAg 245.50 53.84 1:18,574 1,000,000 ÷ 53.84
Anti-HCV 63.52 35.94 1:27,824 1,000,000 ÷ 35.94
Total 91.2590.78a
1:10,9591:11,016a
1,000,000 ÷ 91.251,000,000 ÷ 90.78
aCalculation based on the incorporation of the antigen window period to determine its effect onthe overall calculations for paid plasma donors. This was done in order to compare similarwindow periods for volunteer and paid plasma donors.
The residual risk per million in table I.6 was obtained from the AmericanBlood Resources Association and included several probability estimatesfor window period donations when the last donation was positive and forwindow period donations when the last donation was nonreactive. Theselatter probability estimates were performed for the approximately 300,000nonreactive donations that made up the American Blood ResourcesAssociation’s data set. The residual risk per million of approximately 1.0for HIV is based on an antigen window period unit of 16 days. This wascalculated from information obtained from the American Blood ResourcesAssociation, which indicated that PCR testing would reduce the residualrisk to .49 per million donations (11-day window period). Thus, the 1.0used in our calculations to estimate the 16-day antigen window period issimply the midpoint between 1.47 for anti-HIV (22-day window period) and.49 using PCR testing.
When final comparisons are made, the overall risk of incorporating aninfectious HIV, HBV, or HCV window period unit into a plasma pool was 1 in20,872 for volunteer plasma donors (or 1 in 15,662 taking into account thetransient nature of HBV) and 1 in 10,957 for paid plasma donors.
GAO/HEHS-98-205 Blood Plasma SafetyPage 40
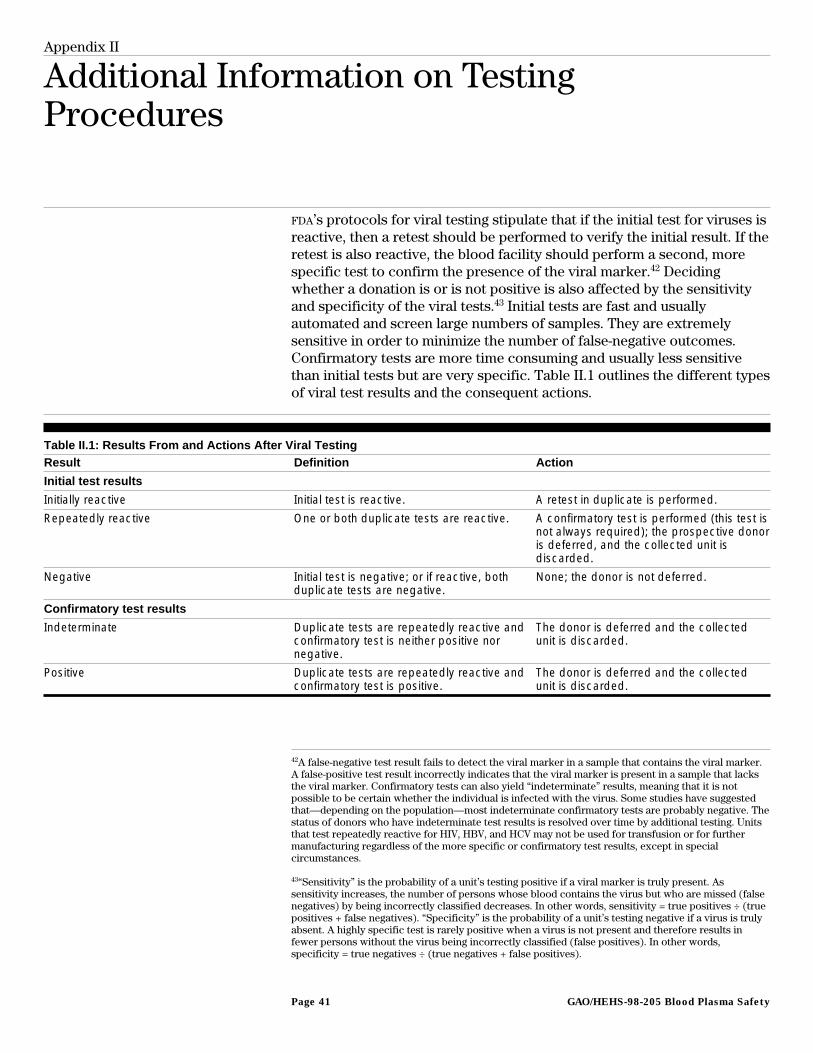
Appendix II
Additional Information on TestingProcedures
FDA’s protocols for viral testing stipulate that if the initial test for viruses isreactive, then a retest should be performed to verify the initial result. If theretest is also reactive, the blood facility should perform a second, morespecific test to confirm the presence of the viral marker.42 Decidingwhether a donation is or is not positive is also affected by the sensitivityand specificity of the viral tests.43 Initial tests are fast and usuallyautomated and screen large numbers of samples. They are extremelysensitive in order to minimize the number of false-negative outcomes.Confirmatory tests are more time consuming and usually less sensitivethan initial tests but are very specific. Table II.1 outlines the different typesof viral test results and the consequent actions.
Table II.1: Results From and Actions After Viral TestingResult Definition Action
Initial test results
Initially reactive Initial test is reactive. A retest in duplicate is performed.
Repeatedly reactive One or both duplicate tests are reactive. A confirmatory test is performed (this test isnot always required); the prospective donoris deferred, and the collected unit isdiscarded.
Negative Initial test is negative; or if reactive, bothduplicate tests are negative.
None; the donor is not deferred.
Confirmatory test results
Indeterminate Duplicate tests are repeatedly reactive andconfirmatory test is neither positive nornegative.
The donor is deferred and the collectedunit is discarded.
Positive Duplicate tests are repeatedly reactive andconfirmatory test is positive.
The donor is deferred and the collectedunit is discarded.
42A false-negative test result fails to detect the viral marker in a sample that contains the viral marker.A false-positive test result incorrectly indicates that the viral marker is present in a sample that lacksthe viral marker. Confirmatory tests can also yield “indeterminate” results, meaning that it is notpossible to be certain whether the individual is infected with the virus. Some studies have suggestedthat—depending on the population—most indeterminate confirmatory tests are probably negative. Thestatus of donors who have indeterminate test results is resolved over time by additional testing. Unitsthat test repeatedly reactive for HIV, HBV, and HCV may not be used for transfusion or for furthermanufacturing regardless of the more specific or confirmatory test results, except in specialcircumstances.
43“Sensitivity” is the probability of a unit’s testing positive if a viral marker is truly present. Assensitivity increases, the number of persons whose blood contains the virus but who are missed (falsenegatives) by being incorrectly classified decreases. In other words, sensitivity = true positives ÷ (truepositives + false negatives). “Specificity” is the probability of a unit’s testing negative if a virus is trulyabsent. A highly specific test is rarely positive when a virus is not present and therefore results infewer persons without the virus being incorrectly classified (false positives). In other words,specificity = true negatives ÷ (true negatives + false positives).
GAO/HEHS-98-205 Blood Plasma SafetyPage 41
Appendix II
Additional Information on Testing
Procedures
Any unit that is repeatedly reactive is considered positive even ifconfirmatory tests determine that the testing procedure produced afalse-positive result. Such results require that the donor be deferred. FDA
recommends but does not require that donors who are repeatedly reactivebut indeterminate or negative by a confirmatory test should be notifiedand placed on donor deferral registries.
As an added precaution against the inclusion of any plasma that maycontain undetectable HIV virus, one company performs additional tests forthe HIV antibody. Each donation is tested according to the standards notedabove by supplementary testing using a different antibody test than thatused in the initial screening procedure. The testing uses “minipools”derived from samples of 64 donations.44 Units corresponding to testsamples that are confirmed reactive for anti-HIV at individual sampling arethen rejected and the donor is deferred. Only nonreactive donations areconsidered to be acceptable for further manufacture.
PCR testing—which is more sensitive than licensed antigen or antibodydetection methods currently used to screen collected plasma—will bedone on pools of plasma rather than single donations. This approach isbeing pursued because of the constant state of rapid evolution of nucleicacid diagnostics and increased cost-effectiveness of pool testing. FDA hasnoted that it considers pool testing an interim step, but the agency doesbelieve that testing of plasma pools has public health benefits and shouldbe implemented. Consistent with this position, tests for plasma pools arenow under “investigational new drug” status and are planned to be used byall fractionators to test all units of donated plasma in minipools.
Some companies have also determined that every product lot that is to bereleased should be tested one more time to ensure that there were noterrors during the testing of the plasma, testing of the pools, and themanufacturing of the product. Final testing of lots for some companiesincludes tests for HBsAg, while other companies test for HIV using antibodytesting and for HIV, HBV, HCV, and HAV using PCR tests.
44Minipool testing is done by taking samples of individual donations and combining them. If theminipool is found to be reactive for anti-HIV, then the reactive sample is identified by individualsample testing.
GAO/HEHS-98-205 Blood Plasma SafetyPage 42
Appendix III
Viral Clearance Through Inactivation andRemoval
Heating and chemical inactivation are the two main methods in use todayto inactivate viruses. Heating in solution, terminal dry heat, vapor heating,and dry heat under solvent are commonly used. For chemical inactivation,manufacturers typically use solvent-detergent techniques, ethanol (duringfractionation), and low pH. Viral removal steps include partitioning andnanofiltration. Partitioning during purification includes ethanolfractionation and chromatography, whereas nanofiltration can beaccomplished through adsorption or through filters that discriminate to 15to 100 nanometers.
To be effective, viral inactivation techniques must destroy at least one ofthe essential elements of viral replication.45 These techniques work indifferent ways to accomplish this task. Photosensitizing techniques uselight-activated dyes that are irradiated, causing the dyes to convert tomolecules that can destroy DNA or membrane lipoproteins. Heat treatmentdenatures viral proteins and nucleic acids, rendering them incapable ofviral replication. Irradiation processes inhibit viral DNA by inducing breaksand linkages. Solvent-detergent techniques destroy the viral envelope inlipid-enveloped viruses. Viral removal methods, including chromatographyand filtration, physically separate virus particles and other impurities fromthe desired plasma proteins.
Validation of viral clearance steps is accomplished through a scaled-downproduction method to a laboratory model. Material is spiked with a markervirus (such as bovine viral diarrhea virus for HCV or duck hepatitis B virusfor HBV); titers are then compared in the starting and ending material afterperforming the operations dictated by the laboratory model. Thisscaled-down model must maintain the physical parameters that willreplicate the production method, including time, temperature, pressure,concentration, flow rates, and pH. It must also maintain the physicaldimensions of volume, load, and surface area and column dimensions.These validation models cannot demonstrate complete elimination of avirus, but they can highlight the difference in titers in the beginning andend of the production model. This modeling will highlight the actual viralkill that has been accomplished through inactivation, removal, or both.The effect of multiple clearance steps may be combined if each step isindependently validated and each is based on a mechanism that isdifferent from other clearance steps.
45Viral replication requires cell attachment by the virus to a cell receptor, penetration of the cell,replication and translation of viral nucleic acids, and exit from the cell with integrated viral particles.
GAO/HEHS-98-205 Blood Plasma SafetyPage 43
Appendix III
Viral Clearance Through Inactivation and
Removal
Units that have been tested for HIV that were in the window period show arange of genome copies per milliliter of 103 to 107 (with occasional spikesto 108 range), while seropositive units are in the range of 103 to 106. Foralbumin, the viral log reduction factor (LRF) using pasteurization has beenshown to be greater than 7, while partitioning during fractionation showsLRFs to be greater than 6.46 Additionally, there have been no cases of HIV,HCV, or HBV transmission through albumin since initiation of heating (at 60degrees Celsius for 10 hours) of the final containers. For IGIM, thecumulative LRF for HIV in one model was greater than 10.9 (6.2 usingethanol fractionation and 4.7 using solvent-detergent techniques). For IGIV,the cumulative LRF for one process was greater than 17.5 (5.9 using ethanolfractionation, 5.2 using solvent-detergent techniques, and 6.4 using pH 4).Processes for IGIV from another model show LRFs of 13.2 and 11.4 usingethanol fractionation and heat treating or ethanol fractionation and a pHof 4 using Pepsin, respectively). For antihemophilic factor, the cumulativeLRF for one process was greater than 15.7 (5.2 using purification and 10.5using heat treating at 60 degrees Celsius for 10 hours), while anothercompany’s procedure showed LRFs of greater than 12 (2 using affinitychromatography and greater than 10 using solvent-detergent techniques).Similar reductions are found for coagulation factor IX. Thus, these LRFs forHIV are well above the levels of genome copies per milliliter found in unitsthat are from window period and seropositive donations.
For HCV, genome copies per milliliter found in window period units rangesfrom 103 to 108, while seropositive units range from 103 to 106. For albuminproducts, LRFs for HCV model viruses have been shown to be greater than11 using pasteurization and processing techniques. For IGIM, thecorresponding LRF for one process was greater than 10.1 (3.3 using ethanolfractionation, greater than 5 using solvent-detergent techniques, and 1.8using filtration). For IGIV, one company’s clearance profile was greaterthan 11.5 (3.2 using ethanol fractionation, greater than 4.2 usingsolvent-detergent techniques, and greater than 4.1 at pH 4), while anotherprocedure showed an LRF greater than 10.1 (3.5 using ethanol fractionationand greater than 6.6 using heat treating at 60 degrees Celsius for 10 hours).For antihemophilic factor, one process had a cumulative LRF of greaterthan 17.0 (7.6 using affinity chromatography, greater than 4.5 usingsolvent-detergent techniques, and greater than 4.9 using dry heating). LRFsgreater than 10.3 are found for coagulation factor IX. Again, these LRFs are
46LRF = log x [(V1 x T1) ÷ (V2 x T2)], where V1 = volume of starting material, T1 = concentration ofvirus in starting material, V2 = volume of material after process step, and T2 = concentration of virusafter the step. LRFs less than 1 are not considered significant, whereas LRFs greater than 4 are clearlyeffective.
GAO/HEHS-98-205 Blood Plasma SafetyPage 44
Appendix III
Viral Clearance Through Inactivation and
Removal
well above the levels of genome copies per milliliter found in units that arefrom window period and seropositive donations.
(108348) GAO/HEHS-98-205 Blood Plasma SafetyPage 45
Ordering Information
The first copy of each GAO report and testimony is free.
Additional copies are $2 each. Orders should be sent to the
following address, accompanied by a check or money order
made out to the Superintendent of Documents, when
necessary. VISA and MasterCard credit cards are accepted, also.
Orders for 100 or more copies to be mailed to a single address
are discounted 25 percent.
Orders by mail:
U.S. General Accounting Office
P.O. Box 37050
Washington, DC 20013
or visit:
Room 1100
700 4th St. NW (corner of 4th and G Sts. NW)
U.S. General Accounting Office
Washington, DC
Orders may also be placed by calling (202) 512-6000
or by using fax number (202) 512-6061, or TDD (202) 512-2537.
Each day, GAO issues a list of newly available reports and
testimony. To receive facsimile copies of the daily list or any
list from the past 30 days, please call (202) 512-6000 using a
touchtone phone. A recorded menu will provide information on
how to obtain these lists.
For information on how to access GAO reports on the INTERNET,
send an e-mail message with "info" in the body to:
or visit GAO’s World Wide Web Home Page at:
http://www.gao.gov
PRINTED ON RECYCLED PAPER

United StatesGeneral Accounting OfficeWashington, D.C. 20548-0001
Official BusinessPenalty for Private Use $300
Address Correction Requested
Bulk RatePostage & Fees Paid
GAOPermit No. G100