driss re · Title: driss_re Created Date: 5/27/2015 9:41:13 AM
Upload
reilly-wigingtonCategory
view
214download
0
Heejun Chang, Madeline Steele, Terrance Anthony Department of Geography, Portland State University
Driss Ennaanay, Manu SharmaNatural Capital Project, Stanford University
Oregon Water ConferenceCorvallis, May 24, 2011
Climate Chang and Shifts in Water Related Ecosystem Services in the Tualatin and Yamhill River basins

Ecosystem Services
• Ecological characteristics, functions, or processes that directly or indirectly contribute to human well-being.
• In short, the benefits we receive from “natural capital”• Market services (e.g., food, energy, timber)• Nonmarket services (e.g., pollution filtering,
temperature regulation, biodiversity habitat, aesthetics)
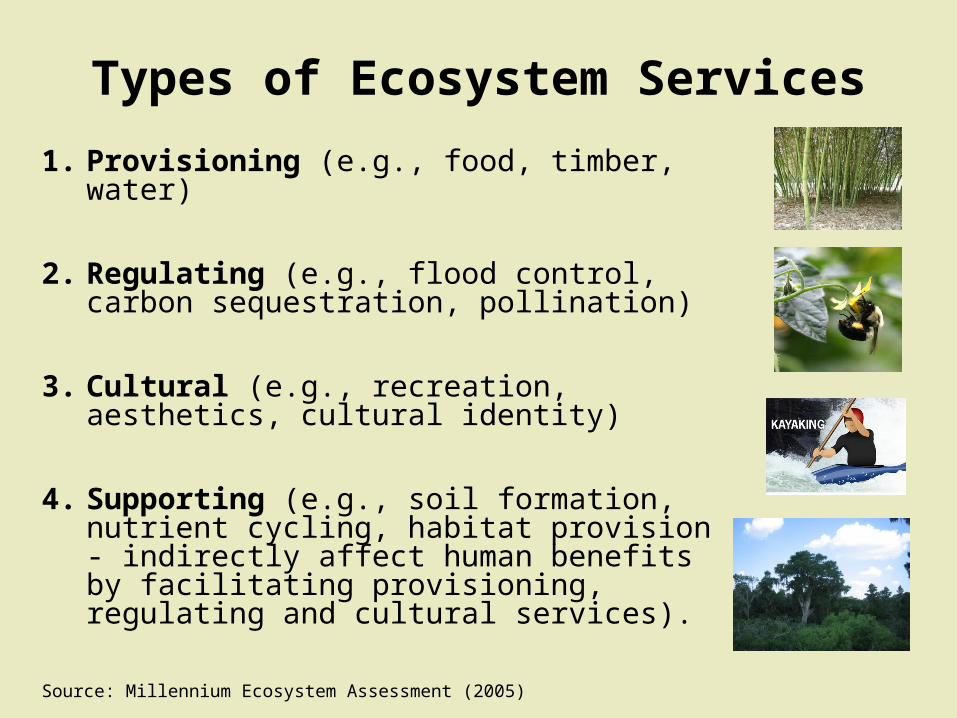
Types of Ecosystem Services
1. Provisioning (e.g., food, timber, water)
2. Regulating (e.g., flood control, carbon sequestration, pollination)
3. Cultural (e.g., recreation, aesthetics, cultural identity)
4. Supporting (e.g., soil formation, nutrient cycling, habitat provision - indirectly affect human benefits by facilitating provisioning, regulating and cultural services).
Source: Millennium Ecosystem Assessment (2005)
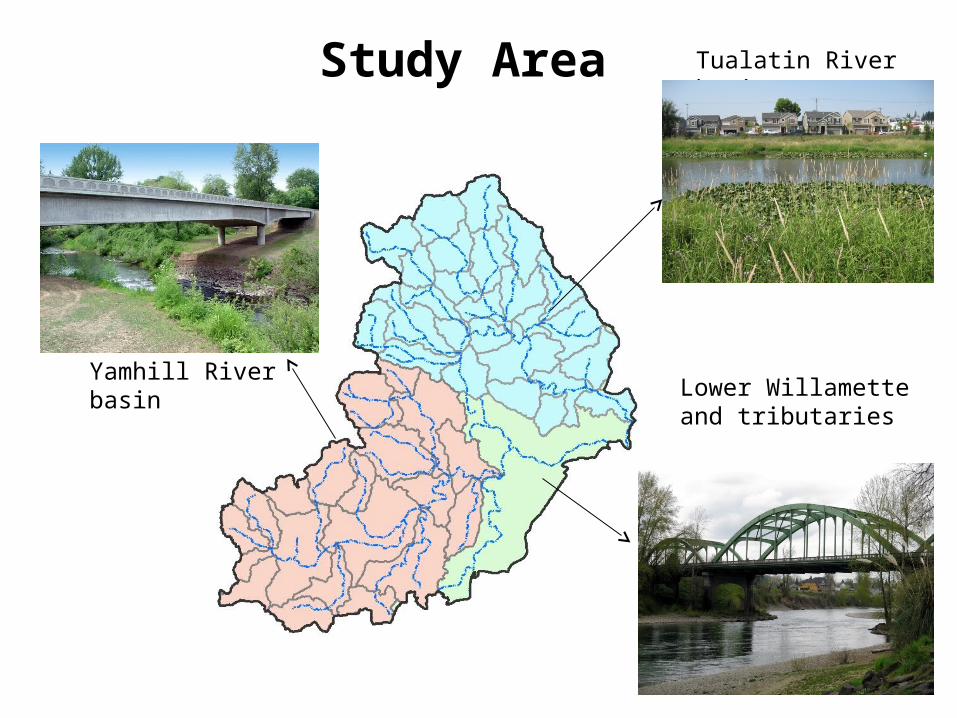
Yamhill River basin
Tualatin River basin
Lower Willamette and tributaries
Study Area


Population Change, 1900-2010

Climate Change, 1900-2100
Summer Precipitation
Temperature
Source: Mote and Salathe (2010) Climatic Change

Research Questions
1. What is the effect of climate change on water-related ecosystem services (water yield, N, P, Sediment retention)?
2. Which parts of the basin provide the greatest water yield, sediment and nutrient retention?
3. Do spatial patterns persist regardless of different climate regimes?
4. How do we bundle these multiple ecosystem services together?

Water Purification
Storm Peak Mitigation,
Irrigation, Baseflow, , Groundwater recharge
Hydropower
Water yield
Sediment
Valuati
on
Land use land cover
Soil
Digital Elevation Model
Climate: PPT, PET
Water yield
Sediment
Nutrient
Energy
Others
Ret.$
Pur. $
E. $

InVEST Water Models’ Objectives
VALUE OF EACH PARCEL ON THE LANDSCAPE
Need to determine contribution (production
function) of each parcel in ecosystem service of
interest
Where are the sources of nutrients/sediment?
Where are the nutrients/sediment retention
areas?
How much is retained?
What is the value of this retention?

Datasets
Land Use/Land Cover
Climate/Weather
Streamflow
Current-Wet USGS NLCD NOAA 1995-1999 USGS/OWRD
Current-Norm USGS NLCD NOAA 2002-2006 USGS/OWRD
Current-Dry USGS NLCD NOAA 1988-1992 USGS/OWRD
Future – Dev (2050)
PNWERC or EPA ICLU
IPCC AR 5th SWAT model output
Future – Cons (2050)
PNWERC or EPA ICLU + TNC Synthesis map
IPCCAR 5th SWAT model output

Dry yearWet year
Water Yield
Normal year
(unit: m3 )
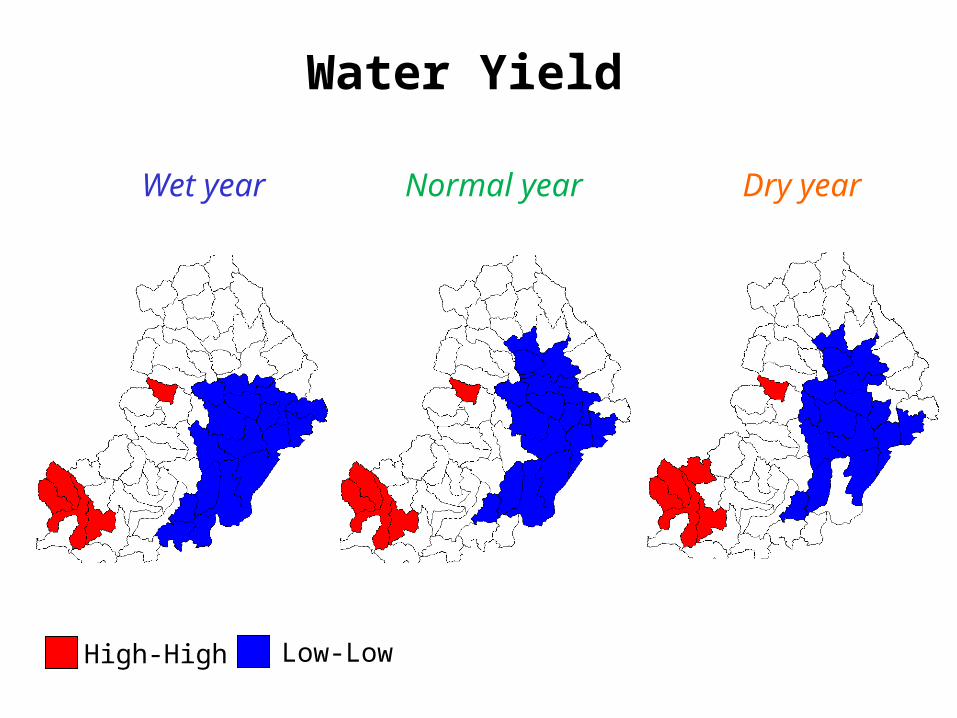
Wet year
High-High Low-Low
Water Yield
Dry yearNormal year

Wet year
Phosphorous retention
Normal year
(unit: kg )
Dry year

Wet year
High-High Low-Low
Dry year
Phosphorous Retention
Normal year

Sediment (Normal year)
Sediment (load)
(unit: tons)
Sediment (retention)
(unit: tons)

Load
High-High Low-Low
Sediment Export
Retention

Normalized
Water Yield
Normalized
Phosphorous retention
Normalized
Sediment retention
Bundled Process (Normal year)
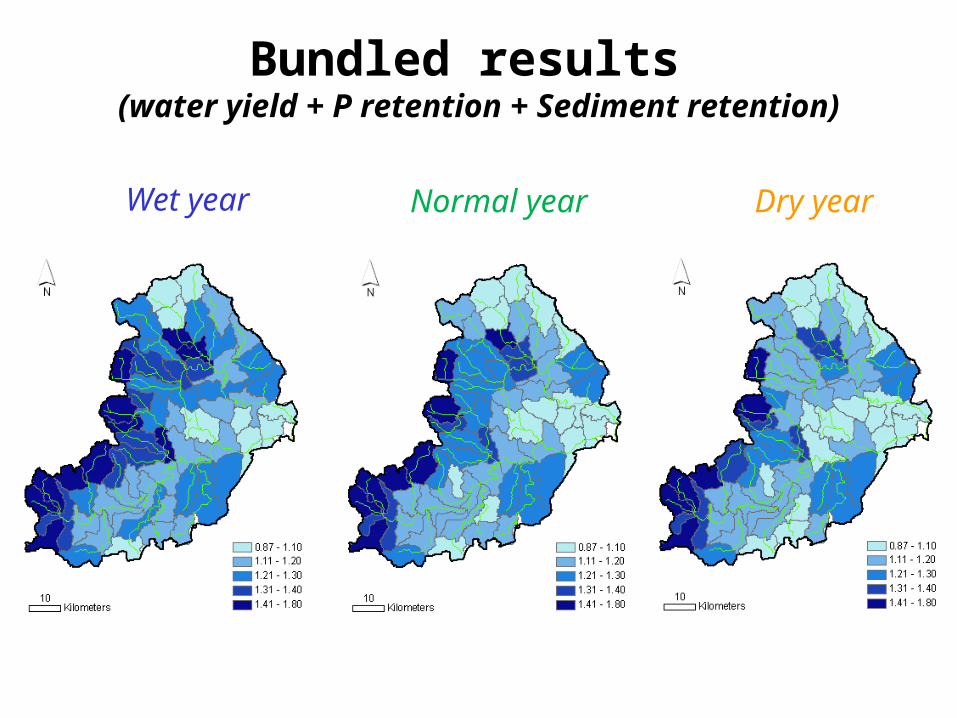
Bundled results (water yield + P retention + Sediment retention)
Wet year Normal year Dry year

Wet year
High-High Low-Low
Bundled Services
Dry yearNormal year

Stakeholder involvement

Stakeholder involvement

DevelopmentPlan trend Conservation
Future land cover scenarios (2040)
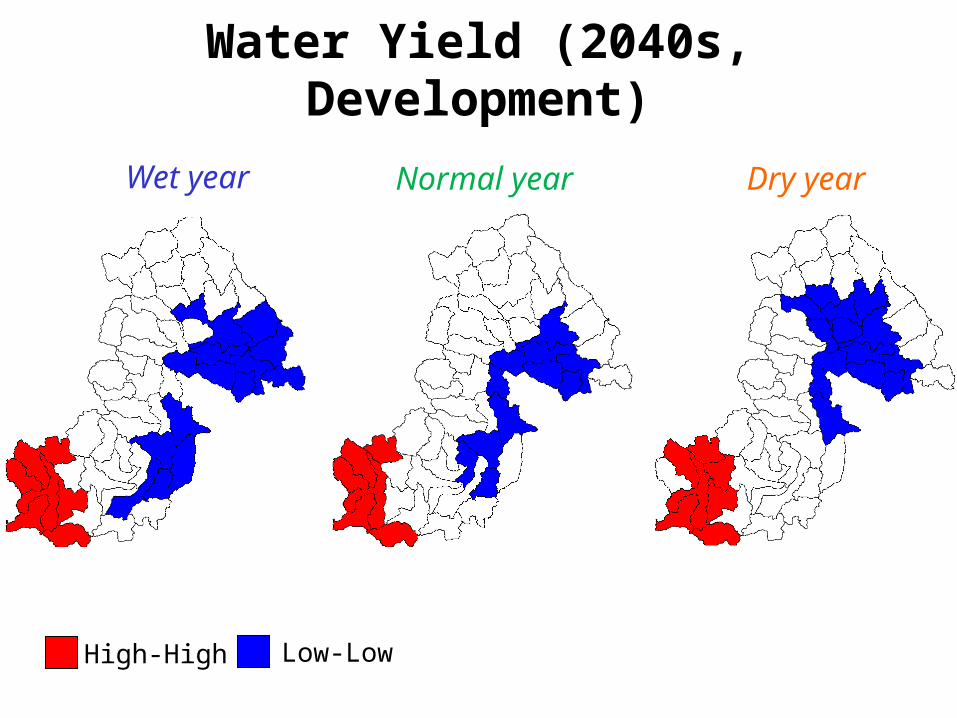
Dry yearWet year
Water Yield (2040s, Development)
Normal year
High-High Low-Low

Conclusions
1. Upper Yamhill sub-basins provide the most water yield and sediment retention, while lower valley areas have the highest phosphorus retention.
2. Climate change has either reduce or increase water yield and phosphorus retention depending on the direction of precipitation change.
3. Spatial patterns generally persist regardless of different climate regimes.
4. Bundling is a complex sociopolitical process and may not necessarily in line with biophysical modeling results.

Questions or comments: contact Heejun Chang at [email protected]
Acknowledgements
This research was supported by the US National Science Foundation (#1026629). Additional support was provided by the Institute for
Sustainable Solutions at PSU.