HEDIS 2005 Final Report_1_20_06 - mass.gov · Web viewMassHealth Managed Care HEDIS® 2005 Final...
115
Center for Health Policy & Research (chpr) University of Massachusetts Medical School December 2005 MassHealth Managed Care HEDIS ® 2005 FINAL REPORT Prepared by: Center for Health Policy and Research (CHPR) in collaboration with the Office of Acute and Ambulatory Care (OAAC) and the MassHealth Behavioral Health Program (MHBH) Project Team Center for Health Policy and Research Greg Leung Rebecca Ouellette Office of Acute and Ambulatory Care Louise Bannister Marlene Kane Amina Khan Ella Litvak Susan
Transcript of HEDIS 2005 Final Report_1_20_06 - mass.gov · Web viewMassHealth Managed Care HEDIS® 2005 Final...

Center for Health Policy & Research (chpr)University of Massachusetts Medical School
December 2005
MassHealth Managed Care HEDIS® 2005FINAL REPORTPrepared by:
Center for Health Policy and Research (CHPR)in collaboration with the Office of Acute and Ambulatory Care (OAAC) and the MassHealth Behavioral Health Program (MHBH)
Project Team
Center for Health Policy and ResearchGreg Leung
Rebecca Ouellette
Office of Acute and Ambulatory CareLouise Bannister
Marlene Kane Amina Khan
Ella Litvak Susan Maguire Mary Ann Mark
Liza Rudell David Tringali
Kate Willrich-Nordahl
MassHealth Behavioral Health ProgramJohn DeLuca
Office of Clinical AffairsAnn Lawthers

MassHealth Managed Care HEDIS® 2005 Final Report Center for Health Policy and Research
1
Table of Contents
Executive Summary................................................................................................................................2Introduction..............................................................................................................................................5
Organization of the MassHealth Managed Care HEDIS 2005 Report....................................................7Health Plan Profiles.................................................................................................................................9Data Collection and Analysis Methods..................................................................................................12
Staying HealthyBreast Cancer Screening......................................................................................................................16Cervical Cancer Screening...................................................................................................................20Prenatal and Postpartum Care..............................................................................................................22Frequency of Ongoing Prenatal Care...................................................................................................26Adults’ Access to Preventive/Ambulatory Health Services...................................................................28
Getting BetterAppropriate Treatment for Children with Upper Respiratory Infection..................................................34
Living With IllnessControlling High Blood Pressure...........................................................................................................38Initiation and Engagement of Alcohol and Other Drug Dependence Treatment...................................42Follow-up After Hospitalization for Mental Illness.................................................................................46Antidepressant Medication Management..............................................................................................50
Appendix A: Initiation and Engagement of Alcohol and Other Drug Dependence Treatment–Age-Stratified Results..............................................................................................................................55
Appendix B: Select PCC Plan Data by Eligibility Type..........................................................................59
Appendix C: PCC Plan Data with and without the Essential Population...............................................63
References.............................................................................................................................................67

Executive Summary
MassHealth Managed Care HEDIS® 2005 Final Report Center for Health Policy and Research
2
Background
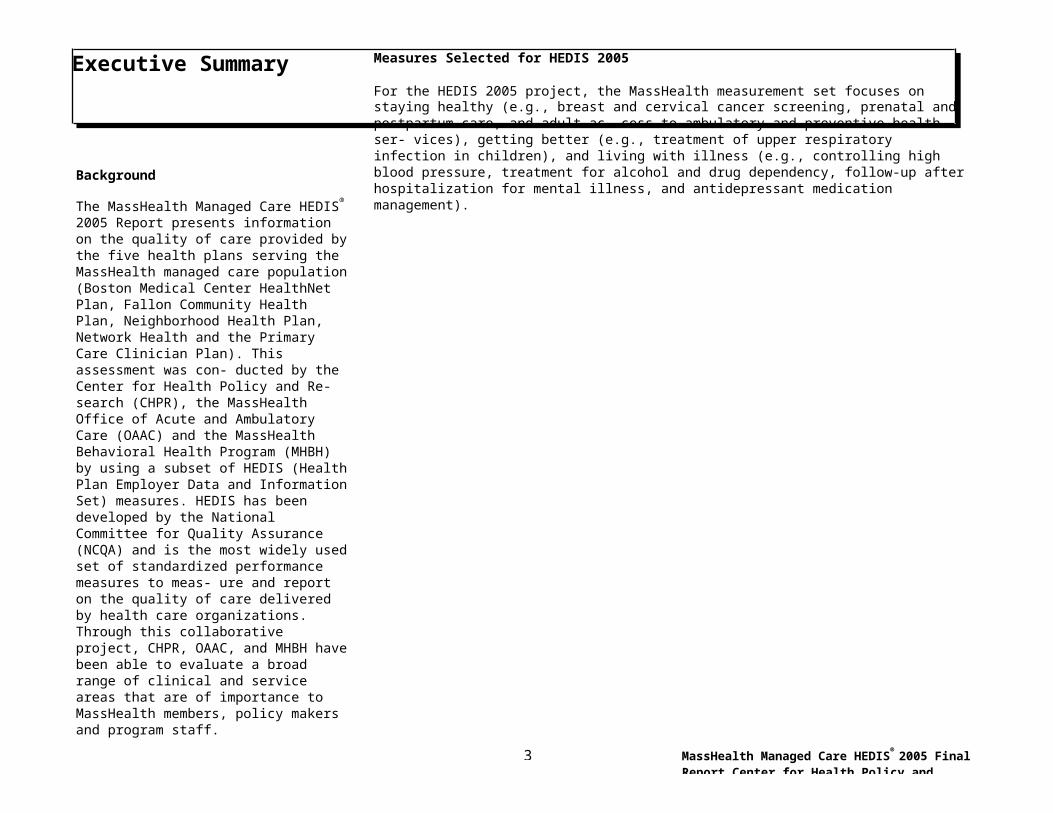
The MassHealth Managed Care HEDIS® 2005 Report presents information on the quality of care provided by the five health plans serving the MassHealth managed care population (Boston Medical Center HealthNet Plan, Fallon Community Health Plan, Neighborhood Health Plan, Network Health and the Primary Care Clinician Plan). This assessment was con- ducted by the Center for Health Policy and Re- search (CHPR), the MassHealth Office of Acute and Ambulatory Care (OAAC) and the MassHealth Behavioral Health Program (MHBH) by using a subset of HEDIS (Health Plan Employer Data and Information Set) measures. HEDIS has been developed by the National Committee for Quality Assurance (NCQA) and is the most widely used set of standardized performance measures to meas- ure and report on the quality of care delivered by health care organizations. Through this collaborative project, CHPR, OAAC, and MHBH have been able to evaluate a broad range of clinical and service areas that are of importance to MassHealth members, policy makers and program staff.
Measures Selected for HEDIS 2005
For the HEDIS 2005 project, the MassHealth measurement set focuses on staying healthy (e.g., breast and cervical cancer screening, prenatal and postpartum care, and adult ac- cess to ambulatory and preventive health ser- vices), getting better (e.g., treatment of upper respiratory infection in children), and living with illness (e.g., controlling high blood pressure, treatment for alcohol and drug dependency, follow-up after hospitalization for mental illness, and antidepressant medication management).
Summary of Overall Results
Results from the MassHealth Managed Care HEDIS 2005 project demonstrate that Mass- Health plans performed well overall when com- pared to other Medicaid plans around the country. For the purpose of this report, we conducted tests of statistical significance and compared the performance of the individual MassHealth plans with that of the top 25% of all Medicaid plans in the country (represented by the national Medicaid 75th percentile).
For some measures such as Breast and Cervi- cal Cancer Screening, Appropriate Treatment for Children with Upper Respiratory Infection, and Adults’ Access to Ambulatory and Preven- tive Health Services, MassHealth plans gener- ally reported rates that are significantly better than or no different from the national Medicaid 75th percentile. Results were mixed for other measures such as Prenatal and Postpartum Care and Antidepressant Medication Manage- ment. For these measures, fewer plans re- ported rates that were significantly better than or no different from the Medicaid 75th percen- tile. One measure, Follow-up after Hospitaliza- tion for Mental Illness, yielded results with sig- nificant variation across the plans. It is not known whether the cause of this variation is a true difference in quality or some other factor such as differences in the demographic char- acteristics and health status of the populations served by the plans. Performance on new measures was encouraging, particularly on the Appropriate Treatment for Children with Upper Respiratory Infection, for which four plans re- ported rates that were significantly better than the national Medicaid 75th percentile.
MassHealth HEDIS 2005 Highlights
MassHealth plans performed well overall when compared to Medicaid plans throughout the U.S.
Some plans performed significantly bet- ter than or no different from the national Medicaid 75th percentile on measures such as breast and cervical cancer screening, treatment for children with upper respiratory infection, and adults’ access to ambulatory and preventive health services. The national Medicaid 75th percentile represents a level of per- formance that was exceeded by only the top 25% of all Medicaid plans in the U.S.
Results for some measures, such as pre- natal and postpartum care and antide- pressant management, were mixed.
There was wide variation among some plans for certain measures, including the Follow-up after Hospitalization for Mental Illness measure. The cause of this varia- tion is not known but one factor may be differences in demographic and health characteristics

Executive Summary (continued)
MassHealth Managed Care HEDIS® 2005 Final Report Center for Health Policy and Research
3
Breast and Cervical Cancer Screening For breast cancer screening, all five Mass-
Health plans performed significantly better than the national Medicaid 75th percentile.
One plan reported a HEDIS 2005 breast cancer screening rate that was significantly better than the plan’s own HEDIS 2003 rate.
For cervical cancer screening, all five MassHealth plans performed significantly better than the national Medicaid 75th per- centile.
All five plans reported HEDIS 2005 cervical cancer screening rates that were not sig- nificantly different from their 2003 rates.
Prenatal and Postpartum Care/Frequency of Ongoing Prenatal Care Three plans performed significantly better
than the national Medicaid 75th percentile on the timeliness of prenatal care measure.
One plan’s rate for the timeliness of prena- tal care measure was significantly better than its HEDIS 2003 rate.
Performance on the postpartum visit rate was lower than that on the prenatal care measure. No MassHealth plan performed better than the national Medicaid 75th per- centile, although two plans had rates that were not significantly different from the benchmark.
All five plans had HEDIS 2005 rates that were not significantly different from their HEDIS 2003 rates.
Three plans performed significantly better than or no different from the national Medi- caid 75th percentile on the frequency of ongoing prenatal care measure.
Adults’ Access to Ambulatory and Preven- tive Health Services Four plans had rates that were significantly
better than or no different from the national Medicaid 75th percentile for both the 20-44 and 45-64 age groups.
Comparisons were not made to previous plan performance because this measure was last reported by MassHealth plans in 1997.
Appropriate Treatment for Children with Upper Respiratory Infection This was a new measure for the Mass-
Health plans. Four of the MassHealth plans performed
significantly better than the national Medi- caid 75th percentile.
Controlling High Blood Pressure This was a new measure for the Mass-
Health plans. Four plans reported rates that were not
significantly different from the 75th percen- tile.
Initiation and Engagement of Alcohol and Other Drug Dependence Treatment This was a new measure for the Mass-
Health plans. For the Initiation rate, three plans reported
rates that were significantly better than or no different from the national Medicaid 75th percentile.
For the Engagement rate, all five plans reported rates that were significantly better than or no different from the national Medi- caid 75th percentile.
Follow-up after Hospitalization for Mental Illness For both the 7-day and 30-day follow-up
rates, four plans reported rates that were significantly better than or no different from the national Medicaid 75th percentile.
Three plans reported rates that were sig- nificantly better than their 2003 rates for both the 7-day and 30-day follow-up rates.
Antidepressant Medication Management For the Optimal Practitioner Contacts rate,
three plans had rates that were significantly better than or no different from the national Medicaid 75th percentile.
For the Effective Acute Phase measure, two plans reported rates that were not sig- nificantly different from the national Medi- caid 75th percentile.
For the Effective Continuation Phase rate, one plan reported a rate that was not sig- nificantly different from the national Medi- caid 75th percentile.
Performance since 2003 was mixed. For all three measures, MassHealth plans gen- erally reported rates that were significantly lower than or no different from than their HEDIS 2003 rates, indicating room for im- provement.
MassHealth Managed Care HEDIS® 2005 Final Report Center for Health Policy and Research
4
Summary of MassHealth Managed Care HEDIS 2005 Results
HEDIS Measure National Medicaid 75th Percentile PCCP NHP NH FCHP BMCHP
Breast Cancer Screening 59.8% 65.0%↑ 74.3%↑ 64.4%↑ 70.4%↑ 78.1%↑Cervical Cancer Screening 72.3% 74.8%↑ 83.2%↑ 79.4%↑ 86.5%↑ 82.0%↑Prenatal and Postpartum Care
Timeliness of Prenatal Care 86.4% 69.1%↓ 91.6%↑ 79.3%↓ 94.0%↑ 91.0%↑Postpartum Care 65.2% 43.6%↓ 57.9%↓ 60.6% 66.7% 60.1%↓
Frequency of Ongoing Prenatal Care≥ 81% of Expected Visits 67.6% 54.5%↓ 82.1%↑ 56.2%↓ 70.5% 72.0%
Adults' Access to Preventive/Ambulatory Health ServicesAges 20-44 83.6% 85.1%↑ 85.4%↑ 82.7%↓ 85.3% 85.2%↑Ages 45-64 87.3% 89.8%↑ 85.2%↓ 86.5% 88.6% 89.7%↑
Appropriate Treatment for Children with Upper Respira- tory Infection 85.6% 70.1%↓ 91.9%↑ 89.9%↑ 90.2%↑ 91.1%↑
Controlling High Blood Pressure 68.4% 64.2% 66.9% 56.0%↓ 71.7% 65.9%Initiation and Engagement of Alcohol and Other Drug Dependence Treatment
Initiation - All Ages 51.6% 36.3%↓ 73.7%↑ 40.4%↓ 94.6%↑ 50.6%Engagement - All Ages 15.0% 17.5%↑ 44.4%↑ 14.2% 69.9%↑ 24.4%↑
Follow-up After Hospitalization for Mental Illness7-Day Follow-up 49.6% 46.0%↓ 65.1%↑ 55.9%↑ 61.3% 60.5%↑30-Day Follow-up 70.6% 65.5%↓ 85.2%↑ 75.1%↑ 80.0% 80.3%↑
Antidepressant Medication ManagementOptimal Practitioner Contacts for Medication Management 25.4% 18.8%↓ 30.0%↑ 14.3%↓ 35.1% 35.1%↑
Effective Acute Phase Treatment 51.5% 48.1%↓ 41.3%↓ 52.0% 44.2% 34.5%↓Effective Continuous Phase Treatment 35.2% 32.6%↓ 24.6%↓ 37.1% 22.1%↓ 19.4%↓
Key: PCCP—Primary Care Clinician Plan NHP—Neighborhood Health Plan NH—Network HealthFCHP—Fallon Community Health Plan BMCHP—Boston Medical Center HealthNet Plan
↑ Indicates a rate that is significantly above the national Medicaid 75th percentile.↓ Indicates a rate that is significantly below the national Medicaid 75th percentile.

MassHealth Managed Care HEDIS® 2005 Final Report Center for Health Policy and Research
5
Introduction
MassHealth Managed Care HEDIS® 2005 Final Report Center for Health Policy and Research
6
Purpose of the Report
This report presents the results of the Mass- Health Managed Care HEDIS 2005 project. This report was designed to be used by Mass- Health program managers and by managed care organization (MCO) managers to identify plan performance on select HEDIS measures, compare performance with that of other plans and with national benchmarks, identify oppor- tunities for improvement, and set quality im- provement goals.
Project Background
Since 2001, the Center for Health Policy and Research (CHPR) has collaborated with the MassHealth Office of Acute and Ambulatory Care (OAAC) and the MassHealth Behavioral Health Program (MHBH) to conduct an annual assessment of the performance of all Mass- Health managed care organizations (MCOs) and the Primary Care Clinician (PCC) Plan, the primary care case management program administered by the Executive Office of Health and Human Services (EOHHS). CHPR, OAAC and MHBH conduct this annual as- sessment by using a subset of HEDIS meas- ures. Developed by the National Committee for Quality Assurance (NCQA), HEDIS is the most widely used set of standardized perform- ance measures to measure and report on the quality of care delivered by health care organi- zations. HEDIS includes clinical measures, as well as measures of access to care and utili- zation of services.
The measures selected for the MassHealth Managed Care HEDIS 2005 project assess the performance of the five MassHealth plans that provided health care services to Mass- Health managed care members during the 2004 calendar year. The five MassHealth plans included in this report are the Primary Care Clinician Plan (PCCP), Neighborhood Health Plan (NHP), Network Health (NH), Fallon Community Health Plan (FCHP), and Boston Medical Center HealthNet Plan (BMCHP). Descriptive information about each health plan can be found in the Health Plan Profiles section on page 9.
MassHealth HEDIS 2005 Measures
MassHealth selected ten measures for the HEDIS 2005 project. The ten measures in- cluded in this report assess health care quality in three key areas: clinical quality, access and availability of care, and use of services.
The clinical quality measures included in this report provide information about preventive services, up-to-date treatments for acute ill- ness, management of chronic illness, and ap- propriate testing and screening. The specific topics evaluated in this report are breast and cervical cancer screening, controlling high blood pressure, follow-up after hospitalization for mental illness, antidepressant medication management, and appropriate treatment for children with upper respiratory infection.
The access and availability of care measures included in this report provide information
about the ability of members to get the basic and important services they need. The spe- cific topics evaluated in this report include pre- natal and postpartum care, adult access to preventive and ambulatory health services, and initiation and engagement of alcohol and other drug dependence treatment.
Use of service measures provide information about what services the health plan provides to its members. The use of services is af- fected by member characteristics such as age, sex, current medical condition, and so- cioeconomic status, all of which could vary across plans. The only use of service meas- ure included in this report provides information on the frequency of ongoing prenatal care.
Note: MassHealth measures member satis- faction through biennial administration of the Consumer Assessment of Health Plans (CAHPS®) survey. Results of the MassHealth CAHPS measurement effort can be found in the biennial MassHealth CAHPS report pro- duced by CHPR in collaboration with the UMASS Center for Survey Research (CSR).

Organization of the MassHealth Managed Care HEDIS 2005 Report
MassHealth Managed Care HEDIS® 2005 Final Report Center for Health Policy and Research
7
This report presents the results of the MassHealth Managed Care HEDIS 2005 project in three sections. The three sections are based on con- sumer reporting domains created by the Foundation for Accountability (FACCT). The FACCT domains group clinical and access HEDIS meas- ures with similar characteristics and are used in many national and regional health plan report card projects.
DOMAIN DEFINITION MEASURES SELECTED BY MASSHEALTH FOR HEDIS 2005REPORTING
Staying Healthy These measures provide information about how well a plan provides services that main- tain good health and prevent illness.
Breast Cancer Screening Cervical Cancer Screening Prenatal and Postpartum Care Frequency of Ongoing Prenatal Care Adults’ Access to Preventive and Ambulatory Health Services
Getting Better These measures emphasize how well a plan helps people recover from illness.
Appropriate Treatment for Children with Upper Respiratory Infection
Living with Illness These measures provide information about how well a plan helps people manage chronic illness.
Controlling High Blood Pressure Initiation and Engagement of Alcohol and Other Drug Dependence
Treatment Follow-up After Hospitalization for Mental Illness Antidepressant Medication Management
Separate data charts and supporting text have been added to the report for three measures— Adults’ Access to Preventive and Ambulatory Health Services, Initiation and Engagement of Alcohol and Other Drug Dependence Treatment, and Follow-up After Hospitalization after Mental Illness—in order to present PCC Plan data with and without the Essential population. For more information on this analysis, see page 11 of this report.
This report also includes three appendices that provide more detailed results.
Appendix A includes age-stratified results for the Initiation and Engagement of Alcohol and Other Drug Dependency Treatment measure.
Appendix B presents coverage type break-outs for the PCC Plan for three behavioral health-related measures. The coverage types included in the breakouts are Basic, Essential and non-Basic/non-Essential.
Appendix C presents data on the PCC Plan rates with and without the Essential population.
The schematic on the next page provides an overview of the template for reporting results for each measure.

Organization of the MassHealth Managed Care HEDIS 2005 Report
MassHealth Managed Care HEDIS® 2005 Final Report Center for Health Policy and Research
8
Name of measure Information on
the relevance of each measure
Statistical summary comparing plan rates to comparison rates named at the top of each column.• 2005 rate is significantly below the comparison rate.O 2005 rate is not significantly different from the comparison rate.
Individual HEDIS 2005 plan data including numerator, denominator, reported rate, and upper and lower confidence intervals
* 2005 rate is significantly above the comparison rate. Benchmarks including national Medicaid75th and 90th percentiles, national Medicaid mean, Massachusetts Com- mercial mean, and MassHealth weighted mean and median
Comparison of plan rates with the national Medicaid benchmarks and Massachusetts Commercial benchmarks. The black bars are the various benchmarks. The white bars represent rates that are significantly above the national Medicaid 75th percentile. The grey bars represent rates that are not significantly different from the national Medicaid 75th percentile. Bars with diagonal lines represent rates that are significantly below the national Medicaid 75th percentile.
Analysis of results, including the factors influencing performance and opportunities for improvement
Comparison data from HEDIS 2003, if available

Health Plan Profiles
MassHealth Managed Care HEDIS® 2005 Final Report Center for Health Policy and Research
9
MassHealth managed care plans provide care to over 600,000 Massachusetts residents.The MassHealth Managed Care HEDIS 2005 report includes data from five MassHealth plans serving members enrolled in managed care. This report does not reflect care pro- vided to MassHealth members receiving their health care services outside of the five man- aged care plans. The following profiles pro- vide some basic information about each plan and its members. The data chart on the next page provides a statistical summary of the demographic characteristics of each plan’s population.
Primary Care Clinician Plan (PCCP) Primary care case management program
administered by EOHHS. Statewide managed care option for Mass-
Health members eligible for managed care.
311,687 MassHealth members as of De- cember 31, 2004.
Provider network includes group practices, community health centers, hospital outpa- tient departments, and individual practitio- ners.
Behavioral health services are managed through a carve-out contract with the Mas- sachusetts Behavioral Health Partnership (MBHP).
Neighborhood Health Plan (NHP) Non-profit managed care organization that
serves primarily Medicaid members.
Vanguard Medical Associates, group prac- tices and hospital-based clinics.
Behavioral health services are managed through a carve-out contract with Beacon Health Strategies.
Network Health (NH) Medicaid-only provider-sponsored health
plan owned and operated by Cambridge Health Alliance.
65,658 MassHealth members as of De- cember 31, 2004.
Primary service areas are Cambridge, Somerville, Arlington, Malden, Revere, Worcester, Gardner-Fitchburg, Lawrence, Lowell, Southbridge and Springfield.
Provider network includes community health centers, group practices, hospital outpatient departments, and individual practitioners
Behavioral health services are provided by Network Health providers.
Fallon Community Health Plan (FCHP) Non-profit managed care organization that
serves the commercial, Medicare, and Medicaid populations.
8,536 MassHealth members as of Decem- ber 31, 2004.
Primary service areas are Worcester, Gardner-Fitchburg, Southbridge, and Framingham.
Behavioral health services are managed through a carve-out contract with Beacon
plan, owned and operated by Boston Medical Center, the largest public safety- net hospital in Boston.
126,220 MassHealth members as of De- cember 31, 2004.
Primary service areas are Springfield, Boston, New Bedford, Brockton, Fall River, Holyoke, Pittsfield and Westfield.
Provider network includes community health centers, hospital outpatient depart- ments, and group and individual practices.
Behavioral health services are provided by BMCHP providers.
Differences in Populations Served by MassHealth Plans
Demographic characteristics and membership health status, including factors such as age, gender, geographic residence and disability status, vary across the five plans. These variations are most visible in the differences between the four MCOs and the PCC Plan.The overall physical and mental health of a plan’s members (including disability status) may influence a plan’s HEDIS performance. Because HEDIS measures are not designed for case-mix adjustment, rates presented here do not take into account the medical and men- tal health status of the members included in the measures.
The data on the next page describe each plan’s population in terms of age, gender, dis-ability status, and use of Department of Mental
95,936 MassHealth members as of De- cember 31, 2004.
Health Services. Provider network for MassHealth
mem-Health services (a proxy for mental healthstatus). It is important for readers to con-
Primary service areas are Greater Boston, Lawrence, Lynn, Quincy, Revere, Brock- ton, and Worcester.
Provider network includes mostly commu- nity health centers in addition to Harvard
bers is exclusively through Fallon Clinicsites.
Boston Medical Center HealthNet Plan (BMCHP) Medicaid-only provider-sponsored health
sider the differences in the characteristicsof each plan’s population when reviewing and comparing the HEDIS performance of the five plans.

MassHealth Managed Care HEDIS® 2005 Final Report Center for Health Policy and Research
1
Health Plan Profiles: Demographic Characteristics of the Plan Populations
MassHealth Plan Total MassHealth Members Female Disabled DMH* Mean Age 0-11 yrs 12-17 yrs 18-39 yrs 40-64 yrs
Primary Care Clinician Plan 311,687 54.7% 24.9% 1.9% 26.0 26.8% 16.3% 29.6% 27.3%
Neighborhood Health Plan 95,936 61.0% 1.9% 0.2% 17.6 42.7% 18.8% 28.0% 10.5%
Network Health 65,658 58.1% 7.4% 0.5% 17.7 44.9% 16.1% 27.2% 11.9%
Fallon Community Health Plan 8,536 60.0% 11.2% 0.3% 20.8 36.6% 16.1% 31.5% 15.8%
Boston Medical Center HealthNet Plan 126,220 59.1% 9.7% 0.4% 18.0 44.0% 16.7% 27.2% 12.1%
TOTAL MASSHEALTH MANAGED CARE 608,037 57.1% 16.0% 1.20% 22.0 35.0% 16.8% 28.6% 19.7%
MassHealth members enrolled on 12/31/2004 (Source: MMIS)* These data represent the percentage of members who are served by the Massachusetts Department of Mental Health (DMH). These data are a proxy for mental health status.
Statistically Significant Differences Among the Plans
Female: All four MCOs have a significantly higher proportion of female members than the PCC Plan (p<.005). NHP, Fallon and BMCHP all have a signifi- cantly higher proportion of female members than Network Health, and NHP also has a significantly higher proportion of female members than BMCHP (p<.005).
Disabled: The PCC Plan has a significantly higher proportion of disabled members compared to the four MCOs (p<.005). In addition, BMCHP, Network Health and Fallon all have a significantly higher proportion of disabled members than NHP. Fallon and BMCHP also have a significantly higher proportion of disabled members than Network Health, and Fallon has a significantly higher proportion than BMCHP (p<.005).
DMH: The PCC Plan has a significantly higher proportion of members being served by the Department of Mental Health (DMH) than any of the four other MCOs (p<.005). BMCHP and Network Health both have a significantly higher proportion of members being served by DMH compared to NHP (p<.005).
Age: The mean age of PCC Plan's population is significantly older compared to the other four MCOs (t<.005). The mean age of NHP's and Network Health's members is significantly younger than that of BMCHP’s, Fallon’s and the PCC Plan’s members (t<.005). The mean age of NHP and Network Health's members is not significantly different.
Note: Generally, a p-value of 0.05 indicates statistical significance. For this analysis, however, the p-value was adjusted because multiple comparisons were made between plans (a total of 10 comparisons). Therefore, a p-value that is less than .005 is considered significant for this analysis. T-tests were used for age comparisons (t<.005 indicates significance).

Health Plan Profiles: Impact of Eligibility Types on HEDIS Data
MassHealth Managed Care HEDIS® 2005 Final Report Center for Health Policy and Research
1
MassHealth has several Medicaid eligibility types that are offered by all five MassHealth plans including the Basic, Standard, Com- monHealth, and Family Assistance coverage types. One eligibility type is offered by only the PCC Plan—MassHealth Essential. Mass- Health Essential covers individuals ages 19- 64 who are long-term unemployed and ineligi- ble for MassHealth Basic (certain individuals with non-citizen status are also eligible). Ten percent (10%) of the PCC Plan’s membership is enrolled in MassHealth Essential.
During the planning for the MassHealth Man- aged Care HEDIS 2005 project, it was de- cided that the PCC Plan’s data submission would include the Essential population. Inclu- sion of this population affected the results for some measures. These population differ- ences resulted in significantly different meas- urement results for three measures—Adults’ Access to Preventive and Ambulatory Health Services, Initiation and Engagement of Alco- hol and Other Drug Dependence Treatment, and Follow-up After Hospitalization after Men- tal Illness. For these measures, data charts and supporting text have been included in the main body of the report to demonstrate the differences in the PCC Plan’s rate with and without Essential members. Separate rates for Essential members are included in Appen- dix B for the behavioral health measures (Initiation and Engagement of Alcohol and Other Drug Dependence Treatment , Follow- up After Hospitalization for Mental Illness, and Antidepressant Medication Manage- ment). Appendix C includes data charts on
the PCC Plan’s data with and without the Es- sential population for all applicable measures.

MassHealth Managed Care HEDIS® 2005 Final Report Center for Health Policy and Research
1
Data Collection and Analysis Methods
Data Collection and SubmissionIn December 2004, the MassHealth Office of Acute and Ambulatory Care (OAAC) provided plans with a list of measures to be collected for HEDIS 2005. The list of measures was developed by key stakeholders within Mass- Health, including stakeholders within OAAC, the Office of Clinical Affairs, and the Mass- Health Behavioral Health Program. In gen- eral, each plan was responsible for collecting the measures according to the HEDIS 2005 Technical Specifications and for reporting the results using NCQA’s Data Submission Tool (DST). Each plan submitted its results to both NCQA and CHPR.
MassHealth does not require plans to undergo an NCQA Compliance Audit. NCQA Compli- ance Audits are independent reviews con- ducted by organizations or individuals li- censed or certified by NCQA. The purpose of the audit is to validate a plan’s HEDIS results by verifying the integrity of the plan’s data col- lection and calculation processes. All plans undergoing NCQA Accreditation must have their HEDIS data audited. NCQA only reports audited data in Quality Compass. One plan, Neighborhood Health Plan, voluntarily under- went an NCQA Compliance Audit for HEDIS 2005.
Eligible PopulationFor each HEDIS measure, NCQA specifies the eligible population by defining the age, continuous enrollment, enrollment gap, and diagnosis or event criteria that a member must meet to be eligible for a measure.
Age: The age requirements for Medicaid HE- DIS measures vary by measure. The Mass- Health program serves members up to the age of 65. Therefore, only data for members under 65 are presented in this report.
Continuous enrollment: The continuous en- rollment criteria varies for each measure and specifies the minimum amount of time that a member must be enrolled in a MassHealth plan before becoming eligible for that plan’s HEDIS measure. Continuous enrollment en- sures that a plan has had adequate time to deliver services to the member before being held accountable for providing those services.
Enrollment gap: The specifications for most measures allow members to have a gap in enrollment during the continuous enrollment period and still be eligible for the measure. The allowable gap is specified for each meas- ure but is generally defined for the Medicaid population as one gap of up to 45 days.
Diagnosis/event criteria: Some measures require a member to have a specific diagnosis or health care event to be included in the de- nominator. Diagnoses are defined by specific administrative codes (e.g., ICD-9, CPT).Other health care events may include pre- scriptions, hospitalizations, or outpatient visits.
The measure descriptions included in this re- port do not always include every requirement for the eligible populations (e.g., enrollment gaps). For complete specifications for each measure included in this report, please see
HEDIS 2005 Volume 2: Technical Specifica- tions.
Administrative vs. Hybrid Data Collection HEDIS measures are collected through one of two methodologies—the administrative method or the hybrid method.
The administrative method requires plans to identify the denominator and numerator using claims or encounter data, or data from other administrative databases. Plans calculated the administrative measures using programs developed by plan staff or NCQA-certified software purchased from a vendor. For meas- ures collected through the administrative method, the denominator includes all mem- bers who satisfy all criteria specified in the measure including any age and continuous enrollment requirements (these members are known as the “eligible population”). The plan’s HEDIS rate is based on all members in the denominator who are found through ad- ministrative data to have received the service reported in the numerator (e.g., visit, treat- ment, etc.).
The hybrid methodology requires plans to identify the numerator through both adminis- trative and medical record data. Plans may collect medical record data using plan staff and a plan-developed data collection tool.Plans may also contract with a vendor for the tool, staffing, or both. For measures collected using the hybrid methodology, the denomina- tor consists of a systematic sample of mem- bers drawn from the measure’s eligible popu- lation. This systematic sample generally con-

MassHealth Managed Care HEDIS® 2005 Final Report Center for Health Policy and Research
1
Data Collection and Analysis Methods (continued)
sists of a minimum required sample size of 411 members plus an over sample deter- mined by the plan to account for valid exclu- sions and contraindications. The measure’s rate is based on members in the sample (411) who are found through either administrative or medical record data to have received the ser- vice reported in the numerator. Plans may report data with denominators smaller than 411 for two reasons: 1) the plan has a small eligible population or 2) the plan reduced its sample size based on its previous year’s au- dited rate, according to NCQA’s specifica- tions.
It is important to note that performance on a hybrid measure can be impacted by the ability of a plan or its contracted vendor to locate and obtain member medical records. Per NCQA’s specifications, members for whom no medical record documentation is found are considered non-compliant with the measure.
Data AnalysisThroughout this report, we compare the HE- DIS 2005 results from each plan to several other rates and benchmarks, including the national Medicaid 75th percentile, national Medicaid mean, and Massachusetts Commer- cial mean.
National Medicaid 75th PercentileFor this report, the national Medicaid 75th per- centile serves as the benchmark to which plan performance is compared. This is a change from previous MassHealth HEDIS reports in which the MassHealth weighted mean was used for statistical tests of significance. The 75th percentile was used for the HEDIS 2005
because of concerns that plan size was skew- ing the MassHealth weighted mean. (Historically, MassHealth plans have consis- tently outperformed the national Medicaid mean on most measures. Therefore, the na- tional Medicaid mean is not used for tests of statistical significance for this report.) CHPR obtained the national Medicaid data through NCQA’s Quality Compass, a database of re- gional and national Medicaid and Commercial performance benchmarks. NCQA releases its Quality Compass in July of each year with the rates for Commercial and Medicare plans.NCQA provides the national Medicaid data in a supplement that is released in late Fall. (Individual state reporting requirements super- sede NCQA’s reporting deadline of June 15. Therefore, NCQA must wait until all Medicaid plans have submitted their data before calcu- lating and releasing the national Medicaid benchmarks.)
National Medicaid Mean & Massachusetts Commercial MeanNational Medicaid and Massachusetts Com- mercial means are also included as bench- marks in bar charts and data tables. Although the populations served by the plans repre- sented by the Commercial benchmarks are fundamentally different from the MassHealth population, these benchmarks are helpful for measures where some or all of MassHealth plans are exceeding the national Medicaid 75th percentile.
Other Benchmarks Included in this Report Other benchmarks are included in the data tables of this report including the national Medicaid 90th percentile, MassHealth
weighted mean, and MassHealth median. The national Medicaid 90th percentile repre- sents a level of performance that was ex- ceeded by only the top 10% of all Medicaid plans in the country. The 90th percentile is included as a future goal for MassHealth plans.
The MassHealth weighted mean is a weighted average of the five plans participating in HE- DIS 2005. The weighted average is calcu- lated by multiplying the performance rate for each plan by the number of individuals who met the eligibility criteria for the measure. The values are then summed across plans and divided by the total eligible population for all the plans. Because the MassHealth mean is a weighted average, the effect of a plan’s per- formance on the mean depends on the size of that plan. The largest MassHealth plan (PCC Plan) serves 51.3% of all MassHealth mem- bers and the smallest (FCHP) serves only 1.4%. Because of the differences in the size of the populations served by the plans, the MassHealth weighted mean is not used for tests of statistical significance.
The MassHealth median is also provided and is the middle value of the set of values repre- sented by the individual plan rates.
Caveats for the Interpretation of Results
All data analyses have limitations and those presented here are no exception.
Data Collection MethodologyPerformance on hybrid measures can be im- pacted by a plan’s ability (or that of its con-

Data Collection and Analysis Methods (continued)
MassHealth Managed Care HEDIS® 2005 Final Report Center for Health Policy and Research
1
tracted vendor) to locate and obtain member medical records as well as the quality of medi- cal record documentation. Per NCQA’s specifi- cations, members for whom no medical record documentation is found are considered non- compliant with the measure. This applies for records that cannot be located and obtained as well as for medical records that contain incom- plete documentation (e.g., indication of a test but no date or result).
Lack of Case-Mix AdjustmentThe specifications for collecting HEDIS meas- ures do not allow case-mix or risk-adjustment for existing co-morbidities, disability (physical or mental), or severity of disease. Therefore, it is difficult to determine whether differences among plan rates are due to differences in the quality of care or use of services, or differences in the health of the populations served by the plans.For example, the PCC Plan serves a signifi- cantly higher number of disabled members compared to the MCOs. The PCC Plan also serves a significantly higher number of mem- bers served by the Department of Mental Health.
Demographic Differences in Plan Membership In addition to disability, the populations served by each plan differ in other demographic char- acteristics such as gender, age, and geographic residence. As shown through the plan profile chart on page 10, the PCC Plan has more male members as well as more members in the 18- 39 and 40-64 age stratifications than the MCOs. (These differences may reflect the large number
of disabled members enrolled in the PCC Plan compared to the number enrolled in the MCOs.)
Potential Selection BiasAnother factor to consider when reviewing the HEDIS 2005 results is the possibility of a selec- tion bias caused by whether MassHealth mem- bers choose or are assigned to a specific Mass- Health health plan. For example, there may be differences between the members who select a health plan and the members who are automati- cally assigned to a health plan because they failed to make a selection. If members who do not select a health plan are automatically as- signed to one specific health plan, then a selec- tion bias may exist.
Overlapping Provider NetworksMany providers caring for MassHealth members have contracts with multiple plans. Overlapping provider networks may affect the ability of any one plan to influence provider behavior.
Variation in Data Collection ProceduresEach plan collects and reports its own HEDIS data. Although there are standard specifica- tions for collecting HEDIS measures, Mass- Health does not audit the plans’ data collection methods. Factors that may influence the collec- tion of HEDIS data by plan include:
- Use of software to calculate the administrative measures,- Use of a tool and/or abstractors from an exter- nal medical record review vendor,- Completeness of administrative data due to
claims lags,- Amount of time in the field collecting medical record data,- The overall sample size for medical record review (plans with small eligible populations could have a systematic sample smaller than 411 members),- Staffing changes among the plan’s HEDIS team,- Voluntary review by an NCQA-Certified HEDIS Auditor,- Choice of administrative or hybrid method. Some measures may be collected using either the administrative or the hybrid methodology. For these measures, the methodology used to collect the data may impact a plan’s rate (generally, the hybrid method yields a higher rate, but the number of numerator events gained may be limited for some measures).
Limitations of HEDIS MeasuresSome measures, such as the Frequency of On- going Prenatal Care, provide information on utilization and not on the quality of the care.Therefore, readers should be cautioned against using utilization data to make judgments about the quality of the care delivered by a plan or its providers.

MassHealth Managed Care HEDIS® 2005 Final Report Center for Health Policy and Research
1

Breast Cancer Screening
Black bars are benchmarks. White bars represent rates signifi- cantly above the national Medicaid 75th percentile. Grey bars represent rates that are no different than the national Medicaid 75th percentile. Bars with diagonal lines represent rates that are significantly below the national Medicaid 75th percentile.
Nat'l Mcaid 75th Pctile
Nat'l Mcaid Mean
MA Comm Mean
PCCP
NHP
NH
FCHP
BMCHP
0% 20% 40% 60% 80% 100%
59.8%
54.0%
80.8%
65.0%
74.3%
64.4%
70.4%
78.1%
MassHealth Managed Care HEDIS® 2005 Final Report Center for Health Policy and Research
1
In recent years, there has been significant discussion and debate over when women should start receiving screening mammograms and how often women should be screened. However, leading clinical guideline organizations such as the U.S. Preventive Health Task Force, American College of Obstetricians and Gynecologists (ACOG), and American Cancer Society all recommend that women over the age of 50 receive a screening mammo- gram every one to two years. Screening mammography has been shown to reduce the mortality rate associated with breast cancer.1 In addition, malignancies detected through screening mammography are smaller, less likely to metastasize to the lymph nodes, and more likely to be treated with less toxic and less invasive treatments than malignancies detected through other methods such as clinical breast exam or self-exam.2 Despite the many benefits of screening mammography, national mammography rates for women ages 50-64 fall below national goals such as that of the Center for Disease Control and Prevention’s Healthy People 2010 goal of achieving a national screening rate of 70%.
Two-thirds of MassHealth female members aged 50-64 years of age had a mammogram during the 2003 or 2004 calendar years. Plan-specific rates ranged from 64.4% to 78.1%. All five plans had rates that were significantly better than the national Medicaid 75th percentile (59.8%). One plan’s HEDIS 2005 rate was significantly better than the rate it reported for HEDIS 2003.
Factors that influence whether a woman receives a mammogram include:
Physician recommendation: The single factor most strongly associated with mammography is physician recommendation.3 Physicians recommend mammography differentially based on actual or perceived patient characteristics such as age, health status, lack of insurance, perceived or ac- tual inability to pay, logistical difficulties, and/or assumptions about patient’s unwillingness or inabil- ity to comply.4,5
Usual source of care: Another strong predictor of receiving a mammogram is having a usual source of care.6 Women with a usual source of care are four times more likely to report a recent mammogram or Pap test.7
High-risk behaviors: Some high-risk health behaviors may affect the likelihood that a woman is screened for breast cancer. For example, there is a negative association between smoking and cancer screening, including breast cancer screening.
Patient perceptions and fears: Some perceptions and fears associated with failure to obtain a mammogram include inconvenience, worry, embarrassment, fear of radiation or pain, belief that screening is unnecessary in absence of symptoms, lack of knowledge of clinical guidelines, and fear of finding cancer.8,9
Cultural beliefs and language barriers: A patient’s perceptions and fears may be closely interre-
Breast Cancer Screening Understanding the ResultsThe percentage of women 50-64 years of age who had a mammogram during the 2003 or 2004 calen- dar years.

Breast Cancer Screening
MassHealth Managed Care HEDIS® 2005 Final Report Center for Health Policy and Research
1
Statistical Summary
lated with her cultural beliefs and norms, particularly those beliefs related to the medical culture. Language barriers may present an obstacle for addressing cultural beliefs about mammography, particularly if translators are not available.
Physician gender and specialty: Providers who are female and OB/GYNs have been shown in some studies to have patients who are more likely to undergo mammography.10
Physical disability: Women who are physically disabled are less likely to have ever had a mammogram than women who are not physically dis- abled.11 Some breast cancer screening providers, such as mobile mammography vans, may not be accessible to women in wheelchairs or those with limited mobility.
(Continued on next page)
Legend:• 2005 rate is significantly below the comparison rate.O 2005 rate is not significantly different from the comparison rate.* 2005 rate is significantly above the comparison rate.
Num indicates NumeratorDen indicates DenominatorLCL indicates Lower Confidence LevelUCL indicates Upper Confidence Level
(A) = Measure was collected using administrative method(H) = Measure was collected using hybrid methodNote: The ability to locate and obtain medical records by a plan or a plan’s contracted vendor can impact performance on a hybrid measure. Per NCQA’s specifications, members for whom no medical record documentation is found are considered non-compliant with the
Understanding the Results (continued)
2005 Rate Comparison:
Nat’l Mcaid 75th
Pctile
Nat’l Mcaid Mean
MACom
m Mean
Plan’s 2003Rate
PCCP(A) * * • ONHP(H) * * • ONH(A) * * • OFCHP(A) * * • OBMCHP(H) * * O *
2005 BenchmarksNat’l Mcaid 90th Pctile: 67.8% Nat’l Mcaid Mean: 54.0% MassHealth Weighted Mean: 66.2%Nat’l Mcaid 75th Pctile: 59.8% MA Commercial Mean: 80.8% MassHealth Median: 70.4%
MassHealth Plan Rates2005 Num Den Rate LCL UCL 2003 Num Den Rate LCL UCL
PCCP(A) 8,226 12,665 65.0% 64.1% 65.8% PCCP(A) 9,350 14,489 64.5% 63.7% 65.3%NHP(H) 249 335 74.3% 69.5% 79.2% NHP(H) 247 342 72.2% 67.3% 77.1%
NH(A) 324 503 64.4% 60.1% 68.7% NH(H) 185 280 66.1% 60.3% 71.8%
FCHP(A) 114 162 70.4% 63.0% 77.7% FCHP(H) 130 200 65.0% 58.1% 71.9%
BMCHP(H) 321 411 78.1% 74.0% 82.2% BMCHP(H) 283 411 68.9% 64.3% 73.5%

Breast Cancer Screening
MassHealth Managed Care HEDIS® 2005 Final Report Center for Health Policy and Research
1
Group practice vs. individual physician practice: Some studies have found that mammography rates are higher in group practices than in individual physician practices.
On-site vs. off-site referral: Members who can obtain a mammogram at the same location as where they receive most of their care may face fewer barriers than women who must obtain a mammogram through a referral to a separate provider.
Timeliness of appointment: Members who can obtain an immediate appointment for a mammogram may face less barriers than women who must return for a future appointment.
Plans can develop a number of interventions to overcome barriers to breast cancer screening. Most notably, plans can develop strategies directed to- ward providers or provider office systems to increase physician recommendation. These strategies can be cognitive (e.g., identifying and changing provider attitudes), behavioral (e.g., implementing reminders or system prompts) or sociological (e.g., using social norms and peers to increase adher- ence to screening guidelines.) In particular, interventions aimed at improving office systems have been shown to increase mammography utilization. These may include the use of flow sheets and the scheduling of mammography appointments by patients.12 Reminder stamps in the medical record that prompt the provider to ask about breast cancer screening, health questionnaires that ask a patient about her screening status, and reminder letters mailed to the member are also effective. Health plans and providers can also direct interventions to the patient through office-based educational mate- rials such as pamphlets and posters.
Understanding the Results (continued)

MassHealth Managed Care HEDIS® 2005 Final Report Center for Health Policy and Research
1

MassHealth Managed Care HEDIS® 2005 Final Report Center for Health Policy and Research
2
Cervical Cancer Screening
Black bars are benchmarks. White bars represent rates signifi- cantly above the national Medicaid 75th percentile. Grey bars represent rates that are no different than the national Medicaid 75th percentile. Bars with diagonal lines represent rates signifi- cantly below the national Medicaid 75th percentile.
Nat'l Mcaid 75th Pctile
Nat'l Mcaid Mean
MA Comm Mean
PCCP
NHP
NH
FCHP
BMCHP
0%20% 40% 60% 80% 100%
72.3%
64.5%
86.9%
74.8%
83.2%
79.4%
86.5%
82.0%
The incidence of cervical cancer has decreased markedly in the last few decades due to the wide use of the Papanicolaou (Pap) test and increased clinical knowledge and public awareness of the causes of cervical cancer, including the Human Papilloma Virus (HPV). Despite these advances, it is estimated that over 10,000 women in the U.S. will be diagnosed with cervical cancer and approximately 3,700 will die from the disease in 2005. When detected early, cervical cancer is one of the most treatable cancers, with a five-year survival rate of 92%.13 A lack of routine screening, how- ever, can lead to diagnosis at a later stage and a poorer prognosis. Half of cervical cancers are diagnosed in women who never had a Pap test and another 10% in women who lacked screening in the prior five years.14
Seventy-nine percent (78.6%) of female MassHealth female members received one or more Pap tests during the three-year period from 2002 to 2004. Plan-specific rates ranged from 74.8% to 86.5%, with all five plans performing significantly better than the national Medicaid 75th percen- tile (72.3%). None of the plans’ rates were significantly different from their HEDIS 2003 rates, indicating room for improvement.
A number of interventions can directly address the known barriers to cervical cancer screening:
Increasing access to all preventive services: People who have reduced access to preventive care are less likely to get timely cancer screenings.15 Therefore, increasing access to all preven- tive care would likely improve cervical cancer screening rates.
Identifying patients at risk for lack of screening: Plans can identify members at risk for lack of screening and target them for education and outreach. Older age has been found to be asso- ciated with non-screening; in some cases, older women may be less able or willing to participate in screening. In addition, women who have resided in the U.S. for five years or less are signifi- cantly less likely to ever have had a Pap test.16 Use of translators or English-speaking members of the patient’s family may be necessary to communicate with non-English speaking patients who are at risk for lack of screening.
Implementing office-based systems: As with breast cancer, members who get a physician recommendation for screening are more likely to be screened.17,18 Computer reminder systems that prompt physicians to make recommendations on screening can be effective at increasing screening rates.
Cervical Cancer Screening Understanding the ResultsThe percentage of women 18-64 years of age who received one or more Pap tests during the 2002, 2003 or 2004 calendar years.

Cervical Cancer Screening
MassHealth Managed Care HEDIS® 2005 Final Report Center for Health Policy and Research
2
Statistical Summary
Using personalized communications: Personalized, tailored letters with general information on the risk of cervical cancer have been shown to increase cervical cancer screening rates among low-income women.19
Targeting providers less likely to screen in the office: Women who are able to obtain a Pap test where they receive most of their care may face fewer barriers to cervical cancer screening than women who must obtain a Pap test through a referral. Although some primary care providers conduct Pap tests in their offices, some types of primary care providers such as internal medicine physicians may be less likely to perform a Pap test in their office than other types of primary care providers such as family medicine physicians.
Legend:• 2005 rate is significantly below the comparison rate.O 2005 rate is not significantly different from the comparison rate.* 2005 rate is significantly above the comparison rate.
Num indicates NumeratorDen indicates DenominatorLCL indicates Lower Confidence LevelUCL indicates Upper Confidence Level
(A) = Measure was collected using administrative method(H) = Measure was collected using hybrid methodNote: The ability to locate and obtain medical records by a plan or a plan’s contracted vendor can impact performance on a hybrid measure. Per NCQA’s specifications, members for whom no medical record documentation is found are considered non-compliant with the measure.
Understanding the Results (continued)
2005 Rate Comparison:
Nat’l Mcaid 75th
Pctile
Nat’l Mcaid Mean
MAComm Mean
Plan’s 2003Rate
PCCP(A) * * • ONHP(H) * * O ONH(H) * * • OFCHP(H) * * O OBMCHP(H) * * • O
2005 BenchmarksNat’l Mcaid 90th Pctile: 76.6% Nat’l Mcaid Mean: 64.5% MassHealth Weighted
Mean:78.6%
Nat’l Mcaid 75th Pctile: 72.3% MA Commercial Mean:
86.9% MassHealth Median: 82.0%
MassHealth Plan Rates2005 Num Den Rate LCL UCL 2003 Num Den Rate LCL UCL
PCCP(A) 31,537 42,158 74.8% 74.4% 75.2% PCCP(H) 261 335 77.9% 73.3% 82.5%NHP(H) 208 250 83.2% 78.4% 88.0% NHP(H) 258 313 82.4% 78.1% 86.8%
NH(H) 266 335 79.4% 74.9% 83.9% NH(H) 270 360 75.0% 70.4% 79.6%
FCHP(H) 198 229 86.5% 81.8% 91.1% FCHP(H) 214 260 82.3% 77.5% 87.1%
BMCHP(H) 337 411 82.0% 78.2% 85.8% BMCHP(H) 320 411 77.9% 73.7% 82.0%

MassHealth Managed Care HEDIS® 2005 Final Report Center for Health Policy and Research
2
Prenatal and Postpartum Care
86.4%
78.3%
96.1%
69.1%
91.6%
79.3%
94.0%
91.0%
Black bars are benchmarks. White bars represent rates signifi- cantly above the national Medicaid 75th percentile. Grey bars represent rates that are no different than the national Medicaid 75th percentile. Bars with diagonal lines represent rates signifi- cantly below the national Medicaid 75th percentile.
Nat'l Mcaid 75th Pctile
Nat'l Mcaid Mean
MA Comm Mean
PCCP
NHP
NH
FCHP
BMCHP
0% 20% 40% 60% 80% 100%
65.2%
55.9%
84.2%
43.6%
57.9%
60.6%
66.7%
60.1%
Black bars are benchmarks. White bars represent rates signifi- cantly above the national Medicaid 75th percentile. Grey bars represent rates that are no different than the national Medicaid 75th percentile. Bars with diagonal lines represent rates signifi- cantly below the national Medicaid 75th percentile.
Nat'l Mcaid 75th Pctile
Nat'l Mcaid Mean
MA Comm Mean
PCCP
NHP
NH
FCHP
BMCHP
0% 20% 40% 60% 80% 100%
Prenatal visits in the first trimester promote good clinical outcomes for both mother and child by providing the opportunity for early risk assessment (including screening for tobacco, alcohol, drug use, and domestic violence), health promotion (including discussion of exercise habits and environ- mental hazards) and medical, nutritional and psychosocial interventions. Despite the benefits of early prenatal care, Medicaid plan rates of prenatal care in the first trimester have consistently fallen short of the CDC’s Healthy People 2000 and 2010 goals aimed at ensuring that 90% of pregnant women have a prenatal visit in the first trimester.20 Postpartum care is an essential component to ensuring good clinical outcomes. A postpartum exam within fifty-six days after delivery provides the opportunity for a physical exam as well as education on birth control methods, discussion of physical limitations and restrictions, and assessment of postpartum depression.
Eight-one percent (80.7%) of MassHealth mem- bers had a prenatal visit in the first trimester or within 42 days of enrollment. Three plans per- formed significantly better than the national Medi- caid 75th percentile (86.4%). One plan’s rate was significantly better than its HEDIS 2003 rate.Sixty-one percent (60.5%) of MassHealth mem- bers had a postpartum visit on or between 21 and 56 days after delivery. No MassHealth plan per- formed better than the national Medicaid 75th per- centile (68.6%), although two plans had rates that were not significantly different from the bench- mark.
Factors influencing whether a woman receives prenatal or postpartum care include:
Drug and alcohol use: Drug and alcohol use, including fear of disclosure, is associated with de- layed prenatal care.21,22
Personal factors: Personal factors associated with delayed prenatal care include feeling too tired to attend an appointment, physical violence during pregnancy, and lack of support from an infant’s father.23 Other factors include fear, stress, de-
(Continued on page 24)
Timeliness of Prenatal Care Postpartum Care Understanding the ResultsThe percentage of members who delivered a live birth and who received a prenatal care visit in the first trimester or within 42 days of enrollment in the health plan.
The percentage of members who delivered a live birth and who had a postpartum visit on or be- tween 21 and 56 days after delivery.

Prenatal and Postpartum Care
MassHealth Managed Care HEDIS® 2005 Final Report Center for Health Policy and Research
2
Statistical Summary: Timeliness of Prenatal Care
Statistical Summary: Postpartum Care
2005 BenchmarksNat’l Mcaid 90th Pctile: 69.8% Nat’l Mcaid Mean: 55.9% MassHealth Weighted Mean: 60.5%
Nat’l Mcaid 75th Pctile 65.2% MA Commercial Mean: 84.2% MassHealth Median: 60.1%
Legend:• 2005 rate is significantly below the comparison rate.O 2005 rate is not significantly different from the comparison rate.* 2005 rate is significantly above the comparison rate.
Num indicates NumeratorDen indicates DenominatorLCL indicates Lower Confidence LevelUCL indicates Upper Confidence Level
A) = Measure was collected using administrative method(H) = Measure was collected using hybrid methodNote: The ability to locate and obtain medical records by a plan or a plan’s contracted vendor can impact performance on a hybrid measure. Per NCQA’s specifications, members for whom no medical record documentation is found are considered non-compliant with the measure.
2005 Rate Comparison:
Nat’l Nat’lMcaid
Mcaid 75th PctileMean
MACom
m Mean
Plan’s 2003Rate
PCCP(H) • •
* *
• O* *
* *
•
•
•
O
•
* O OO
NHP(H)
NH(H)
FCHP(H)
BMCHP(H)
2005 BenchmarksNat’l Mcaid 90th Pctile: 89.5% Nat’l Mcaid Mean: 78.3% MassHealth Weighted Mean: 80.7%Nat’l Mcaid 75th Pctile: 86.4% MA Commercial Mean: 96.1% MassHealth Median: 91.0%
MassHealth Plan Rates2005 Num Den Rate LCL UCL 2003 Num Den Rate LCL UCL
PCCP(H) 284 411 69.1% 64.5% 73.7% PCCP(H) 335 411 81.5% 77.6% 85.4%NHP(H) 359 392 91.6% 88.7% 94.5% NHP(H) 328 401 81.8% 77.9% 85.7%
NH(H) 326 411 79.3% 75.3% 83.4% NH(H) 352 411 85.6% 82.1% 89.2%
FCHP(H) 220 234 94.0% 90.8% 97.3% FCHP(H) 220 243 90.5% 86.6% 94.4%
BMCHP(H) 374 411 91.0% 88.1% 93.9% BMCHP(H) 363 411 88.3% 85.1% 91.5%
2005 Rate Comparison:
Nat’l Nat’lMcaid
Mcaid 75th PctileMean
MACom
m Mean
Plan’s 2003Rate
PCCP (H) • • • ONHP (H) • O • ONH (H) O O • OFCHP (H) O * • OBMCHP (H) • O • O
MassHealth Plan Rates2005 Num Den Rate LCL UCL 2003 Num Den Rate LCL UCL
PCCP(H) 179 411 43.6% 38.6% 48.5% PCCP(H) 198 411 48.2% 43.2% 53.1%NHP(H) 227 392 57.9% 52.9% 62.9% NHP(H) 247 401 61.6% 56.7% 66.5%
NH(H) 249 411 60.6% 55.7% 65.4% NH(H) 227 411 55.2% 50.3% 60.2%
FCHP(H) 156 234 66.7% 60.4% 72.9% FCHP(H) 155 243 63.8% 57.5% 70.0%
BMCHP(H) 247 411 60.1% 55.2% 65.0% BMCHP(H) 241 411 58.6% 53.8% 63.5%

Prenatal and Postpartum Care
MassHealth Managed Care HEDIS® 2005 Final Report Center for Health Policy and Research
2
pression, job demands, cultural beliefs, lack of support from family and friends, and attitudes about providers. Perceived long waiting times have also been associated with delayed care24 as have socio-demographic characteristics such as young age, being single, being less educated, and having more than one child.25
Correlation between prenatal and postpartum care: Lack of prenatal care often results in failure to attend a postpartum visit.26
Postpartum visit prior to 21 days after delivery: Although clinical guidelines recommend a postpartum visit at least four weeks after delivery and the HEDIS measure requires a visit 21 to 56 days after delivery, a woman who had a postpartum visit before 21 days after delivery may not have an additional visit during the timeframe evaluated for this measure.
Understanding the Results (continued)

MassHealth Managed Care HEDIS® 2005 Final Report Center for Health Policy and Research
2

Frequency of Ongoing Prenatal Care
Black bars are benchmarks. White bars represent rates signifi- cantly above the national Medicaid 75th percentile. Grey bars represent rates that are no different than the national Medicaid 75th percentile. Bars with diagonal lines represent rates signifi- cantly below the national Medicaid 75th percentile.
Nat'l Mcaid 75th Pctile
Nat'l Mcaid Mean
MA Comm Mean *
PCCP
NHP
NH
FCHP
BMCHP
0%20% 40% 60% 80% 100%
67.6%
50.9%
54.5%
82.1%
56.2%
70.5%
72.0%
MassHealth Managed Care HEDIS® 2005 Final Report Center for Health Policy and Research
2
The quality of prenatal care is measured not only by whether a woman has a prenatal visit in the first trimester but also by whether a woman re- ceives prenatal care throughout her pregnancy. The American College of Obstetrics and Gynecology recommends that women receive prenatal visits every four weeks for the first 28 weeks of pregnancy, every two to three weeks for the seven weeks thereafter, and then weekly until delivery. Therefore, the percentage of expected visits a woman has throughout her pregnancy, based on gestational age at the time of enrollment, provides important information on the quality of prenatal care delivered by a health plan. This measure only provides information on the number of visits, however, and does not indicate whether the timing, content and distribution of those visits throughout the pregnancy was appropriate.
Performance on this measure varied widely. Individual plans reported rates ranging from 54.5% to 82.1% of members receiving more than 81% of the expected prenatal visits, ad- justed for gestational age and the month that the member enrolled in the health plan.Three plans performed significantly better than or no different from the national Medicaid 75th percentile (67.6%). None of the plans’ rates were significantly better than the 2003 rates, indicating room for improvement.
Factors influencing the number of prenatal visits a woman has include:
Use of single provider: Women who receive prenatal care from a single physician are likely to receive more prenatal care.27 Lack of coordination of services and difficulty finding a provider can interrupt ongoing prenatal care.27
Logistical barriers: Some women may fail to receive ongoing prenatal care due to issues such as transportation and child care for other children.29,30
Psychosocial barriers: Fear and negative attitudes also are associated with inadequate prenatal care.31,32
Effective interventions can increase the rate of prenatal care utilization, including33:
- Providing lists of open obstetric providers to pregnant women,- Providing outreach to all members of childbearing age, including free pregnancy testing,- Seeing members as early as possible in the first trimester and within 3 weeks of a positive pregnancy test.
* Medicaid-only measure. No MA Commercial mean available.
Greater Than 81% of Expected Visits
Understanding the ResultsThe percentage of women who had a live birth and received greater than 81 percent of the expected number of prenatal care visits, adjusted for gestational age and the month that the member enrolled in the health plan. This measure uses the same denominator as the Prenatal and Postpartum Care measure.

Frequency of Ongoing Prenatal Care
MassHealth Managed Care HEDIS® 2005 Final Report Center for Health Policy and Research
2
Statistical Summary: ≥ 81% of expected visits
2005 BenchmarksNat’l Mcaid 90th Pctile: 80.0% Nat’l Mcaid Mean: 50.9% MassHealth Weighted Mean: 64.8%
Nat’l Mcaid 75th Pctile: 67.6% MA Commercial Mean: n/a MassHealth Median: 70.5%
Legend:• 2005 rate is significantly below the comparison rate.O 2005 rate is not significantly different from the comparison rate.* 2005 rate is significantly above the comparison rate.
Num indicates NumeratorDen indicates DenominatorLCL indicates Lower Confidence LevelUCL indicates Upper Confidence Level
A) = Measure was collected using administrative method(H) = Measure was collected using hybrid methodNote: The ability to locate and obtain medical records by a plan or a plan’s contracted vendor can impact performance on a hybrid measure. Per NCQA’s specifications, members for whom no medical record documentation is found are considered non-compliant with the measure.
Statistical Summary: All % of Expected Visit Rates
MassHealth Plan Rates2005 Den < 21% 21% to
≤ 40%41% to≤ 60%
61% to≤ 80%
≥ 81% 2003 Den < 21% 21% to≤ 40%
41% to≤ 60%
61% to≤ 80%
≥ 81%
PCCP(H) 411 21.2% 3.9% 7.3% 13.1% 54.5% PCCP(H) 411 8.3% 2.9% 5.6% 20.2% 63.0%NHP(H) 392 3.3% 1.8% 3.1% 9.7% 82.1% NHP(H) 401 3.5% 3.2% 6.5% 11.2% 75.6%
NH(H) 411 19.7% 4.9% 4.4% 14.8% 56.2% NH(H) 411 10.2% 2.9% 11.2% 23.4% 51.8%
FCHP(H) 234 3.0% 0.9% 4.7% 20.9% 70.5% FCHP(H) 243 0.8% 0.8% 2.1% 7.8% 88.5%
BMCHP(H) 411 6.3% 4.6% 5.6% 11.4% 72.0% BMCHP(H) 411 10.2% 8.3% 5.8% 11.4% 64.2%
Note: The <21% of expected visit rate includes members for whom no medical record documentation was found in addition to members who received less than 21% of the expected prenatal visits.
2005 Rate Comparison:
Nat’l Nat’lMcaid
Mcaid 75th PctileMean
MACom
m Mean
Plan’s 2003Rate
PCCP(H) • O n/a ONHP(H) * * n/a ONH(H) • * n/a OFCHP(H) O * n/a •BMCHP(H) O * n/a O
MassHealth Plan Rates2005 Num Den Rate LCL UCL 2003 Num Den Rate LCL UCL
PCCP(H) 224 411 54.5% 49.6% 59.4% PCCP(H) 259 411 63.0% 58.2% 67.8%NHP(H) 322 392 82.1% 78.2% 86.1% NHP(H) 303 401 75.6% 71.2% 79.9%
NH(H) 231 411 56.2% 51.3% 61.1% NH(H) 213 411 51.8% 46.9% 56.8%
FCHP(H) 165 234 70.5% 64.5% 76.6% FCHP(H) 215 243 88.5% 84.3% 92.7%
BMCHP(H) 296 411 72.0% 67.6% 76.5% BMCHP(H) 264 411 64.2% 59.5% 69.0%

Adults’ Access to Preventive/Ambulatory Health Services
83.6%
75.8%
95.1%
85.1%
85.4%
82.7%
85.3%
85.2%
Black bars are benchmarks. White bars represent rates signifi- cantly above the national Medicaid 75th percentile. Grey bars represent rates that are no different than the national Medicaid 75th percentile. Bars with diagonal lines represent rates signifi- cantly below the national Medicaid 75th percentile.
Nat'l Mcaid 75th Pctile
Nat'l Mcaid Mean
MA Comm Mean
PCCP
NHP
NH
FCHP
BMCHP
0% 20% 40% 60% 80% 100%
87.3%
81.1%
96.1%
89.8%
85.2%
86.5%
88.6%
89.7%
Black bars are benchmarks. White bars represent rates signifi- cantly above the national Medicaid 75th percentile. Grey bars represent rates that are no different than the national Medicaid 75th percentile. Bars with diagonal lines represent rates signifi- cantly below the national Medicaid 75th percentile.
Nat'l Mcaid 75th Pctile
Nat'l Mcaid Mean
MA Comm Mean
PCCP
NHP
NH
FCHP
BMCHP
0% 20% 40% 60% 80% 100%
MassHealth Managed Care HEDIS® 2005 Final Report Center for Health Policy and Research
2
The Institute of Medicine defines access as “the timely use of personal health services to achieve the best possible health outcomes.”33 Barriers to accessing recommended preventive care have been well-documented.35 A review of data from the Medicare Expenditure Panel Survey (MEPS) found that 10-30% of respondents reported going without needed care or having difficulties obtaining it, not having a usual source of care, and en- countering organizational barriers such as long waiting times or difficulties obtaining medical appointments.36 Medicaid members responding to the survey experienced barriers at the same rate as the total MEPS sample but were more likely to report using the hospital emergency room for basic care and experiencing long waits for care.37
Eighty-five percent (85%) of MassHealth members aged 20-44 and 89.4% of members aged 45-64 had an ambulatory or preventive health visit in 2004. There was little variation among the individ- ual plan rates, which ranged from 82.7% to 85.4% for the 20-44 age group and from 85.2% to 89.8% for the 45-64 age group. Four health plans per- formed significantly better than or no different from the national Medicaid 75th percentile for both the 20-44 and 45-64 age rates.
Factors that influence access to ambulatory and preventive health care for adults include:
Health and mental status: An individual’s health and mental health status are key independent pre- dictors of barriers to care. Patients with fair or poor health or mental health status are more likely to report barriers to care than patients who do not have a better health or mental health status.38
Race/ethnicity: Medicaid enrollees who are mi- norities, particularly Hispanics and Asian- Americans, are more likely to report access barri- ers than non-Hispanic Whites enrolled in Medi- caid.39
(Continued on page 30)
Ages 20-44 Ages 45-64 Understanding the ResultsThe percentage of members age 20-44 who had an ambulatory or preventive care visit during the 2004 calendar year.
The percentage of members age 45-64 who had an ambulatory or preventive care visit during the 2004 calendar year.

Adults’ Access to Preventive/Ambulatory Health Services
MassHealth Managed Care HEDIS® 2005 Final Report Center for Health Policy and Research
2
Statistical Summary: Ages 20-44
Statistical Summary: Ages 45-64
Legend:• 2005 rate is significantly below the comparison rate.O 2005 rate is not significantly different from the comparison rate.
Num indicates NumeratorDen indicates DenominatorLCL indicates Lower Confidence LevelUCL indicates Upper Confidence Level
A) = Measure was collected using administrative method(H) = Measure was collected using hybrid methodNote: The ability to locate and obtain medical records by a plan or a plan’s contracted vendor can impact performance on a hybrid measure. Per NCQA’s specifications, members for whom no medical record documentation is found are considered non-
2005 Rate Comparison:
Nat’l Mcaid 75th
Pctile
Nat’l Mcaid Mean
MACom
m Mean
Plan’s 2003Rate
PCCP(A) *
*
• O*
*
*
*
*
*
•
•
•
•
•
n/
a
n/
a
n/
a
NHP(A)
NH(A)
FCHP(A)
BMCHP(A)
2005 BenchmarksNat’l Mcaid 90th Pctile: 85.4% Nat’l Mcaid Mean: 75.8% MassHealth Weighted Mean: 85.0%Nat’l Mcaid 75th Pctile: 83.6% MA Commercial Mean: 95.1% MassHealth Median: 85.2%
MassHealth Plan Rates2005 Num Den Rate LCL UCL 2003 Num Den Rate LCL UCL
PCCP (A) 53,970 63,416 85.1% 84.8% 85.4% PCCPNHP (A)
NH (A)
13,870
7,597
16,242
9,182
85.4%
82.7%
84.8%
82.0%
85.9%
83.5%
NHP
NHNo data available
FCHP (A) 1,636 1,919 85.3% 83.6% 86.9% FCHP
BMCHP (A) 18,814 22,071 85.2% 84.8% 85.7% BMCHP
2005 Rate Comparison:
Nat’l Mcaid 75th
Pctile
Nat’l Mcaid Mean
MAComm
Plan’s 2003Rate
PCCP(A) *
•
O O*
*
*
*
*
*
•
•
•
•
•
n/
a
n/
a
n/
NHP(A)
NH(A)
FCHP(A)
BMCHP(A)
2005 BenchmarksNat’l Mcaid 90th Pctile: 88.7% Nat’l Mcaid Mean: 81.1% MassHealth Weighted Mean: 89.4%Nat’l Mcaid 75th Pctile: 87.3% MA Commercial Mean: 96.1% MassHealth Median: 88.6%
MassHealth Plan Rates2005 Num Den Rate LCL UCL 2003 Num Den Rate LCL UCL
PCCP (A) 40,414 45,004 89.8% 89.5% 90.1% PCCPNHP (A)
NH (A)
2,762
2,431
3,241
2,812
85.2%
86.5%
84.0%
85.2%
86.5%
87.7%
NHP
NHNo data available
FCHP (A) 528 596 88.6% 86.0% 91.2% FCHP
BMCHP (A) 6,008 6,697 89.7% 89.0% 90.4% BMCHP

MassHealth Managed Care HEDIS® 2005 Final Report Center for Health Policy and Research
3
Adults’ Access to Preventive/Ambulatory Health Services
Urban location: Medicaid recipients in urban areas may have more limited access to outpatient care and may often use hospital emergency de- partments for basic health care services.40
Lack of convenience: Some members may not seek routine care because of a lack of convenient appointments that do not conflict with work schedules (e.g., after-hours care) and a lack of transportation.
A number of interventions have been shown to be effective at reducing barriers to care for adults seeking ambulatory and preventive health services, including:
Computer-based reminder systems: Randomized controlled studies support the effectiveness of data-driven computer-based reminder systems to improve pre- vention services in the ambulatory care setting. Reminders can entail prompts to the provider as well as computer-generated letters to the member. MassHealth plans or providers seeking to institute computer-based reminder systems may face barriers such as capital and operating costs, confidentiality and data security concerns, legal issues, problems capturing the necessary clinical data, and a lack of standardized medical vocabulary and medical logic frameworks.41
Community outreach: Plans and providers can also seek to educate members about the importance of routine care in public forums (e.g., community events).42
In addition, outreach conducted through schools, places of employment and places of worship can also reinforce the importance of preventive care. Services deliv- ered during outreach are not likely to be captured in this measure, however, due to a lack of documentation and coding.
Understanding the Results (continued)

Adults’ Access to Preventive/Ambulatory Health Services Impact of Essential Population on PCC Plan Data
Black bars are benchmarks. White bars represent rates signifi- cantly above the national Medicaid 75th percentile. Grey bars represent rates that are no different than the national Medicaid 75th percentile. Bars with diagonal lines represent rates signifi- cantly below the national Medicaid 75th percentile.
Nat'l M caid 75th Pctile87.3%
Nat'l Mcaid M ean 81.1%
M A Comm M ean 96.1%
PCCP 89.8%
PCCP w/o Essential 90.6%
NHP 85.2%
NH 86.5%
FCHP 88.6%
BM CHP 89.7%
0%20% 40% 60% 80% 100%
83.6%
75.8%
95.1%
85.1%
86.7%
85.4%
82.7%
85.3%
85.2%
Black bars are benchmarks. White bars represent rates signifi- cantly above the national Medicaid 75th percentile. Grey bars represent rates that are no different than the national Medicaid 75th percentile. Bars with diagonal lines represent rates signifi- cantly below the national Medicaid 75th percentile.
Nat'l M caid 75th Pctile
Nat'l Mcaid M ean
M A Comm M ean
PCCP
PCCP w/o Essential
NHP
NH
FCHP
BM CHP
0%20% 40% 60% 80% 100%
MassHealth Managed Care HEDIS® 2005 Final Report Center for Health Policy and Research
3
Ages 20-44
As discussed on page 11, MassHealth has sev- eral Medicaid eligibility types that are offered by all five MassHealth plans. One eligibility type is of- fered by only the PCC Plan—MassHealth Essen- tial. Inclusion of this population affected the re- sults for some measures.
For the Adults’ Access to Ambulatory/Preventive Health Services measure, the PCC Plan rate with- out the Essential population is significantly better than the PCC Plan rate with the Essential popula- tion for both age stratifications (ages 20-44 and ages 45-64). (Note: Statistical significance was determined by comparing the upper and lower confidence intervals of the PCC Plan’s rate with- out Essential to the PCC Plan’s overall rate, which includes Essential members).
Factors such as differences in the mental and health status of members with Essential coverage may create barriers to accessing care.
Ages 45-64 Discussion
2005 Rate Comparison: Ages 20-44
PCCP
PCCP w/o Essential
Nat’l Mcaid 75th Pctile
Nat’l Mcaid Mean
MA Comm Mean
**
**
••
PCC Plan: Ages 20-44Num Den Rate LCL UCL
PCCP 53,970 63,416 85.1% 84.8% 85.4%
PCCP w/o Essential 50,427 58,149 86.7% 86.4% 87.0%
2005 Rate Comparison: Ages 45-64
PCCP
PCCP w/o Essential
Nat’l Mcaid 75th Pctile
Nat’l Mcaid Mean
MA Comm Mean
**
**
••
PCC Plan: Ages 45-64Num Den Rate LCL UCL
PCCP 40,414 45,004 89.8% 89.5% 90.1%
PCCP w/o Essential 37,298 41,163 90.6% 90.3% 90.9%

MassHealth Managed Care HEDIS® 2005 Final Report Center for Health Policy and Research
3

MassHealth Managed Care HEDIS® 2005 Final Report Center for Health Policy and Research
3

Appropriate Treatment for Children with Upper Respiratory Infection
Black bars are benchmarks. White bars represent rates signifi- cantly above the national Medicaid 75th percentile. Grey bars represent rates that are no different than the national Medicaid 75th percentile. Bars with diagonal lines represent rates signifi- cantly below the national Medicaid 75th percentile.
Nat'l Mcaid 75th Pctile
Nat'l Mcaid Mean
MA Comm Mean
PCCP
NHP
NH
FCHP
BMCHP
0% 20% 40% 60% 80% 100%
85.6%
80.0%
89.3%
70.1%
91.9%
89.9%
90.2%
91.1%
MassHealth Managed Care HEDIS® 2005 Final Report Center for Health Policy and Research
3
The emergence of antibiotic-resistant bacteria is a major and growing public health concern. The increase in antibiotic-resistant strains of bacteria such as Streptococcus pneumonia is due in part to the inappropriate use of antibiotics for conditions, such as upper respiratory infection (URI), which are commonly caused by viruses. Antibiotics neither shorten the course of a viral URI nor prevent secondary infection.43 Despite this, ap- proximately three fourths of all outpatient antibiotic prescriptions are given to children for URIs.44 The inappropriate use of using antibiotics for viral URI among children is common regardless of geographic area, payment source, patient demographics, and physician specialty.45
Eighty-one percent (81.3%) of children aged 3 months to 18 years who had a URI were not pre- scribed an antibiotic within the first three days after diagnosis. Plan-specific rates ranged from 70.1% to 91.9%. Four plans performed significantly better than the national Medicaid 75th per- centile (85.6%). No comparisons to past plan performance can be made because this measure was collected by MassHealth plans for the first time with HEDIS 2005.
Factors that influence the inappropriate prescription of antibiotics for children with URI include:
Parent expectations: The most significant factor influencing the prescribing of antibiotics to chil- dren with URI is a physician's perception about parent expectation.46 Parents may expect antibi- otics to be reassured that their child is not seriously ill or to validate their decision to obtain medi- cal attention. A parent’s expectations also may be higher if a child received an antibiotic in the past for the same symptoms. Studies also have shown that strategies to manage parent expec- tations can be effective; for example, in one study, parent satisfaction with care did not decrease when the parent did not receive an expected antibiotic.47
Age of child: Children of school age are more likely to receive an antibiotic for a URI than chil- dren not of school age (i.e., age 4 and under)48, possibly reflecting pressure by parents who can- not care for a school-aged child at home and want them to be able to return to school as soon as possible.
Chronic illness: Children with chronic conditions such as asthma, cardiovascular disease or chronic pulmonary disease may be at higher risk for severe complications of upper respiratory infections.49 Because of the higher risk, providers may be more likely to prescribe an antibiotic during the initial visit than for children without these conditions.
Appropriate Treatment for Children with Upper Respiratory Understanding the ResultsThe percentage of children 3 months to 18 years of
age who had a URI and were not dispensed an antibiotic prescription on or three days after the outpatient visit where the URI diagnosis was made. Higher rates indi- cate more appropriate use of

Appropriate Treatment for Children with Upper Respiratory Infection
MassHealth Managed Care HEDIS® 2005 Final Report Center for Health Policy and Research
3
Statistical Summary2005 BenchmarksNat’l Mcaid 90th Pctile: 89.0% Nat’l Mcaid Mean: 80.0% MassHealth Weighted Mean: 81.3%
Nat’l Mcaid 75th Pctile: 85.6% MA Commercial Mean: 89.3% MassHealth Median: 90.2%
Legend:• 2005 rate is significantly below the comparison rate.O 2005 rate is not significantly different from the comparison rate.* 2005 rate is significantly above the comparison rate.
Num indicates NumeratorDen indicates DenominatorLCL indicates Lower Confidence LevelUCL indicates Upper Confidence Level
* The numerator is the number of members prescribed antibiotics. The reported rate is an inverted rate and represents the percentage of members who were not prescribed an antibiotic. A higher rate indicates better performance.(A) = Measure was collected using administrative method(H) = Measure was collected using hybrid methodNote: The ability to locate and obtain medical records by a plan or a plan’s contracted vendor can impact performance on a hybrid measure. Per NCQA’s specifications, members for whom no medical record documentation is found are considered non-compliant with the measure.
Medical specialty and practice setting: Non-pediatricians are more likely to prescribe antibiotics inappropriately than pediatricians50, although physicians from all specialties prescribe inappropriately. In addition, emergency room (ER) providers may be more likely to prescribe an antibiotic for a URI during the initial visit compared to a primary care provider because of concerns that a patient presenting to the ER may not return for fol- low-up care.
Facility characteristics: Staff physicians are more likely to prescribe antibiotics for a URI than trainees, possibly because trainees perceive less legal and administrative risk associated with withholding an antibiotic and may be more familiar with current practice guidelines. In addition, staff physicians practicing in non-teaching hospitals are more likely than those in teaching institutions to prescribe an antibiotic for a URI.51
Years in practice: Research has shown that providers who are classified as “high prescribers” of antibiotics for URIs graduated medical school a significantly longer time ago than “low prescribers.” 52
Understanding the Results (continued)
2005 Rate Comparison:
Nat’l Nat’lMcaid
Mcaid 75th Pctile Mean
MACom
m Mean
Plan’s 2003Rate
PCCP(A) • •
* *
* *
* *
* *
•
* O O*
n/
a
n/
a
n/
NHP(A)
NH(A)
FCHP(A)
BMCHP(A)
MassHealth Plan Rates2005 Num Den Rate LCL UCL 2003 Num Den Rate LCL UCL
PCCP (A) 4,673* 15,607 70.1% 69.3% 70.8% PCCPNHP (A)
NH (A)
498*
310*
6,113
3,059
91.9%
89.9%
91.2%
88.8%
92.5%
91.0%
NHP
NH No data availableFCHP (A) 43* 440 90.2% 87.3% 93.1% FCHPBMCHP (A) 731* 8,191 91.1% 90.5% 91.7% BMCHP

Appropriate Treatment for Children with Upper Respiratory Infection
MassHealth Managed Care HEDIS® 2005 Final Report Center for Health Policy and Research
3
There are a number of interventions that are effective in reducing inappropriate prescribing of antibiotics for children with URI, including:
Public education: Well-coordinated and multiple interventions to increase public understanding of appropriate antibiotic use will result in fewer demands for unnecessary antibiotics.53 Public education materials are available through a number of organizations such as the Centers for Disease Control and Pre- vention (CDC), American Academy of Pediatrics, American Academy of Family Physicians, American Society for Microbiology, and Alliance for the Prudent Use of Antibiotics.
Physician profiling: Plans can implement physician profiling activities that track rates of antibiotic prescribing overall and by diagnosis. Profiling activities provide plans with data to use as feedback to prescribers.
Training to identify expectation behaviors: Parent expectation behaviors are not always easily identifiable; they can come in the form of direct verbal requests but also can be communicated otherwise, such as through resistance to clinical advice.54 Plans can develop and implement training programs that help physicians recognize these behaviors so that they can communicate with parents more effectively.
Use of a contingency plan: Another intervention entails the use of a contingency plan that providers can communicate to parents when they do not pre- scribe an antibiotic for a child’s illness. This contingency plan outlines for the parent the next steps in treatment if the child does not improve. The use of a contingency plan among parents who expected antibiotics but did not receive them has been shown to increase parent satisfaction with care.55
System-based interventions: The use of formularies and other strategies to reduce cost have also been shown to reduce inappropriate drug use.
Understanding the Results (continued)

MassHealth Managed Care HEDIS® 2005 Final Report Center for Health Policy and Research
3

Controlling High Blood Pressure
Black bars are benchmarks. White bars represent rates signifi- cantly above the national Medicaid 75th percentile. Grey bars represent rates that are no different than the national Medicaid 75th percentile. Bars with diagonal lines represent rates signifi- cantly below the national Medicaid 75th percentile.
Nat'l Mcaid 75th Pctile
Nat'l Mcaid Mean
MA Comm
PCCP
NHP
NH
FCHP
BMCHP
0% 20% 40% 60% 80% 100%
68.4%
61.5%
69.7%
64.2%
66.9%
56.0%
71.7%
65.9%
MassHealth Managed Care HEDIS® 2005 Final Report Center for Health Policy and Research
3
Over one-third of the U.S. population, or 65 million adults, have hypertension56 and only 30% of those people have their blood pressure in good con- trol.57 To combat the prevalence of high blood pressure and the cardiovascular disease it causes, Healthy People 2010 set a goal of having 50% of all Americans with hypertension with blood pressure that is in good control. (For both Healthy People 2010 and this HEDIS measure, good blood pressure control is defined as a blood pressure <140/90. Other current clinical guidelines, such as the Seventh Report of the Joint National Commit- tee on the Prevention, Detection, Evaluation and Treatment of High Blood Pressure or JNCVII, define good control as <130/80.) Lifestyle modifica- tions such as increased exercise and reduced salt intake can help individuals control their blood pressure. In addition, antihypertensive pharmaco- therapy is effective in controlling blood pressure and has been associated with reduced incidence of stroke, heart attack, and heart failure.58
Sixty-four percent (64.3%) of MassHealth members aged 46-64 years who had hypertension had their blood pressure controlled to <140/90 during the 2004 calendar year. Plan-specific rates ranged from 56.0% to 71.7%. Four of the plans had rates that were not significantly differ- ent from the national Medicaid 75th percentile (68.4%). No comparisons to past plan perform- ance can be made because this measure was collected by MassHealth plans for the first time with HEDIS 2005.
Factors associated with poor blood pressure control in individuals with hypertension include:
Lack of awareness of illness: Individuals who are unaware of their hypertension are not likely to focus on controlling their blood pressure. Almost 30% of individuals with hypertension are unaware of their illness.59
Gender, race, and age: Individuals who are female, of Mexican-American ethnicity or over the age of 60 have significantly lower rates of hypertension control compared to men, younger Americans, and those who are not of Mexican-American ethincity.60
Co-morbid conditions: Patients who have other or multiple medical conditions, such as dia- betes, may be less likely to have their hypertension controlled.61 Uncontrolled hypertension in patients with comorbidities may exist despite the fact that some providers may pay more atten- tion to a patient’s blood pressure if other risk factors are present such as having coronary artery disease, renal disease or high cholesterol.
Side effects of pharmaceutical therapy: Patients experiencing side effects from antihyper- tensive therapy, including sexual dysfunction, may be less likely to adhere to their drug regi- men.
Controlling High Blood Pressure
Understanding the ResultsThe percentage of MassHealth members 46-64 years of age who had hypertension and whose blood pressure was adequately controlled (<140/90) during the 2004 calendar year.

Controlling High Blood Pressure
A) = Measure was collected using administrative method(H) = Measure was collected using hybrid methodNote: The ability to locate and obtain medical records by a plan or a plan’s contracted vendor can impact performance on a hybrid measure. Per NCQA’s specifications, members for whom no medical record documentation is found are considered non-compliant with the measure.
MassHealth Managed Care HEDIS® 2005 Final Report Center for Health Policy and Research
3
Statistical Summary
A number of interventions have been shown to be effective in maintaining good blood pressure for people with hypertension:
Education about lifestyle modifications: Lifestyle modification such as weight reduction, adoption of the Dietary Approaches to Stop Hyperten- sion (DASH) eating plan, dietary sodium reduction, physical activity, and moderation of alcohol consumption all have been shown to promote blood pressure control.62
Appropriate pharmaceutical therapy and dosage: Many people with hypertension will need to take two medications concurrently to achieve their blood pressure goal.63 Providers should have a method for identifying members with resistant hypertension when the members fail to meet their blood pressure goals despite adhering to full doses of an appropriate drug regimen. Providers also should have a method for seeking con- sultation with a hypertension specialist when appropriate.64
(Continued on next page)
Legend:• 2005 rate is significantly below the comparison rate.O 2005 rate is not significantly different from the comparison rate.
Num indicates NumeratorDen indicates DenominatorLCL indicates Lower Confidence LevelUCL indicates Upper Confidence Level
Understanding the Results (continued)
2005 Rate Comparison:
Nat’l Mcaid
75th Pctile
Nat’l Mcaid Mean
MACom
m Mean
Plan’s 2003Rate
PCCP(H) O O• OO
O*
•
*
O
• O• OO
n/
a
n/
a
n/
a
NHP(H)
NH(H)
FCHP(H)
BMCHP(H)
2005 BenchmarksNat’l Mcaid 90th Pctile: 71.1% Nat’l Mcaid Mean: 61.5% MassHealth Weighted Mean: 64.3%Nat’l Mcaid 75th Pctile: 68.4% MA Commercial Mean: 69.7% MassHealth Median: 65.9%
MassHealth Plan Rates2005 Num Den Rate LCL UCL 2003 Num Den Rate LCL UCL
PCCP(H) 264 411 64.2% 59.5% 69.0% PCCPNHP(H)
NH(H)
275
230
411
411
66.9%
56.0%
62.2%
51.0%
71.6%
60.9%
NHP
NH No data availableFCHP(H) 76 106 71.7% 62.7% 80.7% FCHPBMCHP(H) 271 411 65.9% 61.2% 70.6% BMCHP

MassHealth Managed Care HEDIS® 2005 Final Report Center for Health Policy and Research
4
Controlling High Blood Pressure
Appropriate follow-up and monitoring: In addition to appropriate pharmaceutical therapy and dosage, appropriate follow-up and monitoring must be implemented. Once started, therapy should be monitored and adjusted at monthly intervals until the member’s blood pressure goal is reached and monitored thereafter. Providers should follow-up more frequently with members who have severe hypertension (systolic greater than 160 or diastolic greater than 100) or co-morbid conditions.65
Side effect screening: Antihypertensive medications can cause a number of adverse side effects such as changes in heart rate, headache, edema in the ankles and feet, and sexual dysfunction. Patients who experience adverse side effects from antihypertensive medications are more likely to have poor blood pressure control than patients who do not experience adverse side effects.66 Interventions to educate providers about how to antici- pate and screen for side effects in members who are using antihypertensive medications may help to identify those members who are less likely to maintain their medication regimen.
Understanding the Results (continued)

MassHealth Managed Care HEDIS® 2005 Final Report Center for Health Policy and Research
4

MassHealth Managed Care HEDIS® 2005 Final Report Center for Health Policy and Research
4
Initiation and Engagement of Alcohol and Other Drug (AOD) Dependence Treatment
51.6%
46.1%
49.2%
36.3%
73.7%
40.4%
94.6%
50.6%
Black bars are benchmarks. White bars represent rates sig- nificantly above the national Medicaid 75th percentile. Grey bars represent rates that are no different than the national Medicaid 75th percentile. Bars with diagonal lines represent rates significantly below the national Medicaid 75th percentile.
Nat'l Mcaid 75th Pctile
Nat'l Mcaid Mean
MA Comm Mean
PCCP
NHP
NH
FCHP
BMCHP
0% 20% 40% 60% 80% 100%
15.0%
11.9%
20.0%
17.5%
44.4%
14.2%
69.9%
24.4%
Black bars are benchmarks. White bars represent rates sig- nificantly above the national Medicaid 75th percentile. Grey bars represent rates that are no different than the national Medicaid 75th percentile. Bars with diagonal lines represent rates significantly below the national Medicaid 75th percentile.
Nat'l Mcaid 75th Pctile
Nat'l Mcaid Mean
MA Comm Mean
PCCP
NHP
NH
FCHP
BMCHP
0% 20% 40% 60% 80% 100%
Untreated substance abuse exacts an enormous toll on the U.S. health care system. People with substance-related disorders who are not receiv- ing treatment generate about $1000 annually per individual in costs related to excess health care utilization compared to individuals without sub- stance-related disorders. Most of the additional costs that occur for people with substance-related disorders are attributable to greater inpatient and emergency department utilization.67 To successfully address untreated disorders, efforts should focus not only on initiating patients into treatment but also on ensuring that they adhere to their treatment regimens. Engaging people with substance-related disorders in treatment for at least six months has been associated with significant improvement in both health and social indicators such as keeping appointments and improving hous- ing situations.68 In addition, regular treatment alone or in conjunction with medical care is strongly associated with lower likelihood of hospitaliza- tions for alcohol or mental-health complications69 and improves survival rates.70
Forty-one percent (41.3%) of MassHealth mem- bers diagnosed with AOD dependence initiated treatment in 2004. Plan-specific rates ranged from 36.3% to 94.6%. Three plans had rates that were significantly better than or no different from the na- tional Medicaid 75th percentile. Fewer MassHealth members continued treatment (20%) than initiated treatment, with plan rates ranging from 14.2% to 69.9%. All five plans had rates that were signifi- cantly better than or no different from the national Medicaid 75th percentile. No comparisons to past plan performance can be made because this measure was collected by MassHealth plans for the first time with HEDIS 2005.
It is important to note that this measure does not account for how well a plan screens members for substance abuse disorders, only whether those members who are already diagnosed are initiated into treatment and remain engaged in treatment for 30 days after initiation.
A number of factors are associated with failed ini- tiation and engagement of alcohol and other drug dependence treatment. Some of these factors are older age, higher levels of drug and psychiatric severity, and prior treatment history.71
(Continued on page 44)
Initiation of Treatment Engagement of Treatment Understanding the ResultsThe percentage of adults diagnosed with alcohol and other dependence who initiated treatment in the 2004 calendar year through either 1) an inpatient AOD admis- sion or 2) an outpatient service for AOD abuse or de- pendence and an additional AOD service within 14 days.
The percentage of adult members diagnosed with AOD disorders who received two additional AOD services dur- ing the 2004 calendar year within 30 days after the initia- tion of AOD treatment.

Initiation and Engagement of Alcohol and Other Drug Dependence Treatment
MassHealth Managed Care HEDIS® 2005 Final Report Center for Health Policy and Research
4
Statistical Summary: Initiation of AOD Treatment
Statistical Summary: Engagement of AOD Treatment
Legend:• 2005 rate is significantly below the comparison rate.O 2005 rate is not significantly different from the comparison rate.
Num indicates NumeratorDen indicates DenominatorLCL indicates Lower Confidence LevelUCL indicates Upper Confidence Level
(A) = Measure was collected using administrative method(H) = Measure was collected using hybrid methodNote: The ability to locate and obtain medical records by a plan or a plan’s contracted vendor can impact performance on a hybrid measure. Per NCQA’s specifications, members for whom no medical record documentation is found are considered non-
2005 Rate Comparison:
Nat’l Mcaid
75th Pctile
Nat’l Mcaid Mean
MACom
m Mean
Plan’s 2003Rate
PCCP(A) •*
•
*
O
•*
•
*
*
•*
•
*
O
n/
a
n/
a
n/
a
NHP(A)
NH(A)
FCHP(A)
BMCHP(A)
2005 BenchmarksNat’l Mcaid 90th Pctile: 73.7% Nat’l Mcaid Mean: 46.1% MassHealth Weighted Mean: 41.3%Nat’l Mcaid 75th Pctile: 51.6% MA Commercial Mean: 49.2% MassHealth Median: 50.6%
MassHealth Plan Rates2005 Num Den Rate LCL UCL 2003 Num Den Rate LCL UCL
PCCP(A) 3,187 8,771 36.3% 35.3% 37.3% PCCPNHP(A)
NH(A)
481
426
653
1,054
73.7%
40.4%
70.3%
37.5%
77.0%
43.4%
NHP
NHNo data available
FCHP(A) 88 93 94.6% 90.0% 99.2% FCHP
BMCHP(A) 1,026 2,027 50.6% 48.4% 52.8% BMCHP
2005 Rate Comparison:
Nat’l Mcaid 75th
Pctile
Nat’l Mcaid Mean
MACom
m Mean
Plan’s 2003Rate
PCCP(A) * * • n/aNHP(A) * * * n/aNH(A) O * • n/aFCHP(A) * * * n/aBMCHP(A) * * * n/a
2005 BenchmarksNat’l Mcaid 90th Pctile: 34.2% Nat’l Mcaid Mean: 11.9% MassHealth Weighted Mean: 20.1%Nat’l Mcaid 75th Pctile: 15.0% MA Commercial Mean: 20.0% MassHealth Median: 24.4%
MassHealth Plan Rates2005 Num Den Rate LCL UCL 2003 Num Den Rate LCL UCL
PCCP(A) 1,534 8,771 17.5% 16.7% 18.3% PCCPNHP(A)
NH(A)
290
150
653
1,054
44.4%
14.2%
40.6%
12.1%
48.2%
16.3%
NHP
NHNo data available
FCHP(A) 65 93 69.9% 60.6% 79.2% FCHP
BMCHP(A) 494 2,027 24.4% 22.5% 26.2% BMCHP

Initiation and Engagement of Alcohol and Other Drug Dependence Treatment
MassHealth Managed Care HEDIS® 2005 Final Report Center for Health Policy and Research
4
Other factors associated with failed initiation and engagement of alcohol and other drug dependence treatment include:
Type of substance: Individuals who are drug dependent are less likely to begin treatment than those dependent only on alcohol. Being employed and having higher drug severity scores is associated with initiating drug treatment.72,73
Gender: The factors related to retention in drug treatment programs are gender-specific, unless drug problems are not severe. Generally, women are better engaged in treatment programs compared to men if they have higher incomes, are non-African-American, are employed, are married, and have lower levels of psychiatric severity. Men are better engaged in treatment compared to women if they are older, if treatment has been suggested or in- terventions have been made by an employer, and if they have abstinence goals at the start of treatment.74
Health plan model type: It is important to note the health plan model type may also influence how members initiate and engage in substance abuse treatment. For example, members served by closed-panel or staff model systems may have more immediate access to substance abuse providers than members served by open-panel plans.75
Interventions that are effective at improving the number of people with drug and alcohol dependence who initiate and engage in treatment include:
Educating primary care physicians: Ten to sixteen percent (10-16%) of all people seen in an outpatient setting are suffering from drug or alcohol addiction.76 Given this prevalence, the role of the primary care physician in initiating patients with substance-related disorders into treatment cannot be overstated. Some providers may fail to initiate a patient into substance abuse treatment because the providers are unaware of counseling techniques that they could use in the primary care setting with a patient who has screened positive for substance abuse. In addition, providers may be unaware of the effective medications that are available to treat substance abuse as well as all of the resources that are available in the community through referral. Interventions aimed at increasing awareness by providers of all the available resources as well as instituting office tools and procedures that support use of those resources could increase the rate at which patients with substance-related disorders are initiated into treatment.
Identifying members at high risk for relapse and recurrence: Characteristics of individuals at high-risk for drug abuse relapse and recurrence in- clude co-occurring psychiatric disorders, homelessness, severity of dependence, and lack of family and psychosocial supports. In contrast, members who are in treatment due to an employer or court mandate tend to be at lower risk for treatment failure. Plans could create a mechanism to identify these members at risk and target programs to this population to address the barriers to maintaining treatment.77
Other interventions that may be effective include: On-site crisis and referral teams Case management programs for high-utilizers of substance abuse treatment services Efforts to change provider attitudes about substance abuse treatment.
Understanding the Results (continued)

Initiation and Engagement of Alcohol and Other Drug Dependence Treatment Impact of Essential Population on PCC Plan Data
51.6%
46.1%
49.2%
36.3%
37.7%
73.7%
40.4%
50.6%
Black bars are benchmarks. White bars represent rates sig- nificantly above the national Medicaid 75th percentile. Grey bars represent rates that are no different than the national Medicaid 75th percentile. Bars with diagonal lines represent rates significantly below the national Medicaid 75th percentile.
Nat'l Mcaid 75th Pctile
Nat'l Mcaid Mean
MA Comm Mean
PCCP
PCCP w /o Essential
NHP
NH
FCHP 94.6%
BMCHP
0%20% 40% 60% 80% 100%
MassHealth Managed Care HEDIS® 2005 Final Report Center for Health Policy and Research
4
The Essential population had a significant effect on the Initiation rate of the Initiation and En- gagement of Alcohol and Other Drug Dependence Treatment measure. The PCC Plan’s rate without the Essential population is significantly better than the PCC Plan’s rate with the Es- sential population. (Note: Statistical significance was determined by comparing the upper and lower confidence intervals of the PCC Plan’s rate without Essential to the PCC Plan’s overall rate, which includes Essential members).
Being unemployed is known to influence the initiation of drug treatment. Thus, employment status may be one factor influencing the PCC Plan’s overall rates since members eligible for Essential coverage are long-term unemployed individuals.
There were no significant differences between the PCC Plan’s rate with and without the Es- sential population for the Engagement of Treatment measure. See Appendix D for results of the Engagement measure for both PCC Plan populations.
Initiation of TreatmentDiscussion
2005 Rate Comparison: Initiation of Treatment
PCCP
PCCP w/o Essential
Nat’l Mcaid 75th Pctile
Nat’l Mcaid MA Comm Mean Mean
Plan’s 2003 Rate
••
• •• •
n/an/a
PCC Plan—Initiation of Treatment
Num Den Rate LCL UCL
PCCP 3,187 8,771 36.3% 35.3% 37.3%
PCCP w/o Essential 2,495 6,621 37.7% 36.5% 38.9%

Follow-up After Hospitalization for Mental Illness
49.6%
37.5%
65.8%
46.0%
65.1%
55.9%
61.3%
60.5%
Black bars are benchmarks. White bars represent rates sig- nificantly above the national Medicaid 75th percentile. Grey bars represent rates that are no different than the national Medicaid 75th percentile. Bars with diagonal lines represent rates significantly below the national Medicaid 75th percentile.
Nat'l Mcaid 75th Pctile
Nat'l Mcaid Mean
MA Comm Mean
PCCP
NHP
NH
FCHP
BMCHP
0% 20% 40% 60% 80% 100%
70.6%
54.3%
84.2%
65.5%
85.2%
75.1%
80.0%
80.3%
Black bars are benchmarks. White bars represent rates sig- nificantly above the national Medicaid 75th percentile. Grey bars represent rates that are no different than the national Medicaid 75th percentile. Bars with diagonal lines represent rates significantly below the national Medicaid 75th percentile.
Nat'l Mcaid 75th Pctile
Nat'l Mcaid Mean
MA Comm Mean
PCCP
NHP
NH
FCHP
BMCHP
0% 20% 40% 60% 80% 100%
MassHealth Managed Care HEDIS® 2005 Final Report Center for Health Policy and Research
4
Regular outpatient follow-up visits after discharge from a mental illness-related hospitalization are essential to long-term treatment success as well as prevention of relapse and re-hospitalization. Regular outpatient care can help a patient with the transition back to the home and work environ- ment. It also can help with medication management. Failure to engage in follow-up visits increases likelihood of readmission.78
Nearly half (48.8%) of MassHealth members 6 years of age and older who were discharged due to a mental illness had a follow-up visit within seven days of discharge. Plan-specific rates ranged from 46% to 65.1%. Four plans had rates that were significantly better than or no different from the national Medicaid 75th percentile (49.6%). More MassHealth members had a follow- up visit within thirty days of discharge (68%) than within 7 days of discharge. Plan-specific rates of thirty-day follow-up ranged from 65.5% to 85.2%. Four plans performed significantly better than or no different from the national Medicaid 75th per- centile (70.6%)
Several factors influence follow-up visits after dis- charge for a mental illness, including:
Socio-demographic characteristics: Socio- demographic characteristics associated with failure to attend follow-up visits include being white, male, young, unmarried, unemployed, as well as living in an urban environment, and having a low socioeco- nomic status. In addition, being socially isolated and living in inner-city are both associated with failure to attend follow-
(Continued on page 48)
Follow-Up within 7 days Follow-Up within 30 days Understanding the ResultsThe percentage of members 6 years of age and older who were discharged after treatment of selected mental health disorders and who were seen on an ambulatory basis or were in intermediate treatment with a mental health provider within 7 days after
The percentage of members 6 years of age and older who were discharged after treatment of selected mental health disorders and who were seen on an ambulatory basis or were in intermediate treatment with a mental health provider within 30 days after

Follow-up After Hospitalization for Mental Illness
(A) = Measure was collected using administrative method(H) = Measure was collected using hybrid methodNote: The ability to locate and obtain medical records by a plan or a plan’s contracted vendor can impact performance on a hybrid measure. Per NCQA’s specifications, members for whom no medical record documentation is found are considered non-compliant with the measure.
MassHealth Managed Care HEDIS® 2005 Final Report Center for Health Policy and Research
4
Statistical Summary: 7-day Follow-up
Statistical Summary: 30-day Follow-up
2005 BenchmarksNat’l Mcaid 90th Pctile: 81.3% Nat’l Mcaid Mean: 54.3% MassHealth Weighted Mean: 68.3%
Nat’l Mcaid 75th Pctile: 70.6% MA Commercial Mean: 84.2% MassHealth Median: 80.0%
Legend:• 2005 rate is significantly below the comparison rate.O 2005 rate is not significantly different from the comparison rate.* 2005 rate is significantly above the comparison rate.
Num indicates NumeratorDen indicates DenominatorLCL indicates Lower Confidence LevelUCL indicates Upper Confidence Level
2005 Rate Comparison:
Nat’l Mcaid 75th
Pctile
Nat’l Mcaid Mean
MAComm Mean
Plan’s 2003Rate
PCCP(A) • * • •NHP(A) * * O *NH(A) * * • *FCHP(A) O * O OBMCHP(A) * * • *
2005 BenchmarksNat’l Mcaid 90th Pctile: 62.5% Nat’l Mcaid Mean: 37.5% MassHealth Weighted Mean: 48.8%Nat’l Mcaid 75th Pctile: 49.6% MA Commercial Mean: 65.8% MassHealth Median: 60.5%
MassHealth Plan Rates2005 Num Den Rate LCL UCL 2003 Num Den Rate LCL UCL
PCCP(A) 3,349 7,287 46.0% 44.8% 47.1% PCCP(A) 3168 6447 49.1% 47.9% 50.4%NHP(A) 256 393 65.1% 60.3% 70.0% NHP(A) 429 831 51.6% 48.2% 55.1%
NH(A) 276 494 55.9% 51.4% 60.4% NH(A) 86 263 32.7% 26.8% 38.6%
FCHP(A) 46 75 61.3% 49.6% 73.0% FCHP(A) 31 77 40.3% 28.7% 51.9%
BMCHP(A) 497 821 60.5% 57.1% 63.9% BMCHP(A) 160 360 44.4% 39.2% 49.7%
2005 Rate Comparison:
Nat’l Mcaid
75th Pctile
Nat’l Mcaid Mean
MACom
m Mean
Plan’s 2003Rate
PCCP(A) • * • •NHP(A) * * O *NH(A) * * • *FCHP(A) O * O OBMCHP(A) * * • *
MassHealth Plan Rates2005 Num Den Rate LCL UCL 2003 Num Den Rate LCL UCL
PCCP(A) 4,770 7,287 65.5% 64.4% 66.6% PCCP(A) 4,503 6,447 69.8% 68.7% 71.0%NHP(A) 335 393 85.2% 81.6% 88.9% NHP(A) 601 831 72.3% 69.2% 75.4%
NH(A) 371 494 75.1% 71.2% 79.0% NH(A) 122 263 46.4% 40.2% 52.6%
FCHP(A) 60 75 80.0% 70.3% 89.7% FCHP(A) 48 77 62.3% 50.9% 73.8%
BMCHP(A) 659 821 80.3% 77.5% 83.1% BMCHP(A) 226 360 62.8% 57.6% 67.9%

Follow-up After Hospitalization for Mental Illness
MassHealth Managed Care HEDIS® 2005 Final Report Center for Health Policy and Research
4
up visits.79,80,81,82
Severity of illness: Another factor influencing a member’s engagement in follow-up visits is the member’s need for services as measured by diag- nosis, severity of illness, length of hospital stay and number of previous hospitalizations.83,84 In addition, co-morbid substance abuse also is a factor in engagement.85
Involuntary admission: Members who are admitted involuntarily have an increased risk of having no follow-up after discharge from the hospital.86
A number of interventions can address barriers to follow-up after hospitalization for mental illness. One such intervention is:
Interaction with outpatient staff prior to discharge: Arranging for outpatient staff to visit with a member before discharge from the hospital, as well as employing the use of a referral coordinator encourages members to attend follow-up visits.87,88 In addition, effective communication about discharge plans between inpatient staff and outpatient clinicians, starting outpatient programs before discharge, and family involvement during hos- pital stay all are associated with engagement in follow-up care.89
In addition, interventions to provide assistance with transportation, offer case management, and implement appointment reminders may improve the rate at which members attend follow-up visits.
Understanding the Results (continued)

49.6%
37.5%
65.8%
46.0%
48.1%
65.1%
55.9%
61.3%
60.5%
MassHealth Managed Care HEDIS® 2005 Final Report Center for Health Policy and Research
4
Follow-up After Hospitalization for Mental Illness Impact of Essential Population on PCC Plan Data
DiscussionBoth the 7-day and 30-day rates for the PCC Plan without the Essential population are signifi- cantly better than the PCC Plan’s rate with the Essential population (48.1% vs. 46.0% for the 7- day rate and 68.0% vs. 65.5% for the 30-day rate). (Note: Statistical significance was deter- mined by comparing the upper and lower confi- dence intervals of the PCC Plan’s rate without Essential to the PCC Plan’s overall rate, which includes Essential members).
Several known factors related to follow-up visits after hospitalization for mental illness may have impacted whether members with Essential cov- erage obtained follow-up care. Individuals who are male, unemployed, and socially isolated are less likely to attend follow-up visits. Because the Essential population has a higher proportion of males and is a coverage type for the long-term unemployed and non-citizens, these characteris- tics may have influenced the PCC Plan’s overall HEDIS rate.
0% 20% 40% 60% 80% 0% 20% 40% 60% 80%
7-Day Follow-up
Black bars are benchmarks. White bars represent rates signifi- cantly above the national Medicaid 75th percentile. Grey bars represent rates that are no different than the national Medicaid 75th percentile. Bars with diagonal lines
Nat'l Mcaid 75th
Nat'l Mcaid
MA Comm
PC
PCCP w /o
N
N
FC
BMC
30-Day Follow-up
Black bars are benchmarks. White bars represent rates signifi- cantly above the national Medicaid 75th percentile. Grey bars represent rates that are no different than the national Medicaid 75th percentile. Bars with diagonal lines
Nat'l Mcaid 75th 70.6
Nat'l Mcaid 54.3
MA Comm 84.2
PC 65.5
PCCP w /o 68.0
N 85.2
N 75.1
FC 80.0
BMC 80.3
2005 Rate Comparison: 7 Day Follow Up
PCCP
PCCP w/o Essential
Nat’l Nat’l Mcaid MA Comm Mcaid 75th Pctile Mean Mean
• • •• • •
PCC Plan: 7 Day Follow UpNum Den Rate LCL UCL
PCCP 3,349 7,287 46.0% 44.8% 47.1%
PCCP w/o Essential 3,127 6,503 48.1% 46.9% 49.3%
2005 Rate Comparison: 30 Day Follow Up
PCCP
PCCP w/o Essential
Nat’l Mcaid 75th Pctile
Nat’l Mcaid Mean
MA Comm Mean
••
••
••
PCC Plan: 30 Day Follow UpNum Den Rate LCL UCL
PCCP 4,770 7,287 65.5% 64.4% 66.6%
PCCP w/o Essential 4,424 6,503 68.0% 66.9% 69.2%

Center for Health Policy and
25.4%
19.0%
33.1%
18.8%
30.0%
14.3%
35.1%
35.1%
51.5%
46.4%
62.8%
48.1%
41.3%
52.0%
44.2%
34.5%
35.2%
30.4%
44.0%
32.6%
24.6%
37.1%
22.1%
19.4%
Antidepressant Medication Management
Black bars are benchmarks. White bars represent rates sig- nificantly above the national Medicaid 75th percentile. Grey bars represent rates that are no different than the national Medicaid 75th percentile. Bars with diagonal lines represent rates significantly below the national Medicaid 75th percentile.
Nat'l Mcaid 75th Pctile
Nat'l Mcaid Mean
MA Comm Mean
PCCP
NHP
NH
FCHP
BMCHP
0% 20% 40% 60% 80% 100%
Safe and effective pharmaceutical therapies to manage depression and its symptoms are widely available. However, to be most effective, a course of antidepressant therapy must be adhered to after treatment is initiated. Most depressed patients discontinue medication within the first 180 days of their first prescription. Discontinuation can have considerable consequences for the patient’s overall mental health. Premature discontinuation of antidepressant treatment is associated with a greatly increased risk of worsening severity and recurrence.90
Optimal Practitioner Contacts for Medication Effective Acute Phase Treatment Effective Continuation
Phase TreatmentThe percentage of members 18 years of age and older who were diagnosed with a new episode of depression and treated with antidepressant medication, and who had at least three follow-up contacts with a practitioner coded with a mental health diagnosis during the 84-day Acute Treat- ment Phase.
The percentage of members 18 years of age and older who were diagnosed with a new episode of depression, were treated with antidepressant medication and remained on an antidepressant drug during the entire 84-day Acute Treatment Phase.
The percentage of members 18 years of age and older who where diagnosed with a new episode of depression and treated with antidepressant medication and who re- mained on an antidepressant drug for at least 180 days.

Antidepressant Medication Management
MassHealth Managed Care HEDIS® 2005 Final Report Center for Health Policy and Research
5
Statistical Summary: Optimal Practitioner Contacts for Medication Management
Statistical Summary: Effective Acute Phase Treatment2005 BenchmarksNat’l Mcaid 90th Pctile: 55.1% Nat’l Mcaid Mean: 46.4% MassHealth Weighted Mean: 44.9%Nat’l Mcaid 75th Pctile: 51.5% MA Commercial Mean: 62.8% MassHealth Median: 44.2%
MassHealth Plan Rates2005 Num Den Rate LCL UCL 2003 Num Den Rate LCL UCL
PCCP(A) 1,180 2,454 48.1% 46.1% 50.1% PCCP(A) 1,039 2,186 47.5% 45.4% 49.6%NHP(A) 208 504 41.3% 36.9% 45.7% NHP(A) 385 781 49.3% 45.7% 52.9%
NH(A) 185 356 52.0% 46.6% 57.3% NH(A) 87 175 49.7% 42.0% 57.4%
FCHP(A) 34 77 44.2% 32.4% 55.9% FCHP(A) 136 187 72.7% 66.1% 79.4%
BMCHP(A) 288 834 34.5% 31.2% 37.8% BMCHP(A) 136 340 40.0% 34.6% 45.4%
51 MassHealth Managed Care HEDIS® 2005 Final ReportLegend:• 2005 rate is significantly below the comparison rate.O 2005 rate is not significantly different from the comparison rate.
Num indicates NumeratorDen indicates DenominatorLCL indicates Lower Confidence LevelUCL indicates Upper Confidence Level
(A) = Measure was collected using administrative method(H) = Measure was collected using hybrid methodNote: The ability to locate and obtain medical records by a plan or a plan’s contracted vendor can impact performance on a hybrid measure. Per NCQA’s specifications, members for whom no medical record documentation is found are considered non-
2005 Rate Comparison:
Nat’l Nat’lMcaid
Mcaid 75th Pctile Mean
MACom
m Mean
Plan’s 2003Rate
PCCP(A) • O • ONHP(A) • • • ONH(A) O * • OFCHP(A) O O • •BMCHP(A) • • • O
2005 Rate Comparison:
Nat’l Mcaid
75th Pctile
Nat’l Mcaid Mean
MACom
m Mean
Plan’s 2003Rate
PCCP(A) •*• O*
O*•**
• O•
O
•* O•
*
NHP(A)
NH(A)
FCHP(A)
BMCHP(A)
2005 BenchmarksNat’l Mcaid 90th Pctile: 31.6% Nat’l Mcaid Mean: 19.0% MassHealth Weighted Mean: 23.3%Nat’l Mcaid 75th Pctile: 25.4% MA Commercial Mean: 33.1% MassHealth Median: 30.0%
MassHealth Plan Rates2005 Num Den Rate LCL UCL 2003 Num Den Rate LCL UCL
PCCP(A) 461 2,454 18.8% 17.2% 20.4% PCCP(A) 642 2,186 29.4% 27.4% 31.3%NHP(A) 151 504 30.0% 25.9% 34.1% NHP(A) 176 781 22.5% 19.5% 25.5%
NH(A) 51 356 14.3% 10.5% 18.1% NH(A) 21 175 12.0% 6.9% 17.1%
FCHP(A) 27 77 35.1% 23.8% 46.4% FCHP(A) 103 187 55.1% 47.7% 62.5%
BMCHP(A) 293 834 35.1% 31.8% 38.4% BMCHP(A) 54 340 15.9% 11.9% 19.9%

MassHealth Managed Care HEDIS® 2005 Final Report Center for Health Policy and Research
5
Antidepressant Medication Management
2005 Rate Comparison:
MAComm Mean Plan’s 2003
Rate
2005 BenchmarksNat’l Mcaid 90th Pctile: Nat’l Mcaid 75th Pctile:
38.6%35.2%
Nat’l Mcaid Mean: 30.4%MassHealth Weighted Mean: 29.2%Nat’l Mcaid 75th PctileNat’l Mcaid Mean MA Commercial Mean: 44.0%MassHealth Median: 24.6%
MassHealth Plan RatesPCCP(A) 2005 NumDenRateLCLUCL 2003 NumDenRate
NHP(A)NH(A) FCHP(A) BMCHP(A)
•• O••
*•* O•
•••••
O• O•O
LCLUCL
Legend:2005 rate is significantly below the comparison rate.O 2005 rate is not significantly different from the comparison rate.* 2005 rate is significantly above the comparison rate.
Statistical Summary: Effective Continuation Phase Treatment
PCCP(A) 799 2,454 32.6% 30.7% 34.4% PCCP(A) 714 2,186 32.7% 30.7% 34.7%NHP(A) 124 504 24.6% 20.7% 28.5% NHP(A) 250 781 32.0% 28.7% 35.3%
NH(A) 132 356 37.1% 31.9% 42.2% NH(A) 51 175 29.1% 22.1% 36.2%
FCHP(A) 17 77 22.1% 12.2% 32.0% FCHP(A) 100 187 53.5% 46.1% 60.9%
BMCHP(A) 162 834 19.4% 16.7% 22.2% BMCHP(A) 84 340 24.7% 20.0% 29.4%
Twenty-three percent (23.3%) of MassHealth members who were diagnosed with a new episode of depression and treated with antidepressant medica- tion had at least three follow-up contacts with a practitioner during the 84-day Acute Phase. Plan-specific rates ranged from 14.3% to 35.1%. Three plans had rates that were significantly better than or no different from the national Medicaid 75th percentile. Forty-five percent (44.9%) of members with a new episode of depression and treated with antidepressant medication remained on an antidepressant drug during the entire 84-day Acute Treatment Phase. Plan-specific rates ranged from 34.5% to 52.0%. No plan had a rate that was significantly better than the national Medicaid 75th percentile. Two plans had rates that were not statistically different from the national Medicaid 75th percentile. Thirty-percent (30%) of members diag- nosed with a new episode of depression and treated with antidepressant medication remained on that medication for at least 180 days. Plan-specific rates ranged from 19.4% to 37.1%. No plan had a rate that was significantly better than the national Medicaid 75th percentile. Only one plan had a rate that was not statistically different from the national Medicaid 75th percentile.
The barriers to attending follow-up visits and adhering to antidepressant medication have been well-researched. In addition, specific barriers related to the Antidepressant Medication Management measure have been identified:
Failure to capture follow-up visits for HEDIS measure: An analysis of national data from the Optimal Practitioner Contact HEDIS measure found
Understanding the Results
Num indicates NumeratorDen indicates DenominatorLCL indicates Lower Confidence LevelUCL indicates Upper Confidence Level
(A) = Measure was collected using administrative method(H) = Measure was collected using hybrid methodNote: The ability to locate and obtain medical records by a plan or a plan’s contracted vendor can impact performance on a hybrid measure. Per NCQA’s specifications, members for whom no medical record documentation is found are considered non-compliant with the measure.

Antidepressant Medication Management
Understanding the Results (continued)
Center for Health Policy and
that the most common reason why at least three follow-up contacts with a practitioner were not identified for the 84-day Acute Treatment Phase was that the patient had restarted a previously successful antidepressant.91 Other reasons cited were system-based and included failure to code a visit with the prescribing provider as mental health-related as well as documenting the wrong start dates for a prescription due to the use of medication samples.
Failure to remain on an antidepressant: Factors related to a patient’s failure to remain on an antidepressant include concern over side effects and misconceptions about treatment. Antidepressant medications can cause side effects which, if they occur, are most common during the first month of treatment. Patients report that they discontinue their antidepressant treatment because they feel that they do not need medication, feel better, or feel that the medications are not working. In addition, the study of the national data from the Antidepressant Medication Management measure found that one quarter of the members who did not adhere to their medication regimen told their provider that they were taking their medication although a phar- macy data base showed that they were not.92
Some interventions have been shown to increase patient attendance at follow-up visits and adherence to an antidepressant regimen:
Educational messages: Patients may benefit from educational messages that will help a member to reduce possible side effects and to know what to expect during treatment, particularly in the first few months. These messages should reinforce that patients should take medication daily, that it may take 2-4 weeks to see effects, that they should continue taking the medication even if feeling better, and that they should not stop a medication without checking with a doctor first. The source of this information also matters. Research has shown that patients who receive antidepressant information from multiple sources (e.g., pharmacists, primary care providers, health plans, mental health specialists, friends, family members, and/or the internet) were significantly more likely to adhere to their antidepressant regimen than those who received the information through fewer sources.93
Integrated role for psychologist or psychiatrist: Multi-faceted primary care interventions that include an on-site integrated role for a psychologist or psychiatrist can significantly improve patient adherence to antidepressants.94 In addition, quality improvement programs in which mental health spe- cialists collaborate with primary care providers can substantially increase rates of antidepressant treatment.95
Telephone care management: Telephone care management has been shown to increase the likelihood that a patient uses antidepressants for at least 90 days. In one particular program, care managers contacted participants within four weeks of the initial antidepressant prescription, made two additional contacts four and twelve weeks later, and sent a personalize mailing approximately 20 weeks later.96 In this intervention, the treating physi- cian received a structured report for each patient contact that included a summary of the care manager’s clinical assessment as well as computer- generated recommendations for medication adjustment. Participants also received a detailed self-management workbook.
Other interventions that may be effective include: Increasing communication between pharmacy providers and clinicians so that clinicians are notified when patients do not fill or re-fill a prescription Educating providers on how to anticipate and screen for the side effects of antidepressants which may lead patients to discontinue their treatment Using office visits with nurses to monitor medication compliance instead of visits with physicians (nurses may have more time to talk to the patient
about barriers to medication compliance as well as more experience discussing patient concerns such as side effects), and Disease management programs for patients with depression. 53 MassHealth Managed Care HEDIS® 2005 Final Report

MassHealth Managed Care HEDIS® 2005 Final Report Center for Health Policy and Research
5

MassH
ealth Managed C
are HED
IS
® 2005 Final Report
Center for H
ealth Policy and Research
5Center for Health Policy and
Appendix A: Initiation and Engagement of Alcohol and Other Drug Dependence Treatment– Age– Stratified Results

MassHealth Managed Care HEDIS® 2005 Final Report Center for Health Policy and Research
5
Appendix AInitiation and Engagement of Alcohol and Other Drug (AOD) Dependence Treatment
* Rates cannot be calculated when a plan’s denominator is <30.
* Rates cannot be calculated when a plan’s denominator is <30.
Initiation - All Age Stratifications
Age 18-25 Num Den Rate LCL UCL
PCCP 538 1,373 39.2% 36.6% 41.8%NHP 99 137 72.3% 64.4% 80.1%
NH 66 175 37.7% 30.2% 45.2%
FCHP* 8 8 n/a n/a n/a
BMCHP 156 321 48.6% 43.0% 54.2%
Age 26-34 Num Den Rate LCL UCL
PCCP 720 1,844 39.0% 36.8% 41.3%NHP 134 184 72.8% 66.1% 79.5%
NH 116 247 47.0% 40.5% 53.4%
FCHP* 16 17 n/a n/a n/a
BMCHP 218 418 52.2% 47.2% 57.1%
Age 35-64 Num Den Rate LCL UCL
PCCP 1,929 5,554 34.7% 33.5% 36.0%NHP 248 332 74.7% 69.9% 79.5%
NH 244 632 38.6% 34.7% 42.5%
FCHP 64 68 94.1% 87.8% 100.0%
BMCHP 652 1,288 50.6% 47.9% 53.4%
Age Total Num Den Rate LCL UCL
PCCP 3,187 8,771 36.3% 35.3% 37.3%NHP 481 653 73.7% 70.3% 77.0%
NH 426 1,054 40.4% 37.5% 43.4%
FCHP 88 93 94.6% 90.0% 99.2%
BMCHP 1,026 2,027 50.6% 48.4% 52.8%

Appendix AInitiation and Engagement of Alcohol and Other Drug (AOD) Dependence Treatment
MassHealth Managed Care HEDIS® 2005 Final Report Center for Health Policy and Research
5
Engagement - All Age Stratifications
Age 18-25 Num Den Rate LCL UCL
PCCP 239 1,373 17.4% 15.4% 19.4%NHP 53 137 38.7% 30.2% 47.2%
NH 16 175 9.1% 4.6% 13.7%
FCHP 6 8 n/a n/a n/a
BMCHP 65 321 20.2% 15.7% 24.8%
Age 26-34 Num Den Rate LCL UCL
PCCP 378 1,844 20.5% 18.6% 22.4%NHP 88 184 47.8% 40.3% 55.3%
NH 50 247 20.2% 15.0% 25.5%
FCHP 14 17 n/a n/a n/a
BMCHP 128 418 30.6% 26.1% 35.2%
Age 35-64 Num Den Rate LCL UCL
PCCP 917 5,554 16.5% 15.5% 17.5%
NHP 149 332 44.9% 39.4% 50.4%
NH 84 632 13.3% 10.6% 16.0%
FCHP 45 68 66.2% 54.2% 78.2%
BMCHP 301 1,288 23.4% 21.0% 25.7%
Age Total Num Den Rate LCL UCL
PCCP 1,534 8,771 17.5% 16.7% 18.3%NHP 290 653 44.4% 40.6% 48.2%
NH 150 1,054 14.2% 12.1% 16.3%
FCHP 65 93 69.9% 60.6% 79.2%
BMCHP 494 2,027 24.4% 22.5% 26.2%

MassHealth Managed Care HEDIS® 2005 Final Report Center for Health Policy and Research
5

MassHealth Managed Care HEDIS® 2005 Final Report Center for Health Policy and Research
5
App
endi
xB: S
elec
t PC
CP
lan
Dat
a by
Elig
ibili
ty T
ype

MassHealth Managed Care HEDIS® 2005 Final Report Center for Health Policy and Research
6
Appendix BSelect PCC Plan Data by Eligibility Type—Basic, Essential and Non-Basic/Non-Essential
Basic
Essential
Non-Basic / Non-Essential
Initiation and Engagement of Alcohol and Other Drug Dependence Treatment
Initiation Num Den Rate LCL UCL
Ages 18-25 40 81 49.4% 37.9% 60.9%Ages 26-34 69 172 40.1% 32.5% 47.7%
Ages 35-64 197 556 35.4% 31.4% 39.5%
Ages Total 306 809 37.8% 34.5% 41.2%
Engagement Num Den Rate LCL UCL
Ages 18-25 29 81 35.8% 24.7% 46.9%Ages 26-34 36 172 20.9% 14.6% 27.3%
Ages 35-64 99 556 17.8% 14.5% 21.1%
Ages Total 164 809 20.3% 17.5% 23.0%Initiation Num Den Rate LCL UCL
Ages 18-25 154 438 35.2% 30.6% 39.7%Ages 26-34 202 569 35.5% 31.5% 39.5%
Ages 35-64 336 1,143 29.4% 26.7% 32.1%
Ages Total 692 2,150 32.2% 30.2% 34.2%
Engagement Num Den Rate LCL UCL
Ages 18-25 82 438 18.7% 15.0% 22.5%Ages 26-34 122 569 21.4% 18.0% 24.9%
Ages 35-64 189 1,143 16.5% 14.3% 18.7%
Ages Total 393 2,150 18.3% 16.6% 19.9%Initiation Num Den Rate LCL UCL
Ages 18-25 344 854 40.3% 36.9% 43.6%Ages 26-34 449 1,103 40.7% 37.8% 43.7%
Ages 35-64 1,396 3,855 36.2% 34.7% 37.7%
Ages Total 2,189 5,812 37.7% 36.4% 38.9%
Engagement Num Den Rate LCL UCL
Ages 18-25 128 854 15.0% 12.5% 17.4%Ages 26-34 220 1,103 19.9% 17.5% 22.3%
Ages 35-64 629 3,855 16.3% 15.1% 17.5%
Ages Total 977 5,812 16.8% 15.8% 17.8%

Appendix BSelect PCC Plan Data by Eligibility Type—Basic, Essential and Non-Basic/Non-Essential
MassHealth Managed Care HEDIS® 2005 Final Report Center for Health Policy and Research
6
Effective Continuation Phase Treatment
Population Num Den Rate LCL UCL
Basic 50 130 38.5% 29.7% 47.2%Essential 31 73 42.5% 30.4% 54.5%
Non-Basic/Non-Essential 718 2,251 31.9% 29.9% 33.8%
Antidepressant Medication Management Follow-up After Hospitalization for Mental IllnessOptimal Practitioner Contacts for Medication Management
Population Num Den Rate LCL UCL
Basic 26 130 20.0% 12.7% 27.3%Essential 20 73 27.4% 16.5% 38.3%
Non-Basic/Non-Essential 415 2,251 18.4% 16.8% 20.1%
Follow-up within 7 Days
Population Num Den Rate LCL UCL
Basic 117 374 31.3% 26.5% 36.1%Essential 222 784 28.3% 25.1% 31.5%
Non-Basic/Non-Essential 3,010 6,129 49.1% 47.9% 50.4%
Effective Acute Phase Treatment
Population Num Den Rate LCL UCL
Basic 65 130 50.0% 41.0% 59.0%Essential 41 73 56.2% 44.1% 68.2%
Non-Basic/Non-Essential 1,074 2,251 47.7% 45.6% 49.8%
Follow-up within 30 Days
Population Num Den Rate LCL UCL
Basic 193 374 51.6% 46.4% 56.8%Essential 346 784 44.1% 40.6% 47.7%
Non-Basic/Non-Essential 4,231 6,129 69.0% 67.9% 70.2%

MassHealth Managed Care HEDIS® 2005 Final Report Center for Health Policy and Research
6

MassHealth Managed Care HEDIS® 2005 Final Report Center for Health Policy and Research
6
App
endi
xC: P
CC
Pla
n D
ata
With

Appendix CPCC Plan Data With and Without the Essential Population
MassHealth Managed Care HEDIS® 2005 Final Report Center for Health Policy and Research
6
* There were no women in the PCC Plans sample for this measure who had an Essential enrollment segment long enough to be considered to have had Enrollment cover- age during the measurement period for this measure.
* There were no women in the PCC Plans sample for this measure who had an Essential enrollment segment long enough to be considered to have had Enrollment cover- age during the measurement period for this measure.
Adults’ Access to Preventive/Ambulatory Healthcare
Ages 20-44Num Den Rate LCL UCL
PCCP 53,970 63,416 85.1% 84.8% 85.4%
PCCP w/o Essential 50,427 58,149 86.7% 86.4% 87.0%
Ages 45-64Num Den Rate LCL UCL
PCCP 40,414 45,004 89.8% 89.5% 90.1%
Cervical Cancer Screening
All Age Groups (<21, 21-40, 41-60, 61-80, 81+)Num Den Rate LCL UCL
PCCP n/a n/a n/a n/a n/a
PCCP w/o Essential* n/a n/a n/a n/a n/a
Num Den Rate LCL UCL
PCCP 31,537 42,158 74.8% 74.4% 75.2%
PCCP w/o Essential 31,422 41,990 74.8% 74.4% 75.2%
Prenatal and Postpartum Care*
Postpartum CareNum Den Rate LCL UCL
PCCP n/a n/a n/a n/a n/a
PCCP w/o Essential* n/a n/a n/a n/a n/a
Timeliness of Postpartum CareNum Den Rate LCL UCL
PCCP n/a n/a n/a n/a n/a
PCCP w/o Essential* n/a n/a n/a n/a n/a
Breast Cancer ScreeningFrequency of Ongoing Prenatal Care*Appropriate Treatment for Children with Upper Respiratory Infections*
Num Den Rate LCL UCL
PCCP 8,226 12,665 65.0% 64.1% 65.8%
PCCP w/o Essential 8,175 12,586 65.0% 64.1% 65.8%
Num Den Rate LCL UCL
PCCP n/a n/a n/a n/a n/a
PCCP w/o Essential* n/a n/a n/a n/a n/a

MassHealth Managed Care HEDIS® 2005 Final Report Center for Health Policy and Research
6
PCCP w/o Essential 37,298 41,163 90.6% 90.3% 90.9%
Ages TOTALNum Den Rate LCL UCL
PCCP 94,384 108,420 87.1% 86.9% 87.3%
PCCP w/o Essential 87,725 99,312 88.3% 88.1% 88.5%
* This measure assesses care provided to members 18 years of age and younger. Therefore, there were no mem- bers in the PCC Plan’s denominator who had Essential cov- erage.
Num Den Rate LCL UCL
PCCP 264 411 64.2% 59.5% 69.0%
PCCP w/o Essential 263 404 65.1% 60.3% 69.9%
Controlling High Blood Pressure

Appendix CPCC Plan Data With and Without the Essential Population
MassHealth Managed Care HEDIS® 2005 Final Report Center for Health Policy and Research
6
Initiation and Engagement of Alcohol and Other Drug Dependence Treatment
Initiation 18-25Num Den Rate LCL UCL
PCCP 538 1,373 39.2% 36.6% 41.8%
PCCP w/o Essential 384 935 41.1% 37.9% 44.3%
Initiation 26-34Num Den Rate LCL UCL
PCCP 720 1,844 39.0% 36.8% 41.3%
PCCP w/o Essential 518 1,275 40.6% 37.9% 43.4%
Initiation and Engagement of Alcohol and Other Drug Dependence Treatment
Engagement 18-25Num Den Rate LCL UCL
PCCP 239 1,373 17.4% 15.4% 19.4%
PCCP w/o Essential 157 935 16.8% 14.3% 19.2%
Engagement 26-34Num Den Rate LCL UCL
PCCP 378 1,844 20.5% 18.6% 22.4%
PCCP w/o Essential 256 1,275 20.1% 17.8% 22.3%
Follow-up After Hospitalization for Mental Illness
Follow-up within 7 DaysNum Den Rate LCL UCL
PCCP 3,349 7,287 46.0% 44.8% 47.1%
PCCP w/o Essential 3,127 6,503 48.1% 46.9% 49.3%
Follow-up within 30 DaysNum Den Rate LCL UCL
PCCP 4,770 7,287 65.5% 64.4% 66.6%
PCCP w/o Essential 4,424 6,503 68.0% 66.9% 69.2%
Initiation 35-64Num Den Rate LCL UCL
PCCP 1,929 5,554 34.7% 33.5% 36.0%
PCCP w/o Essential 1,593 4,411 36.1% 34.7% 37.5%
Engagement 35-64Num Den Rate LCL UCL
PCCP 971 5,554 16.5% 15.5% 17.5%
PCCP w/o Essential 728 4,411 16.5% 15.4% 17.6%
Initiation TotalNum Den Rate LCL UCL
PCCP 3,187 8,771 36.3% 35.3% 37.3%
PCCP w/o Essential 2,495 6,621 37.7% 36.5% 38.9%
Engagement TotalNum Den Rate LCL UCL
PCCP 1,534 8,771 17.5% 16.7% 18.3%
PCCP w/o Essential 1,141 6,621 17.2% 16.3% 18.1%
Appendix CPCC Plan Data With and Without the Essential Population
MassHealth Managed Care HEDIS® 2005 Final Report Center for Health Policy and Research
6
Antidepressant Medication Management
Optimal Practitioner ContactsNum Den Rate LCL UCL
PCCP 461 2,454 18.8% 17.2% 20.4%
PCCP w/o Essential 441 2,381 18.5% 16.9% 20.1%
Effective Acute Phase TreatmentNum Den Rate LCL UCL
PCCP 1,180 2,454 48.1% 46.1% 50.1%
PCCP w/o Essential 1,139 2,381 47.8% 45.8% 49.9%
Effective Continuous Phase TreatmentNum Den Rate LCL UCL
PCCP 799 2,454 32.6% 30.7% 34.4%
PCCP w/o Essential 768 2,381 32.3% 30.4% 34.2%

REFERENCES
MassHealth Managed Care HEDIS® 2005 Final Report Center for Health Policy and Research
6
1 Humphrey L, Helfand M, Chan M and Woolf S. Breast cancer screening: a summary of the evi- dence for the US Preventive Services Task Force. Annals of Internal Medicine. 2002;137: 347-360.
2 Barth R, Gibson G, Carney P, Mott L, Becher R and Poplack S. Detection of breast cancer on screening mammography allows patients to be treated with less-toxic therapy.” AJR 2005;184:324- 329.
3 Simon M, Gimotty P, Coombs J, McBride S, Mon- crease A, Burack R. Factors affecting participation in a mammography screening program among members of an urban Detroit health maintenance organization. Cancer Detection and Prevention.1998;22:30-38.
4 Schoen R, Marcus M, Braham R. Factors associ- ated with the use of screening mammography in a primary care setting. Journal of Community Health. 1994;19:239-252.
5 Conry C, Main D, Miller R, Iverson D and CalongeB. Factors influencing mammogram ordering at the time of the office visit. Journal of Family Practice. 1993;37:356-360.
6 Mandelblatt J, Gold K, O’Malley A, et al. Breast and cervix cancer screening among multi-ethnic women: role of age, health and source of care. Preventive Medicine. 1999;28:418-425.
7 Selvin E and Brett K. Breast and cervical cancer screening: sociodemographic predictors among White, Black, and Hispanic women. American Jour- nal of Public Health. 2003;93:618-623.
8 Rimer BK, Keintz M, Kessler H, Engstrom P and Rosan J. Why woman resist screening mammogra- phy: patient-related barriers. Radiology. 1989;172: 243-246.
9 Vincent A, Bradham D, Hoercherl S and McTagueD. Survey of clinical breast examingation and use of screening mammography in Florida. South Medi- cal Journal. 1995;88:731-736.
10 Lurie N, Slater J, McGovern P, Ekstrum H, Quam L and Margolis K. Preventive care for women— does the sex of the physician matter? New England Journal of Medicine. 1993;329:478-482.
11 Centers for Disease Control and Prevention (CDC). Use of cervical and breast cancer screening among women with and without functional limita- tions--United States, 1994-1995. MMWR - Morbid- ity & Mortality Weekly Report. 1998;47(40):853-6.
12 Mandelblatt J and Yabroff R. Effectiveness of interventions designed to increase mammography use: a meta-analysis of provider-targeted strate- gies. Cancer Epidemiology, Biomarkers and Pre- vention. 1999;8: 759-767.
13 American Cancer Society. Detailed Guidelines: Cervical Cancer. www.cancer.org.
14 Sawaya G and Grimes DA. New technologies in cervical cytology screening: a word of caution. Ob- stetrics and Gynecology. 1999;94:307-310.
15 Institute of Medicine. Care without Coverage: Too Little, Too Late. National Academies Press; 2002.
16 Wells B and Horm J. Targeting the underserved
for breast and cervical cancer screening: the utility of ecological analysis using the National Health Interview Survey. American Journal of Public Health. 1998;88:1484-1489.
17 Curry S, Byers T, Hewitt M, eds. (2003.) Fulfilling the Potential of Cancer Prevention and Early Detec- tion. Washington DC: National Academies Press; 2003.
18 Bazargan M, Bazargan S, Calderon J, et al. Mammography screening and breast self- examination among minority women in public hous- ing projects: the impact of physician recommenda- tion. Cell Mol Biol 2003;49:1213.
19 Jibaja-Weiss ML. Volk RJ. Kingery P. Smith QW. Holcomb JD. Tailored messages for breast and cervical cancer screening of low-income and minor- ity women using medical records data. Patient Edu- cation & Counseling. 2003;50:123-32.
20 Centers for Disease Control and Prevention. www.cdc.gov
21 Milligan R, Wingrove B, Richards L, et al. Percep- tions about prenatal care: views of urban vulnerable groups.” BMC Public Health. 2002;2(1):25
22 Poland M, Ager J and Sokol R. Prenatal care: a path (not taken) to improved perinatal outcome. Journal of Perinatal Medicine. 1991;19:427-433.
23 Gazmararian J, Arrington T, Bailey C, Schwarz K and Koplan J. Prenatal care for low-income women enrolled in a managed care organization. Obstetrics and Gynecology. 1999;94:177-184.

REFERENCES
MassHealth Managed Care HEDIS® 2005 Final Report Center for Health Policy and Research
6
24 Beckmann C, Buford T and Witt J. Perceived barriers to prenatal care services. American Jour- nal of Maternal/Child Nursing. 2000;25:43-46.
25 Sword W. A socio-ecological approach to under- standing barriers to prenatal care for women of low income. Journal of Advanced Nursing.1999;29:1170-1177.
26 Lu M and Prentice J. The postpartum visit: Risk factors for nonuse and association with breast feed- ing. American Journal of Obstetrics and Gynecol- ogy. 2002;187:1329-1336.
27 Himmelstein D and Woolhandler S. Care denied: US residents who are unable to obtain needed medical services. American Journal of Public Health. 1995;85:341-344.
28 Kinsman S and Slap G. Barriers to adolescent prenatal care. Society for Adolescent Medicine. 1992;13:146-154.
29 Maloni J, Cheng C, Liebl C and Maier J. Trans- forming prenatal care: reflections on the past and present with implications for the future. JOGNN. 1996;25:17-23.
30 Melnyk K. Barriers to care: operationalizing the variable. Nursing Research. 1990;39:108112.
31 Kinsman S and Slap G. Barriers to adolescent prenatal care. Society for Adolescent Medicine. 1992;13:146-154.
32 Maloni J, Cheng C, Liebl C and Maier J. Trans- forming prenatal care: reflections on the past and
present with implications for the future. JOGNN. 1996;25:17-23.
33 Melnyk K. Barriers to care: operationalizing the variable. Nursing Research. 1990;39:108112.
34 Millman M. Access to Health Care in America.Washington, DC: National Academy Press; 1993.
35 McGlynn E, Asch S, Adams J, et al. The quality of Health care delivered to adults. New England Journal of Medicine. 2003;348:2635-2645.
36 Phillips K, Mayer M and Aday L. Barriers to care among racial/ethnic groups under managed care. Health Affairs. 2000;19: 65-75.
37 Phillips K, Mayer M and Aday L. Barriers to care among racial/ethnic groups under managed care. Health Affairs. 2000;19: 65-75.
38 Phillips K, Mayer M and Aday L. Barriers to care among racial/ethnic groups under managed care. Health Affairs. 2000;19: 65-75.
39 Phillips K, Mayer M and Aday L. Barriers to care among racial/ethnic groups under managed care. Health Affairs. 2000;19: 65-75.
40 The Medicaid Access Study Group. Access of Medicaid recipients to outpatient care. 1994; 330: 1426-1430.
41 Pham H, Schrag D, Hargraves J and Bach P. Delivery of preventive services to oIder adults by primary care physicians. JAMA. 2005;294:473-481.
42 Phillips K, Mayer M and Aday L. Barriers to care among racial/ethnic groups under managed care. Health Affairs. 2000;19: 65-75.
43 Soyka L, Robinson D, Lanchant N and Monaco J. The misuse of antibiotics for treatment of upper respiratory infections in children. Pediatrics. 1975; 55:552-556.
44 Donwell S, Marcy S, Phillips W, et al. Principles of judicious use of antimicrobial agents for pediatric upper respiratory tract infections. Pediatrics.1998;101:163-184.
45 Nyquist A, Gonzales R, Steiner J, Sande M. Anti- biotic prescribing for children with colds, upper res- piratory infections, and bronchitis. JAMA.1998;279:875-877.
46 Smith R, McGlynn E, Elliott M, Krogstad P and Brook R. The relationship between perceived pa- rental expectations and pediatrician antimicrobial prescribing behavior. Pediatrics. 1999;103(4): 711- 718.
47 Smith R, McGlynn E, Elliott M, Krogstad P and Brook R. The relationship between perceived pa- rental expectations and pediatrician antimicrobial prescribing behavior. Pediatrics. 1999;103(4): 711-718.
48 Nyquist A, Gonzales R, Steiner J, Sande M. Anti- biotic prescribing for children with colds, upper res- piratory infections, and bronchitis. JAMA.1998;279:875-877.
49 Glezen W, Greenberg S, Atmar R, Piedra P, and Couch R. Impact of respiratory virus infections on

REFERENCES
MassHealth Managed Care HEDIS® 2005 Final Report Center for Health Policy and Research
7
persons with chronic underlying conditions. JAMA.2000;283(4):499-505.
50 Nash D, Harman J, Wald E, and Kelleher K. Anti- biotic prescribing by primary care physicians for children with upper respiratory tract Infections. Ar- chives of Pediatrics and Adolescent Medicine 2002;156:1114-1119.
51 Gaur A, Hare M and Shorr R. Provider and prac- tice characteristics associated with antibiotic use in children with presumed viral respiratory tract infec- tions.” Pediatrics. 2005;115:635-641.
52 Mainous A, Hueston and Love M. Antibiotics for colds in children: who are high prescribers? Ar- chives of Pediatric and Adolescent Medicine. 1998; 152:349-352.
53McCaig L, Besser R and Hughes J. Trends in antimicrobial prescribing rates for children and ado- lescents.” JAMA. 2002;287:3096-3102.
54 Stivers T, Mangione-Smith R, Elliot M, McDonald L and Heritage J. Why do physicians think parents expect antibiotics? What parents report vs. what physicians believe. Journal of Family Practice.2003;52(2):140-148.
55 Mangione-Smith R, McGlynn E, Elliott M, McDon- ald L, Franz C and Kravitz R. Parent expectations for antibiotics, physician-parent communication and satisfaction. Archives of Pediatric and Adolescent Medicine. 2001;155(7):800-806.
56 Fields L, Burt V, Cutler J, Hughes J, Roccella E and Sorlie P. The burden of adult hypertension in
the United States: 1999 to 2000. Hypertension. 2004;44:398-404.
57 Hajjar I and Kotchen T. Trends in prevalence, awareness, treatment, and control of hypertension in the United States, 1988-2000. JAMA.2003;290:199-206.
58 Neal B, MacMahon S, Chapman N. Effects of ACE Inhibitors, calcium antagonists, and other blood-pressure-lowering drugs: Results of prospec- tively designed interviews of randomized trials. Lan- cet. 200;356:1955-1964.
59 Hajjar I and Kotchen T. Trends in prevalence, awareness, treatment, and control of hypertension in the United States, 1988-2000. JAMA.2003;290:199-206.
60 Hajjar I and Kotchen T. Trends in prevalence, awareness, treatment, and control of hypertension in the United States, 1988-2000. JAMA.2003;290:199-206.
61 Hajjar I and Kotchen T. Trends in prevalence, awareness, treatment, and control of hypertension in the United States, 1988-2000. JAMA.2003;290:199-206.
62 U.S. Department of Health and Human Services. National Heart, Lung and Blood Institute. The Sev- enth Report of the Joint National Committee on Prevention, Detection, Evaluation and Treatment of High Blood Pressure. December 2003. NIH Publi- cation 03-5233.
63 U.S. Department of Health and Human Services. National Heart, Lung and Blood Institute. The Sev-
enth Report of the Joint National Committee on Prevention, Detection, Evaluation and Treatment of High Blood Pressure. December 2003. NIH Publi- cation 03-5233.
64 U.S. Department of Health and Human Services. National Heart, Lung and Blood Institute. The Sev- enth Report of the Joint National Committee on Prevention, Detection, Evaluation and Treatment of High Blood Pressure. December 2003. NIH Publi- cation 03-5233.
65 U.S. Department of Health and Human Services. National Heart, Lung and Blood Institute. The Sev- enth Report of the Joint National Committee on Prevention, Detection, Evaluation and Treatment of High Blood Pressure. December 2003. NIH Publi- cation 03-5233.
66 Knight E, Bohn R, Wang P, Glynn R, Mogun H and Avorn J. Predicators of Uncontrolled Hyperten- sion in Ambulatory Patients. Hypertension.2001;38:809-814.
67 French M, McGeart K, Chitwood D, McCoy C. Chronic illicit drug use, health services utilization and the cost of medical care. Social Science Medi- cine. 2000;50:1703-1713.
68 Aszalos R, McDuff D, Weintraub E, Montoya I, Schwartz R. Engaging hospitalized heroin depend- ent patients into substance abuse treatment. Jour- nal of Substance Abuse Treatment. 1999;19:149- 158.
69 Laine C, Hauck W, Gourevitch M, Rothman J, Cohen A and Turner B. Regular outpatient medical and drug abuse care and subsequent hospitaliza-

MassHealth Managed Care HEDIS® 2005 Final Report Center for Health Policy and Research
7
REFERENCES
tion of person who use illicit drug. 2001; 285(18): 2355-2362.
70 Barnett P. The cost-effectiveness of methadone maintenance as a health care intervention. Addic- tion. 1999;94:479-488.
71 Magura S, Horgan C, Mertens J and Shepard D. Effects of managed care on alcohol and other drug (AOD) treatment.” Alcoholism: Clinical and Experi- mental Research. 2002;26(3):416-422.
72 Weisner C, Mertens J, Tam T and Moore C. Fac- tors affecting the initiation of substance abuse treat- ment in managed care.” Addiction. 2001; 96:705- 716.
73 Magura S, Horgan C, Mertens J and Shepard D. Effects of managed care on alcohol and other drug (AOD) treatment.” Alcoholism: Clinical and Experi- mental Research. 2002;26(3):416-422.
74 Weisner C, Mertens J, Tam T and Moore C. Fac- tors affecting the initiation of substance abuse treat- ment in managed care.” Addiction. 2001; 96:705- 716.
75 Magura S, Horgan C, Mertens J and Shepard D. Effects of managed care on alcohol and other drug (AOD) treatment.” Alcoholism: Clinical and Experi- mental Research. 2002;26(3):416-422.
76 Kissen B. Medical management of alcoholic pa- tients. In: Kissen B, Beglieter H, eds. Treatment and rehabilitation of the chronic alcoholic. New York, NY: Plenum Publishing Co; 1997.
77 Katon W, Rutter C, Ludman E. A randomized trial of relapse prevention of depression in primary care. Archives of General Psychiatry. 2001;58:241-247.
78 Nelson E, Maruish M, Axler J. Effects of dis- charge planning and compliance with outpatient appointments on readmission rates. Psychiatric Services. 2000;51:885-889.
79 Nelson E, Maruish M, Axler J. Effects of dis- charge planning and compliance with outpatient appointments on readmission rates. Psychiatric Services. 2000;51:885-889.
80 Klinkenberg W, Calsyn R. Predictors of receipt of aftercare and recidivism among persons with se- vere mental illness: a review. Psychiatric Services. 1996;47:487-496.
81 Carpenter P, Morrow G, Del Gaudio A, et al. Who keeps the first outpatient appointment? Ameri- can Journal of Psychiatry. 1991;138:102-105.
82 Atwood N, Beck J. Service and patient predictors of continuation in clinic-based treatment. Hospital and Community Psychiatry. 1985;36:865-869.
83 Atwood N, Beck J. Service and patient predictors of continuation in clinic-based treatment. Hospital and Community Psychiatry. 1985;36:865-869.
84 Crawford M, de Jonge E, Freeman G and Weaver T. Providing continuity of care for people with severe mental illness. Social Psychiatry and Psychiatric Epidemiology. 2004;39:265-272.
85 Kruse G and Rohland B. Factors associated with attendance at a first appointment after discharge from a psychiatric hospital. Psychiatric Services 2002;53:473-476.
86 Boyer C, McAlpine D, Pottick J and Olfson M. Identifying risk factors and key strategies in linkage to outpatient psychiatric care. American Journal of Psychiatry. 2000;157:1592-1598.
87 Kruse G and Rohland B. Factors associated with attendance at a first appointment after discharge from a psychiatric hospital. Psychiatric Services 2002;53:473-476.
88 Olfson M, Mechanic D, Boyer C and Hansell S. Linking inpatients with schizophrenia to outpatient care. Psychiatric Services. 1998; 49: 911-917.
89 Boyer C, McAlpine D, Pottick J and Olfson M. Identifying risk factors and key strategies in linkage to outpatient psychiatric care. American Journal of Psychiatry. 2000;157:1592-1598.
90 Melfi C, Chawla A, Croghan T, Hanna M, Ken- nedy S and Sredl K. TheEffects of Adherence to Antidepressant Treatment Guidelines on Relapse and Recurrence of Depression. Archives of Gen- eral Psychiatry. 1998: 55: 1128-1132.
91 Kobak K, Taylor L, Katzelnick D, Olson N, Clag- naz P and Henk H. Antidepressant Medication Management and the Health Plan Employer Data Information Set (HEDIS) criteria: reasons for non- adherence. Journal of Clinical Psychiatry. 2002; 63:727-732.

REFERENCES
MassHealth Managed Care HEDIS® 2005 Final Report Center for Health Policy and Research
7
92 Kobak K, Taylor L, Katzelnick D, Olson N, Clag- naz P and Henk H. Antidepressant Medication Management and the Health Plan Employer Data Information Set (HEDIS) criteria: reasons for non- adherence. Journal of Clinical Psychiatry. 2002; 63:727-732.
93 Sleath B, Wurst K and Lowery T. Drug informa- tion sources and antidepressant adherence. Com- munity Mental Health Journal. 2003; 39:359-368.
94 Katon W, Rutter C, Ludman E. A randomized trial of relapse prevention of depression in primary care. Archives of General Psychiatry. 2001;58:241-247.
95 Unutzer J, Rubenstein L, Katon W, et al. Two- year effects of quality improvement programs on medication management for depression. Archives of General Psychiatry. 1996:53:924-932.
96 Simon G, Ludman E, Tutty S, Operskalski B and Korff M. Telephone psychotherapy and telephone care management for primary care patients starting antidepressant treatment: a randomized controlled trial. JAMA. 2004;292:935-942.