
Hedging or Speculating – Implications from different … or Speculating { Implications from di...
39
Hedging or Speculating – Implications from different CDS motives I˜ naki Aldasoro 1 Andreas Barth 2 1 Bank for International Settlements 2 Goethe University Frankfurt & ESRB Secretariat October 5, 2016 2016 RiskLab/BoF/ESRB Conference on Systemic Risk Analytics Disclaimer: views are our own and not those of our institutions of affiliation. 1/35
-
Upload
nguyenduong -
Category
Documents
-
view
219 -
download
0
Transcript of Hedging or Speculating – Implications from different … or Speculating { Implications from di...
Hedging or Speculating – Implications fromdifferent CDS motives
Inaki Aldasoro1 Andreas Barth2
1Bank for International Settlements
2Goethe University Frankfurt & ESRB Secretariat
October 5, 2016
2016 RiskLab/BoF/ESRB Conference on Systemic Risk Analytics
Disclaimer: views are our own and not those of our institutions of affiliation.
1/35
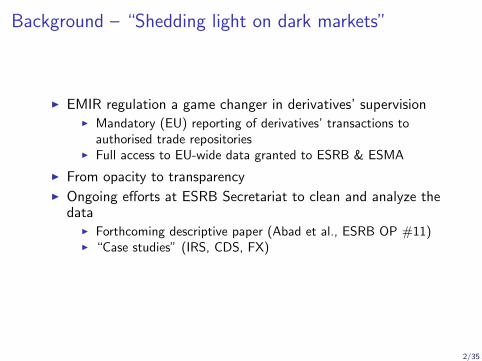
Background – “Shedding light on dark markets”
I EMIR regulation a game changer in derivatives’ supervisionI Mandatory (EU) reporting of derivatives’ transactions to
authorised trade repositoriesI Full access to EU-wide data granted to ESRB & ESMA
I From opacity to transparencyI Ongoing efforts at ESRB Secretariat to clean and analyze the
dataI Forthcoming descriptive paper (Abad et al., ESRB OP #11)I “Case studies” (IRS, CDS, FX)
2/35
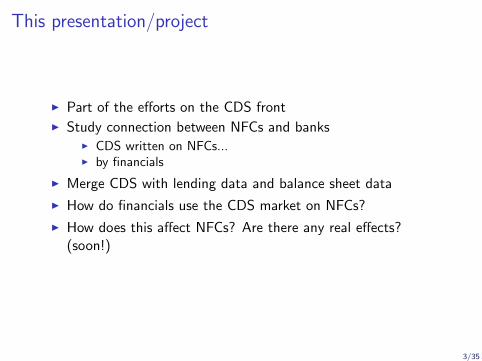
This presentation/project
I Part of the efforts on the CDS frontI Study connection between NFCs and banks
I CDS written on NFCs...I by financials
I Merge CDS with lending data and balance sheet data
I How do financials use the CDS market on NFCs?
I How does this affect NFCs? Are there any real effects?(soon!)
3/35
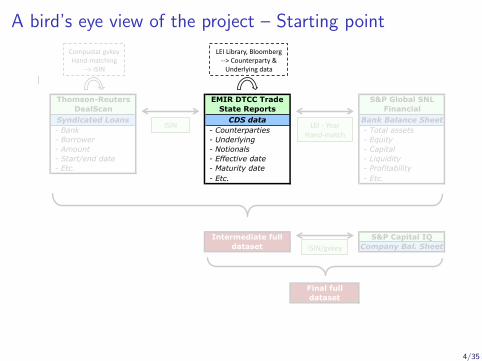
A bird’s eye view of the project – Starting point
Thomson-Reuters DealScan
EMIR DTCC Trade State Reports
S&P Global SNL Financial
Syndicated Loans CDS data Bank Balance Sheet - Bank - Counterparties - Total assets - Borrower - Underlying - Equity - Amount - Notionals - Capital - Start/end date - Effective date - Liquidity - Etc. - Maturity date - Profitability
- Etc. - Etc.
S&P Capital IQCompany Bal. Sheet
Intermediate full dataset
Final full dataset
ISIN
CompustatgvkeyHand-matching
-->ISIN
LEILibrary,Bloomberg-->Counterparty&Underlyingdata
LEI-YearHand-match
ISIN/gvkey
4/35
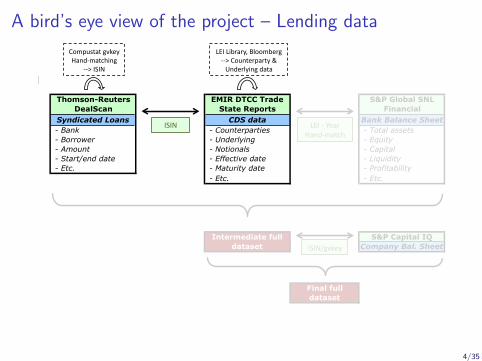
A bird’s eye view of the project – Lending data
Thomson-Reuters DealScan
EMIR DTCC Trade State Reports
S&P Global SNL Financial
Syndicated Loans CDS data Bank Balance Sheet - Bank - Counterparties - Total assets - Borrower - Underlying - Equity - Amount - Notionals - Capital - Start/end date - Effective date - Liquidity - Etc. - Maturity date - Profitability
- Etc. - Etc.
S&P Capital IQCompany Bal. Sheet
Intermediate full dataset
Final full dataset
ISIN
CompustatgvkeyHand-matching
-->ISIN
LEILibrary,Bloomberg-->Counterparty&Underlyingdata
LEI-YearHand-match
ISIN/gvkey
4/35
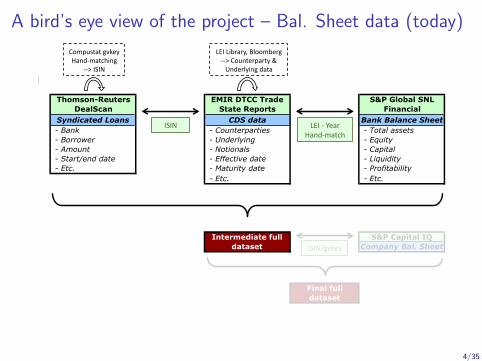
A bird’s eye view of the project – Bal. Sheet data (today)
Thomson-Reuters DealScan
EMIR DTCC Trade State Reports
S&P Global SNL Financial
Syndicated Loans CDS data Bank Balance Sheet - Bank - Counterparties - Total assets - Borrower - Underlying - Equity - Amount - Notionals - Capital - Start/end date - Effective date - Liquidity - Etc. - Maturity date - Profitability
- Etc. - Etc.
S&P Capital IQCompany Bal. Sheet
Intermediate full dataset
Final full dataset
ISIN
CompustatgvkeyHand-matching
-->ISIN
LEILibrary,Bloomberg-->Counterparty&Underlyingdata
LEI-YearHand-match
ISIN/gvkey
4/35
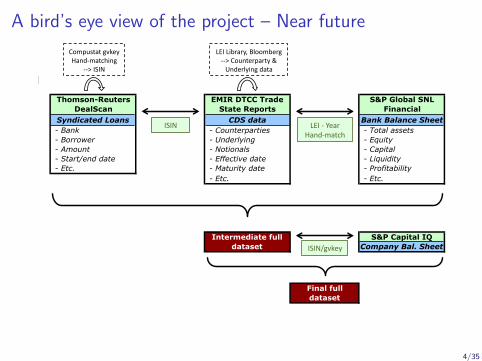
A bird’s eye view of the project – Near future
Thomson-Reuters DealScan
EMIR DTCC Trade State Reports
S&P Global SNL Financial
Syndicated Loans CDS data Bank Balance Sheet - Bank - Counterparties - Total assets - Borrower - Underlying - Equity - Amount - Notionals - Capital - Start/end date - Effective date - Liquidity - Etc. - Maturity date - Profitability
- Etc. - Etc.
S&P Capital IQCompany Bal. Sheet
Intermediate full dataset
Final full dataset
ISIN
CompustatgvkeyHand-matching
-->ISIN
LEILibrary,Bloomberg-->Counterparty&Underlyingdata
LEI-YearHand-match
ISIN/gvkey
4/35
Outline
Related literature
Data
Empirical approach
Results
Future outlook
Conclusions
5/35
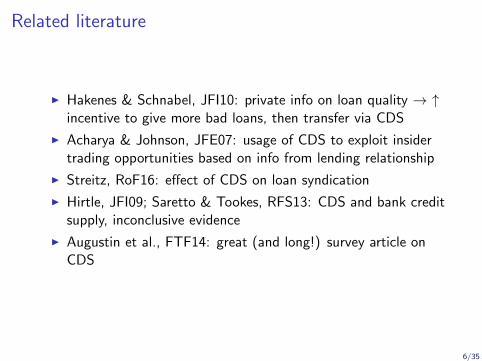
Related literature
I Hakenes & Schnabel, JFI10: private info on loan quality → ↑incentive to give more bad loans, then transfer via CDS
I Acharya & Johnson, JFE07: usage of CDS to exploit insidertrading opportunities based on info from lending relationship
I Streitz, RoF16: effect of CDS on loan syndication
I Hirtle, JFI09; Saretto & Tookes, RFS13: CDS and bank creditsupply, inconclusive evidence
I Augustin et al., FTF14: great (and long!) survey article onCDS
6/35
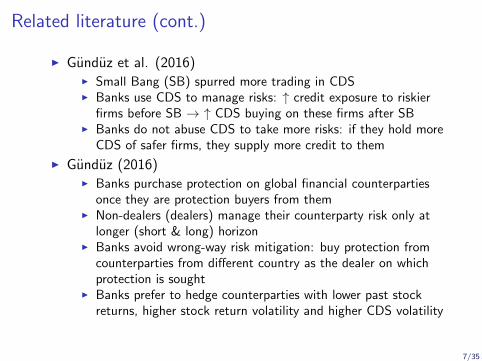
Related literature (cont.)
I Gunduz et al. (2016)I Small Bang (SB) spurred more trading in CDSI Banks use CDS to manage risks: ↑ credit exposure to riskier
firms before SB → ↑ CDS buying on these firms after SBI Banks do not abuse CDS to take more risks: if they hold more
CDS of safer firms, they supply more credit to them
I Gunduz (2016)I Banks purchase protection on global financial counterparties
once they are protection buyers from themI Non-dealers (dealers) manage their counterparty risk only at
longer (short & long) horizonI Banks avoid wrong-way risk mitigation: buy protection from
counterparties from different country as the dealer on whichprotection is sought
I Banks prefer to hedge counterparties with lower past stockreturns, higher stock return volatility and higher CDS volatility
7/35
Dealscan data – Syndicated loans
I Comprehensive information on loan pricing and contractdetails:
I BorrowerI LenderI Facility start/end dateI Facility amount
I Use loans with “facility end date” > Jan 2013
8/35
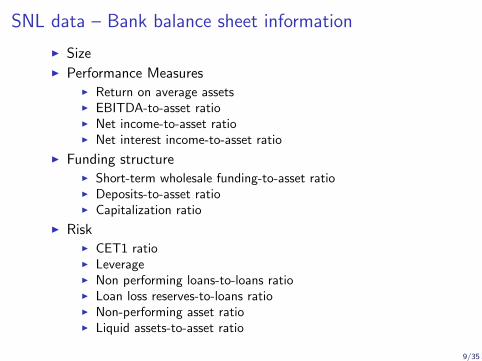
SNL data – Bank balance sheet information
I SizeI Performance Measures
I Return on average assetsI EBITDA-to-asset ratioI Net income-to-asset ratioI Net interest income-to-asset ratio
I Funding structureI Short-term wholesale funding-to-asset ratioI Deposits-to-asset ratioI Capitalization ratio
I RiskI CET1 ratioI LeverageI Non performing loans-to-loans ratioI Loan loss reserves-to-loans ratioI Non-performing asset ratioI Liquid assets-to-asset ratio
9/35
Overview of CDS data
I DTCC OTC Trade State Reports (the “EMIR data”)→ stock of all outstanding positions as of a given date
I Use information on who, what, whenI Counterparties (LEIs), their types and countries (use LEI
library)I Underlying reference entities (ISINs, mix with Bloomberg)I Notional amounts (convert to e)I PricesI Effective and maturity datesI Etc.
10/35
Overview of CDS data (cont.)
I Cleaning procedure to eliminateI OutliersI “Dead trades”I Inconsistent observations (based on double reporting
obligation)I Duplicates (trade IDs)I Mis-reported counterparties, reference entities, etc.
I Focus on single-name market
I End-of-month snapshots from Oct-14 to Apr-16
11/35
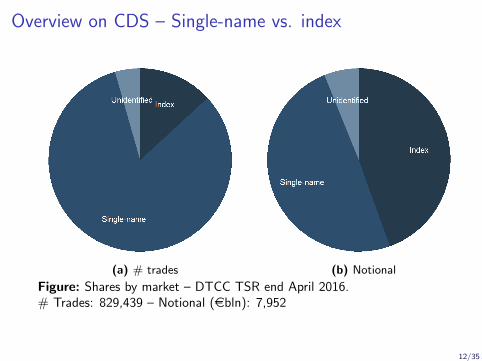
Overview on CDS – Single-name vs. index
(a) # trades (b) Notional
Figure: Shares by market – DTCC TSR end April 2016.# Trades: 829,439 – Notional (ebln): 7,952
12/35
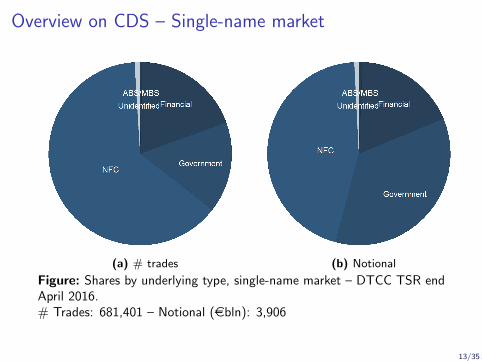
Overview on CDS – Single-name market
(a) # trades (b) Notional
Figure: Shares by underlying type, single-name market – DTCC TSR endApril 2016.# Trades: 681,401 – Notional (ebln): 3,906
13/35
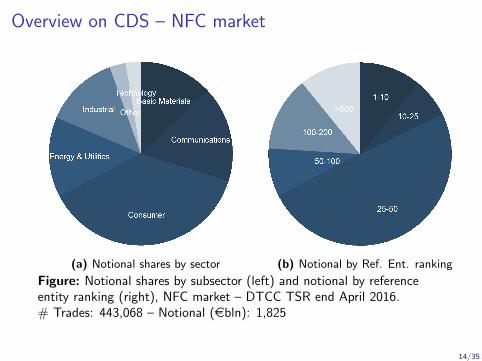
Overview on CDS – NFC market
(a) Notional shares by sector (b) Notional by Ref. Ent. ranking
Figure: Notional shares by subsector (left) and notional by referenceentity ranking (right), NFC market – DTCC TSR end April 2016.# Trades: 443,068 – Notional (ebln): 1,825
14/35
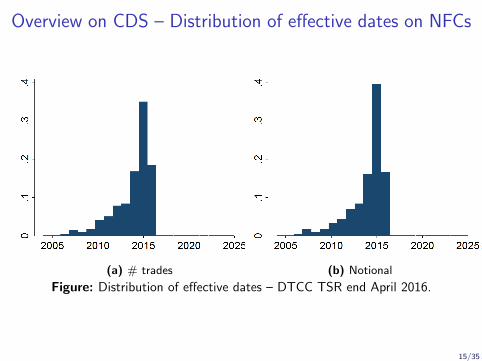
Overview on CDS – Distribution of effective dates on NFCs
(a) # trades (b) Notional
Figure: Distribution of effective dates – DTCC TSR end April 2016.
15/35
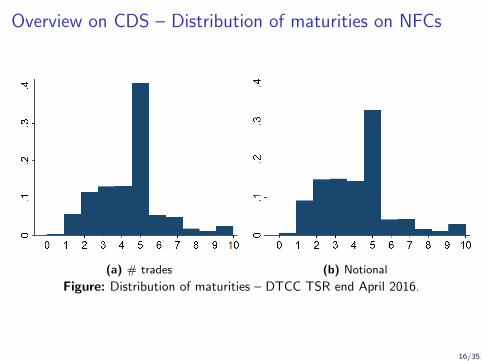
Overview on CDS – Distribution of maturities on NFCs
(a) # trades (b) Notional
Figure: Distribution of maturities – DTCC TSR end April 2016.
16/35
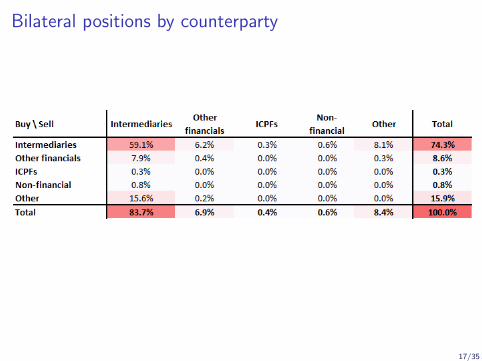
Bilateral positions by counterparty
17/35
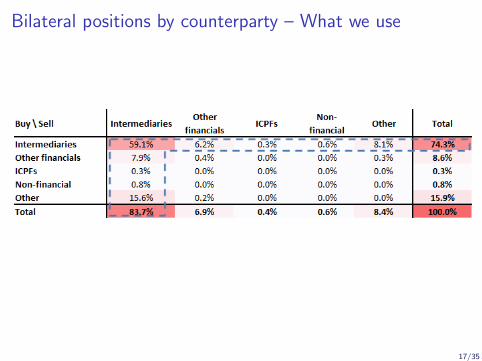
Bilateral positions by counterparty – What we use
17/35
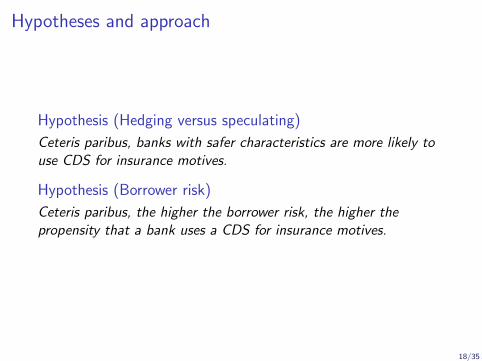
Hypotheses and approach
Hypothesis (Hedging versus speculating)
Ceteris paribus, banks with safer characteristics are more likely touse CDS for insurance motives.
Hypothesis (Borrower risk)
Ceteris paribus, the higher the borrower risk, the higher thepropensity that a bank uses a CDS for insurance motives.
18/35
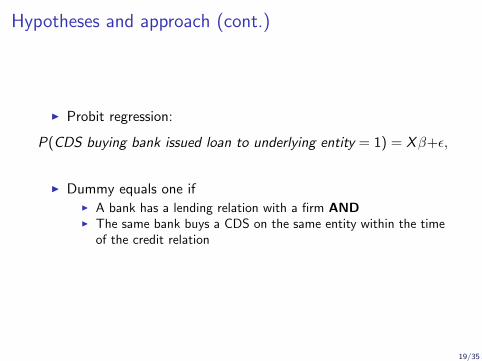
Hypotheses and approach (cont.)
I Probit regression:
P(CDS buying bank issued loan to underlying entity = 1) = Xβ+ε,
I Dummy equals one ifI A bank has a lending relation with a firm ANDI The same bank buys a CDS on the same entity within the time
of the credit relation
19/35
Hypotheses and approach (cont.)
Hypothesis (Lending Behavior)
Ceteris paribus, banks that buy CDS are less likely to have abinding capital constraint and should issue more loans.
Hypothesis (Lending Behavior)
Ceteris paribus, banks that are net buyers of CDS are less likely tohave a binding capital constraint and should issue more loans.
20/35
Hypothesis and approach (cont.)
I OLS regression:
LoanVolumei ,t = α + β · NotionalBuyi ,t + γ · Xi ,t + µi + ρt + ui ,t .
LoanVolumei ,t = α + β · NetNotionali ,t + γ · Xi ,t + µi + ρt + ui ,t .
I LoanVolume is measured by loan volume of bank i on thesyndicated loan market
I Alternatively, use TotalAssets as LHS variable
21/35
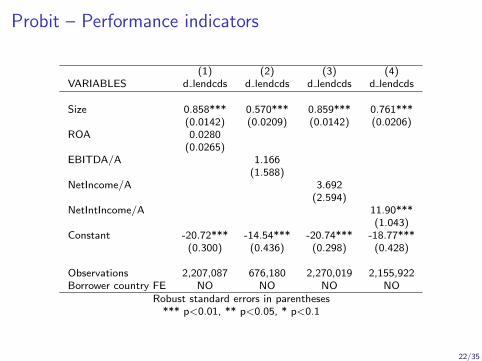
Probit – Performance indicators
(1) (2) (3) (4)VARIABLES d lendcds d lendcds d lendcds d lendcds
Size 0.858*** 0.570*** 0.859*** 0.761***(0.0142) (0.0209) (0.0142) (0.0206)
ROA 0.0280(0.0265)
EBITDA/A 1.166(1.588)
NetIncome/A 3.692(2.594)
NetIntIncome/A 11.90***(1.043)
Constant -20.72*** -14.54*** -20.74*** -18.77***(0.300) (0.436) (0.298) (0.428)
Observations 2,207,087 676,180 2,270,019 2,155,922Borrower country FE NO NO NO NO
Robust standard errors in parentheses*** p<0.01, ** p<0.05, * p<0.1
22/35

Probit – Performance indicators with controls
(1) (2) (3) (4)VARIABLES d lendcds d lendcds d lendcds d lendcds
Size 0.856*** 0.670*** 0.857*** 0.781***(0.0154) (0.0237) (0.0153) (0.0214)
ROA 0.0476*(0.0285)
EBITDA/A 0.455(1.779)
NetIncome/A 5.689**(2.793)
NetIntIncome/A 9.771***(1.095)
Loan size 0.0358*** 0.0496*** 0.0345*** 0.0351***(0.00317) (0.00395) (0.00313) (0.00313)
CDS price 3.19e-05*** 4.74e-05*** 3.12e-05*** 3.30e-05***(6.55e-06) (7.52e-06) (6.54e-06) (6.42e-06)
Constant -21.17*** -17.33*** -21.17*** -19.65***(0.372) (0.538) (0.369) (0.481)
Observations 1,907,595 640,185 1,968,018 1,858,052Borrower country FE YES YES YES YES
Robust standard errors in parentheses*** p<0.01, ** p<0.05, * p<0.1
23/35
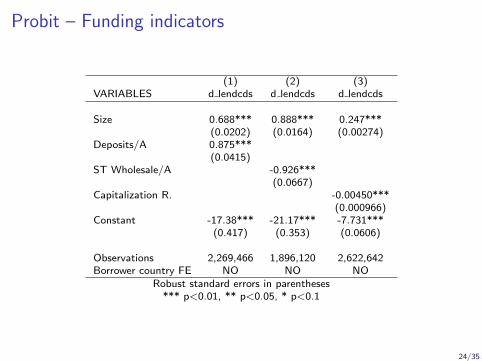
Probit – Funding indicators
(1) (2) (3)VARIABLES d lendcds d lendcds d lendcds
Size 0.688*** 0.888*** 0.247***(0.0202) (0.0164) (0.00274)
Deposits/A 0.875***(0.0415)
ST Wholesale/A -0.926***(0.0667)
Capitalization R. -0.00450***(0.000966)
Constant -17.38*** -21.17*** -7.731***(0.417) (0.353) (0.0606)
Observations 2,269,466 1,896,120 2,622,642Borrower country FE NO NO NO
Robust standard errors in parentheses*** p<0.01, ** p<0.05, * p<0.1
24/35
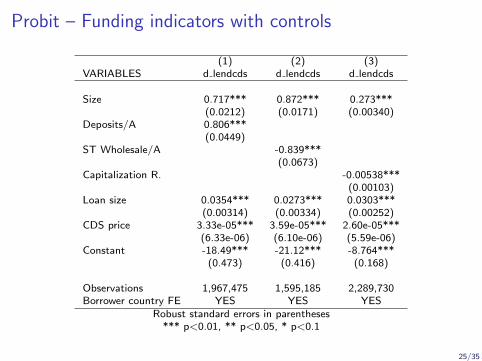
Probit – Funding indicators with controls
(1) (2) (3)VARIABLES d lendcds d lendcds d lendcds
Size 0.717*** 0.872*** 0.273***(0.0212) (0.0171) (0.00340)
Deposits/A 0.806***(0.0449)
ST Wholesale/A -0.839***(0.0673)
Capitalization R. -0.00538***(0.00103)
Loan size 0.0354*** 0.0273*** 0.0303***(0.00314) (0.00334) (0.00252)
CDS price 3.33e-05*** 3.59e-05*** 2.60e-05***(6.33e-06) (6.10e-06) (5.59e-06)
Constant -18.49*** -21.12*** -8.764***(0.473) (0.416) (0.168)
Observations 1,967,475 1,595,185 2,289,730Borrower country FE YES YES YES
Robust standard errors in parentheses*** p<0.01, ** p<0.05, * p<0.1
25/35
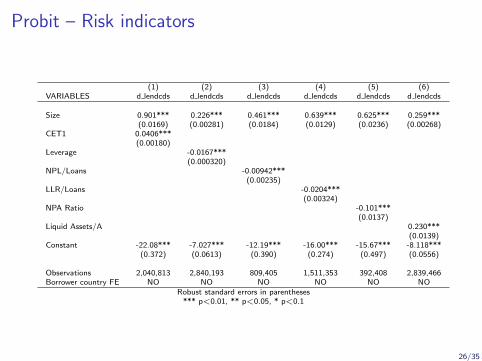
Probit – Risk indicators
(1) (2) (3) (4) (5) (6)VARIABLES d lendcds d lendcds d lendcds d lendcds d lendcds d lendcds
Size 0.901*** 0.226*** 0.461*** 0.639*** 0.625*** 0.259***(0.0169) (0.00281) (0.0184) (0.0129) (0.0236) (0.00268)
CET1 0.0406***(0.00180)
Leverage -0.0167***(0.000320)
NPL/Loans -0.00942***(0.00235)
LLR/Loans -0.0204***(0.00324)
NPA Ratio -0.101***(0.0137)
Liquid Assets/A 0.230***(0.0139)
Constant -22.08*** -7.027*** -12.19*** -16.00*** -15.67*** -8.118***(0.372) (0.0613) (0.390) (0.274) (0.497) (0.0556)
Observations 2,040,813 2,840,193 809,405 1,511,353 392,408 2,839,466Borrower country FE NO NO NO NO NO NO
Robust standard errors in parentheses*** p<0.01, ** p<0.05, * p<0.1
26/35
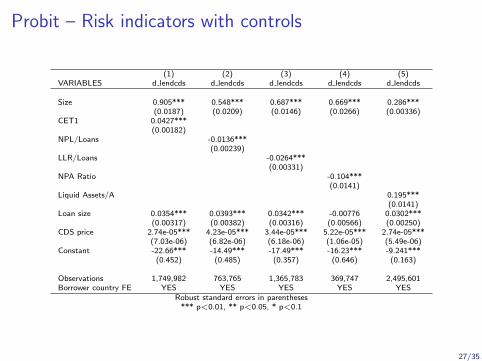
Probit – Risk indicators with controls
(1) (2) (3) (4) (5)VARIABLES d lendcds d lendcds d lendcds d lendcds d lendcds
Size 0.905*** 0.548*** 0.687*** 0.669*** 0.286***(0.0187) (0.0209) (0.0146) (0.0266) (0.00336)
CET1 0.0427***(0.00182)
NPL/Loans -0.0136***(0.00239)
LLR/Loans -0.0264***(0.00331)
NPA Ratio -0.104***(0.0141)
Liquid Assets/A 0.195***(0.0141)
Loan size 0.0354*** 0.0393*** 0.0342*** -0.00776 0.0302***(0.00317) (0.00382) (0.00316) (0.00566) (0.00250)
CDS price 2.74e-05*** 4.23e-05*** 3.44e-05*** 5.22e-05*** 2.74e-05***(7.03e-06) (6.82e-06) (6.18e-06) (1.06e-05) (5.49e-06)
Constant -22.66*** -14.49*** -17.49*** -16.23*** -9.241***(0.452) (0.485) (0.357) (0.646) (0.163)
Observations 1,749,982 763,765 1,365,783 369,747 2,495,601Borrower country FE YES YES YES YES YES
Robust standard errors in parentheses*** p<0.01, ** p<0.05, * p<0.1
27/35
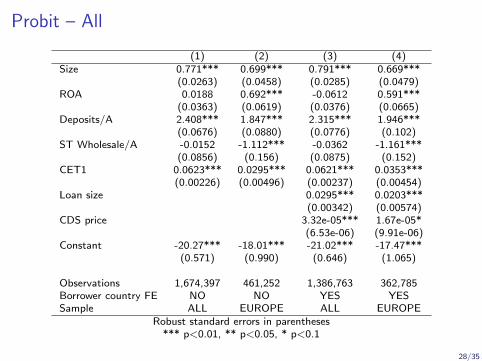
Probit – All
(1) (2) (3) (4)Size 0.771*** 0.699*** 0.791*** 0.669***
(0.0263) (0.0458) (0.0285) (0.0479)ROA 0.0188 0.692*** -0.0612 0.591***
(0.0363) (0.0619) (0.0376) (0.0665)Deposits/A 2.408*** 1.847*** 2.315*** 1.946***
(0.0676) (0.0880) (0.0776) (0.102)ST Wholesale/A -0.0152 -1.112*** -0.0362 -1.161***
(0.0856) (0.156) (0.0875) (0.152)CET1 0.0623*** 0.0295*** 0.0621*** 0.0353***
(0.00226) (0.00496) (0.00237) (0.00454)Loan size 0.0295*** 0.0203***
(0.00342) (0.00574)CDS price 3.32e-05*** 1.67e-05*
(6.53e-06) (9.91e-06)Constant -20.27*** -18.01*** -21.02*** -17.47***
(0.571) (0.990) (0.646) (1.065)
Observations 1,674,397 461,252 1,386,763 362,785Borrower country FE NO NO YES YESSample ALL EUROPE ALL EUROPE
Robust standard errors in parentheses*** p<0.01, ** p<0.05, * p<0.1
28/35
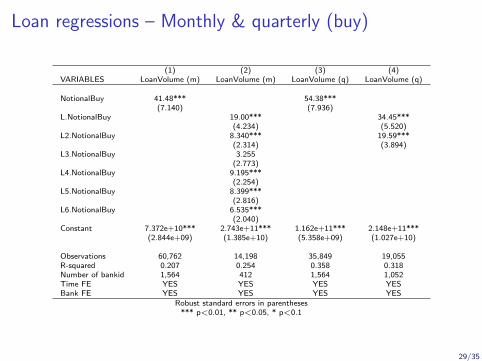
Loan regressions – Monthly & quarterly (buy)
(1) (2) (3) (4)VARIABLES LoanVolume (m) LoanVolume (m) LoanVolume (q) LoanVolume (q)
NotionalBuy 41.48*** 54.38***(7.140) (7.936)
L.NotionalBuy 19.00*** 34.45***(4.234) (5.520)
L2.NotionalBuy 8.340*** 19.59***(2.314) (3.894)
L3.NotionalBuy 3.255(2.773)
L4.NotionalBuy 9.195***(2.254)
L5.NotionalBuy 8.399***(2.816)
L6.NotionalBuy 6.535***(2.040)
Constant 7.372e+10*** 2.743e+11*** 1.162e+11*** 2.148e+11***(2.844e+09) (1.385e+10) (5.358e+09) (1.027e+10)
Observations 60,762 14,198 35,849 19,055R-squared 0.207 0.254 0.358 0.318Number of bankid 1,564 412 1,564 1,052Time FE YES YES YES YESBank FE YES YES YES YES
Robust standard errors in parentheses*** p<0.01, ** p<0.05, * p<0.1
29/35
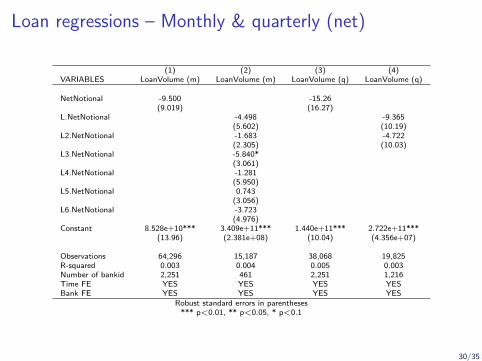
Loan regressions – Monthly & quarterly (net)
(1) (2) (3) (4)VARIABLES LoanVolume (m) LoanVolume (m) LoanVolume (q) LoanVolume (q)
NetNotional -9.500 -15.26(9.019) (16.27)
L.NetNotional -4.498 -9.365(5.602) (10.19)
L2.NetNotional -1.683 -4.722(2.305) (10.03)
L3.NetNotional -5.840*(3.061)
L4.NetNotional -1.281(5.950)
L5.NetNotional 0.743(3.056)
L6.NetNotional -3.723(4.976)
Constant 8.528e+10*** 3.409e+11*** 1.440e+11*** 2.722e+11***(13.96) (2.381e+08) (10.04) (4.356e+07)
Observations 64,296 15,187 38,068 19,825R-squared 0.003 0.004 0.005 0.003Number of bankid 2,251 461 2,251 1,216Time FE YES YES YES YESBank FE YES YES YES YES
Robust standard errors in parentheses*** p<0.01, ** p<0.05, * p<0.1
30/35
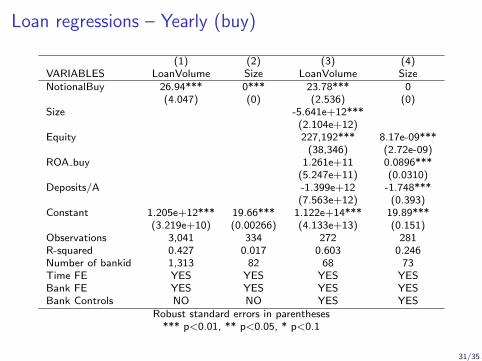
Loan regressions – Yearly (buy)
(1) (2) (3) (4)VARIABLES LoanVolume Size LoanVolume SizeNotionalBuy 26.94*** 0*** 23.78*** 0
(4.047) (0) (2.536) (0)Size -5.641e+12***
(2.104e+12)Equity 227,192*** 8.17e-09***
(38,346) (2.72e-09)ROA buy 1.261e+11 0.0896***
(5.247e+11) (0.0310)Deposits/A -1.399e+12 -1.748***
(7.563e+12) (0.393)Constant 1.205e+12*** 19.66*** 1.122e+14*** 19.89***
(3.219e+10) (0.00266) (4.133e+13) (0.151)Observations 3,041 334 272 281R-squared 0.427 0.017 0.603 0.246Number of bankid 1,313 82 68 73Time FE YES YES YES YESBank FE YES YES YES YESBank Controls NO NO YES YES
Robust standard errors in parentheses*** p<0.01, ** p<0.05, * p<0.1
31/35
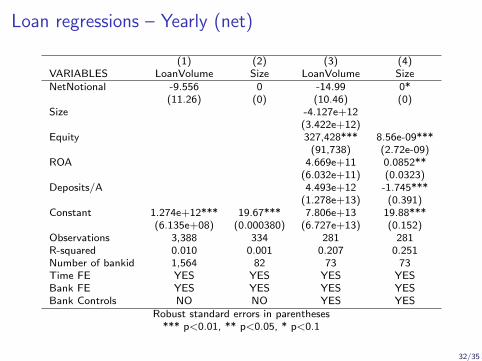
Loan regressions – Yearly (net)
(1) (2) (3) (4)VARIABLES LoanVolume Size LoanVolume SizeNetNotional -9.556 0 -14.99 0*
(11.26) (0) (10.46) (0)Size -4.127e+12
(3.422e+12)Equity 327,428*** 8.56e-09***
(91,738) (2.72e-09)ROA 4.669e+11 0.0852**
(6.032e+11) (0.0323)Deposits/A 4.493e+12 -1.745***
(1.278e+13) (0.391)Constant 1.274e+12*** 19.67*** 7.806e+13 19.88***
(6.135e+08) (0.000380) (6.727e+13) (0.152)Observations 3,388 334 281 281R-squared 0.010 0.001 0.207 0.251Number of bankid 1,564 82 73 73Time FE YES YES YES YESBank FE YES YES YES YESBank Controls NO NO YES YES
Robust standard errors in parentheses*** p<0.01, ** p<0.05, * p<0.1
32/35
Future outlook
I Distinguish CDS buying at the beginning of the credit relationversus CDS buying during the credit relation (i.e. CDS buyingdue to new information)
I Loan size (as a continuous measure) instead of a dummyregression
I Different maturities of CDS for different motives?
I Do banks hedge before the credit relation takes place?
I Do banks buy CDS via their SPVs?
33/35
Conclusions
I Some evidence on correlation between bank characteristicsand hedging motives, stronger for risk → the lower the riskthe higher the propensity to use CDS for hedging
I Preliminary evidence that credit protection buying releasesspace for more lending
I But, more refinements needed
I No evidence so far of net CDS positions on lendingI But: average effect. For near future: distinguish between
different borrower characteristics
34/35