Hedging in Energy: The Case of LINN Energy, LLC
28
University of Arkansas, Fayeeville ScholarWorks@UARK Finance Undergraduate Honors eses Finance 5-2016 Hedging in Energy: e Case of LINN Energy, LLC Riley E. Nelson University of Arkansas Follow this and additional works at: hp://scholarworks.uark.edu/finnuht Part of the Corporate Finance Commons , and the Finance and Financial Management Commons is esis is brought to you for free and open access by the Finance at ScholarWorks@UARK. It has been accepted for inclusion in Finance Undergraduate Honors eses by an authorized administrator of ScholarWorks@UARK. For more information, please contact [email protected], [email protected]. Recommended Citation Nelson, Riley E., "Hedging in Energy: e Case of LINN Energy, LLC" (2016). Finance Undergraduate Honors eses. 25. hp://scholarworks.uark.edu/finnuht/25
Transcript of Hedging in Energy: The Case of LINN Energy, LLC
University of Arkansas, FayettevilleScholarWorks@UARK
Finance Undergraduate Honors Theses Finance
5-2016
Hedging in Energy: The Case of LINN Energy,LLCRiley E. NelsonUniversity of Arkansas
Follow this and additional works at: http://scholarworks.uark.edu/finnuht
Part of the Corporate Finance Commons, and the Finance and Financial Management Commons
This Thesis is brought to you for free and open access by the Finance at ScholarWorks@UARK. It has been accepted for inclusion in FinanceUndergraduate Honors Theses by an authorized administrator of ScholarWorks@UARK. For more information, please contact [email protected],[email protected].
Recommended CitationNelson, Riley E., "Hedging in Energy: The Case of LINN Energy, LLC" (2016). Finance Undergraduate Honors Theses. 25.http://scholarworks.uark.edu/finnuht/25

1
Hedging in Energy: The Case of LINN Energy, LLC
An Honors thesis submitted in partial fulfillment of the requirements for the degree of BSBA, Finance
by
Riley Nelson
University of Arkansas, Fayetteville
BSBA Finance, 2016
Advisor: Craig G. Rennie, Ph.D., ERP
This report is prepared for educational purposes and for the Sam M. Walton College of Business at the
University of Arkansas. It is in no way a solicitation to buy or sell securities, and no guarantee or
warranties about the information contained in it are implied.

2
Executive Summary:
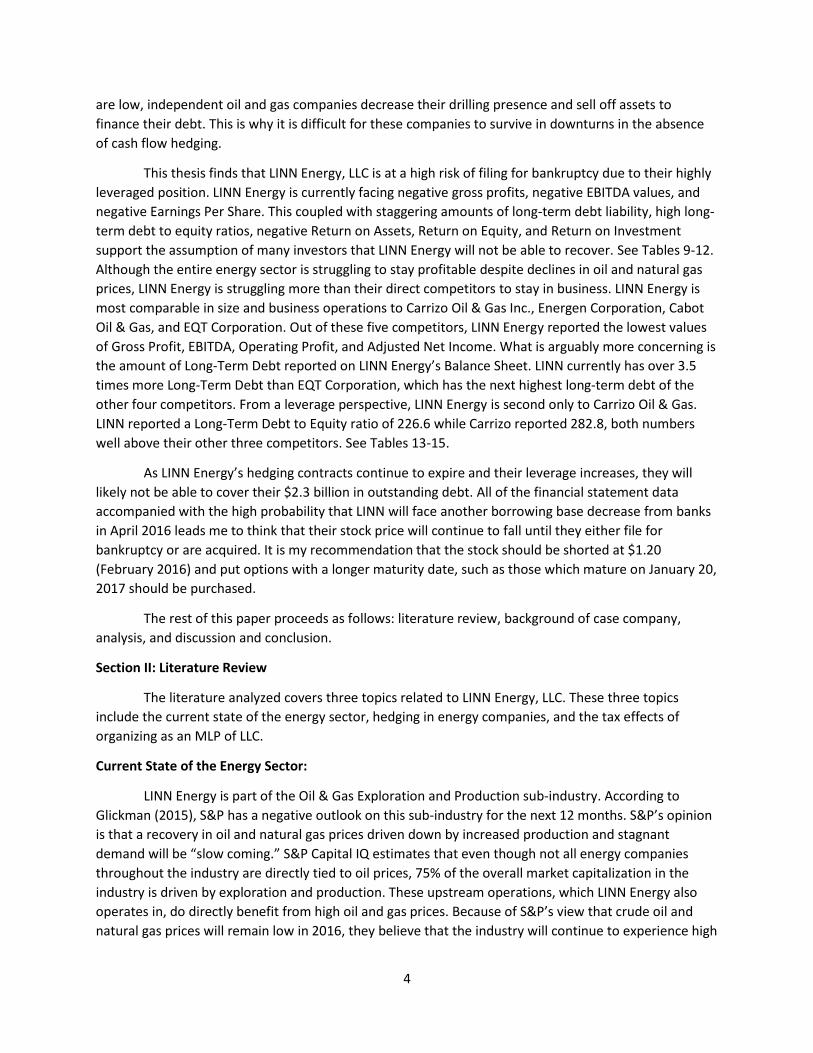
This paper is a case study of LINN Energy, LLC over the period of Q1 2013 to Q4 2015. Due to
volatility in commodity prices, energy companies choose to hedge their future production using
forwards, futures, swaps, and options strategies. I selected LINN Energy as the subject for this study due
to the breadth of detailed historical hedging information available through the company’s website. LINN
Energy disclosed much more than is required for independent oil and gas companies, making them the
perfect case study for this thesis. LINN Energy, LLC is one of the few publicly traded LLC’s and is based
out of Houston, Texas. They operate domestically and, due to a combination of the current downturn in
the energy market and expiring hedge contracts, will likely be facing Chapter 11 bankruptcy within the
next year.
Section I: Introduction
Motivation:
Fluctuations in oil and natural gas commodity prices expose energy companies to a large degree
of risk. Commodity price forecasts are the basis on which the drilling of wells are made. Once a
commercial well is producing, it can have a related payback period of up to several years. Energy
companies reduce the risk of volatile oil and gas prices by hedging their production. The current
environment has seen staggering decreases in the prices of West Texas Intermediate, Henry Hub Natural
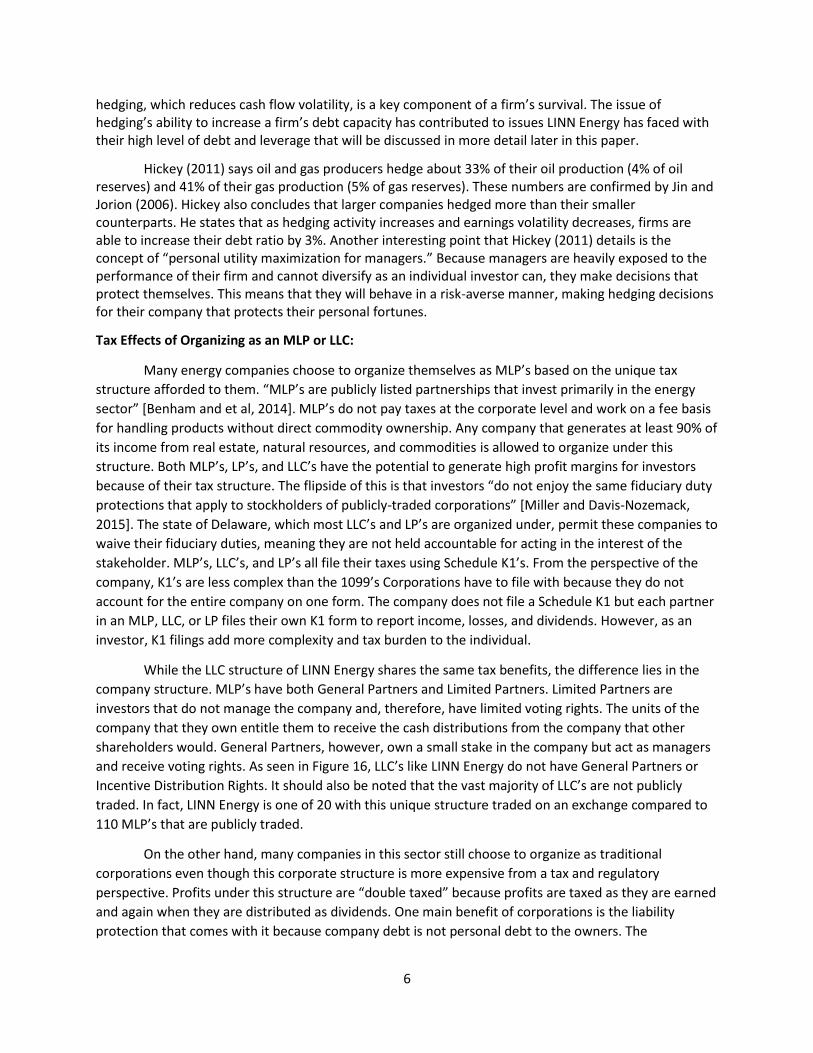
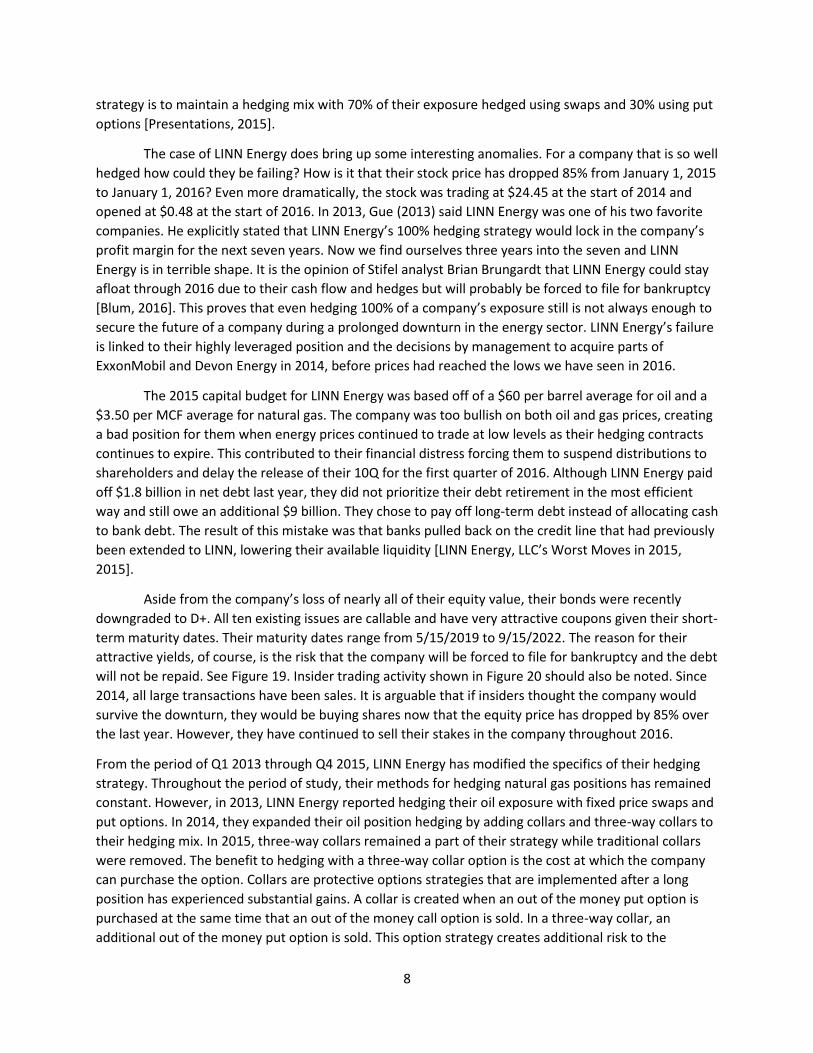
Gas, and Natural Gas Liquids. Figures 1-8 show each one’s historical price data from January 2013 to
present, price projections provided by the Energy Information Administration, and lines of best fit for
the data provided. Data in these charts contribute to the notion that oil and natural gas prices may not
begin to recover until 2017. Changes in oil and gas prices and their effect on the performance of energy
companies is an important topic to research because of the recent volatility we have seen, not just in
the energy sector, but throughout the entire stock market. CNN Money recently argued that the United
States stock market is no longer trading on fundamentals and has become surprisingly correlated with
declining energy stocks. When oil prices dropped to $26 per barrel, the S&P 500 followed, dropping to
its lowest level since April 2014. The same was seen when prices moved in the opposite direction. When
oil prices increased by 23% over the course of one week in January, stocks were carried “sharply higher.”
CNN Money’s analysis found that “the S&P 500 is now almost perfectly correlated to the price of oil”
even though the energy sector only accounts for 6.53% of the index [Egan, 2016]. Theoretically, if oil and
gas producers are able to hedge their cash flows far enough into the future to withstand downturns,
their equity prices would not suffer to the extent that we have seen when oil and gas prices decrease.
Independent oil and gas companies, like LINN Energy, protect themselves from commodity risk
through the practice of hedging made possible by imperfect capital markets. Independent oil and gas
companies are defined as non-integrated companies that receive almost all of their cash flows from
drilling operations. They are exclusively in the exploration and production segment of the energy sector.
Hedging is performed in independent oil and gas companies in order to avoid financial distress at the
company level and avoid underinvestment problems. Underinvestment problems occur when
companies do not invest in low-risk projects. Instead, they elect to take on riskier projects in order to
maximize returns in the interest of the shareholders. When this occurs, debt holders are not
compensated for taking additional risk.

3
Two types of commodity risk that independent oil and gas companies encounter include price
risk and basis risk. Commodity price risk refers to the risk that an input such as crude oil will narrow a
company’s profit margin, making it more difficult for independent oil and gas companies to budget
appropriately. This is why futures, forwards, swaps, and options are so commonly used to lock in a price
at which the future good will be purchased or sold. Commodity basis risk “occurs when spot price and
the futures price do not converge when the futures contract expires.” Basis, in this case, is defined as
the cash price less the futures price. There are other types of basis risk including time, location, and
form. By hedging with forward contracts, futures, swaps, or options, energy companies are able to lock
in the future price at which they will be able to sell the underlying asset or exchange cash flows,
effectively lowering cash flow volatility. Forward contracts are agreements to buy or sell an asset at a
specified price and future date. Futures contracts are also agreements to buy or sell an asset at a
specified price and future date. The difference between the two is that futures contracts are more
standardized and are traded on exchanges. Swaps are derivative contracts that are not traded on
exchanges in which two financial instruments are exchanged. Options, on the other hand, are
derivatives of securities that are traded on exchanges. Option contracts provide the buyer of the
security with the right, but not the obligation, to buy or sell the underlying security at a specified price
on a future date. Companies like LINN Energy who hedge 100% of their cash flows use forwards, futures,
swaps, and option contracts as true hedging instruments. Companies that hedge less than 100% are
actually using these investment vehicles as speculative tools.
The majority of forward contracts used in energy hedging are for three to five years in the
future. This can be an extremely valuable tool for companies if prices go into decline. With long contract
lengths, companies have an extended period of time to react to volatile market conditions. Problems for
energy companies arise when declining oil and natural gas prices fail to rebound as hedging contracts
expire. One of the current problems companies like LINN Energy are facing is their expiring hedging
contracts. As hedges expire, energy companies are left low on cash which prevents them from paying off
their debt. Many experts in the energy field are of the opinion that oil and gas prices will not recover
until 2017. This is too long of a time horizon for many already struggling companies to ride out. Danny
Campbell, chairman of the Permian Basin Petroleum Association was recently quoted saying, “today our
goal is to survive…keep your name in the phone book and your debt low.” Surviving is really all many
American oil and gas producers can do right now seeing as there are “virtually no wells in the United
States profitable to drill” to keep them stable as contracts continue to expire [Krauss and Corkery, 2016].
LINN Energy is organized as an LLC and is one of only 20 publicly traded companies with this
unique structure. Most companies similar to LINN are organized as MLP’s. Both LLC’s and MLP’s benefit
from a tax perspective in that they do not pay taxes at the corporate level. What differentiates them is
the presence of General Partners in MLP’s. LLC’s like LINN Energy only have Limited Partners which
means that, unlike General Partners, they do not have voting rights.
This paper examines why energy companies hedge their cash flows, what techniques they
employ to do so, and the extent to which they choose to hedge through the examination of case
company, LINN Energy, over the period of Q1 2013 to Q4 2015. As we have seen over the past 18
months, energy companies are volatile investments that fluctuate in value with oil, gas, uranium and
coal commodity prices. Independent oil and gas companies are exposed to fluctuations in oil and natural
gas prices as well as production volumes. When prices are high, independent oil and gas companies
behave more aggressively, leasing additional mineral rights and increasing drilling activity. When prices
4
are low, independent oil and gas companies decrease their drilling presence and sell off assets to
finance their debt. This is why it is difficult for these companies to survive in downturns in the absence
of cash flow hedging.
This thesis finds that LINN Energy, LLC is at a high risk of filing for bankruptcy due to their highly
leveraged position. LINN Energy is currently facing negative gross profits, negative EBITDA values, and
negative Earnings Per Share. This coupled with staggering amounts of long-term debt liability, high long-
term debt to equity ratios, negative Return on Assets, Return on Equity, and Return on Investment
support the assumption of many investors that LINN Energy will not be able to recover. See Tables 9-12.
Although the entire energy sector is struggling to stay profitable despite declines in oil and natural gas
prices, LINN Energy is struggling more than their direct competitors to stay in business. LINN Energy is
most comparable in size and business operations to Carrizo Oil & Gas Inc., Energen Corporation, Cabot
Oil & Gas, and EQT Corporation. Out of these five competitors, LINN Energy reported the lowest values
of Gross Profit, EBITDA, Operating Profit, and Adjusted Net Income. What is arguably more concerning is
the amount of Long-Term Debt reported on LINN Energy’s Balance Sheet. LINN currently has over 3.5
times more Long-Term Debt than EQT Corporation, which has the next highest long-term debt of the
other four competitors. From a leverage perspective, LINN Energy is second only to Carrizo Oil & Gas.
LINN reported a Long-Term Debt to Equity ratio of 226.6 while Carrizo reported 282.8, both numbers
well above their other three competitors. See Tables 13-15.
As LINN Energy’s hedging contracts continue to expire and their leverage increases, they will
likely not be able to cover their $2.3 billion in outstanding debt. All of the financial statement data
accompanied with the high probability that LINN will face another borrowing base decrease from banks
in April 2016 leads me to think that their stock price will continue to fall until they either file for
bankruptcy or are acquired. It is my recommendation that the stock should be shorted at $1.20
(February 2016) and put options with a longer maturity date, such as those which mature on January 20,
2017 should be purchased.
The rest of this paper proceeds as follows: literature review, background of case company,
analysis, and discussion and conclusion.
Section II: Literature Review
The literature analyzed covers three topics related to LINN Energy, LLC. These three topics
include the current state of the energy sector, hedging in energy companies, and the tax effects of
organizing as an MLP of LLC.
Current State of the Energy Sector:
LINN Energy is part of the Oil & Gas Exploration and Production sub-industry. According to
Glickman (2015), S&P has a negative outlook on this sub-industry for the next 12 months. S&P’s opinion
is that a recovery in oil and natural gas prices driven down by increased production and stagnant
demand will be “slow coming.” S&P Capital IQ estimates that even though not all energy companies
throughout the industry are directly tied to oil prices, 75% of the overall market capitalization in the
industry is driven by exploration and production. These upstream operations, which LINN Energy also
operates in, do directly benefit from high oil and gas prices. Because of S&P’s view that crude oil and
natural gas prices will remain low in 2016, they believe that the industry will continue to experience high

5
levels of M&A activity, particularly in upstream companies. The energy sector’s EBITDA margin, which is
a proxy for cash flow, decreased by 25% over the course of one year to 17% in Q3 of 2015. According to
S&P, 17% is the lowest reported EBITDA margin level in 10 years. S&P also notes that the market is
looking at 2016 as a year for recovery although they do not share this particular view. They think the
rebound will be slow because of how long it will take to “exhaust the excess supply that has created
problems for the industry.” S&P’s concerns are amplified by the resiliency of supply and the fact that
there are approximately 5,000 uncompleted wells that upstream companies will start to stimulate and
bring on-line once crude oil prices increase. If exploration and production companies are not cautious as
prices begin to rise, they could “put a dent in the price recovery by building supply back up too quickly”
[Glickman, 2015].
Another concern for the industry, and LINN Energy specifically are the upcoming April borrowing
base redeterminations. Every April and October banks reevaluate how much money they are willing to
lend to oil and gas companies. Depending on what happens in April, small producers like LINN Energy
that are already struggling with high debt on their books could face a borrowing base redetermination
that puts them in a position they cannot recover from.
Hedging in Energy Companies:
Standard & Poor’s Directors, Michael Grande and Sherman Myers (2011), stated that it is normal
for energy companies to hedge 70% to 80% of their volumetric exposure. It is their opinion that
companies only do not hedge all of their exposure in case they do not have enough of the physical
commodity to act as collateral for the contract in the event of a decrease in production volume.
Although hedging ensures the company’s future cash flows, hedging in itself creates a separate risk if a
company finds themselves “out of the money.” The more a company chooses to hedge, the less liquid
they become. If a company’s hedging contract goes in the opposite direction of what they expected,
they are, if they do not have cash to cover the amount owed, required to cover the contract with
physical commodities as collateral. These margin calls are part of the problem that the case study
company, LINN Energy, is currently facing. The inability for them to cover their positions poses
significant counterparty risk to their lenders. Two specific ways companies choose to hedge are by using
direct product hedges and proxy hedges. When a direct product hedge is used, a company hedges a
particular commodity with a contract for that same commodity. On the other hand, proxy hedges, also
referred to as “dirty hedges,” are when one commodity is hedged with a contract for another
commodity [Grande and Myers, 2011]. One common example of a proxy hedge is hedging crude with a
contract for natural gas liquids. In addition to price risk, basis risk needs to be taken into consideration.
Differences in basis occur owing to the fact that oil and gas can be stored, also bringing into account
potential arbitrage opportunities across time, location, and form. In the latter case, crude oil can be sold
as is, or processed into gasoline, diesel, and other refined products before sale aka “cross-hedges.”
According to Jin and Jorion (2006), firms hedge in order to minimize the costs associated with volatile cash flows. Their argument is that “hedging reduces the expected cost of financial distress” and that “hedging can also increase a firm’s debt capacity”. These same themes are reiterated by Artez, Bartram, and Dufey (2007): “higher leverage increases firm value through the tax advantage of debt”. The downside of this is that highly leveraged firms are still obligated to their bondholders. If a firm cannot pay back their bondholders, they face the risk of filing for bankruptcy which incurs additional costs for the company. The expected costs of financial distress are highly positively correlated with a firm’s leverage and the volatility of their future cash flows and with the risk of bankruptcy. This is why
6
hedging, which reduces cash flow volatility, is a key component of a firm’s survival. The issue of hedging’s ability to increase a firm’s debt capacity has contributed to issues LINN Energy has faced with their high level of debt and leverage that will be discussed in more detail later in this paper.
Hickey (2011) says oil and gas producers hedge about 33% of their oil production (4% of oil reserves) and 41% of their gas production (5% of gas reserves). These numbers are confirmed by Jin and Jorion (2006). Hickey also concludes that larger companies hedged more than their smaller counterparts. He states that as hedging activity increases and earnings volatility decreases, firms are able to increase their debt ratio by 3%. Another interesting point that Hickey (2011) details is the concept of “personal utility maximization for managers.” Because managers are heavily exposed to the performance of their firm and cannot diversify as an individual investor can, they make decisions that protect themselves. This means that they will behave in a risk-averse manner, making hedging decisions for their company that protects their personal fortunes.
Tax Effects of Organizing as an MLP or LLC:
Many energy companies choose to organize themselves as MLP’s based on the unique tax
structure afforded to them. “MLP’s are publicly listed partnerships that invest primarily in the energy
sector” [Benham and et al, 2014]. MLP’s do not pay taxes at the corporate level and work on a fee basis
for handling products without direct commodity ownership. Any company that generates at least 90% of
its income from real estate, natural resources, and commodities is allowed to organize under this
structure. Both MLP’s, LP’s, and LLC’s have the potential to generate high profit margins for investors
because of their tax structure. The flipside of this is that investors “do not enjoy the same fiduciary duty
protections that apply to stockholders of publicly-traded corporations” [Miller and Davis-Nozemack,
2015]. The state of Delaware, which most LLC’s and LP’s are organized under, permit these companies to
waive their fiduciary duties, meaning they are not held accountable for acting in the interest of the
stakeholder. MLP’s, LLC’s, and LP’s all file their taxes using Schedule K1’s. From the perspective of the
company, K1’s are less complex than the 1099’s Corporations have to file with because they do not
account for the entire company on one form. The company does not file a Schedule K1 but each partner
in an MLP, LLC, or LP files their own K1 form to report income, losses, and dividends. However, as an
investor, K1 filings add more complexity and tax burden to the individual.
While the LLC structure of LINN Energy shares the same tax benefits, the difference lies in the
company structure. MLP’s have both General Partners and Limited Partners. Limited Partners are
investors that do not manage the company and, therefore, have limited voting rights. The units of the
company that they own entitle them to receive the cash distributions from the company that other
shareholders would. General Partners, however, own a small stake in the company but act as managers
and receive voting rights. As seen in Figure 16, LLC’s like LINN Energy do not have General Partners or
Incentive Distribution Rights. It should also be noted that the vast majority of LLC’s are not publicly
traded. In fact, LINN Energy is one of 20 with this unique structure traded on an exchange compared to
110 MLP’s that are publicly traded.
On the other hand, many companies in this sector still choose to organize as traditional
corporations even though this corporate structure is more expensive from a tax and regulatory
perspective. Profits under this structure are “double taxed” because profits are taxed as they are earned
and again when they are distributed as dividends. One main benefit of corporations is the liability
protection that comes with it because company debt is not personal debt to the owners. The

7
corporation itself, not the shareholders, are liable for the actions and debts incurred by the business.
Corporations also have more flexibility when it comes to how they use their profits. MLP’s and LLC’s
have to distribute their profits to shareholders while corporations can retain some of their earnings or
buy back shares of stock.
Section III: Background of LINN Energy, LLC
I selected LINN Energy, LLC as the subject for this thesis because of the breadth of information
provided on their company website regarding their historical commodity hedge positions. Independent
oil and gas companies are not required to disclose their hedging strategies in as much detail as LINN
Energy chose to which made LINN an excellent case study company for this thesis paper. LINN Energy is
an independent oil and natural gas company based out of Houston, Texas. “Its properties are located in
the Rockies, the Hugoton Basin (in Kansas), California, east Texas and north Louisiana, the Mid-
Continent, the Permian Basin, Michigan/Illinois, and south Texas. As of December 31, 2014, the
company had proved (gas) reserves of 7,304 billion cubic feet equivalent; and operated 19,591 gross
productive wells” [LINE Profile | Linn Energy, LLC Stock, 2016]. LINN Energy is interesting in the fact that
many of its direct competitors are organized as MLP’s. LINN, however, is one of the few publicly traded
LLC’s.
The Discounted Cash Flow (DCF) and Comparisons (Comps) Models attached to this report
further explain LINN Energy’s current financial situation. The 85% drop in their equity value over the
course of 2015 has led to their extremely low equity price compared to Carizzo Oil & Gas Inc., Energen
Corporation, Cabot Oil & Gas, and EQT Corporation. Additionally, LINN Energy has, by far, the lowest
EBIT and EBITDA values for the last 12 months. The Comps Model from Table 17 shows that LINN energy
has the lowest Enterprise Value to EBITDA ratio out of the five companies. It also forecasts that they will
have the lowest EV/Revenues and EV/EBITDA values in 2016. It also should be noted that, while LINN
and three of the four comparable companies have no P/E value because each one failed to report
earnings for the most recent quarter, LINN is the only company that has lost nearly all of its equity value.
The DCF Model from Table 18 values LINN Energy shares of common stock at $.88 using the Fair Value
Perpetuity Method and $.16 using the Fair Value Multiple method.
These facts highlight the going concern problems of LINN Energy. It is likely that they soon will
not be able to cover their extreme levels of debt and will be forced to file for bankruptcy. In addition,
LINN Energy is delaying filing their most recent 10K, leading more industry professionals to believe they
have going concern issues. The company disclosed on March 1, 2016 that “it does not expect to remain
in compliance with all of the covenants contained in its credit facilities throughout 2016.” In April, the
credit lines of LINN Energy and their subsidiary, Berry Petroleum, will be up for their semi-annual
redeterminations. If their borrowing base is decreased again, they will be liable to make debt payments
in a shorter time frame [Zeits, 2016]. All of these factors greatly increase the chance that they will have
to file for bankruptcy.
Section IV: Analysis
My analysis finds that energy companies hedge the majority of their exposure to commodity
price fluctuations. LINN Energy, typically hedges 100% of their production four to six years into the
future. By locking in prices this far ahead in time, they are afforded more flexibility in the event of a
commodity downturn to make key business decisions from a position with stabilized cash flows. Their
8
strategy is to maintain a hedging mix with 70% of their exposure hedged using swaps and 30% using put
options [Presentations, 2015].
The case of LINN Energy does bring up some interesting anomalies. For a company that is so well
hedged how could they be failing? How is it that their stock price has dropped 85% from January 1, 2015
to January 1, 2016? Even more dramatically, the stock was trading at $24.45 at the start of 2014 and
opened at $0.48 at the start of 2016. In 2013, Gue (2013) said LINN Energy was one of his two favorite
companies. He explicitly stated that LINN Energy’s 100% hedging strategy would lock in the company’s
profit margin for the next seven years. Now we find ourselves three years into the seven and LINN
Energy is in terrible shape. It is the opinion of Stifel analyst Brian Brungardt that LINN Energy could stay
afloat through 2016 due to their cash flow and hedges but will probably be forced to file for bankruptcy
[Blum, 2016]. This proves that even hedging 100% of a company’s exposure still is not always enough to
secure the future of a company during a prolonged downturn in the energy sector. LINN Energy’s failure
is linked to their highly leveraged position and the decisions by management to acquire parts of
ExxonMobil and Devon Energy in 2014, before prices had reached the lows we have seen in 2016.
The 2015 capital budget for LINN Energy was based off of a $60 per barrel average for oil and a
$3.50 per MCF average for natural gas. The company was too bullish on both oil and gas prices, creating
a bad position for them when energy prices continued to trade at low levels as their hedging contracts
continues to expire. This contributed to their financial distress forcing them to suspend distributions to
shareholders and delay the release of their 10Q for the first quarter of 2016. Although LINN Energy paid
off $1.8 billion in net debt last year, they did not prioritize their debt retirement in the most efficient
way and still owe an additional $9 billion. They chose to pay off long-term debt instead of allocating cash
to bank debt. The result of this mistake was that banks pulled back on the credit line that had previously
been extended to LINN, lowering their available liquidity [LINN Energy, LLC’s Worst Moves in 2015,
2015].
Aside from the company’s loss of nearly all of their equity value, their bonds were recently
downgraded to D+. All ten existing issues are callable and have very attractive coupons given their short-
term maturity dates. Their maturity dates range from 5/15/2019 to 9/15/2022. The reason for their
attractive yields, of course, is the risk that the company will be forced to file for bankruptcy and the debt
will not be repaid. See Figure 19. Insider trading activity shown in Figure 20 should also be noted. Since
2014, all large transactions have been sales. It is arguable that if insiders thought the company would
survive the downturn, they would be buying shares now that the equity price has dropped by 85% over
the last year. However, they have continued to sell their stakes in the company throughout 2016.
From the period of Q1 2013 through Q4 2015, LINN Energy has modified the specifics of their hedging
strategy. Throughout the period of study, their methods for hedging natural gas positions has remained
constant. However, in 2013, LINN Energy reported hedging their oil exposure with fixed price swaps and
put options. In 2014, they expanded their oil position hedging by adding collars and three-way collars to
their hedging mix. In 2015, three-way collars remained a part of their strategy while traditional collars
were removed. The benefit to hedging with a three-way collar option is the cost at which the company
can purchase the option. Collars are protective options strategies that are implemented after a long
position has experienced substantial gains. A collar is created when an out of the money put option is
purchased at the same time that an out of the money call option is sold. In a three-way collar, an
additional out of the money put option is sold. This option strategy creates additional risk to the

9
company in the event that prices decline and the lower priced put option expires in the money
[Presentations, 2015].
LINN Energy’s most recent hedging data from Q4 2015 is shown in Figures 21 and 22. From
analyzing their quarter over quarter Commodity Hedge Positions reports, it seems as if LINN only made
strategic changes in the first quarters of each year. The volume hedged using fixed price swaps for
natural gas positions increased from 22,002 in Q4 2013 to 24,017 in Q1 2014. Similarly, 24,550 MMBtu’s
were hedged in Q4 2014 and 29,106 MMBtu’s were hedged in Q1 2015. The same can be seen in their
oil positions. In Q4 2013, 2,992 MBbl’s were hedged. In the quarter following, they increased their
hedged volume to $4,150 MBbl’s. From Q4 2014 to Q1 2015, LINN decreased their hedged volume from
4,242 to 2,860 MBbl’s. The intermittent quarters showed little or no change in production volume
hedged [Presentations, 2015].
Section V: Discussion and Conclusion
While, in theory, hedging strategies are supposed to protect energy companies from declining
oil and gas prices, we still see examples of companies like LINN Energy losing almost all of their value.
LINN Energy’s prevailing issue is their leverage. They merged with Berry Petroleum in 2013, not long
before oil prices began dropping in mid-2014. Then they went on to acquire parts of ExxonMobil and
Devon Energy in 2014. These transactions were leveraged and locked LINN Energy into high costs of
debt. The debt the company would have to repay from 2019 to 2022 would take place following their
hedges reaching maturity. By the time energy prices dropped even lower, LINN Energy had no money to
invest in even better deals and lost out on the opportunity to dollar cost average down. Because of this,
they are stuck with high costs of debt and leverage working against them [LINN Energy: Why Oil & Gas
Limited Partnerships Fail, 2015]. Hedging strategies can only help them so much, and for so long. Since
the terms of their debt are longer than their protective hedges, they have to wait out the high costs and
de-leverage as much as possible.
Given the information provided in this thesis, I am recommending to short the equity at $1.20
(February 2016) and purchase put options. This leads me to the conclusion that the best put options to
purchase are those with a maturity date of January 20, 2017. By the time this maturity date approaches,
there is a high probability that LINN Energy will be in even deeper financial trouble because of additional
expiring hedging contracts. It is also my recommendation to buy those available lots with strike prices of
$.50, $1.00, $1.50, and $2.00 because of the low trading value of the shares of common stock. See
Figure 23. By purchasing put options, the buyer is protected in the event of bankruptcy. The Options
Clearing Corporation requires the seller of the put option to fulfil their obligation to sell shares to the
option buyer at the higher price, guaranteeing profits for the put option buyer. The insolvency of the
company is separate from the option selling entity, meaning that a buyer of put options is still
guaranteed profit and delivery from the option writer if the company files for bankruptcy.

10
References
"4Q 2015 LINN Energy, LLC Earnings Conference Call." LINN Energy. LINN Energy, 19 Feb. 2016.
Web. 15 Feb. 2016.
Aretz, Kevin, Söhnke M. Bartram, and Gunter Dufey. "Why Hedge? Rationales for Corporate
Hedging and Value Implications." The Journal of Risk Finance 8.5 (2007): 434-49. Emerald
Insight. Emerald Group Publishing Limited, 2007. Web. 17 Feb. 2016.
Benham, Frank, Steven Hartt, Chris Tehranian, and Edmund Walsh. "Master Limited Partnerships
(MLPs)." Social Science Research Network. Meketa Investment Group, June 2014. Web. 15
Feb. 2016.
Blum, Jordan. "LINN Energy Stock Plummets as It Weighs Potential Bankruptcy." Fuel Fix. Fuel Fix,
05 Feb. 2016. Web. 15 Feb. 2016.
Egan, Matt, and Crude Oil Have Been Glued at the Hip in 2016 -- for Better or Worse. It Was a
Scary Linkage Last Week When Oil Prices Plummeted to $26 a Barrel. "Why Stocks Need to
Break Free from Shackles of Oil."CNNMoney. Cable News Network, 26 Jan. 2016. Web. 16
Feb. 2016.
Glickman, Stewart. "Industry Surveys Oil, Gas & Consumable Fuels."Fidelity.com. S&P Capital IQ,
30 Dec. 2015. Web. 06 Mar. 2016.
Grande, Michael, and Sherman Myers. "How U.S. Midstream Energy Companies Manage
Commodity Price." YouTube. YouTube, 1 Nov. 2011. Web. 15 Feb. 2016.
Gue, Elliot. "MLPs That Hedge Commodity Risk." MoneyShow.com. Capitalist Times, 17 Sept. 2013.
Web. 15 Feb. 2016.
Hickey, Larry. "To Hedge Or Not To Hedge." Oil & Gas Financial Journal. Oil & Gas Financial
Journal, 1 June 2011. Web. 15 Feb. 2016.
Jin, Yanbo, and Philippe Jorion. "Firm Value and Hedging: Evidence from U.S. Oil and Gas
Producers." Journal of Finance LXI.2 (2006): 893-919.By Yanbo Jin, Philippe Jorion.
Blackwell Publishing Limited, 28 Dec. 2004. Web. 15 Feb. 2016.
Krauss, Clifford, and Michael Corkery. "As Oil Prices Plummet, Mounting Debt Catches up with U.S.
Producers." The Seattle Times. N.p., 15 Feb. 2016. Web. 17 Feb. 2016.
"LINE Profile | Linn Energy, LLC Stock - Yahoo! Finance." LINE Profile | Linn Energy, LLC Stock -
Yahoo! Finance. Yahoo! Finance, n.d. Web. 16 Mar. 2016.
"LINN Energy: Why Oil & Gas Limited Partnerships Fail." Seeking Alpha. Seeking Alpha, 4 Aug.
2015. Web. 15 Feb. 2016.
"LINN Energy, LLC's Worst Moves in 2015." The Motley Fool. N.p., n.d. Web. 17 Feb. 2016.
Miller, Sandra K., and Karie Davis-Nozemack. "Toward Consistent Fiduciary Duties for Publicly-
Traded Entities." Social Science Research Network. Florida Law Review, 27 Mar. 2015.
Web. 02 Mar. 2016.
"Presentations." LINN Energy. LINN Energy, 5 Nov. 2015. Web. 15 Feb. 2016.
Zeits, Richard. "Linn Energy: A Case Study Of Covenant Acceleration."Seeking Alpha. Zeits Energy
Analytics, 01 Mar. 2016. Web. 03 Mar. 2016.

11
Figure 1: West Texas Intermediate Spot Price
Figure 2: West Texas Intermediate Price Projections
0
20
40
60
80
100
120Ja
n-1
3
Mar
-13
May
-13
Jul-
13
Sep
-13
No
v-1
3
Jan
-14
Mar
-14
May
-14
Jul-
14
Sep
-14
No
v-1
4
Jan
-15
Mar
-15
May
-15
Jul-
15
Sep
-15
No
v-1
5
Jan
-16
Do
llars
per
Bar
rel
WTI Spot Price 2013-Present

12
Figure 3: West Texas Intermediate Line of Best Fit Price Projections
Figure 4: Henry Hub Natural Gas Spot Price
0
1
2
3
4
5
6
7
Jan
-13
Mar
-13
May
-13
Jul-
13
Sep
-13
No
v-1
3
Jan
-14
Mar
-14
May
-14
Jul-
14
Sep
-14
No
v-1
4
Jan
-15
Mar
-15
May
-15
Jul-
15
Sep
-15
No
v-1
5
Jan
-16
Do
llars
per
Mill
ion
Btu
Natural Gas Spot Price 2013-Present
13
Figure 5: Henry Hub Natural Gas Price Projections
Figure 6: Henry Hub Natural Gas Line of Best Fit Price Projections

14
Figure 7: Natural Gas Liquid Spot Price
Figure 8: Natural Gas Liquid Line of Best Fit Price Projections
0
2
4
6
8
10
12
14Ja
n-1
3
Mar
-13
May
-13
Jul-
13
Sep
-13
No
v-1
3
Jan
-14
Mar
-14
May
-14
Jul-
14
Sep
-14
No
v-1
4
Jan
-15
Mar
-15
May
-15
Jul-
15
Sep
-15
No
v-1
5
Do
llars
per
Mill
ion
Btu
NGL Spot Price 2013-Present

15
Table 9: Quarterly Income Statement and Projections
LIN
N E
NE
RG
Y, L
LC
600
Trav
isH
oust
on, T
X 7
7002
Tick
er:
LIN
EFi
scal
Yea
r: 1
2
Dec
20D
ec19
Dec
18D
ec17
Dec
16
Dec
15
Sep1
5Ju
n15
Mar
15D
ec14
Sep1
4Ju
n14
Mar
14D
ec13
Sep1
3Ju
n13
Mar
13D
ec12
Sep1
2Ju
n12
Sale
s3,
943.
115
3,82
8.26
73,
716.
764
3,60
8.50
93,
280.
463
2,98
2.23
999
8.30
432
1.82
891
6.54
72,
217.
650
1,43
5.11
559
6.95
173
3.58
762
3.05
949
4.56
283
3.75
236
9.06
056
7.99
948
.328
782.
320
Cos
t of G
oods
Sol
d2,
668.
114
2,59
0.40
22,
514.
954
2,44
1.70
32,
219.
730
4,12
9.86
62,
519.
678
263.
640
842.
064
2,10
6.46
894
6.63
632
1.56
032
6.44
898
1.12
116
4.89
213
9.78
822
0.00
243
4.30
616
3.07
227
5.55
7C
OG
S/Sa
les
2.52
40.
819
0.91
90.
950
0.66
00.
539
0.44
51.
575
0.33
30.
168
0.59
60.
765
3.37
40.
352
68%
----
----
----
----
----
----
----
----
----
----
----
----
----
----
----
----
----
----
----
----
----
----
----
----
----
----
----
----
----
----
----
----
----
----
----
----
----
----
----
----
----
----
----
----
----
----
----
----
----
----
----
----
----
----
----
----
----
----
----
----
----
----
----
Gro
ss P
rofit
1,27
5.00
01,
237.
865
1,20
1.81
01,
166.
806
1,06
0.73
3(1
,147
.627
)(1
,521
.374
)58
.188
74.4
8311
1.18
248
8.47
927
5.39
140
7.13
9(3
58.0
62)
329.
670
693.
964
149.
058
133.
693
(114
.744
)50
6.76
3
Selli
ng, G
ener
al, &
Adm
inist
rativ
e Ex
pens
e42
6.21
241
3.79
840
1.74
639
0.04
435
4.58
632
2.35
163
.185
99.2
1479
.364
186.
100
83.2
3468
.457
80.3
1951
.588
47.0
1945
.148
49.6
5344
.242
45.5
5641
.592
----
----
----
----
----
----
----
----
----
----
----
----
----
----
----
----
----
----
----
----
----
----
----
----
----
----
----
----
----
----
----
----
----
----
----
----
----
----
----
----
----
----
----
----
----
----
----
----
----
----
----
----
----
----
----
----
----
----
----
----
----
----
----
Ope
ratin
g In
com
e B
efor
e D
epre
c.84
8.78
982
4.06
780
0.06
577
6.76
270
6.14
7(1
,469
.978
)(1
,584
.559
)(4
1.02
6)(4
.881
)(7
4.91
8)40
5.24
520
6.93
432
6.82
0(4
09.6
50)
282.
651
648.
816
99.4
0589
.451
(160
.300
)46
5.17
1D
epre
ciat
ion,
Dep
letio
n, &
Am
ortiz
atio
n97
7.23
293
0.69
788
6.37
884
4.17
080
3.97
183
7.00
420
7.21
821
5.73
221
5.01
424
1.37
929
0.28
727
4.43
526
7.80
122
4.34
920
8.89
219
8.62
919
7.44
117
7.67
316
7.69
514
3.50
6--
----
----
----
----
----
----
----
----
----
----
----
----
----
----
----
----
----
----
----
----
----
----
----
----
----
----
----
----
----
----
----
----
----
----
----
----
----
----
----
----
----
----
----
----
----
----
----
----
----
----
----
----
----
----
----
----
----
----
----
----
----
----
--O
pera
ting
Prof
it(1
28.4
43)
(106
.631
)(8
6.31
4)(6
7.40
8)(9
7.82
4)(2
,306
.982
)(1
,791
.777
)(2
56.7
58)
(219
.895
)(3
16.2
97)
114.
958
(67.
501)
59.0
19(6
33.9
99)
73.7
5945
0.18
7(9
8.03
6)(8
8.22
2)(3
27.9
95)
321.
665
Inte
rest
Exp
ense
570.
112
570.
112
138.
383
146.
100
143.
101
165.
678
154.
047
134.
300
133.
813
113.
125
103.
806
103.
847
100.
359
102.
331
105.
697
94.3
90N
on-O
pera
ting
Inco
me/
Expe
nse
43.2
9842
.037
40.8
1239
.624
36.0
2224
9.60
416
5.27
911
.850
10.0
7432
9.23
633
.956
(8.0
16)
(4.8
89)
(12.
774)
(3.3
02)
(1.2
23)
(4.8
15)
(1.8
58)
(1.2
63)
(7.9
54)
Spec
ial I
tem
s0.
000
0.00
00.
000
0.00
00.
000
284.
703
197.
741
9.15
16.
635
0.00
00.
000
0.00
00.
000
(28.
851)
(1.1
17)
(1.0
89)
(11.
139)
3.22
60.
000
18.2
77E
BIT
(85.
146)
(64.
594)
(45.
501)
(27.
784)
(61.
803)
(1,7
72.6
75)
125.
099
----
----
----
----
----
----
----
----
----
----
----
----
----
----
----
----
----
----
----
----
----
----
----
----
----
----
----
----
----
----
----
----
----
----
----
----
----
----
----
----
----
----
----
----
----
----
----
----
----
----
----
----
----
----
----
----
----
----
----
----
----
----
----
Pret
ax In
com
e(1
,567
.140
)(3
81.8
57)
(346
.287
)(1
52.7
39)
(5.1
33)
(209
.817
)(7
9.68
3)(7
88.7
49)
(34.
466)
344.
028
(214
.349
)(1
89.1
85)
(434
.955
)23
7.59
8To
tal I
ncom
e Ta
xes
2.17
7(2
.730
)(7
.127
)1.
763
(1.0
33)
(1.9
47)
5.65
4(4
.200
)(4
.406
)(1
.129
)7.
536
(1.6
90)
(4.9
50)
0.51
2--
----
----
----
----
----
----
----
----
----
----
----
----
----
----
----
----
----
----
----
----
----
----
----
----
----
----
----
----
----
----
----
----
----
----
----
----
----
----
----
----
----
----
----
----
----
----
----
----
----
----
----
----
----
----
----
----
----
----
----
----
----
----
--In
com
e B
efor
e Ex
traor
dina
ry It
ems
and
Non
cont
rolli
ng In
tere
st(1
,569
.317
)(3
79.1
27)
(339
.160
)(1
54.5
02)
(4.1
00)
(207
.870
)(8
5.33
7)(7
84.5
49)
(30.
060)
345.
157
(221
.885
)(1
87.4
95)
(430
.005
)23
7.08
6--
----
----
----
----
----
----
----
----
----
----
----
----
----
----
----
----
----
----
----
----
----
----
----
----
----
----
----
----
----
----
----
----
----
----
----
----
----
----
----
----
----
----
----
----
----
----
----
----
----
----
----
----
----
----
----
----
----
----
----
----
----
----
--N
onco
ntro
lling
Inte
rest
- In
com
e A
ccou
nt0.
000
0.00
00.
000
0.00
00.
000
0.00
00.
000
0.00
00.
000
0.00
00.
000
0.00
00.
000
0.00
0--
----
----
----
----
----
----
----
----
----
----
----
----
----
----
----
----
----
----
----
----
----
----
----
----
----
----
----
----
----
----
----
----
----
----
----
----
----
----
----
----
----
----
----
----
----
----
----
----
----
----
----
----
----
----
----
----
----
----
----
----
----
----
--In
com
e B
efor
e Ex
traor
dina
ryIte
ms &
Disc
ontin
ued
Ope
ratio
ns(1
,569
.317
)(3
79.1
27)
(339
.160
)(1
54.5
02)
(4.1
00)
(207
.870
)(8
5.33
7)(7
84.5
49)
(30.
060)
345.
157
(221
.885
)(1
87.4
95)
(430
.005
)23
7.08
6Pr
efer
red
Div
iden
ds0.
000
0.00
00.
000
0.00
00.
000
0.00
00.
000
0.00
00.
000
0.00
00.
000
0.00
00.
000
0.00
0--
----
----
----
----
----
----
----
----
----
----
----
----
----
----
----
----
----
----
----
----
----
----
----
----
----
----
----
----
----
----
----
----
----
----
----
----
----
----
----
----
----
----
----
----
----
----
----
----
----
----
----
----
----
----
----
----
----
----
----
----
----
----
--A
vaila
ble
for C
omm
on(1
,569
.317
)(3
79.1
27)
(339
.160
)(1
54.5
02)
(4.1
00)
(207
.870
)(8
5.33
7)(7
84.5
49)
(30.
060)
345.
157
(221
.885
)(1
87.4
95)
(430
.005
)23
7.08
6Sa
ving
s Due
to C
omm
on S
tock
Equ
ival
ents
0.00
0(1
.662
)(1
.781
)(0
.828
)(2
.097
)(2
.154
)(2
.199
)(2
.139
)(1
.266
)(2
.629
)(1
.301
)(0
.410
)(1
.398
)(2
.232
)--
----
----
----
----
----
----
----
----
----
----
----
----
----
----
----
----
----
----
----
----
----
----
----
----
----
----
----
----
----
----
----
----
----
----
----
----
----
----
----
----
----
----
----
----
----
----
----
----
----
----
----
----
----
----
----
----
----
----
----
----
----
----
--A
djus
ted
Ava
ilabl
e fo
r Com
mon
(1,5
69.3
17)
(380
.789
)(3
40.9
41)
(155
.330
)(6
.197
)(2
10.0
24)
(87.
536)
(786
.688
)(3
1.32
6)34
2.52
8(2
23.1
86)
(187
.905
)(4
31.4
03)
234.
854
Extra
ordi
nary
Item
s0.
000
0.00
00.
000
0.00
00.
000
0.00
00.
000
0.00
00.
000
0.00
00.
000
0.00
00.
000
0.00
0D
iscon
tinue
d O
pera
tions
0.00
00.
000
0.00
00.
000
0.00
00.
000
0.00
00.
000
0.00
00.
000
0.00
00.
000
0.00
00.
000
Adj
uste
d N
et In
com
e(1
,569
.317
)(3
80.7
89)
(340
.941
)(1
55.3
30)
(6.1
97)
(210
.024
)(8
7.53
6)(7
86.6
88)
(31.
326)
342.
528
(223
.186
)(1
87.9
05)
(431
.403
)23
4.85
4
Earn
ings
Per
Sha
re B
asic
-Ex
clud
ing
Extra
Item
s & D
isc O
p(4
.470
)(1
.120
)(1
.030
)(0
.470
)(0
.020
)(0
.640
)(0
.270
)(3
.150
)(0
.130
)1.
470
(0.9
60)
(0.8
30)
(2.1
80)
1.19
0
Earn
ings
Per
Sha
re B
asic
-In
clud
ing
Extra
Item
s & D
isc O
p(4
.470
)(1
.120
)(1
.030
)(0
.470
)(0
.020
)(0
.640
)(0
.270
)(3
.150
)(0
.130
)1.
470
(0.9
60)
(0.8
30)
(2.1
80)
1.19
0
Earn
ings
Per
Sha
re D
ilute
d-Ex
clud
ing
Extra
Item
s & D
isc O
p(4
.470
)(1
.120
)(1
.030
)(0
.470
)(0
.020
)(0
.640
)(0
.270
)(3
.150
)(0
.130
)1.
460
(0.9
60)
(0.8
30)
(2.1
80)
1.19
0
Earn
ings
Per
Sha
re D
ilute
d -
Incl
udin
g Ex
tra It
ems &
Disc
Op
(4.4
70)
(1.1
20)
(1.0
30)
(0.4
70)
(0.0
20)
(0.6
40)
(0.2
70)
(3.1
50)
(0.1
30)
1.46
0(0
.960
)(0
.830
)(2
.180
)1.
190
EPS
Bas
ic fr
om O
pera
tions
(4.8
50)
(1.1
30)
(1.0
40)
(0.4
70)
(0.0
20)
(0.6
40)
(0.2
70)
(3.0
20)
(0.1
30)
1.48
0(0
.910
)(0
.840
)(2
.180
)1.
130
EPS
Dilu
ted
from
Ope
ratio
ns(4
.850
)(1
.130
)(1
.040
)(0
.470
)(0
.020
)(0
.640
)(0
.270
)(3
.020
)(0
.130
)1.
480
(0.9
10)
(0.8
40)
(2.1
80)
1.09
0D
ivid
ends
Per
Sha
re0.
313
0.31
30.
313
0.31
30.
725
0.72
50.
725
0.72
50.
725
0.72
50.
725
0.72
50.
725
0.72
5
Com
Sha
res f
or B
asic
EPS
350.
695
340.
934
330.
642
329.
331
329.
168
328.
844
328.
329
249.
859
233.
552
233.
448
233.
176
226.
662
197.
675
197.
507
Com
Sha
res f
or D
ilute
d EP
S35
0.69
534
0.93
433
0.64
232
9.33
132
9.16
832
8.84
432
8.32
924
9.85
923
3.55
223
3.91
023
3.17
622
6.66
219
7.67
519
8.16
0
Cop
yrig
ht: S
tand
ard
& P
oor's
, A D
ivisi
on o
f McG
raw
-Hill
Com
pani
es, I
nc.
QU
AR
TE
RL
Y IN
CO
ME
ST
AT
EM
EN
T($
MIL
LIO
NS,
EX
CE
PT P
ER
SH
AR
E)
16
Table 10: Quarterly Balance Sheet and Projections
LIN
N E
NER
GY
, LLC
600
Trav
isH
ousto
n, T
X 7
7002
Tick
er:
LIN
E
Dec
18D
ec17
Dec
16D
ec15
Sep1
5Ju
n15
Mar
15D
ec14
Sep1
4Ju
n14
Mar
14D
ec13
Sep1
3Ju
n13
Mar
13D
ec12
Sep1
2Ju
n12
ASS
ETS
Cash
& S
hort-
Term
Inve
stmen
ts61
5.32
6
532.
381
46
0.61
7
398.
527
34
4.80
63.
943
48.3
121.
809
59.1
6138
.339
68.3
1452
.171
27.4
801.
152
6.03
41.
243
1.15
41.
883
Net
Rec
eiva
bles
483.
894
41
8.66
6
362.
230
31
3.40
2
271.
156
305.
404
340.
838
471.
684
522.
633
549.
589
522.
945
488.
202
349.
426
343.
002
320.
609
371.
333
436.
132
321.
012
Inve
ntor
ies
-
-
-
-
0.00
00.
000
0.00
00.
000
0.00
00.
000
0.00
00.
000
0.00
00.
000
0.00
00.
000
0.00
00.
000
Oth
er C
urre
nt A
sset
s2,
220.
679
1,92
1.33
5
1,
662.
342
1,43
8.26
1
1,
244.
386
1,14
8.97
31,
267.
301
1,23
3.09
72,
367.
796
199.
493
207.
246
275.
567
272.
400
347.
226
472.
838
438.
852
399.
088
559.
414
------
------
------
------
------
------
------
------
------
------
------
------
------
------
------
------
------
------
------
------
------
------
------
------
------
------
------
------
------
------
------
------
------
------
------
------
------
------
------
------
------
------
Tota
l Cur
rent
Ass
ets
3,31
9.90
0
2,
872.
382
2,48
5.19
0
2,
150.
190
1,86
0.34
81,
458.
320
1,65
6.45
11,
706.
590
2,94
9.59
078
7.42
179
8.50
581
5.94
064
9.30
669
1.38
079
9.48
181
1.42
883
6.37
488
2.30
9-
-
-
-
G
ross
Pla
nt,P
rope
rty &
Equ
ipm
ent
33,5
06.4
65
28
,989
.847
25,0
82.0
62
21
,701
.040
18,7
75.7
7418
,662
.089
18,9
29.6
6918
,738
.049
18,7
71.8
9519
,360
.503
18,9
51.6
9318
,536
.441
12,7
60.3
3312
,400
.369
12,0
45.8
2712
,080
.518
11,7
03.3
5110
,423
.650
Acc
umul
ated
Dep
reci
atio
n(1
4,52
7.69
7)
(12,
569.
387)
(1
0,87
5.05
3)
(9,4
09.1
14)
(8,1
40.7
80)
(5,6
86.4
53)
(5,7
51.0
83)
(5,0
11.9
64)
(3,2
48.4
52)
(4,1
87.0
77)
(3,9
20.0
32)
(3,6
57.2
23)
(2,6
45.9
94)
(2,4
49.5
15)
(2,2
56.6
05)
(2,0
99.3
77)
(1,6
50.1
53)
(1,4
84.8
28)
------
------
------
------
------
------
------
------
------
------
------
------
------
------
------
------
------
------
------
------
------
------
------
------
------
------
------
------
------
------
------
------
------
------
------
------
------
------
------
------
------
------
Net
Pla
nt,P
rope
rty &
Equ
ipm
ent
18,9
78.7
68
16
,420
.460
14,2
07.0
08
12
,291
.926
10,6
34.9
9412
,975
.636
13,1
78.5
8613
,726
.085
15,5
23.4
4315
,173
.426
15,0
31.6
6114
,879
.218
10,1
14.3
399,
950.
854
9,78
9.22
29,
981.
141
10,0
53.1
988,
938.
822
-
-
-
-
In
vestm
ents
Long
-Ter
m- T
otal
@N
A@
NA
@N
A@
NA
@N
A@
NA
@N
A@
NA
@N
A@
NA
@N
A@
NA
@N
A@
NA
G
oodw
ill
0.00
00.
000
0.00
00.
000
0.00
00.
000
0.00
00.
000
0.00
00.
000
0.00
00.
000
0.00
00.
000
In
tang
ible
s- O
ther
0.00
00.
000
0.00
00.
000
0.00
00.
000
0.00
00.
000
0.00
00.
000
0.00
00.
000
0.00
00.
000
A
sset
s Lon
g-Te
rm O
ther
@
NA
@N
A@
NA
@N
A@
NA
@N
A@
NA
@N
A@
NA
@N
A@
NA
@N
A@
NA
@N
A---
------
------
------
------
------
------
------
------
------
------
------
------
------
------
------
------
------
------
------
------
------
------
------
------
------
------
------
------
------
------
------
------
------
------
------
------
------
------
------
------
------
---O
ther
Ass
ets
1,93
2.90
3
1,
672.
351
1,44
6.92
1
1,
251.
878
1,08
3.12
71,
078.
070
1,08
5.13
899
0.83
445
3.96
130
7.81
764
4.52
280
9.80
680
9.11
378
8.76
063
1.12
265
8.66
969
4.62
31,
358.
971
------
------
------
------
------
------
------
------
------
------
------
------
------
------
------
------
------
------
------
------
------
------
------
------
------
------
------
------
------
------
------
------
------
------
------
------
------
------
------
------
------
------
TOTA
L A
SSET
S24
,231
.571
20,9
65.1
94
18
,139
.119
15,6
93.9
94
13
,578
.469
15,5
12.0
2615
,920
.175
16,4
23.5
0918
,926
.994
16,2
68.6
6416
,474
.688
16,5
04.9
6411
,572
.758
11,4
30.9
9411
,219
.825
11,4
51.2
3811
,584
.195
11,1
80.1
02-
-
-
-
LI
ABI
LITI
ES-
-
-
-
D
ebt I
n Cu
rrent
Lia
bilit
ies
-
-
-
-
0.00
00.
000
0.00
00.
000
1,30
0.00
00.
000
207.
502
211.
558
0.00
00.
000
0.00
00.
000
0.00
00.
000
Acc
ount
s Pay
able
1,01
4.25
2
87
7.53
2
759.
242
65
6.89
8
568.
349
579.
289
608.
926
814.
809
826.
976
860.
171
797.
460
849.
624
659.
170
673.
926
662.
687
707.
861
688.
968
667.
541
Inco
me
Taxe
s Pay
able
-
-
-
-
0.00
00.
000
0.00
00.
000
0.00
00.
000
0.00
00.
000
0.00
00.
000
0.00
00.
000
0.00
00.
000
Oth
er C
urre
nt L
iabi
litie
s32
7.71
6
283.
541
24
5.32
0
212.
251
18
3.64
016
0.71
718
5.32
916
7.73
633
0.04
619
8.28
522
4.90
919
1.55
116
8.60
210
3.33
115
4.16
711
5.27
117
1.95
811
2.30
2---
------
------
------
------
------
------
------
------
------
------
------
------
------
------
------
------
------
------
------
------
------
------
------
------
------
------
------
------
------
------
------
------
------
------
------
------
------
------
------
------
------
---To
tal C
urre
nt L
iabi
litie
s1,
341.
968
1,16
1.07
3
1,
004.
562
869.
149
75
1.98
974
0.00
679
4.25
598
2.54
52,
457.
022
1,05
8.45
61,
229.
871
1,25
2.73
382
7.77
277
7.25
781
6.85
482
3.13
286
0.92
677
9.84
3-
-
-
-
Lo
ng T
erm
Deb
t17
,896
.044
15,4
83.6
86
13
,396
.510
11,5
90.6
81
10
,028
.276
10,3
24.5
4710
,398
.488
10,2
95.8
0911
,010
.146
9,64
4.35
19,
258.
558
8,95
8.65
86,
512.
873
6,25
5.67
36,
193.
991
6,03
7.81
76,
841.
670
6,00
5.54
7D
efer
red
Taxe
s & In
vestm
ent T
ax C
redi
ts@
NA
@N
A@
NA
13.8
77@
NA
@N
A@
NA
12.3
75@
NA
@N
A@
NA
6.30
7@
NA
@N
AO
ther
Lia
bilit
ies
1,07
7.69
3
93
2.42
2
806.
733
69
7.98
6
603.
899
586.
144
600.
929
587.
673
527.
693
404.
734
395.
307
389.
771
191.
955
166.
532
163.
544
156.
802
316.
596
263.
049
------
------
------
------
------
------
------
------
------
------
------
------
------
------
------
------
------
------
------
------
------
------
------
------
------
------
------
------
------
------
------
------
------
------
------
------
------
------
------
------
------
------
TOTA
L LI
ABI
LITI
ES20
,315
.705
17,5
77.1
81
15
,207
.805
13,1
57.8
17
11
,384
.164
11,6
50.6
9711
,793
.672
11,8
79.9
0413
,994
.861
11,1
07.5
4110
,883
.736
10,6
13.5
377,
532.
600
7,19
9.46
27,
174.
389
7,02
4.05
88,
019.
192
7,04
8.43
9-
-
-
-
Re
deem
able
Non
cont
rolli
ng In
tere
st-
-
-
-
0.
000
0.00
00.
000
0.00
00.
000
0.00
00.
000
0.00
00.
000
0.00
00.
000
0.00
00.
000
0.00
0-
-
-
-
EQ
UIT
Y-
-
-
-
Pr
efer
red
Stoc
k@
NA
@N
A@
NA
@N
A@
NA
@N
A@
NA
@N
A@
NA
@N
A@
NA
@N
A@
NA
@N
A
Com
mon
Sto
ck@
NA
@N
A@
NA
@N
A@
NA
@N
A@
NA
@N
A@
NA
@N
A@
NA
@N
A@
NA
@N
ACa
pita
l Sur
plus
@N
A@
NA
@N
A@
NA
@N
A@
NA
@N
A@
NA
@N
A@
NA
@N
A@
NA
@N
A@
NA
Reta
ined
Ear
ning
s@
NA
@N
A@
NA
@N
A@
NA
@N
A@
NA
@N
A@
NA
@N
A@
NA
@N
A@
NA
@N
ALe
ss: T
reas
ury
Stoc
k0.
000
0.00
00.
000
0.00
00.
000
0.00
00.
000
0.00
00.
000
0.00
00.
000
0.00
00.
000
0.00
0---
------
------
------
------
------
------
------
------
------
------
------
------
------
------
------
------
------
------
------
------
------
------
------
------
------
------
------
------
------
------
------
------
------
------
------
------
------
------
------
------
------
---Co
mm
on E
quity
3,91
5.86
5
3,
388.
013
2,93
1.31
4
2,
536.
178
2,19
4.30
53,
861.
329
4,12
6.50
34,
543.
605
4,93
2.13
35,
161.
123
5,59
0.95
25,
891.
427
4,04
0.15
84,
231.
532
4,04
5.43
64,
427.
180
3,56
5.00
34,
131.
663
------
------
------
------
------
------
------
------
------
------
------
------
------
------
------
------
------
------
------
------
------
------
------
------
------
------
------
------
------
------
------
------
------
------
------
------
------
------
------
------
------
------
Shar
ehol
ders
Equ
ity P
aren
t3,
915.
865
3,38
8.01
3
2,
931.
314
2,53
6.17
8
2,
194.
305
3,86
1.32
94,
126.
503
4,54
3.60
54,
932.
133
5,16
1.12
35,
590.
952
5,89
1.42
74,
040.
158
4,23
1.53
24,
045.
436
4,42
7.18
03,
565.
003
4,13
1.66
3 N
onre
deem
able
Non
cont
rolli
ng In
tere
st-
-
-
-
0.
000
0.00
00.
000
0.00
00.
000
0.00
00.
000
0.00
00.
000
0.00
00.
000
0.00
00.
000
0.00
0---
------
------
------
------
------
------
------
------
------
------
------
------
------
------
------
------
------
------
------
------
------
------
------
------
------
------
------
------
------
------
------
------
------
------
------
------
------
------
------
------
------
---ST
OC
KH
OLD
ERS
EQU
ITY
TO
TAL
3,91
5.86
5
3,
388.
013
2,93
1.31
4
2,
536.
178
2,19
4.30
53,
861.
329
4,12
6.50
34,
543.
605
4,93
2.13
35,
161.
123
5,59
0.95
25,
891.
427
4,04
0.15
84,
231.
532
4,04
5.43
64,
427.
180
3,56
5.00
34,
131.
663
------
------
------
------
------
------
------
------
------
------
------
------
------
------
------
------
------
------
------
------
------
------
------
------
------
------
------
------
------
------
------
------
------
------
------
------
------
------
------
------
------
------
TOTA
L LI
ABI
LITI
ES &
EQ
UIT
Y24
,231
.571
20,9
65.1
94
18
,139
.119
15,6
93.9
94
13
,578
.469
15,5
12.0
2615
,920
.175
16,4
23.5
0918
,926
.994
16,2
68.6
6416
,474
.688
16,5
04.9
6411
,572
.758
11,4
30.9
9411
,219
.825
11,4
51.2
3811
,584
.195
11,1
80.1
02
Com
mon
Sha
res O
utsta
ndin
g35
5,05
0,00
0.00
035
5.20
533
6.88
733
1.97
533
1.82
033
1.66
833
1.40
632
9.66
123
5.17
823
5.20
923
5.07
423
4.51
319
9.64
619
9.55
7
Copy
right
: Sta
ndar
d &
Poo
r's, A
Div
ision
of M
cGra
w-H
ill C
ompa
nies
, Inc
.
QU
AR
TER
LY B
ALA
NC
E SH
EET
($ M
ILLI
ON
S)
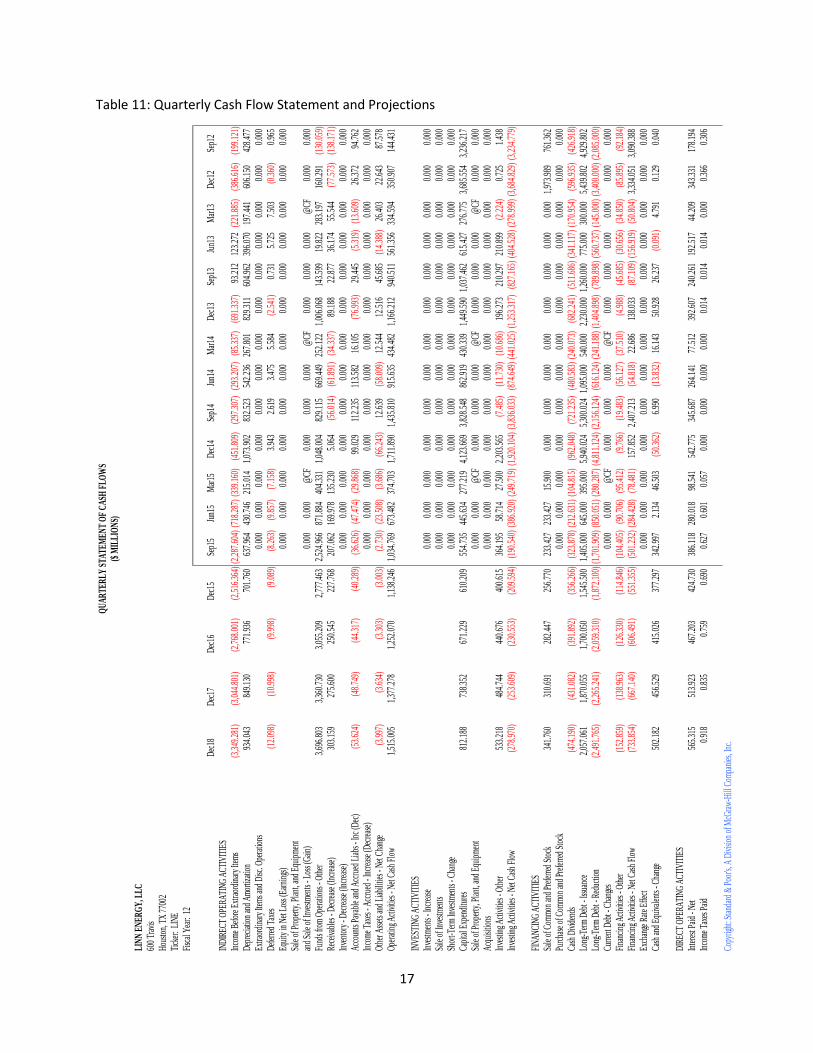
17
Table 11: Quarterly Cash Flow Statement and Projections
LIN
N E
NER
GY
, LLC
600
Trav
isHo
usto
n, T
X 77
002
Tick
er:
LINE
Fisc
al Y
ear:
12
Dec1
8De
c17
Dec1
6De
c15
Sep1
5Ju
n15
Mar
15De
c14
Sep1
4Ju
n14
Mar
14De
c13
Sep1
3Ju
n13
Mar
13De
c12
Sep1
2IN
DIRE
CT O
PERA
TING
ACT
IVIT
IES
Inco
me B
efor
e Ext
raor
dina
ry It
ems
(3,3
49.2
81)
(3,0
44.8
01)
(2,7
68.0
01)
(2,5
16.3
64)
(2,2
87.6
04)
(718
.287
)(3
39.1
60)
(451
.809
)(2
97.3
07)
(293
.207
)(8
5.33
7)(6
91.3
37)
93.2
1212
3.27
2(2
21.8
85)
(386
.616
)(1
99.1
21)
Depr
eciat
ion
and
Amor
tizat
ion
934.
043
849.
130
771.
936
701.
760
637.
964
430.
746
215.
014
1,07
3.90
283
2.52
354
2.23
626
7.80
182
9.31
160
4.96
239
6.07
019
7.44
160
6.15
042
8.47
7Ex
traor
dina
ry It
ems a
nd D
isc. O
pera
tions
0.00
00.
000
0.00
00.
000
0.00
00.
000
0.00
00.
000
0.00
00.
000
0.00
00.
000
0.00
0De
ferre
d Ta
xes
(12.
098)
(10.
998)
(9.9
98)
(9.0
89)
(8.2
63)
(9.8
57)
(7.1
58)
3.94
32.
619
3.47
55.
584
(2.5
41)
0.73
15.
725
7.50
3(0
.360
)0.
965
Equi
ty in
Net
Los
s (Ea
rnin
gs)
0.00
00.
000
0.00
00.
000
0.00
00.
000
0.00
00.
000
0.00
00.
000
0.00
00.
000
0.00
0Sa
le o
f Pro
perty
, Pla
nt, a
nd E
quip
men
tan
d Sa
le o
f Inv
estm
ents
- Los
s (Ga
in)
0.00
00.
000
@CF
0.00
00.
000
0.00
0@
CF0.
000
0.00
00.
000
@CF
0.00
00.
000
Fund
s fro
m O
pera
tions
- Ot
her
3,69
6.80
33,
360.
730
3,05
5.20
92,
777.
463
2,52
4.96
687
1.88
440
4.33
11,
048.
004
829.
115
669.
449
252.
122
1,00
6.06
814
3.59
919
.822
283.
197
160.
291
(130
.059
)Re
ceiva
bles
- De
crea
se (I
ncre
ase)
303.
159
275.
600
250.
545
227.
768
207.
062
169.
978
135.
230
5.06
4(5
6.01
4)(6
1.89
1)(3
4.33
7)89
.188
22.8
7736
.174
55.5
44(7
7.57
3)(1
38.1
71)
Inve
ntor
y - D
ecre
ase (
Incr
ease
)0.
000
0.00
00.
000
0.00
00.
000
0.00
00.
000
0.00
00.
000
0.00
00.
000
0.00
00.
000
Acco
unts
Paya
ble a
nd A
ccru
ed L
iabs -
Inc (
Dec)
(53.
624)
(48.
749)
(44.
317)
(40.
289)
(36.
626)
(47.
474)
(29.
868)
99.0
2911
2.23
511
3.58
216
.105
(76.
993)
29.4
45(5
.319
)(1
3.60
9)26
.372
94.7
62In
com
e Tax
es -
Accr
ued
- Inc
reas
e (De
crea
se)
0.00
00.
000
0.00
00.
000
0.00
00.
000
0.00
00.
000
0.00
00.
000
0.00
00.
000
0.00
0Ot
her A
sset
s and
Liab
ilitie
s - N
et C
hang
e(3
.997
)(3
.634
)(3
.303
)(3
.003
)(2
.730
)(2
3.50
8)(3
.686
)(6
6.24
3)12
.639
(58.
009)
12.5
4412
.516
45.6
85(1
4.38
8)26
.403
22.6
4387
.578
Oper
atin
g Act
ivitie
s - N
et C
ash
Flow
1,51
5.00
51,
377.
278
1,25
2.07
01,
138.
246
1,03
4.76
967
3.48
237
4.70
31,
711.
890
1,43
5.81
091
5.63
543
4.48
21,
166.
212
940.
511
561.
356
334.
594
350.
907
144.
431
INVE
STIN
G AC
TIVI
TIES
Inve
stmen
ts - I
ncre
ase
0.00
00.
000
0.00
00.
000
0.00
00.
000
0.00
00.
000
0.00
00.
000
0.00
00.
000
0.00
0Sa
le o
f Inv
estm
ents
0.00
00.
000
0.00
00.
000
0.00
00.
000
0.00
00.
000
0.00
00.
000
0.00
00.
000
0.00
0Sh
ort-T
erm
Inve
stmen
ts - C
hang
e0.
000
0.00
00.
000
0.00
00.
000
0.00
00.
000
0.00
00.
000
0.00
00.
000
0.00
00.
000
Capi
tal E
xpen
ditu
res
812.
188
738.
352
671.
229
610.
209
554.
735
445.
634
277.
219
4,12
3.66
93,
828.
548
862.
919
430.
339
1,44
9.59
01,
037.
462
615.
427
276.
775
3,68
5.55
43,
236.
217
Sale
of P
rope
rty, P
lant
, and
Equ
ipm
ent
0.00
00.
000
@CF
0.00
00.
000
0.00
0@
CF0.
000
0.00
00.
000
@CF
0.00
00.
000
Acqu
isitio
ns0.
000
0.00
00.
000
0.00
00.
000
0.00
00.
000
0.00
00.
000
0.00
00.
000
0.00
00.
000
Inve
sting
Act
ivitie
s - O
ther
533.
218
484.
744
440.
676
400.
615
364.
195
58.7
1427
.500
2,20
3.56
5(7
.485
)(1
1.73
0)(1
0.68
6)19
6.27
321
0.29
721
0.89
9(2
.224
)0.
725
1.43
8In
vesti
ng A
ctivi
ties -
Net
Cas
h Fl
ow(2
78.9
70)
(253
.609
)(2
30.5
53)
(209
.594
)(1
90.5
40)
(386
.920
)(2
49.7
19)
(1,9
20.1
04)
(3,8
36.0
33)
(874
.649
)(4
41.0
25)
(1,2
53.3
17)
(827
.165
)(4
04.5
28)
(278
.999
)(3
,684
.829
)(3
,234
.779
)
FINA
NCIN
G AC
TIVI
TIES
Sale
of C
omm
on an
d Pr
efer
red
Stoc
k34
1.76
031
0.69
128
2.44
725
6.77
023
3.42
723
3.42
715
.900
0.00
00.
000
0.00
00.
000
0.00
00.
000
0.00
00.
000
1,97
3.98
976
1.36
2Pu
rcha
se o
f Com
mon
and
Pref
erre
d St
ock
0.00
00.
000
0.00
00.
000
0.00
00.
000
0.00
00.
000
0.00
00.
000
0.00
00.
000
0.00
0Ca
sh D
ivide
nds
(474
.190
)(4
31.0
82)
(391
.892
)(3
56.2
66)
(323
.878
)(2
12.6
31)
(104
.815
)(9
62.0
48)
(721
.235
)(4
80.5
83)
(240
.073
)(6
82.2
41)
(511
.686
)(3
41.1
17)
(170
.954
)(5
96.9
35)
(426
.918
)Lo
ng-T
erm
Deb
t - Is
suan
ce2,
057.
061
1,87
0.05
51,
700.
050
1,54
5.50
01,
405.
000
645.
000
395.
000
5,94
0.02
45,
300.
024
1,09
5.00
054
0.00
02,
230.
000
1,26
0.00
077
5.00
030
0.00
05,
439.
802
4,92
9.80
2Lo
ng-T
erm
Deb
t - R
educ
tion
(2,4
91.7
65)
(2,2
65.2
41)
(2,0
59.3
10)
(1,8
72.1
00)
(1,7
01.9
09)
(850
.051
)(2
80.2
87)
(4,8
11.1
24)
(2,1
56.1
24)
(616
.124
)(2
41.1
88)
(1,4
04.8
98)
(789
.898
)(5
60.7
37)
(145
.000
)(3
,400
.000
)(2
,085
.000
)Cu
rrent
Deb
t - C
hang
es0.
000
0.00
0@
CF0.
000
0.00
00.
000
@CF
0.00
00.
000
0.00
00.
000
0.00
00.
000
Fina
ncin
g Act
ivitie
s - O
ther
(152
.859
)(1
38.9
63)
(126
.330
)(1
14.8
46)
(104
.405
)(9
0.70
6)(9
5.41
2)(9
.766
)(1
9.48
3)(5
6.12
7)(3
7.51
0)(4
.988
)(4
5.68
5)(3
0.65
6)(3
4.85
0)(8
5.89
5)(9
2.18
4)Fi
nanc
ing A
ctivi
ties -
Net
Cas
h Fl
ow(7
33.8
54)
(667
.140
)(6
06.4
91)
(551
.355
)(5
01.2
32)
(284
.428
)(7
8.48
1)15
7.85
22,
407.
213
(54.
818)
22.6
8613
8.03
3(8
7.10
9)(1
56.9
19)
(50.
804)
3,33
4.05
13,
090.
388
Exch
ange
Rat
e Effe
ct0.
000
0.00
00.
000
0.00
00.
000
0.00
00.
000
0.00
00.
000
0.00
00.
000
0.00
00.
000
Cash
and
Equi
vale
nts -
Cha
nge
502.
182
456.
529
415.
026
377.
297
342.
997
2.13
446
.503
(50.
362)
6.99
0(1
3.83
2)16
.143
50.9
2826
.237
(0.0
91)
4.79
10.
129
0.04
0
DIRE
CT O
PERA
TING
ACT
IVIT
IES
Inte
rest
Paid
- Ne
t56
5.31
551
3.92
346
7.20
342
4.73
038
6.11
828
0.01
898
.541
542.
775
345.
687
264.
141
77.5
1239
2.60
724
0.26
119
2.51
744
.209
343.
331
178.
194
Inco
me T
axes
Paid
0.91
80.
835
0.75
90.
690
0.62
70.
601
0.05
70.
000
0.00
00.
000
0.00
00.
014
0.01
40.
014
0.00
00.
366
0.30
6
Copy
right
: Sta
ndar
d &
Poo
r's, A
Divi
sion
of M
cGra
w-Hi
ll Co
mpa
nies
, Inc
.
QU
AR
TER
LY S
TATE
MEN
T O
F C
ASH
FLO
WS
($ M
ILLI
ON
S)

18
Table 12: Annual Ratio Analysis and Projections
LIN
N E
NE
RG
Y, L
LC
600
Trav
isH
oust
on, T
X 7
7002
Tick
er:
LIN
EFi
scal
Yea
r: 1
2D
ec18
Dec
17D
ec16
Dec
15D
ec14
Dec
13D
ec12
Dec
11D
ec10
Dec
09D
ec08
Dec
07D
ec06
Dec
05D
ec04
LIQ
UID
ITY
Cur
rent
Rat
io2.
552
2.31
82.
105
1.91
21.
737
0.65
10.
986
1.26
02.
256
1.95
62.
371
0.74
33.
867
0.40
40.
731
Qui
ck R
atio
0.43
90.
449
0.46
00.
471
0.48
20.
431
0.45
30.
579
1.33
50.
628
0.73
00.
605
1.42
70.
335
0.71
0W
orki
ng C
apita
l Per
Sha
re4.
960
4.03
93.
289
2.67
82.
181
(1.3
25)
(0.0
50)
0.72
22.
489
1.54
02.
859
(0.5
23)
1.20
7(1
.845
)(0
.097
)C
ash
Flow
Per
Sha
re24
.408
16.5
4811
.219
7.60
65.
157
3.53
81.
496
2.92
51.
704
3.28
51.
574
(0.3
94)
(0.1
59)
(1.0
61)
0.40
9--
----
----
----
---
----
----
----
----
----
----
----
----
----
----
----
----
----
----
----
----
----
----
----
----
----
----
----
---
----
----
----
-----
----
----
----
-----
----
----
-----
----
----
----
---
AC
TIV
ITY
Inve
ntor
y Tu
rnov
er@
NA
@N
A@
NA
@N
A@
NA
@N
A17
4.89
771
.327
74.1
8313
2.09
0@
NA
Rec
eiva
bles
Tur
nove
r42
.455
29.8
5620
.996
14.7
6510
.383
5.39
95.
345
6.91
65.
255
2.14
910
.120
(0.0
92)
10.5
48(2
.417
)@
NA
Tota
l Ass
et T
urno
ver
0.36
70.
349
0.33
30.
318
0.30
30.
166
0.18
00.
233
0.15
00.
060
0.33
7(0
.003
)0.
320
(0.1
37)
@N
AA
vera
ge C
olle
ctio
n Pe
riod
(Day
s)35
.153
67.6
0268
.294
52.7
7669
.461
169.
835
36.0
67(3
,980
.351
)34
.604
(150
.998
)@
NA
Day
s to
Sell
Inve
ntor
y0.
000
0.00
00.
000
0.00
00.
000
0.00
02.
087
5.11
74.
920
2.76
3@
NA
Ope
ratin
g C
ycle
(Day
s)34
.075
75.7
4176
.269
63.1
4186
.063
144.
068
36.3
46(6
,892
.238
)44
.718
(239
.264
)87
.596
----
----
----
---
----
----
----
----
----
----
----
----
----
----
----
----
----
----
----
----
----
----
----
----
----
----
----
---
----
----
----
-----
----
----
----
-----
----
----
----
-----
----
----
----
-PE
RFO
RM
AN
CE
Sale
s/N
et P
rope
rty, P
lant
& E
quip
0.38
40.
379
0.37
30.
368
0.36
30.
156
0.17
60.
233
0.15
30.
074
0.39
3(0
.002
)0.
253
(0.1
10)
0.22
1Sa
les/
Stoc
khol
der E
quity
0.74
20.
818
0.90
20.
995
1.09
70.
394
0.39
60.
473
0.27
70.
111
0.52
0(0
.004
)0.
424
0.56
52.
031
----
----
----
---
----
----
----
----
----
----
----
----
----
----
----
----
----
----
----
----
----
----
----
----
----
----
----
---
----
----
----
-----
----
----
----
-----
----
----
----
-----
----
----
----
-PR
OFI
TAB
ILIT
YO
pera
ting
Mar
gin
Bef
ore
Dep
r (%
)(3
,173
.669
)(8
92.4
83)
(250
.979
)(7
0.57
9)19
.848
26.9
8734
.152
70.4
8857
.260
(0.4
26)
79.8
292,
333.
121
66.5
2615
6.97
765
.410
Ope
ratin
g M
argi
n A
fter D
epr (
%)
(1,3
59.5
19)
(320
.717
)(7
5.65
9)(1
7.84
8)(4
.210
)(8
.968
)(0
.545
)49
.897
21.3
75(7
4.29
8)64
.198
3,64
1.17
754
.398
184.
521
48.1
75Pr
etax
Pro
fit M
argi
n (%
)(1
24.8
19)
(64.
640)
(33.
475)
(17.
335)
(8.9
77)
(29.
888)
(21.
899)
27.3
60(1
4.25
0)(1
09.8
53)
57.7
254,
985.
160
39.6
6521
2.51
5(1
8.28
8)N
et P
rofit
Mar
gin
(%)
(123
.723
)(6
4.37
2)(3
3.49
2)(1
7.42
6)(9
.066
)(2
9.79
3)(2
2.05
8)27
.023
(14.
799)
(109
.168
)69
.658
5,03
4.53
141
.446
212.
798
(18.
288)
Tax
Rat
e, E
ffect
ive
(%)
(0.6
54)
(0.7
25)
(0.8
05)
(0.8
94)
(0.9
92)
0.31
7(0
.727
)1.
231
(3.8
54)
1.40
70.
327
(0.9
90)
(4.4
89)
(0.1
33)
0.00
0
Ret
urn
on A
sset
s (%
)(4
.013
)(3
.652
)(3
.323
)(3
.023
)(2
.751
)(4
.189
)(3
.376
)5.
480
(1.9
26)
(6.8
16)
17.4
85(9
.597
)8.
642
(20.
158)
(3.7
41)
Ret
urn
on E
quity
(%)
(1,9
04.2
59)
(511
.898
)(1
37.6
07)
(36.
991)
(9.9
44)
(11.
735)
(8.7
33)
12.7
87(4
.099
)(1
2.06
5)29
.908
(17.
978)
17.5
5912
0.32
8(3
7.13
9)R
etur
n on
Inve
stm
ent (
%)
(211
.591
)(5
3.69
0)(1
3.62
3)(3
.457
)(0
.877
)(1
.019
)(0
.067
)7.
812
2.15
6(3
.000
)14
.604
(7.5
70)
11.8
14(2
0.15
0)@
NA
----
----
----
---
----
----
----
----
----
----
----
----
----
----
----
----
----
----
----
----
----
----
----
----
----
----
----
---
----
----
----
-----
----
----
----
-----
----
----
----
-----
----
----
----
-LE
VER
AG
EIn
tere
st C
over
age
Bef
ore
Tax
0.29
10.
281
0.27
00.
260
0.25
1(0
.639
)(0
.005
)2.
696
0.43
4(2
.226
)9.
682
(2.9
99)
3.97
3(6
.994
)(0
.127
)In
tere
st C
over
age
Afte
r Tax
0.28
20.
272
0.26
20.
253
0.24
3(0
.634
)(0
.012
)2.
675
0.41
2(2
.181
)9.
653
(3.0
39)
4.10
6(7
.004
)(0
.127
)
Long
-Ter
m D
ebt/C
omm
on E
quity
(%)
589.
488
464.
164
365.
483
287.
782
226.
600
152.
063
136.
381
116.
470
98.3
7564
.797
59.8
9771
.241
94.9
62(4
41.6
18)
679.
208
Long
-Ter
m D
ebt/S
hrhl
dr E
quity
(%)
589.
488
464.
164
365.
483
287.
782
226.
600
152.
063
136.
381
116.
470
98.3
7564
.797
59.8
9771
.241
94.9
62(4
41.6
18)
679.
208
Tota
l Deb
t/Inv
este
d C
apita
l (%
)69
4.94
039
0.63
521
9.58
112
3.43
069
.382
60.8
8557
.695
53.8
0449
.590
39.3
1937
.460
41.6
1548
.759
121.
326
87.1
75To
tal D
ebt/T
otal
Ass
ets (
%)
388.
707
246.
329
156.
102
98.9
2462
.689
55.5
6052
.726
49.9
2046
.230
36.6
0735
.018
38.0
4846
.830
95.3
0868
.471
Tota
l Ass
ets/
Com
mon
Equ
ity25
.579
15.6
839.
616
5.89
53.
615
2.80
22.
587
2.33
32.
128
1.77
01.
710
1.87
32.
032
(5.9
69)
9.92
8--
----
----
----
---
----
----
----
----
----
----
----
----
----
----
----
----
----
----
----
----
----
----
----
----
----
----
----
---
----
----
----
-----
----
----
----
-----
----
----
-----
----
----
----
---
DIV
IDEN
DS
Div
iden
d Pa
yout
(%)
(1,0
77.9
70)
(718
.647
)(4
79.0
98)
(319
.399
)(2
12.9
32)
(98.
684)
(154
.400
)10
6.39
7(3
19.9
91)
(101
.718
)29
.003
(42.
531)
40.4
82@
NA
@N
AD
ivid
end
Yie
ld (%
)@
NA
@N
A@
NA
@N
A@
NA
@N
A@
NA
@N
A@
NA
@N
A@
NA
Cop
yrig
ht: S
tand
ard
& P
oor's
, A D
ivisi
on o
f McG
raw
-Hill
Com
pani
es, I
nc.
AN
NU
AL
RA
TIO
RE
POR
T(R
atio
, Exc
ept A
s N
oted
)

19
Table 13: Comparative Income Statement as of 12/31/15
COMPARATIVE INCOME STATEMENT($ MILLIONS, EXCEPT PER SHARE)
LINN ENERGY,
LLC
CARRIZO OIL &
GAS INC.
ENERGEN
CORP.
CABOT OIL &
GAS
EQT
CORPORATION
Sep15 Dec15 Dec15 Dec15 Dec15
Sales 4,454.329 429.203 763.261 1,357.150 2,339.762Cost of Goods Sold 5,731.850 1,341.357 449.770 623.803 834.938
------------------- ------------------- ------------------- ------------------- -------------------Gross Profit (1,277.521) (912.154) 313.491 733.347 1,504.824Selling, General, & Administrative Exp. 427.863 67.224 @NA 96.904 @NA
------------------- ------------------- ------------------- ------------------- -------------------Operating Income Before Deprec. (1,705.384) (979.378) 313.491 636.443 1,504.824Depreciation,Depletion,&Amortization 879.343 300.035 600.897 737.086 819.216
------------------- ------------------- ------------------- ------------------- -------------------Operating Profit (2,584.727) (1,279.413) (287.406) (100.643) 685.608
Interest Expense 593.262 @NA 43.108 96.911 146.531Non-Operating Income/Expense 516.439 @NA (1,177.422) 10.281 9.953Special Items 213.527 (38.137) 27.200 0.000 (122.469)
------------------- ------------------- ------------------- ------------------- -------------------Pretax Income (2,448.023) (1,298.760) (1,480.736) (187.273) 426.561Total Income Taxes (5.917) (140.875) (535.005) (73.382) 104.675Minority Interest 0.000 0.000 0.000 @NA 236.715
------------------- ------------------- ------------------- ------------------- -------------------Income Before ExtraordinaryItems & Discontinued Operations (2,442.106) (1,157.885) (945.731) (113.891) 85.171Preferred Dividends 0.000 0.000 0.000 0.000 0.000
------------------- ------------------- ------------------- ------------------- -------------------Available for Common (2,442.106) (1,157.885) (945.731) (113.891) 85.171Savings Due to Common Stock Equiv. (3.909) 0.000 0.000 0.000 0.000
------------------- ------------------- ------------------- ------------------- -------------------Adjusted Available for Common (2,446.015) (1,157.885) (945.731) (113.891) 85.171Extraordinary Items 0.000 0.000 0.000 0.000 0.000Discontinued Operations 0.000 2.731 0.000 0.000 0.000
Adjusted Net Income (2,446.015) (1,155.154) (945.731) (113.891) 85.171
Earnings Per Share Basic -Excluding Extra Items & Disc Op (7.226) (22.502) (12.431) (0.275) 0.559
Earnings Per Share Basic -Including Extra Items & Disc Op (7.238) (22.449) (12.431) (0.275) 0.559
Earnings Per Share Diluted-Excluding Extra Items & Disc Op (7.226) (22.502) (12.431) (0.275) 0.557
Earnings Per Share Diluted -Including Extra Items & Disc Op (7.238) (22.449) (12.431) (0.275) 0.557
EPS Basic from Operations (7.658) (22.020) (12.660) (0.280) 0.850EPS Diluted from Operations (7.658) (22.020) (12.660) (0.280) 0.847Dividends Per Share 2.487 @NA 0.080 0.080 0.120
Com Shares for Basic EPS 337.954 51.457 76.078 413.696 152.398Com Shares for Diluted EPS 337.954 51.457 76.078 413.696 152.939
Copyright: Standard & Poor's, A Division of McGraw-Hill Companies, Inc.
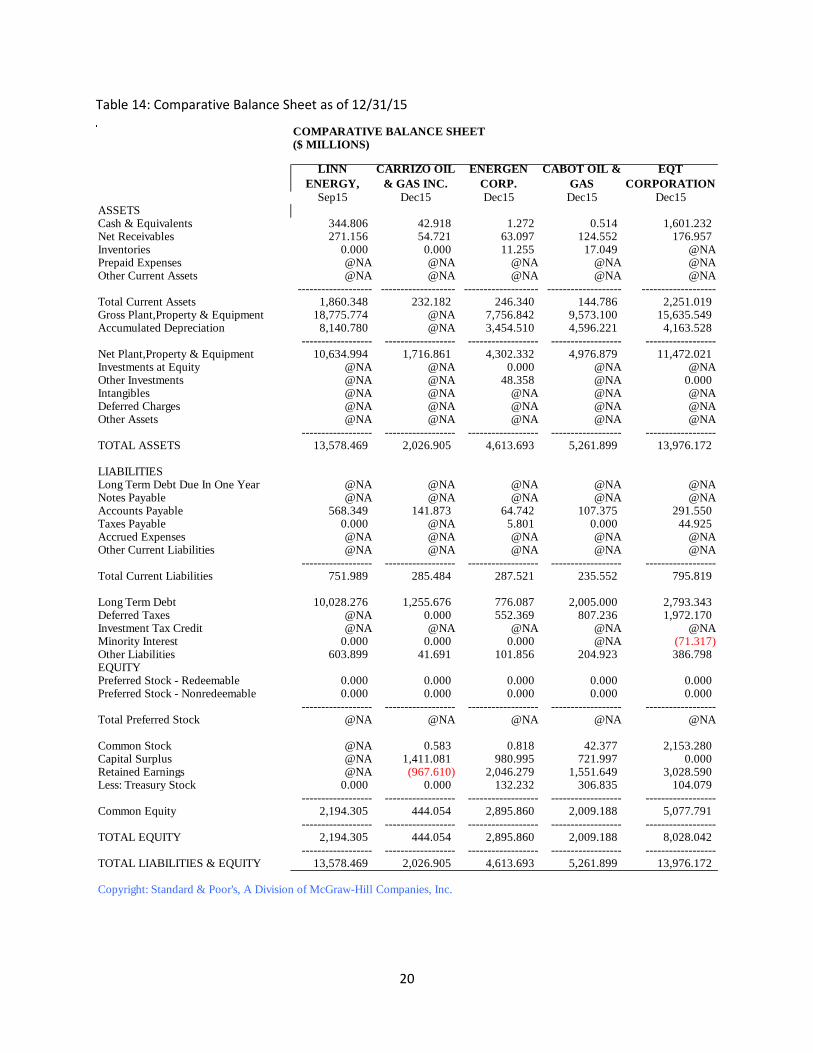
20
Table 14: Comparative Balance Sheet as of 12/31/15
COMPARATIVE BALANCE SHEET($ MILLIONS)
LINN
ENERGY,
CARRIZO OIL
& GAS INC.
ENERGEN
CORP.
CABOT OIL &
GAS
EQT
CORPORATION
Sep15 Dec15 Dec15 Dec15 Dec15ASSETSCash & Equivalents 344.806 42.918 1.272 0.514 1,601.232Net Receivables 271.156 54.721 63.097 124.552 176.957Inventories 0.000 0.000 11.255 17.049 @NAPrepaid Expenses @NA @NA @NA @NA @NAOther Current Assets @NA @NA @NA @NA @NA
------------------- ------------------- ------------------- ------------------- -------------------Total Current Assets 1,860.348 232.182 246.340 144.786 2,251.019Gross Plant,Property & Equipment 18,775.774 @NA 7,756.842 9,573.100 15,635.549Accumulated Depreciation 8,140.780 @NA 3,454.510 4,596.221 4,163.528
------------------ ------------------ ------------------ ------------------ ------------------Net Plant,Property & Equipment 10,634.994 1,716.861 4,302.332 4,976.879 11,472.021Investments at Equity @NA @NA 0.000 @NA @NAOther Investments @NA @NA 48.358 @NA 0.000Intangibles @NA @NA @NA @NA @NADeferred Charges @NA @NA @NA @NA @NAOther Assets @NA @NA @NA @NA @NA
------------------ ------------------ ------------------ ------------------ ------------------TOTAL ASSETS 13,578.469 2,026.905 4,613.693 5,261.899 13,976.172
LIABILITIESLong Term Debt Due In One Year @NA @NA @NA @NA @NANotes Payable @NA @NA @NA @NA @NAAccounts Payable 568.349 141.873 64.742 107.375 291.550Taxes Payable 0.000 @NA 5.801 0.000 44.925Accrued Expenses @NA @NA @NA @NA @NAOther Current Liabilities @NA @NA @NA @NA @NA
------------------ ------------------ ------------------ ------------------ ------------------Total Current Liabilities 751.989 285.484 287.521 235.552 795.819
Long Term Debt 10,028.276 1,255.676 776.087 2,005.000 2,793.343Deferred Taxes @NA 0.000 552.369 807.236 1,972.170Investment Tax Credit @NA @NA @NA @NA @NAMinority Interest 0.000 0.000 0.000 @NA (71.317)Other Liabilities 603.899 41.691 101.856 204.923 386.798EQUITYPreferred Stock - Redeemable 0.000 0.000 0.000 0.000 0.000Preferred Stock - Nonredeemable 0.000 0.000 0.000 0.000 0.000
------------------ ------------------ ------------------ ------------------ ------------------Total Preferred Stock @NA @NA @NA @NA @NA
Common Stock @NA 0.583 0.818 42.377 2,153.280Capital Surplus @NA 1,411.081 980.995 721.997 0.000Retained Earnings @NA (967.610) 2,046.279 1,551.649 3,028.590Less: Treasury Stock 0.000 0.000 132.232 306.835 104.079
------------------ ------------------ ------------------ ------------------ ------------------Common Equity 2,194.305 444.054 2,895.860 2,009.188 5,077.791
------------------ ------------------ ------------------ ------------------ ------------------TOTAL EQUITY 2,194.305 444.054 2,895.860 2,009.188 8,028.042
------------------ ------------------ ------------------ ------------------ ------------------TOTAL LIABILITIES & EQUITY 13,578.469 2,026.905 4,613.693 5,261.899 13,976.172
Copyright: Standard & Poor's, A Division of McGraw-Hill Companies, Inc.

21
Table 15: Comparative Ratio Report as of 12/31/15
COMPARATIVE RATIO REPORT(RATIO, EXCEPT AS NOTED)
LINN
ENERGY,
CARRIZO OIL
& GAS INC.
ENERGEN
CORP.
CABOT OIL &
GAS
EQT
CORPORATION
Dec14 Dec15 Dec15 Dec15 Dec15LIQUIDITYCurrent Ratio 1.737 0.813 0.857 0.615 2.829Quick Ratio 0.482 0.342 0.224 0.531 2.234Working Capital Per Share 2.181 (0.914) (0.523) (0.219) 9.539Cash Flow Per Share 5.157 6.493 9.075 1.790 7.977
ACTIVITYInventory Turnover @NA @NA 35.268 40.148 402.865Receivables Turnover 10.383 5.889 6.914 7.832 9.688Total Asset Turnover 0.303 0.171 0.142 0.254 0.180Average Collection Per (Days) 35.153 61.981 52.789 46.602 37.677Days to Sell Inventory 0.000 0.000 10.349 9.091 0.906Operating Cycle (Days) 34.075 45.898 38.769 42.878 @CF
PERFORMANCESales/Net PP&E 0.363 0.250 0.177 0.273 0.204Sales/Stockholder Equity 1.097 0.967 0.264 0.675 0.461
PROFITABILITYOper.Margin Before Depr (%) 19.848 (228.185) 41.073 46.896 64.315Oper.Margin After Depr (%) (4.210) (298.090) (37.655) (7.416) 29.302Pretax Profit Margin (%) (8.977) (302.598) (194.001) (13.799) 18.231Net Profit Margin (%) (9.066) (269.139) (123.907) (8.392) 3.640
Return on Assets (%) (2.751) (57.126) (20.498) (2.164) 0.609Return on Equity (%) (9.944) (260.753) (32.658) (5.669) 1.677Return on Investment (%) (0.877) (38.495) (4.422) (1.587) 4.184
LEVERAGEInterest Coverage Before Tax 0.251 (17.770) (33.349) (0.932) 3.319Interest Coverage After Tax 0.243 (15.734) (20.939) (0.175) 1.463
Long-Term Debt/Common Eq.(%) 226.600 282.776 26.800 99.792 55.011Long-Term Debt/Shrhldr Eq.(%) 226.600 282.776 26.800 99.792 34.795
Total Debt/Invested Cap.(%) 69.382 73.875 21.136 50.196 27.808Total Debt/Total Assets (%) 62.689 61.950 16.821 38.484 22.126Total Assets/Common Equity 3.615 4.565 1.593 2.619 2.752
DIVIDENDSDividend Payout (%) 40.482 @NA 21.553 5.891 31.932Dividend Yield (%) @NA @NA @NA @NA @NA
Copyright: Standard & Poor's, A Division of McGraw-Hill Companies, Inc.

22
Figure 16: Company Structure Comparison
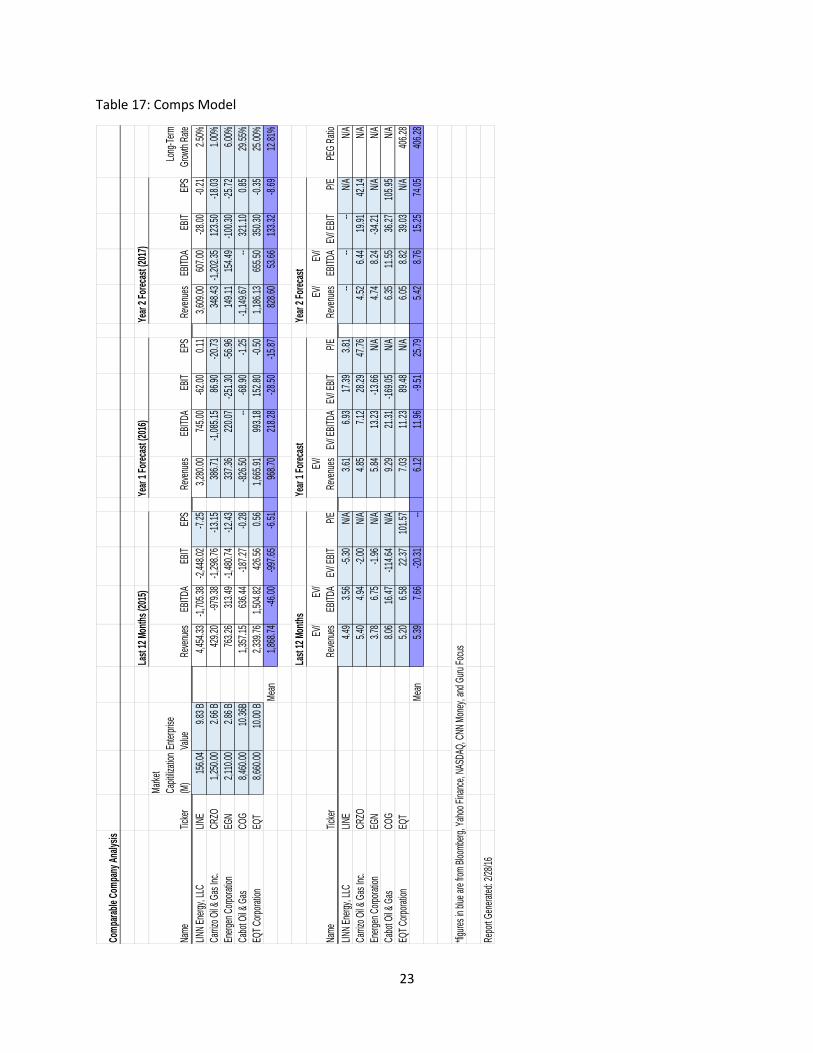
23
Table 17: Comps Model
Com
para
ble
Com
pany
Ana
lysi
s
Last
12
Mon
ths
(201
5)Ye
ar 1
For
ecas
t (20
16)
Year
2 F
orec
ast (
2017
)
Nam
eTi
cker
Mar
ket
Capi
tiliza
tion
(M)
Ente
rpris
e
Valu
eRe
venu
esEB
ITDA
EBIT
EPS
Reve
nues
EBIT
DAEB
ITEP
SRe
venu
esEB
ITDA
EBIT
EPS
Long
-Ter
m
Gro
wth
Rate
LINN
Ene
rgy,
LLC
LINE
156.
049.
83 B
4,45
4.33
-1,7
05.3
8-2
,448
.02
-7.2
53,
280.
0074
5.00
-62.
000.
113,
609.
0060
7.00
-28.
00-0
.21
2.50
%
Carri
zo O
il & G
as In
c.CR
ZO1,
250.
002.
66 B
429.
20-9
79.3
8-1
,298
.76
-13.
1538
6.71
-1,0
85.1
586
.90
-20.
7334
8.43
-1,2
02.3
512
3.50
-18.
031.
00%
Ener
gen
Corp
orat
ion
EGN
2,11
0.00
2.86
B76
3.26
313.
49-1
,480
.74
-12.
4333
7.36
220.
07-2
51.3
0-5
6.96
149.
1115
4.49
-100
.30
-25.
726.
00%
Cabo
t Oil &
Gas
COG
8,46
0.00
10.3
6B1,
357.
1563
6.44
-187
.27
-0.2
8-8
26.5
0--
-68.
90-1
.25
-1,1
49.6
7--
321.
100.
8529
.55%
EQT
Corp
orat
ion
EQT
8,66
0.00
10.0
0 B
2,33
9.76
1,50
4.82
426.
560.
561,
665.
9199
3.18
152.
80-0
.50
1,18
6.13
655.
5035
0.30
-0.3
525
.00%
Mea
n1,
868.
74-4
6.00
-997
.65
-6.5
196
8.70
218.
28-2
8.50
-15.
8782
8.60
53.6
613
3.32
-8.6
912
.81%
Last
12
Mon
ths
Year
1 F
orec
ast
Year
2 F
orec
ast
Nam
eTi
cker
EV/
Reve
nues
EV/
EBIT
DAEV
/ EBI
TP/
E
EV/
Reve
nues
EV/ E
BITD
AEV
/ EBI
TP/
E
EV/
Reve
nues
EV/
EBIT
DAEV
/ EBI
TP/
EPE
G R
atio
LINN
Ene
rgy,
LLC
LINE
4.49
3.56
-5.3
0N/
A3.
616.
9317
.39
3.81
----
--N/
AN/
A
Carri
zo O
il & G
as In
c.CR
ZO5.
404.
94-2
.00
N/A
4.85
7.12
28.2
947
.76
4.52
6.44
19.9
142
.14
N/A
Ener
gen
Corp
orat
ion
EGN
3.78
6.75
-1.9
6N/
A5.
8413
.23
-13.
66N/
A4.
748.
24-3
4.21
N/A
N/A
Cabo
t Oil &
Gas
COG
8.06
16.4
7-1
14.6
4N/
A9.
2921
.31
-169
.05
N/A
6.35
11.5
536
.27
105.
95N/
A
EQT
Corp
orat
ion
EQT
5.20
6.58
22.3
710
1.57
7.03
11.2
389
.48
N/A
6.05
8.82
39.0
3N/
A40
6.28
Mea
n5.
397.
66-2
0.31
--6.
1211
.96
-9.5
125
.79
5.42
8.76
15.2
574
.05
406.
28
*figu
res
in b
lue
are
from
Blo
ombe
rg, Y
ahoo
Fin
ance
, NAS
DAQ
, CNN
Mon
ey, a
nd G
uru
Focu
s
Repo
rt G
ener
ated
: 2/2
8/16
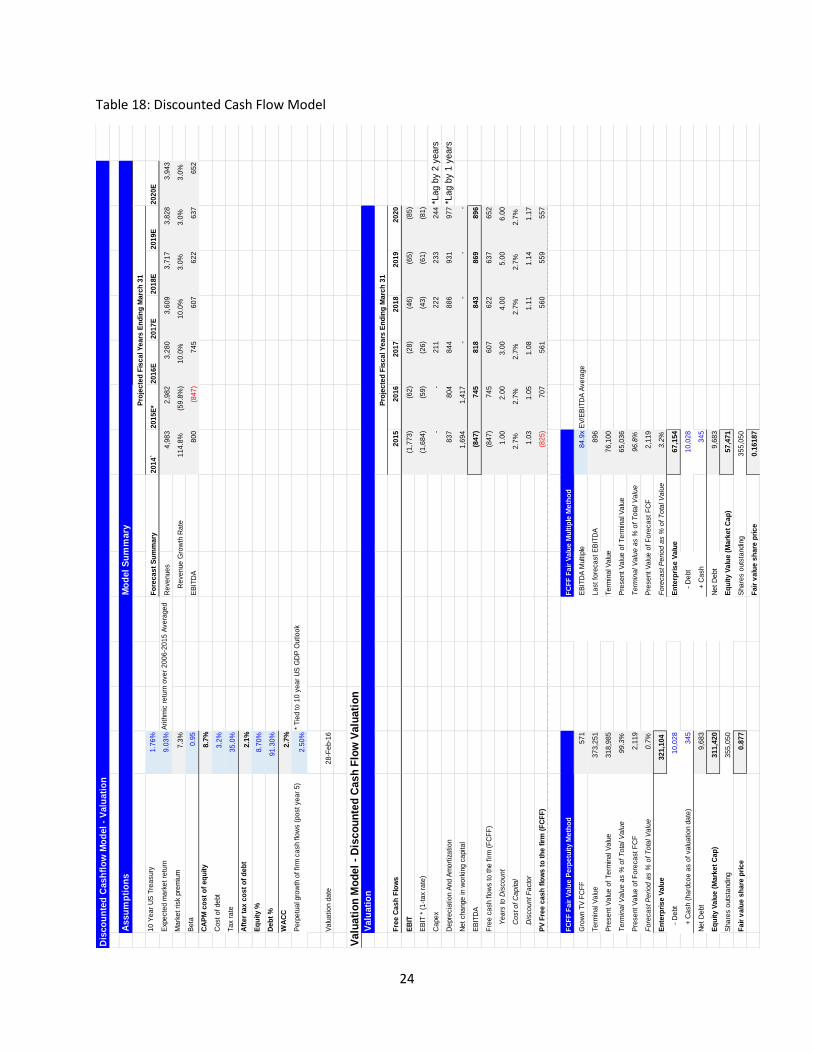
24
Table 18: Discounted Cash Flow Model
Dis
co
un
ted
Cash
flo
w M
od
el
- V
alu
ati
on
Assu
mp
tio
ns
Mo
del
Su
mm
ary
Pro
jec
ted
Fis
ca
l Y
ea
rs E
nd
ing
Ma
rch
31
10
Ye
ar
US
Tre
asury
1.7
6%
Fo
rec
as
t S
um
ma
ry2
01
4`
20
15
E*
20
16
E2
01
7E
20
18
E2
01
9E
20
20
E
Exp
ecte
d m
ark
et
retu
rn9
.03
%A
rith
mic
re
turn
ove
r 2
00
6-2
01
5 A
ve
rage
dR
eve
nue
s4
,98
32
,98
23
,28
03
,60
93
,71
73
,82
83
,94
3
Ma
rke
t ri
sk
pre
miu
m7
.3%
Re
ve
nue
Gro
wth
Ra
te1
14
.8%
(59
.8%
)1
0.0
%1
0.0
%3
.0%
3.0
%3
.0%
Be
ta0
.95
EB
ITD
A8
00
(84
7)
74
56
07
62
26
37
65
2
CA
PM
co
st
of
eq
uit
y8
.7%
Co
st
of
de
bt
3.2
%
Ta
x ra
te3
5.0
%
Aft
er
tax
co
st
of
de
bt
2.1
%
Eq
uit
y %
8.7
0%
De
bt
%9
1.3
0%
WA
CC
2.7
%
Pe
rpe
tua
l gro
wth
of
firm
ca
sh f
low
s (
po
st
ye
ar
5)
2.5
0%
* T
ied t
o 1
0 y
ea
r U
S G
DP
Outlo
ok
Va
lua
tio
n d
ate
28
-Fe
b-1
6
Va
lua
tio
n M
od
el
- D
isc
ou
nte
d C
as
h F
low
Va
lua
tio
nV
alu
ati
on
Pro
jec
ted
Fis
ca
l Y
ea
rs E
nd
ing
Ma
rch
31
Fre
e C
as
h F
low
s2
01
52
01
62
01
72
01
82
01
92
02
0
EB
IT(1
,77
3)
(62
)(2
8)
(46
)(6
5)
(85
)
EB
IT *
(1
-ta
x ra
te)
(1,6
84
)(5
9)
(26
)(4
3)
(61
)(8
1)
Ca
pe
x-
-2
11
22
22
33
24
4*L
ag b
y 2
years
De
pre
cia
tio
n A
nd A
mo
rtiz
atio
n8
37
80
48
44
88
69
31
97
7*L
ag b
y 1
years
Ne
t cha
nge
in w
ork
ing c
apita
l1
,69
41
,41
7-
--
-
EB
ITD
A(8
47
)7
45
81
88
43
86
98
96
Fre
e c
ash f
low
s t
o t
he
fir
m (
FC
FF
)(8
47
)7
45
60
76
22
63
76
52
Ye
ars
to
Dis
co
un
t1
.00
2.0
03
.00
4.0
05
.00
6.0
0
Co
st o
f C
ap
ital
2.7
%2
.7%
2.7
%2
.7%
2.7
%2
.7%
Dis
co
un
t F
acto
r1
.03
1.0
51
.08
1.1
11
.14
1.1
7
PV
Fre
e c
as
h f
low
s t
o t
he
fir
m (
FC
FF
)(8
25
)7
07
56
15
60
55
95
57
FC
FF
Fa
ir V
alu
e P
erp
etu
ity M
eth
od
FC
FF
Fa
ir V
alu
e M
ult
iple
Me
tho
d
Gro
wn T
V F
CF
F5
71
EB
ITD
A M
ulti
ple
84
.9x
EV
/EB
ITD
A A
ve
rage
Te
rmin
al V
alu
e
37
3,2
51
La
st
fore
ca
st
EB
ITD
A8
96
Pre
se
nt
Va
lue
of
Te
rmin
al V
alu
e3
18
,98
5T
erm
ina
l Va
lue
76
,10
0
Te
rmin
al V
alu
e a
s %
of
To
tal V
alu
e9
9.3
%P
rese
nt
Va
lue
of
Te
rmin
al V
alu
e6
5,0
36
Pre
se
nt
Va
lue
of
Fo
reca
st
FC
F2
,11
9T
erm
ina
l V
alu
e a
s %
of
To
tal V
alu
e9
6.8
%
Fo
reca
st P
eri
od
as %
of
To
tal V
alu
e0
.7%
Pre
se
nt
Va
lue
of
Fo
reca
st
FC
F2
,11
9
En
terp
ris
e V
alu
e3
21
,10
4F
ore
ca
st P
eri
od
as %
of
To
tal V
alu
e3
.2%
- D
ebt
10
,02
8E
nte
rpri
se
Va
lue
67
,15
4
+ C
ash (
ha
rdco
e a
s o
f va
lua
tio
n d
ate
)3
45
- D
ebt
10
,02
8
Ne
t D
ebt
9,6
83
+ C
ash
34
5
Eq
uit
y V
alu
e (
Ma
rke
t C
ap
)3
11
,42
0N
et
De
bt
9,6
83
Sha
res o
uts
tandin
g3
55
,05
0E
qu
ity V
alu
e (
Ma
rke
t C
ap
)5
7,4
71
Fa
ir v
alu
e s
ha
re p
ric
e0
.87
7S
ha
res o
uts
tandin
g3
55
,05
0
Fa
ir v
alu
e s
ha
re p
ric
e0
.16
18
7
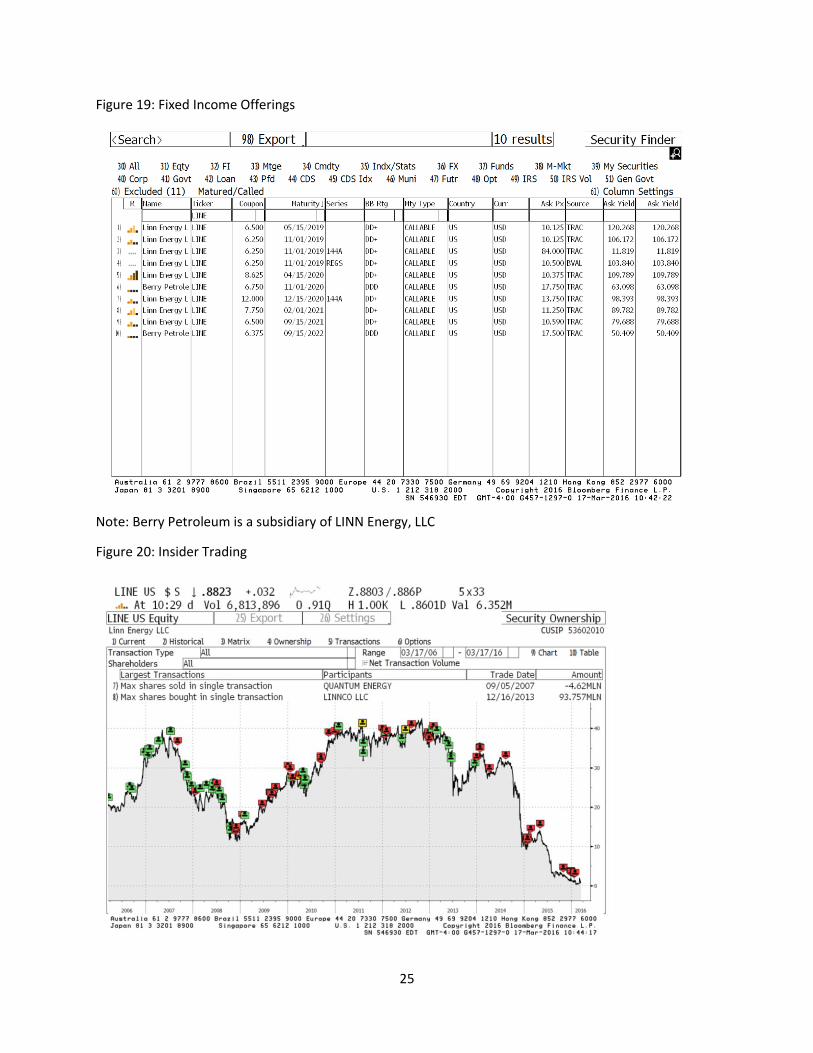
25
Figure 19: Fixed Income Offerings
Note: Berry Petroleum is a subsidiary of LINN Energy, LLC
Figure 20: Insider Trading

26
Figure 21: Specifics of LINN Energy Oil Hedging Positions as of 12/31/15
Figure 22: Specifics of LINN Energy Natural Gas Hedging Positions as of 12/31/15
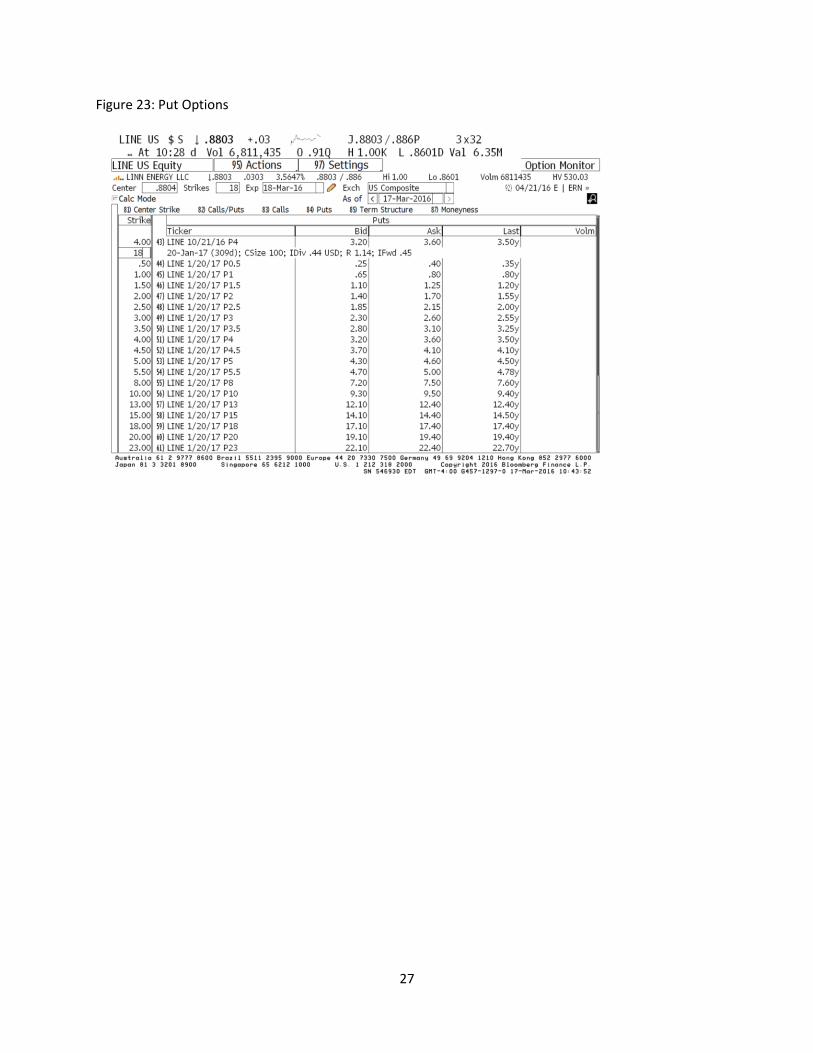
27
Figure 23: Put Options