Heavy-Section Steel Irradiation (HSSI) Program, Metals …/67531/metadc621071/m2/1/high... ·...
53
oRNL/NRc/LTR-99/lo Contract Program or Project Title: Subject of this Documenti Type of Documenti Author: Date of Documenti Responsible NRC Individual and NRC Office or Division: Heavy-Section Steel Irradiation (HSSI) Program, Metals and Ceramics Division Initial Evaluation of the Heat-Affected Zone, Local Embrittlement Phenomenon as it Applies to Nuclear Reactor Vessels Letter Report D. E. McCabe September 1999 . C. J. Fairbanks (301415-6719) Division of Engineering Technology U.S. Nuclear Regulatory Commission Prepared for the U.S. Nuclear Regulatory Commission Washington, DC 20555 Under Interagency Agreement DOE 1886-N695-3W NRC JCN W6953 OAK RIDGE NATIONAL LABORATORY Oak Ridge, TN 37831-6151 managed by LOCKHEED MARTIN ENERGY RESEARCH CORP. for the U.S. Department of Energy under Contract No. DE-AC05-960R22464 ... I
Transcript of Heavy-Section Steel Irradiation (HSSI) Program, Metals …/67531/metadc621071/m2/1/high... ·...

oRNL/NRc/LTR-99/lo
Contract Program orProject Title:
Subject of this Documenti
Type of Documenti
Author:
Date of Documenti
Responsible NRC Individualand NRC Office or Division:
Heavy-Section Steel Irradiation (HSSI)Program, Metals and Ceramics Division
Initial Evaluation of the Heat-Affected Zone,Local Embrittlement Phenomenon as it Appliesto Nuclear Reactor Vessels
Letter Report
D. E. McCabe
September 1999 .
C. J. Fairbanks (301415-6719)Division of Engineering TechnologyU.S. Nuclear Regulatory Commission
Prepared for theU.S. Nuclear Regulatory Commission
Washington, DC 20555Under Interagency Agreement DOE 1886-N695-3W
NRC JCN W6953
OAK RIDGE NATIONAL LABORATORYOak Ridge, TN 37831-6151
managed byLOCKHEED MARTIN ENERGY RESEARCH CORP.
for theU.S. Department of Energy
under Contract No. DE-AC05-960R22464
... I

e
.
This report has been reproduced from the best available copy.
Reports are available to the public from the following source.National Technical Information Service5285 Port Royal RoadSpringfield, VA 22161Telephone 703-605-6000 (1-800-553-6847)TDD 703-487-4639Fax 703-605-6900E-mail orders @ntis.fedworld.govWeb site http//www.ntis. gov/ordering.htm
Reports are available to U.S. Department of Energy (DOE) employees, DOE contractors, EnergyTechnology Data Exchange (ETDE) representatives, and International Nuclear Information System(INIS) representatives from the following source.
Office of Scientific and Technical InformationP.O. BOX 62Oak Ridge, TN 37831Telephone 423-576-8401Fax 423-576-5728E-mail reports@ adonis.osti.govWeb site http//www.osti. gov/products/sources. html
Reports produced after January 1, 1996, are generally available via the DOE Information Bridge.Web site http:llw.doe.govlbridge
This report was prepared as an account of work sponsored by anagency of the United States government. Neither the United Statesgovernment nor any agency thereof, nor any of their employees, makesany warranty, express or implied, or assumes any legal liability orresponsibility for the accuracy, completeness, or usefulness of anyinformation, apparatus, product, or process disclosed, or representsthat its use would not infringe privately owned rights. Reference hereinto any specific commercial product, process, or service by trade name,trademark, manufacturer, or otherwise, does not necessarily constituteor imply its endorsement, recommendation, or favoring by the UnitedStates government or any agency thereof. The views and opinions ofauthors expressed herein do not necessarily state or reflect those ofthe United States government or any agency thereof.
.
.
—. -.

DISCLAIMER
Portions of this document may be illegible
in electronic image products. Images areproduced from the best available originaldocument.
----- . -->, .,, .,, .,.,.,,, . . . . . ..,..> ,., .,,.., ,7%..“ ---- —.. .. . .-

INITIAL EVALUATION OF THE HEAT-AFFECTED ZONE, LOCALEMBRITTLEMENT PHENOMENON AS IT APPLIES
TO NUCLEAR REACTOR VESSELS
D. E. McCabe
Date Published—September 1999
Prepared for theU.S. Nuclear RegulatoryCommission
Washington, DC 20555Under Interagency Agreement DOE 1886-N695-3W
NRC JCN W6953
OAK RIDGE NATIONAL lABORATORYOak Ridge, TN 37831-6151
managed byLOCKHEED MARTIN ENERGY RESEARCH CORP.
for theU.S. Department of Energy
under Contract No. DE-AC05-960R22464
,.

oRNuNRc/LTR-99/lo ii

.
ABSTRACT . . . . . . . . . . . . . . . . . . . . . . . . . . . . . . . . . .
BACKGROUND . . . . . . . . . . . . . . . . . . . . . . . . . . . . . . .
REVIEW OF EXISTING LBZ INFORMATION . . . . . . . .
Assessment of Commonality . . . . . . . . . . .
LBZ in RPV Steels . . . . . .
ORNL Evaluation Followup
Program Plan . . . . . . . . . .
Results . . . . . . . . . . . . . . .
. . . . . . . . . . . . .
. . . . . . . . . . . . .
. . . . . . . . . . . . .
. . . . . . . . . . . . .
Measurement of Element Diffusion to Grain
Discussion . . . . . . . . . . . . . . . . . . . . . . . . .
CONCLUSIONS . . . . . . . . . . . . . . . . . . . . .
ACKNOWLEDGMENTS . . . . . . . . . . . . . . .
REFERENCES . . . . . . . . . . . . . . . . . . . . . .
. . . . . . . . . .
. . . . . . . . . .
. . . . . . . . . .
. . . . . . . . . .
. . . . . . . . . .
Boundaries
. . . . . . . . . .
. . . . . . . . . .
. . . . . . . . . .
. . . . . . . . . .
. . . . . . . . . . . . . . . . . .
. . . . . . . . . . . . . . . . . .
. . . . . . . . . . . . . . . . . .
. . . . . . . . . . . . . . . . . .
. . . . . . . . . . . . . . . . . .
. . . . . . . . . . . . . . . . . .
. . . . . . . . . . . . . . . . . .
. . . . . . . . . . . . . . . . . .
. . . . . . . . . . . . . . . . . .
. . . . . . . . . . . . . . . . . .
. . . . . . . . . . . . . . . . . .
. . . . . . . . . . . . . . . . . .
. . . . . . . . . . . . . . . . . .
Appendix Examples ofHAZCoarse Grains Along Fusion Line, Fine Prior-Austenite Grain Zones, and Base Metal Grains from ThreeSelected Commercial Welds . . . . . . . . . . . . . . . . . . . . . . . . . . . . . .
Page
1
1
1
5
7
7
11
12
20
25
28
28
29
A-1
...Ill oRNuNRc/LTR-99/lo
. .. ., — ., r,- . . . . . . . . . .- . ..- —mT-———— ~..

oRNL/NRc/LTR-99/lo iv

PageFigure
1
2
3
4
5
6
7
8
9
10
11
Schematic representation of microstructure localtothe HAZofmultipass welds .,..... . . . . . . . . . . . . . . . . . . .
Cumulative number of chemical samplings made on RPV basemetals versus the phosphorus content . . . . . . . . . . . . . . . . . . .
Example of the as oil-quenched microstructure after theAEA-Technology austenitization and quench cycle, A 533grade B,lOOX . . . . . . . . . . . . . . . . . . . . . . . . . . . . . . . . . . . . . .
Example of the typical microstructure after the AEA-Technologyaustenitization and PWHT, A 533 grade B, lOOX . . . . . . . . . . .
Relationship between initial TOtemperature and ATOafter2000-h aging at450°C . . . . . . . . . . . . . . . . . . . . . . . . . . . . . . .
Gleeble-generated weld thermal cycle to develop ASTM 4.5grain size . . . . . . . . . . . . . . . . . . . . . . . . . . . . . . . . . . . . . . . . . .
Photomicrograph of microstructure after Gleeble austenitization,high-phosphorus modified A 302 grade B, nital etch, IOOX . . .
Position of CVN TOtemperatures after aging 168 h at 399”C,450°C, and 482°C for 2000 h at 450”C (MA302B standsformodified A302grade B) . . . . . . . . . . . . . . . . . . . . . . . . . . .
Intergranular fracture of A 533 grade B steel after Gleebleaustenitization, PWHT, and 200 h aging at 450”C. CharpyIowershelf testtemperature . . . . . . . . . . . . . . . . . . . . . . . . . . .
Phosphorous concentrations in bulk material and grainboundaries. Auger analyses after 2000 h at 450”C temperembrittlement . . . . . . . . . . . . . . . . . . . . . . . . . . . . . . . . . . . . .
Fracture surface of material shown in Fig. 9 when testedatanupper shelf temperature.. . . . . . . . . . . . . . . . . . . . . . . .
4
8
13
13
15
17
17
19
22
23
24
v oRNL/NRc/LTR-99/lo

oRNL/NRc/LTR-99/lo vi

LIST OF TABLES
Table
1
2
3
4
5
6
7
8
9
10
Page
Midtransition temperatures and shifts measured by AEAwith CVN specimens . . . . . . . . . . . . . . . . . . . . . . . . . . . . . . . . . . . 7
Commercial materials selected . . . . . . . . . . . . . . . . . . . . . . . . . . . 8
Summary ofchemical analyses . . . . . . . . . . . . . . . . . . . . . . . . . . 9
Heat-treatmentcycles . . . . . . . . . . . . . . . . . . . . . . . . . . . . . . . . . . 10
Grain sizes of the commercially made RPV base metal in theiras-received condition . . . . . . . . . . . . . . . . . . . . . . . . . . . . . . . . . . 10
Revisit of AEA cycles used on five commercially made RPVsteels; Phase ltransition temperatures, TO(OC) . . . . . . . . . . . . . . 14
Materials austenitized by Gleeble, PWHT, and agedcommercially made RPV steels (Phase II and first partof Phase 111combined) . . . . . . . . . . . . . . . . . . . . . . . . . . . . . . . . . 18
Largest coarse-grain sizes found in HAZS of six commerciallyfabricated RPVwelds . . . . . . . . . . . . . . . . . . . . . . . . . . . . . . . . . . 20
Measured increased contents, percent increase of selectedelements; grain boundary vs bulk contents . . . . . . . . . . . . . . . . . . 21
Comparison of Charpy V TOand fracture-mechanics-based TIOOtemperatures . . . . . . . . . . . . . . . . . . . . . . . . . . . . . . . . . . . . . . . . . 27
vii oRNL/NRc/LTR-99/lo~
----- -..— ----- . .-..—— —.

oRNL/NRc/LTR-99/lo...
Vlll

Initial Evaluation of the Heat-Affected Zone, Local Embrittlement
Phenomenon as It Applies to Nuclear Reactor Vessels
D. E. McCabe
ABSTRACT
The objective of this project was to determine if the local britile zone (LBZ) problem,
encountered in the testing of the heat-affected zone (HAZ) part of welds in offshore
platform construction, can also be found in reactor pressure vessel (RPV) welds. Both
structures have multipass welds and grain coarsening along the fusion line. Literature
was obtained that described the metallurgical evidence and the type of research work
performed on offshore structure welds. It was determined that other than having multi-
pass welding and coarse prior-austenite grains along the fusion line, there was little
else upon which to connect RPV weldments to the LBZ problem in offshore structures.
However, coarse prior-austenite grains make RPV steels susceptible to temper
embrittlement, an entirely different embrittlement mechanism. Experiments were
undertaken to evaluate the potential for temper embrittlement problems in RPV HAZ
materials. Enlarged prior-austenite grains were made in bulk using laboratory furnace
treatments and in weld cycle simulations using the Gleeble. Five commercially made
RPV steels were used in the present study. Embrittlement aging was petiormed at
various temperatures and times. RPV steels with large prior-austenite grain sizes were
found to suffer significant temper embrittlement with thermal aging. Because of high
carbon equivalent and routine postweld heat treatment that was standard manufactur-
ing practice for RPV production, this project could not make a case that an LBZ type of
problem exists in reactor vessels. A final phase of this investigation is to examine the
effect of simultaneous irradiation and thermal aging at 288°C (550°F), which can create
a critical damage situation. The irradiation exposure is currently in progress.
1 oRNuNRc/LTR-99/lo

[n 1989, Combustion Engineering proposed to the U.S. Nuclear Regulatory Commis-
sion (NRC) that consideration be given to replacing the fracture-toughness-based
dynamic Kl~ curve with the quasi-static K,Ccurve for setting allowable temperature/
pressure limits during normal and upset conditions.* The idea was accepted for consid-
eration pending the development of clear evidence that there can be no unanticipated
trigger sources that would introduce running cleavage cracks.
Such trigger sources could be either crack pop-ins or possibly local brittle zones (LBZS)
that reside along the fusion line of multipass weldments. The existence of LBZS was
suggested as one of the possibilities for reactor pressure vessel (RPV) weldments.
The objectives of the present project were to (1) review the available LBZ information,
(2) determine its applicability to nuclear vessel fabrication and service conditions, and
(3) conduct experiments in support of the evaluations.
REVIEW OF EXISTING LBZ INFORMATION
LBZS in multipass weldments have so far been identified only in offshore platform
weldments.”2 At first, offshore platforms were constructed with carbon/manganese
grades of steel. Multipass welds in these materials require postweld heat treatment
(PWHT) to obtain satisfactory heat-affected zone (HAZ) fracture-toughness properties.
Later, in the early 1980s, the preferred plate material shifted to low-~arbon micro-
alloyed steels.3 The advantages were clear. Microalloyed steels are given controlled
hot-rolling practices to achieve outstanding fracture-toughness properties while retain-
ing good strength properties. At temperatures as low as –40”C (–40” F), these materials
are on the upper shelf of fracture toughness as measured by the Charpy V-notch (CVN)
tests, and the energy is typically 260 to 280 J (190 to 205 ft-lb).4 Additionally, the low-
carbon content, usually below 0.1 wt Yo, promotes excellent weldability. The greatest
*R K. Nanstad, Travel to Rockville, Ma@and, for meeting at the U.S. Nuclear Regulatory Commission, January 9, 1990.
oRNL/NRc/LTR-99/lo 2
advantage is that no PWHT is required, resulting in highly significant construction cost
savings.
The petroleum industry performs fracture-toughness determinations by a crack tip
opening displacement (CTOD) test method.5 This is a pseudo-fracture-mechanics test
method in which a linear displacement measurement at the tip of a fatigue precrack is
assumed to have a linear relationship with the fracture-mechanics-based J-integral. A
fatigue-precracked bend bar specimen is used. For LBZ evaluations, the precrack is
meticulously positioned to be in a grain-coarsened region along the weld fusion line. In
replicate tests, some specimens suffer only ductile deformation and consequent
slow-stable crack growth.
Two petroleum industry organizations that implement this test procedure in their stan-
dards are the American Petroleum InstituteGand the Engineering Equipment and Mate-
rials Users Association.7 The standards are used to qualify a steel manufacturer as a
certified producer of LBZ-resistant microalloyed steel. All valid LBZ specimens accord-
ing to these methods must have a minimum of 15% coarse grain material along the
crack tip. Coarse grain size is generally indicated by American Society for Testing and
Materials (ASTM) to be 4.5 or numerically lower. Not all coarse grain material is
embrittled material so that proof of a material’s susceptibility to LBZ failures in HAZS is
never absolute. Weld joint preparation is either “K’: type or “half-K” type, with the inten-
tion of making the straightest possible HAZ for test specimen positioning.8
Research projects designed to evaluate LBZ damage mechanisms generally use elec-
tric resistance heating of specimen blanks to simulate material that has been through a
weld pass cycle.9’10’11Brittle-zone microstructure are created in sufficient bulk to
develop reliable Charpy transition curves that represent the various microstructure
identified within the LBZ region.
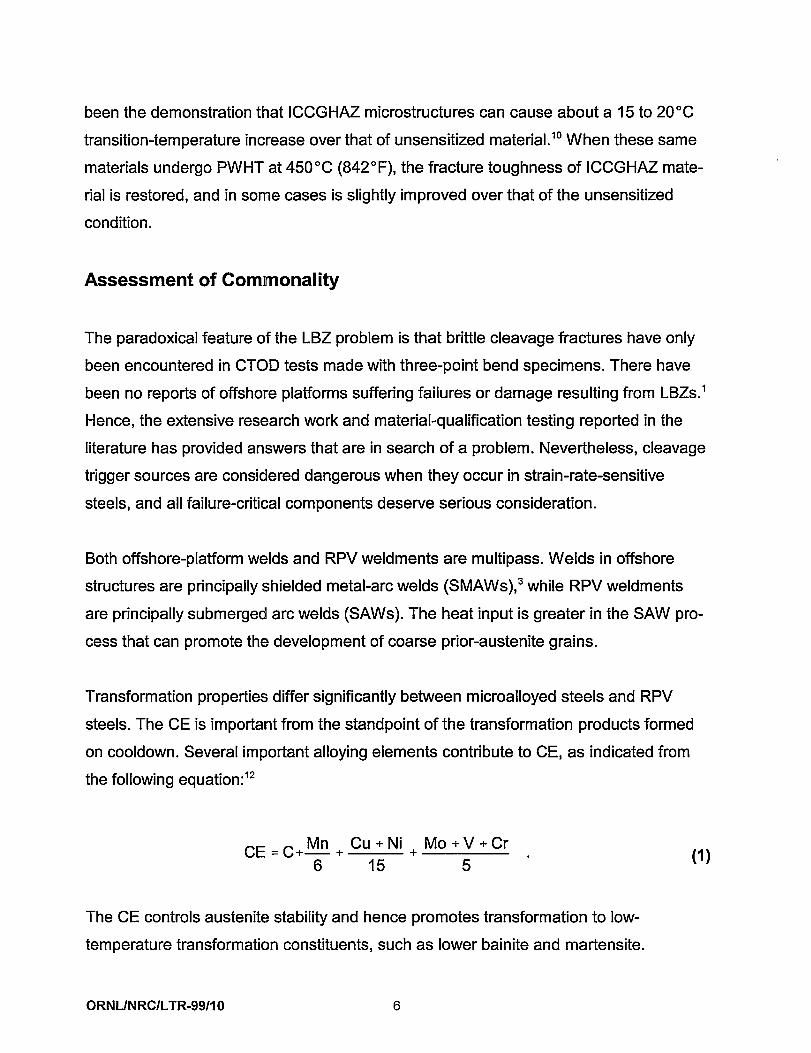
The thermal history and consequent morphology of HAZ welds are extremely complex.
Each individual weld pass produces a four-zone microstructural gradient depicted in
Fig 1. The coarse-grain HAZ (CGHAZ), schematic (D)j immediately adjacent to the
3 oRNuNRc/LTR-99/lo

fusion line, consists of enlarged prior-austenite grains from the subsequent weld pass
that grow rapidly due to being at a temperature close to the melting point. Upon cooling,
the prior austenite can transform to martensite or a lower bainite/martensite mix,
depending on the carbon equivalent (CE) of the base metal. At slow cooling rates, low-
CE steels will transform to a lower-toughness microstructure, pearlite and/or upper
bainite. With low CE, the cooling rate must be quite rapid to form mattensite and lower
bainite. Lower bainite and/or mattensitic steel is more brittle as cooled, but these micro-
structure are converted to high-toughness steel after PWHT. The second zone, fine-
grain HAZ (FGHAZ), schematic (C), from the fusion line in Fig. 1, is fine-grain prior aus-
tenite resulting from slower austenitic grain growth at lower temperatures. The third
zone, intercritical, coarse-grain HAZ (ICCGHAZ), schematic (B), is material heated into
the A& and AC, (intercritical) transformation zone. A mixture of ferrite and austenite has
precipitated along prior-austenite grain boundaries, which embrittles the material in this
local region upon cooling to room temperature.9’10 These small volumes of material,
ICCGHAZ, have been identified as the LBZ trigger-point locations. It is understood that
LBZ material is created by the reheating of coarse-grain prior austenite from the sub-
sequent weld passes that are adjacent to the fusion line. It therefore follows that there
can be an appreciable amount of coarse-grain prior austenite along a fusion line that is
not brittle crack initiation material. The fourth zone is the subcritically reheated coarse-
grain zone of the (CGHAZ), which undergoes very little changed property.
The fundamental laboratory studies on LBZS usually produce ICCGHAZ material in bulk
using electrical-resistance heating in a weld-cycle-simulation machine such as a
Gleeble. It should be noted that some of the data sources reviewed had unintentionally
produced damaged material, giving misleading results. It has been perhaps accurately
noted that the temperature adjacent to the fusion line can approach 1590”C during a
weld pass. The assumption that prior-austenite microstructure can be developed in
simulation using such a temperature can too easily result in what is known as “burned
steel.’~ Steel can be burned when heating and holding at a temperature above 1260”C
(2300°F). Burned steel is irrecoverably-damaged steel, usable only as remelt stock.
However, data reported from destroyed steel occasionally finds its way into the litera-
ture. An interesting outcome of the fundamental studies on microalloyed steels has
oRNL/NRc/LTR-99/lo 4

ORNL 99-1286 EFG
r
ul
CGHAZ
, FGHAZ
z
A
B
c
D
Figure 1. Schematic representation of microstructure
Subcritically reheatedcoarse grain zone
(SCCGHAZ)
Intercritically reheatedcoarse grain zone
(ICCGHAZ)
Fine–grain HAZ(FGHAZ)
Coarse-grain(CGHAZ)
I!!YrAC3
AC,
IrzrAC3
AC,
k
AC3
AC,
l!+++
AC3
AC,
local to the H/V? of multipass welds.
been the demonstration that ICCGHAZ microstructure can cause about a 15 to 20°C
transition-temperature increase over that of unsensitized material.10 When these same
materials undergo PWHT at 450°C (842”F), the fracture toughness of ICCGHAZ mate-
rial is restored, and in some cases is
condition.
slightly improved over that of the unsensitized
Assessment of Commonality
The paradoxical feature of the LBZ problem is that brittle cleavage fractures have only
been encountered in CTOD tests made with three-point bend specimens. There have
been no reports of offshore platforms suffering failures or damage resulting from LBZS.l
Hence, the extensive research work and material-qualification testing reported in the
literature has provided answers that are in search of a problem. Nevertheless, cleavage
trigger sources are considered dangerous when they occur in strain-rate-sensitive
steels, and all failure-critical components deserve serious consideration.
Both offshore-platform welds and RPV weldments are multipass. Welds in offshore
structures are principally shielded metal-arc welds (SMAWS),3 while RPV weldments
are principally submerged arc welds (SAWS). The heat input is greater in the SAW pro-
cess that can promote the development of coarse prior-austenite grains.
Transformation properties differ significantly between microalloyed steels and RPV
steels. The CE is important from the standpoint of the transformation products formed
on cooldown. Several important alloying elements contribute to CE, as indicated from
the following equation:12
CE=c+Mn +Cu+Ni+Mo+V+Cr6 15 5“
The CE controls austenite stability and hence promotes transformation to low-
temperature transformation constituents, such as lower bainite and martensite.
oRNL/NRc/LTR-99/lo 6
(1)

The typical CE in low-carbon microalloyed steel is about 0.37; the typical RPV steel has
CE of about 0.62. Hence, the cooling rate after each weld pass is more critical in the
Iow-CE steels. Shielded metal-arc welding is performed in offshore structures because
of the lower heat input and consequent faster cooling rate. Increased CE generally
decreases weldability due to increased propensity for cracking. The transformation
products tend to become brittle as cooled, However, postweld tempering converts the
brittle microstructure into a steel with superior fracture-toughness properties. Temper-
ing also improves fracture toughness of microalloyed steels, but this obvious remedy
would eliminate much of the economic gain from their use in an as-welded condition.
Another important factor is service condition. Offshore platforms are expected to func-
tion at ambient temperatures down to -40”C. These low service temperatures do not
alter the basic metallurgical condition of the steel. LBZ tests have produced crack initia-
tion attest temperatures typically between -10 and -60°C. Had the CTOD testing been
performed at room temperature, this very likely would have been within the upper-shelf
temperature range for the embrittled LBZ materials and LBZ failures might not have
been encountered. Cleavage crack initiation would have been replaced with ductile
tearing. On the other hand, RPV steels operate between room temperature and 288°C
(550” F). Hence, a case has not been clearly made for the classical LBZ embrittlement
model of microalloyed steels to apply to the RPV applications where service tempera-
tures are not low. However, if end-of-life annealing were used, the service temperature
cycle could include a 168-h excursion to 482°C (900°F) for a one-time cycle. Therefore,
the concern for grain coarsening in RPV welds arises from the potential for metallurgical
degradation by temper embrittlement. Only the HAZS are at issue because RPV steel
plate and forgings usually have fine prior-austenite grains, and as a consequence, the
base plate materials are not considered to be vulnerable to temper embrittlement.
LBZ in RPV Steels
The temper-embrittlement susceptibility of grain-coarsened RPV steels was clearly
demonstrated in work at AEA-Technology, Hanvell, United Kingdom.13 Eleven labora-
tory heats of steel with typical RPV chemistry were made, and three of these with varied
7 oRNL/NRc/LTR-99/lo
-.------e-- ,,---- . . . . . . . .. ,, -.. . . . . . .. . . . .
—. .—. . .-

copper and phosphorus contents were selected for temper-embrittlement studies. The
sensitivity to embrittlement was enhanced by heat treating to obtain huge prior-
austenite grain size (about Oto 1, ASTM Standard E 112). The austenitizing tempera-
ture was 1200”C (2200”F) with a 30-min soak followed by an oil quench. All were given
PWHTat615°C (1140”F) with a 24-h soak, again followed by an oil quench. In con-
trast, coarse grains in offshore-structure LBZ studies were about 4 to 5 ASTM size. The
AEA temper-embrittlement aging was 450 ‘C (840”F) for 2000 h to be fully aged in
order to maximize the degree of embrittlement obtainable. A second aging cycle was
475°C (890°F) to simulate an end-of-life recovery anneal cycle. One other exposure
was irradiation to 12.2 mdpa damage, presumably at 288° C (550° F). Table 1 is a con-
densed representation of the AEA results. It is important to keep in mind that ATOfrom
temper embrittlement is extremely grain size dependent, and with Oto 1 grains, these
results in Table 1 do not truly represent the coarse grain situation in RPV welds.
ORNL Evaluation Followup
Five commercially produced RPV steels were selected for the Heavy-Section Steel irra-
diation (HSSI) evaluation program. Selection was based on the reported chemical
elements shown in Table 2. An objective was to include at least one material with a
Table 1. Midtransition temperatures and shifts measuredby AEA with CVN specimens
+i%--l~d-4ki-lfiChemistry variable
0.01 0.007 2000/450 –86 32 1180.01 0.017 2000/450 -55 119 1740.16 0.017 2000/450 -95 114 2090.16 0.017 a –95 –26 69
oRNL/NRc/LTR-99/lo 8

Table 2. Commercial materials selected
Content
Material Code (Wt %)
P Ni s Cu
A 302 grade B Maine Yankee 0.015 0.2 0.017 0:14A 508 class 2 Midland 0.010 0.76 0.015 0.02Modified A 302 grade B GE (Z5) 0.016 0.62 0.015 0.17Modified A 302 grade B GE (Z7) 0.007 0.53 0.014 0.16A 533 grade B HSST Plate 01 0.018 0.75 0.013 0.18
phosphorus level as high as the material used in the AEA-Technology experiment
(Table 1). High copper, by the AEA definition, is almost always present in the commer-
cial steels. The high phosphorus, on the other hand, was not easily obtained (see.
Fig. 2).14
Confirming chemical analyses and tensile properties were obtained during the course of
the present investigation, and these properties are reported along with the as-received
values in Table 3. The initially reported chemistries were not entirely reliable, as can be
.
400
350
300
250
E“5200L
100
50
0
ORNL 99-1287 EFG
I I
150— Base Metals
o 0.01 0.02 0.03 0.04 0.05 0.06 0.07 0.08 0.09
Phosphorous (wt 9’.)
Figure 2. Cumulative number of chemical samplings made on RPV basemetals vs the phosphorus content.
9 oRNL/NRc/LTR-99/lo

Table 3. Summary of chemical analyses
Composition
Material Conditiona (Wt%)
c Mn P s Si Ni Cr Mo v Nb Cu As Sn
+302 B AR 0.21 1,20 0.015 0.017 0.28 0.20 0.24 0.60 0,004 0.006 0.14 0.015 0.012AEA 0.21 1.15 0.014 0.016 0.31 0.21 0.22 0.57 0.005 0.005 0.14 0.018 0.011AS 0.22 1.12 0.014 0.015 0.31 0.18 0,21 0.56 0,005 0.003 0.15 0.17 0.010
\ 508 AR 0.20 0.63 0.010 0.015 0.19 0.76 0.37 0.60 <().()1 — 0.02 <().01 <().()1class 2 AEA 0.22 1.04 0.013 0.010 0.28 0.73 0,21 0.57 0.002 0.004 0.05 0.015 0,006
AS 0,22 0.66 0.013 0,009 0.27 0.71 0.34 0.58 0.002 0.003 0.05 0.015 0.006
fled AR 0.16 1.27 0.014 0.015 0.17 0.62 0.10 0.50 0.002 0.004 0.17 0,013 0.017A 302 B AEA 0,20 1,12 0.015 0.018 0.19 0.61 0.09 0,47 0.003 0.005 0.18 0.018 0.016
AS 0,19 1,10 0.016 0.017 0.19 0.54 0.09 0.46 0.003 0.003 0.19 0.017 0.015
/led AR 0.26 1,47 0.007 0.014 0.15 0.53 0.09 0.52 0.002 0.003 0.16 0,014 0.018A 302 B AEA 0.25 1.42 0.010 0.013 0.18 0.55 0.09 0.48 0,002 0.004 0.17 0.021 0.015
AS 0.27 1.42 0,011 0.016 0.18 0.49 0.09 0.50 0.002 0.004 0.19 0.021 0.015
\ 533 B AR 0.24 1.34 0.018 0.013 0.23 0.75 — 0.53 — — 0.18 — —AEA 0.23 1.15 0.010 0.012 0.28 0.74 0.10 0.55 0.003 0.004 0.12 0.013 0.010AS 0.22 1.49 0.010 0.012 0.27 0.65 0.10 0.55 0.003 0.004 0.20 0.020 0.015
AR= As reported; AEA = AEA + 2000 h at 450”C; AS = as-received and aged.
As-received tensile properties
Yield strength Tensile strengthMaterial
(MPa) (ksi) (MPa) (ksi)
A 302 B 538 78.1 689 100.1A 508 class 2 394 57.1 569 82.6A 533 grade B 470 68.2 620 89.9Mod A 302 B Z5 400 58.1 538 78.1Mod A 302 B Z7 472 68.5 632 91.7

seen. One material, A 302 grade B, received. in the as-normalized condition, “was not
available in the heat-treated condition desired. Consequently, the normalized micro-
structure was converted into a quenched-and-tempered product using the heat-
treatment cycles summarized in Table 4.
The cycles in Table 4 simulated the heat treatment reported on the low-phosphorus
modified A 302 grade B steel listed in Table 2. This particular modified A 302
grade B(Z7) came from a commercial reactor nozzle cutout. The end result was suitable
from a mechanical-properties standpoint, but it was later determined that the retreated
A 302 grade B quenched-and-tempered microstructure had a prior-austenite grain size
of ASTM 5, which was large in comparison to the other commercially made steels
(Table 5),
Table 4. Heat-treatment cycles
TreatmentTemperature Time
(“F) (h)Quench
Austenitize 1700 6.5 WaterAustenitize 1625 6.5 WaterTemper 1200 6.5 WaterTemper 1125 6.5 I Water
Table 5. Grain sizes of the commercially made RPVbase metal in their as-received condition
Size byAverage grain
MaterialEI12
diameter(pm)
A 302 grade Ba 5 65A 508 class 2 8 22A 533 grade B 8.5 19Mod A 302 grade B Z5 10 11Mod A 302 grade B Z7 9 16
aReprocessed from normalized to quenched and tempered.
11 oRNL/NRc/LTR-99/lo
?---- ,, ..--, ... .-. ,. -—-- ——.. ..,s .—— ._ .Z.

Program Plan
The general plan to evaluate LBZ potential in RPV welds was structured to be in three
phases, starting with the AEA-Technology large grain concept with the difference that
commercially produced RPV steels were used. All three phases are defined as follows.
Phase l—Repeat the AEA austenitization and temper-embrittlement aging protocol
(namely, temper-embrittlement cycles), using commercial steels.
1. Age 2000 h at 450”C (840” F).
2. Age 168 h at490°C (914°F).
Phase n-Use a simulated SAW cycle to develop prior-austenite grains of ASTM 4 to
5. Then apply the AEA-Technology aging protocol.
1. Age 2000 hat 450”C (840” F).
2. Age 168 h at 450”C (840”F).
Phase Ill—Expand the aging-cycle evaluations starting with the simulated weld cycle
austenitization used in Phase Il.
1. 168 h at482°C (900”F).
2. 168 hat 399°C (750”F).
3. Irradiate to 1 x 101’ n/cm2 (>1 MeV at 288°C).
4. Irradiate to 1 x 101’ n/cm2, then age 168 hat 450°C.
5. Age in air at 288°C (550”F).
Not mentioned in the above plan are the additions of baseline CVN data generated to
provide the unaged baseline information needed to quantify transition-temperature
shifts and to supplement the metallurgical evaluations. Temper-embrittlement damage
is evaluated by standard CVN specimen transition-curve shift.
oRNL/NRc/LTR-99/lo 12

1
Results
Phase l—All of the commercially produced steels that were given the AEA-Technology
austenitic cycle had microstructure ranging from tempered martensite to lower bainite.
Grain size according to ASTM Standard El 12 was generally between O and 00, mean-
ing that the typical austenite grain diameter was on the order of 360 to 500 pm (Fig. 3).
The microstructure after PWHT is represented by Fig. 4.
Transition-temperature CVN energy, E~, data were least-squares fitted to the following
hyperbolic
where
A=
B=
c=
To =
tangent equation:
E~=A+Btanh [(T-TO) /C] , (2)
(USE + LSE)/2,
(USE - LSE)/2,
width of the transition,
midtransition temperature.
Parameter TOwas selected to be the Charpy transition-curve temperature level of refer-
ence. TOis a point halfway between the lower-shelf energy (LSE) and upper-shelf
Charpy energy (USE). This point was selected because it tends to be a position that is
least affected by changes in curve shape. The LSE used in fitting data to Eq. (2) was
held constant at 2.7 J.
Table 6 lists the TOtemperatures of the five commercial RPV steels in the as-received
condition, both before and after embrittlement aging. These results can be compared
with the embrittlement from AEA-Technology austenitizing cycles and aging, Table 1.
As-received RPV steels with small grains on the order of ASTM 8 to 11 showed insig-
nificant embrittlement. The A 302 grade B exception was caused by larger grains, on
the order of 5.
13 oRNL/NRc/LTR-99/lo

ORNL 99-1288 EFG
Figure 3.
Figure 4.
96-1250-01 “Q” & 513#m2’% NM
Example of the as oil-quenched microstructure after theAEA-Technology austenitization and quench cycle, A 533 grade B,100%.
ORNL 99-1289 EFG
Example of the typical microstructure after the AEA-Technologyaustenitization and PWHT, A 533 grade B, 10OX.
oRNuNRc/LTR-99/lo 14

Table 6. Revisit of AEA cycles used on five commercially made RPV steels;Phase I transition temperatures, TO(“C)
ConditionAging Agingtime temperature A 302 B A 533 B $a:;(h) (“c)
As received Initial — o 20 0As received 2000 450 64 38 10AEA austenitizea and PWHT~ Initial — 10 –67 4AEA austenitizea and PWHTb 2000 450 45 78 41AEA austenitizea and PWHTb 168 490 44 65 16
Modified A 302 B
High Lowphosphorous phosphorous
-9 –9-4 10
–23 –7334 4216 –3
’30 min at 1200°C; oil quench.b24 h at 615”C; oil quench.

Focusing on the AEA austenization cycle data for 2000 h age at 450”C, it appears that
steels with the best initial fracture toughness (lowest TOtemperatures) tend to have the
greatest transition-temperature shift. Figure 5 illustrates this point. If the AEA-
Technology data from Table 1 are included, the extent to which copper and phosphorus
seemed to control ATOappears to be second-order when the results are viewed within
the effect shown in Fig. 5.
The simulation of aging for 168 h at 490”C was almost as effective as the 2000 h at
450°C in some cases. This indicates that the aging rate is asymptotic. However, this
should not be regarded as a firm observation because ATOrate was not the subject of
this work.
ORNL 99-1290 EFG
250 [ I I I I
200
150
IJ”4
100
50
●
☞❞
Effect of Initial To (“C) on ATOShift2000 h at 450”C Age
O A 302 Grade B❑ A 508 Cl–2
O A 533 Grade BA Mod A 302 B High Phosphorous
V Mod A 302 B Low Phosphorous
+ AEA Low Phosphorous, Low Copper■ AEA High Phosphorous, Low Copper. AEA High Phosphorous, High Copper
.-
.01 I I I I
–100 –50 o 50 100 150
Initial To (“C)
Figure 5. Relationship between initial TOtemperature and ATOafter 2000-haging at 450”C.
oRNL/NRc/LTR-99/l o 16

In summary, the results from the Phase I repeat of the AEA-Technology experiments
using commercially made steels in most cases did not quite measure up to the AT dam-
age level of the AEA-Technology experiments. The conversion to large prior-austenite
grains by the AEA-Technology austenitizing treatment by itself did not always cause
significant change in fracture toughness from the as-received fracture toughness. For
example, comparing rows 1 and 3 in Table 6, there were small increases in TOfor two
materials, while the other three changes in TOwere negative, with two of these being
substantial. The ATOshift from the subsequent temper-embrittlement aging seems to be
strongly influenced by the initial post-AEA austenitized TOvalues as shown in Fig. 5.
The grain-size dependence of ATOon prior-austenite grain size was clearly demon-
strated in four of the five materials tested and weakly demonstrated in the fifth. How-
ever, the grain sizes that resulted from the AEA austenitizing treatment are consider-
ably larger than those expected in actual ICCGHAZ regions, suggesting that these
Phase I results do not truly represent the coarse-grain situation that we wished to evalu-
ate in commercial RPV welds.
Phases II and Ill—The electrical-resistance heating and cooling equipment (Gleeble)
that is designed specifically for simulation of weld cycles was applied to austenization of
the same five materials tested in Phase 1.Because the intercritical reheating cycle,
identified as the source of LBZ behavior in low-carbon microalloyed steels, was deter-
mined to be of no relevance to RPV steels, only a single simulation cycle was needed in
the present experiment to simply create the simulated coarse prior-austenite grains in
RPV HAZS, A report15based on research funded by the NRC was used to decide upon
the most appropriate thermal cycle. Peak temperature and time were selected to
develop ASTM grain size in the range of 4 to 5. The peak temperature was limited to
1260”C (2300” F), specifically to be below the burning temperature for steels of typical
RPV chemistry. The thermal cycle used is shown in Fig. 6. Specimen blanks prepared
for the Gleeble were cylindrical rods about 76 mm long and 14.35 mm in diameter (3 by
0.564 in.). About 5 mm (0.2 in.) of material at the center of each rod was determined to
be representative of the weld cycle material. An example photomicrograph of the result-
ing microstructure appears in Fig. 7, showing a mixture of martensite and lower bainite.
17 oRNL/NRc/LTR-99/lo

Figure 6.
1350
1050
450
150
ORNL 99-1291 EFG
I I I I I I I I II
— Control Temperature
\
\
0.0 12.0 24.0 36.0 48.0 60.0
Time (s)
Gleeble-generated weld thermal cycle to develop ASTM 4.5 grain size.
ORNL 99-1292
98-1734-01 MOD AWX? 8 #2 356 -! me Jl%lfiufml
Figure 7. Photomicrograph of microstructure after Gleeble austenitization,high-phosphorus modified A 302 grade B, nital etch, IOOX.
oRNL/NRc/LTR-99/lo 18

Table 7 lists the Gleeble weld simulation and aging data developed to date: Phase 11,
on lines 1, 3, and 5, and part of Phase III on lines 2 and 4. The PWHT cycle used was
identical to that used in the AEA-Technology simulation, namely, a 24-h soak time at
615°C (1140”F) followed by an oil quench. Note that the as-tempered fracture tough-
ness reflects a favorable microstructural condition that in all probability resulted from
the fast cooling of the weld cycle simulation. Aging time at 168 h represents the
expected hold time that could be used in an RPV annealing procedure. There are three
aging temperatures that represent the lowest to highest practical annealing tempera-
tures that have been under consideration. At 399 ‘C, there appears to be no evidence
of temper embrittlement in four materials. This could also be true for the high-
phosphorus modified A 302 grade B steel (Z5) that for a lack of sufficient material was
not included in this aging exposure. Embrittlement develops and accelerates with tem-
peratures between 450 and 482°C (842 and 900”F). Hencej these two annealing con-
ditions affect temper embrittlement damage, provided there is coarse-grain HAZ mate-
rial. However, Fig. 8 shows that none of the transition-temperature end points, after
annealing for 168 h, exceeded room temperature. After 2000 h at 450°C, only two of
the five materials had TOtemperatures that exceeded room temperature.
Table 7. Materials austenitized by Gleeble, PWHT, and aged commercially madeRPV steels (Phase II and first part of Phase Ii combined) -
Transition temperature, TO
Aging Aging(“C)
lWstenitizetemperature time Modified
method(“C) (h) A a02 B A 533 B C:a:; A 302 B
High Pa Low P
Gleeble Initial o –87 –67.0 –102 — –67Gleeble 399 168 — –67.1 –98.6 –89.4 –71.1
Gleeble 450 168 44 –28 -80 — -47
Gleeble 482 168 — 7.4 –72.6 47.4 –33.6
Gleeble 450 2000 43 66 -46 –14 4
‘P= phosphorous.
19 oRNL/NRc/LTR-99/l o

ORNL99-1293 EFG
I–50
–100
Figure 8.
—
339 ‘c168 h
450 ‘c168 h
mC9mu)
a
482°C168 h
450°c2000 h
Position of CVN T. temperatures after aging 168 h at 399°C, 450”C,and 482°C and 2000 h at 450°C (MA302B stands for modified A 302grade B).
oRNL/NRc/LTR-99/lo 20

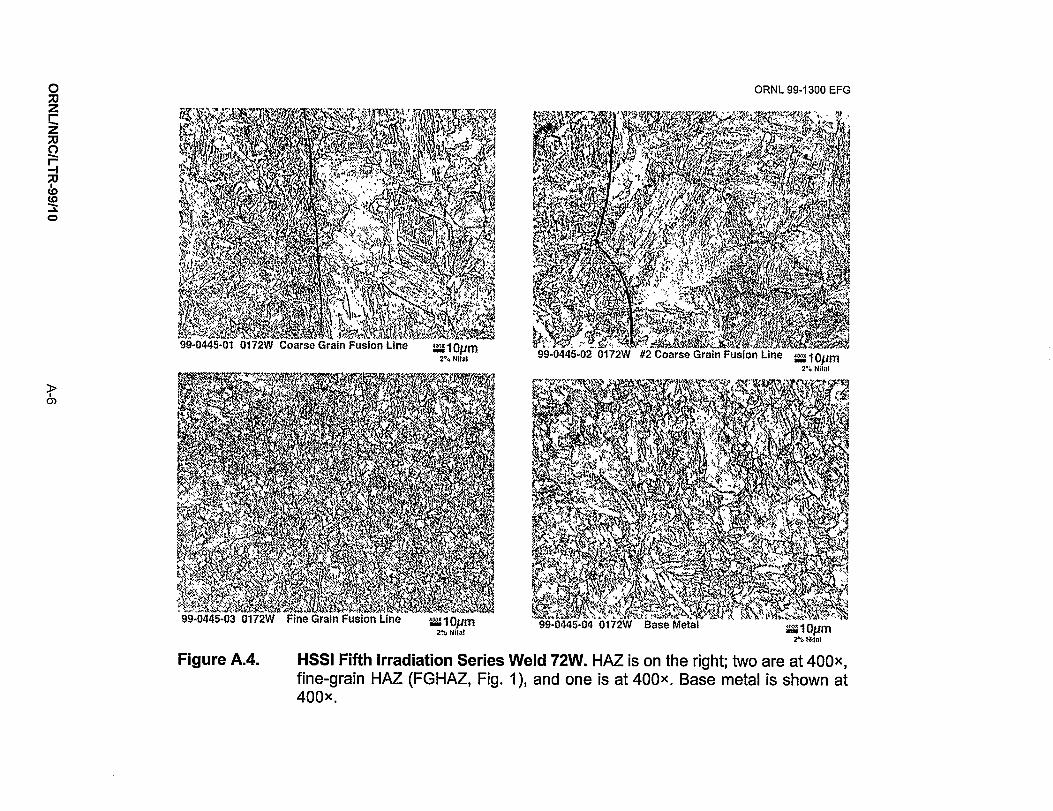
Six commercial welds were examined for maximum grain size along the fusion line
(Table 8). The results of this small sampling of actual RPV welds suggested that the
presumed coarse-grain size and uniform distribution characteristics do not always exist.
The coarse grains that could be found were much smaller than ASTM 4.5, and the per-
centage of coarse grain along all fusion lines was found. to be very low. Example photo-
micrographs taken at selected large-grain locations are shown in the Appendix.
Table 8. Largest coarse-grain sizes found in HAZSof six commercially fabricated RPV welds
Weld sourceASTM E 112
grain size
HSSI Fifth Irradiation Series, 72WHSSI Fifth Irradiation Series, 73WSNUPPS beltlineSNUPPS longitudinalMidland beltlineMidland nozzle course
6.59.07.57.5
106.5
Measurement of Element Diffusion to Grain Boundaries
Measurement of element diffusion to grain boundaries was conducted as part of a col-
laboration with AEA-Technology. The segregation of critical elements to grain bound-
aries on four selected specimens was measured by scanning transmission electron
microscopy. These results were then compared with theoretical calculations using the
McLean model as well as the Murphy and Perks model.lG Experimental results are
shown in Table 9. All specimens had been Gleeble austenitized to ASTM grain size of 4
to 5, followed byPWHTat615°C (1140”F) for 24 h. The grain-boundary analyses also
included Cu, Si, and Cq none of which were found to be involved in the segregation
process. Measurement replication was four times, and in some cases the variability was
huge. Phosphorous segregation to grain boundaries was also calculated. The McLean
21 oRNL/NRc/LTR-99/lo
—---— ——.—.—.. . ,---—.-..- .—. .-.. —— ——... — . .

- ,-”
Table 9. Measured increased contents, percent increase of selectedelements; grain boundary vs bulk contents
Material Treatments
m
Modified A 302 B Gleeble austenitized and 9 12 1 1(low phosphorous) PWHT (unaged)
Modified A 302 B Gleeble austenitized and 19 16 10 1.5(low phosphorous) PWHT (aged at 450”C,
2000 h)
Modified A 302 B Gleeble austenitized and 14 32 17 8(high phosphorous) PWHT (aged at 450”C,
2000 h)
A 533 grade B (high Gleeble austenitized and 19 15 5 10phosphorous) PWHT (aged at 450”C,
2000 h)
equation reasonably predicted segregated concentrations of all the modified A 302 B
specimens but overestimated the A 533 grade B segregation. The problem could be
that the bulk phosphorous given in Table 2 was used in the calculation, instead of the
more recent phosphorous determinations that appear in Table 3.
The same Gleeble-austenitized and 450°C aged A 533 grade B steel analyzed by AEA
was also submitted to Auger analysis at ORNL.17 In this method, a fresh fracture sur-
face is created under vacuum and analyzed. Part of the surface is intergranular, expos-
ing the grain boundaries (GBs), as shown in Fig. 9, and the other part of the sutface is
transgranular (TG) cleavage. Bulk phosphorous was determined on cleavage surfaces
and on grain boundaries after 10~ were removed by sputtering (SP) (see Fig. 10). On
average, the difference between bulk and GB phosphorous is a factor of 10. Addition-
ally, intergranular fracture vanishes at upper-shelf test temperatures as seen, for exam-
ple, in Fig. 11.
oRNL/NRc/LTR-99/lo 22

ORNL 99-1294 EFG
,,
N0.)
o23
$
Modified AWE (Made BLow IPk’wspl’lcms
2(N3X
IVlcxilifiedAXE? Grade ElHigh Phosphorus
2X)X
+n Figure 9. Intergranular fracture of A 533 grade B steel after Gleeble austenitization,&w at 450”C. Charpy lower shelf test temperature.20
PWHT, and 200-h aging

TG-3 SP Im
GB-4 SP Im
TG-5 SP Im
GB-6 SP Im
I I I I
Phosphorous Concentration (at. Y.)
o~ I-cl (d -P m m 4
TG-5
TG-3
TG
GB-1
GB-2
GB-4
GB-6
GB-7
GB-8
G B-3
GB-5
SPlm
SPlm
02r-towGcomm2

25
m
oRNL/NRc/LTR-99/lo
.—.—-- -—. — .———------.—.——cry.. —.—-... —--- ,.——- ---- -.— - ---—.

Discussion
Evaluations made from a literature search on LBZS in multipass weldments of low-
carbon microalloyed steels have revealed that the problem of LBZS, as described for
microalloyed steels, does not transfer automatically to welds in RPVS. All of the pub-
lished LBZ work addressed the problem associated with the welding of Iow-CE steels. ~
The application is offshore structures for which operating temperatures can be as low
as -40”C. Temperatures used in CTOD bend bar tests to find LBZS ranged from -10 to
-60°C, which are well below temperatures of interest to RPV operations. PWHT can
substantially alleviate LBZ effects in welds of microalloyed steels,4 but such a procedure
is avoided if possible in offshore structures because of the difficulty and financial
penalty to do so. All RPVS, on the other hand, are given PWHT. However, RPVS poten-
tially could develop a brittle-zone problem because of a completely different embrittle-
ment mechanism; namely, the susceptibility of RPV steels with enlarged prior-austenite
grains to temper embrittlement.
Experiments at AEA-Technology have clearly demonstrated that steels with the typical
RPV chemistry can be made to be highly sensitive to temper embrittlement provided the
prior-austenite grain size is enlarged to more than 360 ~m in diameter. The SAW pro-
cess used in RPV fabrication is a high-heat-input welding procedure, and grains of
substantial enlargement would seem quite likely; more so than in offshore SMAW weld-
ments. Hence, there was a need to pursue more information on temper embrittlement.
The scope of interest was the temper-embrittlement properties of commercially made
RPV steels and the influence of grain-size and thermal-cycle effects.
The objective of Phase I was to confirm the AEA-Technology findings, except in this
case commercially made steels were used. This work clearly showed that the temper
embrittlement seen with the AEA-Technology laboratory-made steels did in fact apply to
the five selected commercially made steels. However, the ATOmagnitude was some-
what less. An interesting new observation was that ATOdue to embrittlement seemed to
be strongly influenced by the initial TOtemperature value. A material with extremely low
initial TOtemperature willtend to experience greater ATO.The phosphorus and copper
oRNL/NRc/LTR-99/lo 26

concentrations do not seem as significant when compared with the influence of the
initial transition temperature.
Phase II introduced an anticipated more%epresentative weld HAZ coarse grain size, as
well as the heating and cooling rates of a typical weld pass. Both are important new and
relevant variables. Most RPV steels have CE of about twice that of microalloyed steels.
Consequently, the transformation products formed with the high cooling rates of a weld
pass are favorable for the development of high fracture toughness, provided postweld
stress relief tempering is used. All of the commercial steels had exceptionally good
(low-temperature) preaged transition temperatures after simulated weld cycles. Given a
168-h anneal at 450”C, the fracture toughness was degraded, but not to an extent that
cancelled the fracture-toughness improvement from the austenitization and PWHT
cycle.
Phase Ill expanded the study to look at other aging-condition variables. The austeniti-
zation, PWHT, and grain size are the same as in Phase Il. Aging time is fixed at 168 h,
but aging temperature is varied. It appears that there can be a lower-bound aging
temperature for temper embrittlement. At 399°C (750”F) there was no detectable
temper embrittlement effect in any of the steels. At 450 and 482°C (842 and 900”F),
significant transition-temperature shifts could be seen. However, there were no
postembrittlement(168 h) TOtemperatures observed above room temperature.
The work in progress in Phase Ill will address the effects of irradiation and postirradi-
ation annealing. The final issue to be determined is whether an RPV steel with demon-
strated temper-embrittlement insensitivity at temperatures below 400”C can suffer
embrittlement at 288°C when the thermal exposure is combined with neutron irradiation
or when irradiation is followed by postirradiation heat treatments at 454°C for 168 h,
intended to recover fracture toughness.
It is important to point out that the TOtemperature used here serves only as a basis for
embrittlement damage assessment. Engineering design-related temperatures can only
be obtained using fracture-mechanics test methods supplemented with the technology
27 oRNuNRc/LTR-99/lo

of the Master Curve. A reference temperature, TIOO,has been determined that
corresponds to a median fracture toughness of 100 MPa @. Whenever sufficient
material was left over after CVN specimens were taken, fracture-mechanics specimens
(1/2T compacts) were made, and TIOOtemperatures determined. These results are
compared to CVN TOtemperatures in Table 10, columns 3 and 6. The difference is
nominally 90”C. A crude correlation that is known to exist between Charpy transition
curves and TIOOdid not work well with these temper-embrittled steels. Columns 5 and 6
would have been reasonably close if the expected relationship had existed.
Table 10. Comparison of Charpy V TOand fracture-mechanics-basedTIOOtemperatures
Material
A 302 B
A 508
A 533 B
Mod A 302 B
Agingtreatment
(h/”c)
2000/450
168/490
2000/450
168/490
2000/450
168/490
2000/450 + 168/490
As received
CVNtemperatures
‘(
TO’
45
44
41
16
78
65
66
9
‘c)
14.2
18.0
–30–24
482.0
46
–70
Fracture mechanics TIOO(“c)
T*B~–18
-4
0
-48
-42
30–16
28
–88
TIOOC
–30–38
–84–36
549-21
–88
Erro#
26
38
36
–6
25
33
49
0~emperature at 50% between CVN lower shelf and upper shelf.
“Temperature at 28-J CVN energy level.
Cln several cases only four replicate tests were made. Standard deviation on ~ uncertainty is about 20% greater than results
obtained with six replicate tests.
%lifference between CVN prediction of Tim, namely (T** - 18“C) and the actual value by fracture-mechani~ tests.
oRNuNRc/LTR-99/lo 28
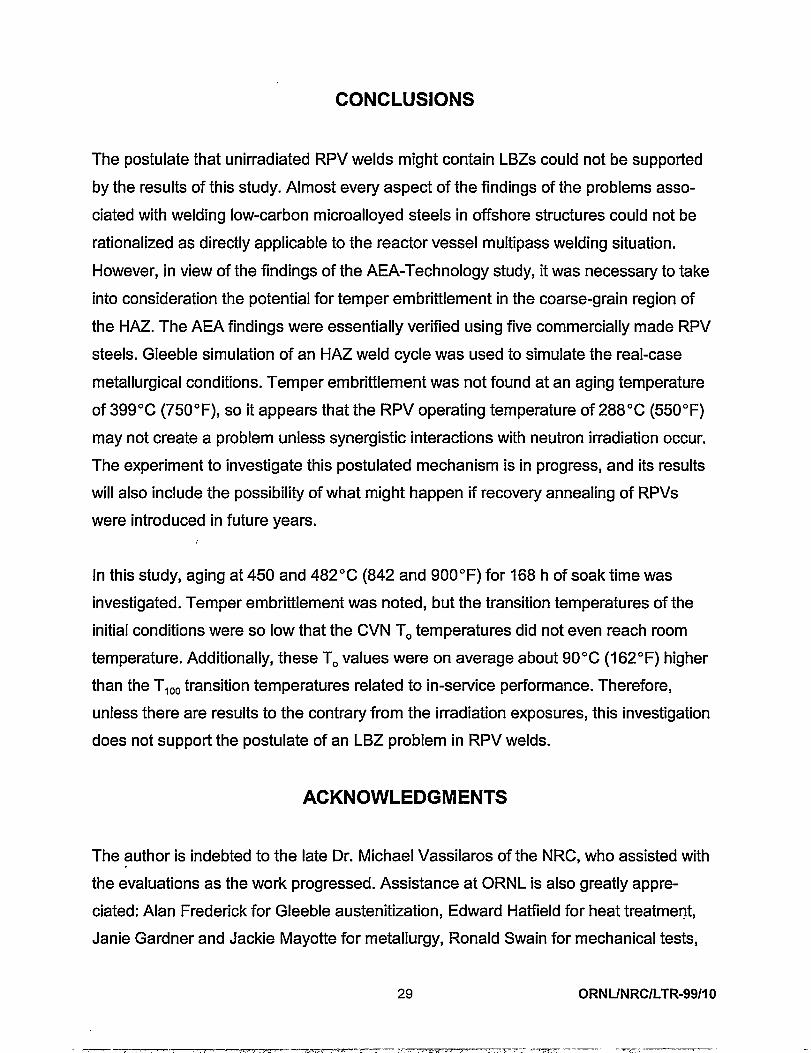
CONCLUSIONS
The postulate that unirradiated RPV welds might contain LBZS could not be supported
by the results of this study. Almost every aspect of the findings of the problems asso-
ciated with welding low-carbon microalloyed steels in offshore structures could not be
rationalized as directly applicable to the reactor vessel multipass welding situation.
However, in view of the findings of the AEA-Technology study, it was necessary to take
into consideration the potential for temper embrittlement in the coarse-grain region of
the HAZ. The AEA findings were essentially verified using five commercially made RPV
steels. Gleeble simulation of an HAZ weld cycle was used to simulate the real-case
metallurgical conditions. Temper embrittlement was not found at an aging temperature
of 399°C (750”F), so it appears that the RPV operating temperature of 288°C (550°F)
may not create a problem unless synergistic interactions with neutron irradiation occur.
The experiment to investigate this postulated mechanism is in progress, and its results
will also include the possibility of what might happen if recovery annealing of RPVS
were introduced in future years.
In this study, aging at 450 and 482°C (842 and 900°F) for 168 h of soak time was
investigated. Temper embrittlement was noted, but the transition temperatures of the
initial conditions were so low that the CVN TOtemperatures did not even reach room
temperature. Additionally, these TOvalues were on average about 90”C (162°F) higher
than the TIOOtransition temperatures related to in-service performance. Therefore,
unless there are results to the contrary from the irradiation exposures, this investigation
does not support the postulate of an LBZ problem in RPV welds.
ACKNOWLEDGMENTS
The author is indebted to the late Dr. Michael Vassilaros of the NRC, who assisted with
the evaluations as the work progressed. Assistance at ORNL is also greatly appre-
ciated: Alan Frederick for Gleeble austenitization, Edward Hatield for heat treatment,
Janie Gardner and Jackie Mayotte for metallurgy, Ronald Swain for mechanical tests,
29 oRNL/NRc/LTR-99/l o
-— —-, ..... . . ., ,. --- .Zm ——- —-?77, -

James King for welding technology guidance, Lee Heatherly for auger analysis, and
Julia Bishop for preparation of the report.
REFERENCES
1.
2.
3.
4.
5.
6.
7.
8.
D. P. Fairchild, “Fracture Toughness Testing of Weld Heat Affected Zones in
Structural Steel,” pp. 117–141 in Fatigue and Fracture Testing of We/drnenfs,
ASTM ST’ 1058, H. 1.McHenry and J. M. Potter, Eds., American Society for
Testing and Materials, Philadelphia, 1990.
C. Thaulow, O. M. Kselsen, M. Houge, B. Melve, A. J. Paauw, G. Rorvik,
J. K. Solberg, and J. Troset, “Fracture Mechanics Testing of HSLA Steels for
Offshore Applications,” pp. 195-204 in Proceedings of ASM Conference on
Micros//oyed Sfee/s, Vol. 8811-003, World Materials Congress, Chicago, 1988.
C. Thaulow, A. J. Paauw, and G. Rorvik, “Fracture Mechanics Testing of Weld
Metal for Low-Carbon Microalloyed Steels,” pp. 277–301 in TMS Symposium on
We/ding Mefa//urgy, Denver, February 1987.
C. Thaulow, A. J. Paauw, and K. Guttormsen, “The Heat-Affected Zone
Toughness of Low-Carbon Microalloyed Steels,” The We/ding Journa/, 9,
266-s–279-s (September 1987).
The British Standards Institution, “Methods for Crack Opening Displacement
(COD) Testing,” BS 5762,1979.
“API Specification for Production Qualification for Steel Plates for Offshore
Structures,” API RP2Z, American Petroleum Institute, Dallas, March 1987.
“Steel Specification for Fixed Offshore Structures,” EEMUA Publication No. 150,
Engineering Equipment and Materials Users Associationj London, 1987.
A. J. R. Loureiro and A. A. Fernandes, “Toughness of CGHAZS of Welds in Q
and T Steels,” The Welding Journal Supplement, 9, 225-s–232-s
(September 1994).
oRNL/NRc/LTR-99/lo 30

9,
10,
11.
12,
13.
14.
15.
16.
17.
A. M. Barnes, The Effect of Intercritical Thermal Cycles on HAZ Microstructure
and Toughness in C-Mn-A/-Nb Steel, Report 402/1989, The Welding Institute,
August 1989.
K. Arimochi, “CTOD Behavior of Steel Weld with 500 MPa Class Strength and
HAZ-CTOD Characteristics of Newly Developed Low Al-B-N Steel,” Transactions
of the Japan We/ding Society, 20(2), 1989.
C, Thaulow and A. J. Paaw, “Materials Characterization with Respect to HAZ
Local Brittle Zones,” pp. 24-1 to 24-14 in WELDTECH 88, London, November
1988.
A. Barnes, “Local Brittle Zones in C-Mn Steel Multipass Welds,” The Welding
/nstitute f3u//etin, September/October 1990.
R. J, McElroy, A, J. E. Foreman, G. Gage, W. J. Phythian, P. H. N. Ray, and
1.A. Vatter, “Optimization of Reactor Pressure Vessel Surveillance Programmed
and Their Analysis,” contribution to IAEA CRP 3 Research Program,
AEA-RS-2426, December 1993.
J. A. Wang, Embritt/ement Data Base, Version f, USNRC Report, NUREG/
CR-5506 (ORNL/TM-13327), August 1999.
C. D. Lundin and S. Mohammed, E17ect of Welding Conditions on Transformation
and Properties of Heat-AiTected Zones in LWR Vessel Steels, USNRC Report
NUREG/CR-3873 (ORNL/SUB/78-7637/l ), November 1990.
S. R. Ortner, J. ‘A. Mace, J. Hyde, and C. A. English, “Grain Boundary Analysis in
RPV Steels After HAZ-Simulating Treatment and Aging,” AEAT-5292, March
1999.
D. E. McCabe and R. K. Nanstad, “Evaluation of the Potential of RPV Steels
HAZ for Temper Embrittlement,” Proceedings of /GRDM Meetings, Nashvi//e,
Tennessee, January 18-22, 1999.
31 oRNuNRc/LTR-99/l o

oRNL/NRc/LTR-99/lo 32

.
APPENDIX
Examples of HAZ Coarse Grains Along Fusion Line, Fine Prior-Austenite GrainZones, and Base Metal Grains from Three Selected Commercial Welds
A-1 oRNL/NRc/LTR-99/l o
. . -. —. ——-—..-—-------- —-—. . . .,, --- —v?—— —.— —.

oRNL/NRc/LTR-99tlo A-2

A-3 oRNL/NRc/LTR-99/l o
.. . .— .—— — —.-. . .

0c0.“
%
m.-L
w
oRNL/NRc/LTR-99/lo A-4

-iiitn.-alc0. .Em.-&
s0(n.-
A-5 oRNuNRc/LTR-99/lo
...n------ ,... .. . ,-—-.m,v-—— -r—-———————
2% Nlh
ORNL 99-1300 EFG
2“6 Nihl
2%I-W*I
Figure A.4. HSSI Fifth Irradiation Series Weld 72W. HAZ is on the right; two are at 400x,fine-grain HAZ (FGHAZ, Fig. 1), and one is at 400x. Base metal is shown at400X.

II
ORNL 99-1301 EFG
‘2% NiIIl ‘M 1Opm2*i Nilal
99-0441-03 SC23C Long. Base Metal %’l(YpmW NM
99.0441.04 SC23C Long, Fine Grain g 1Opm% Nitol
Figure A.5. SNUPPS longitudinal weld. HAZ is on the right; one is at 400x, tine-grain HAZ(FGHAZ, Fig. 1); one is at 400x, Base metal is shown at 400x.

D&
99-0442-03 CTS9 Base MetaI
24. Niiol
ORNL 99-1302 EFG
99-0442-02 CTS9 Fine Grain S 1Opm2ss NM
2% Nlial
Figure A.6. SNUPPS beltline weld. HAZ is on the right; two are at 200x, and one is at lOOX.

oRNL/NRc/LTR-99/l o
INTERNAL DISTRIBUTION
34.
35-36.
37.
38-45,
... . ...7
1.2.
3.4.5.6.7.8.9.
10.11.12.
B. R. BassE. E. BloomJ. W. BrysonR. D. ChevertonS. A. DavidT. L. DicksonA. FrederickH. W. Hayden, Jr.S. K. IskanderJ. F. KingW. KoncinskiW. J. McAfee
13–18.19.
20–22.23.
24-26.27.28.29.30.31,32.33.
D. E. McCabeJ. G. MerkleR. K. NanstadC. E. PughT. M. RosseelV. K. SikkaM. A. SokolovR. E. StonerR. L. SwainCentral Research LibraryORNL Laboratory RecordsORNL Laboratory Records
EXTERNAL DISTRIBUTION
ABB–COMBUSTION ENGINEERING, P.O. Box 500, Department 9632–1922,2000 Day Hill Road, Windsor, CT 06095
D. Ayers
AEA TECHNOLOGY, 220 Harwell, Thermal Reactor Services, Didcot,Oxfordshire, OXII, ORA, United Kingdom
C. A. English
ATI Consulting, Suite 160,3860 Blackhawk Rd., Danville, CA 94506
W. L. Server
U.S. NUCLEAR REGULATORY COMMISSION, Office of Nuclear RegulatoryResearch, MS TI O-El O, Washington, DC 20555
J. W. CraigC. J. Fairbanks (2)E. M. HackettA. L. HiserM. T. KirkS. N. M. MalikM. E. Mayfield
.——— ..-. --,--- - .->..=.——,— ., -., --’--T . . ..-= .,, ——. — _,— — -

4648. WESTINGHOUSE ELECTRIC CORP., P.O. Box 355, Pittsburgh, PA 15320
W. H. BamfordC. KimR. Lott